
- Academic Editor
†These authors contributed equally.
Bladder outlet obstruction (BOO) frequently accompanies benign prostate hyperplasia (BPH) in aging males and often leads to bladder fibrosis, a secondary pathological change that contributes to bladder dysfunction. The role of Cathepsin S (CTSS), a cysteine protease associated with immune responses, in this process remains to be fully elucidated.
Bladder tissues from BOO model mice were analyzed using microarray profiling, followed by Gene Ontology (GO) and pathway enrichment analyses. Candidate genes, including CTSS, C-X-C Motif Chemokine Ligand 17 (CXCL17), and Angiopoietin Like 7 (ANGPTL7), were identified. CTSS was selected for further investigation based on its association with fibrotic processes. The functional role of CTSS in smooth muscle cell hypertrophy and fibrosis was verified both in vivo and in vitro. A co-culture system of smooth muscle cells and monocyte–macrophages was used to explore the underlying mechanism.
Microarray and bioinformatic analysis identified CTSS as a key candidate gene associated with immune response in BOO-induced bladder fibrosis. CTSS expression was upregulated in BOO bladders and was demonstrated to promote smooth muscle cell hypertrophy and fibrotic changes. Mechanistically, CTSS mediated proteolytic cleavage of the interleukin-6 receptor (IL-6R) on immune cells, generating soluble IL-6R (sIL-6R). This process facilitated IL-6 trans-signaling, which in turn promoted smooth muscle cell hypertrophy and exacerbated bladder fibrosis.
These findings indicate that CTSS contributes to BOO-induced bladder dysfunction and fibrosis by activating IL-6 trans-signaling through cleavage of IL-6R. CTSS may represent a potential therapeutic target for mitigating bladder fibrosis in BPH.
Bladder outlet obstruction (BOO) is a clinically urological problem that is secondary to benign prostate hyperplasia (BPH) in aging males. Persistent BOO may cause the progression of lower urinary tract symptoms (LUTS), which can severely interfere with the quality of life [1, 2]. During the development of BOO, bladder smooth muscle undergoes hypertrophy in response to increased urethral resistance, which ultimately progresses to bladder remodeling and fibrosis at the decompensation stage [3]. Decompensated bladder tissue fibrosis represents a critical pathological process and occurs in the majority of BOO patients.
The progression of fibrosis is characterized by excessive deposition of
extracellular matrix (ECM) and bladder smooth muscle cell (BSMC) hyperplasia,
leading to BSMC dysfunction and decreased bladder compliance [4]. As demonstrated
in a previous study, inflammation and transforming growth factor-beta
(TGF
Cathepsin S (CTSS), a lysosomal protease and a member of the cysteine proteases,
is present in the cytoplasm of antigen-presenting cells, B cells, and
monocyte–macrophages. It participates in a variety of pathological processes
such as cancers, arthritis, osteoporosis, cardiovascular disease, and chronic
obstructive pulmonary disease [7]. A recent study has shown that CTSS
overexpression accelerated extracellular matrix remodeling and pulmonary fibrosis
[8]. In addition, CTSS increased the deposition of ECM and activated the
TGF
In this study, we investigated the pathological changes associated with bladder remodeling following BOO and analyzed differential gene expression throughout this process. CTSS exhibited the most significant change in all models and was therefore selected for further investigation. Inhibition of CTSS ameliorated BOO-induced bladder dysfunction and fibrosis. Furthermore, the mechanism of the selected gene, CTSS, in bladder fibrosis was also studied.
All procedures involving animals in this study complied with the NIH Guide for the Care and Use of Laboratory Animals and were approved by the Animal Care and Use Committee of Tianjin Medical University (approval No. IRB2024-DWFL-173). Male C57BL/6J mice, weighing between 22 and 24 g, were obtained from Vital River Laboratory Animal Technology Co., Ltd (Beijing, China). and maintained in the animal facility of Tianjin Medical University General Hospital at 22–25 ℃ temperature and 50% relative humidity under a 12 h light/dark cycle. All animals had access to food and water.
The mice were subjected to microsurgical creation of BOO under anesthesia using isoflurane essentially as described [10]. Briefly, mice were anesthetized with 1.5% isoflurane and placed in a supine position with a 1–2 cm incision to expose the urethrovesical junction. A 0.5-mm inner diameter polyethylene tube was placed around the bladder neck, and a 3-0 polypropylene suture was used to tie gently around the bladder neck and then draw out the catheter. Then the incision was closed and disinfected. Mice were anesthetized with 1.5% isoflurane and euthanized via cervical dislocation at day 21 post-operation. Some parts of the bladder tissues were collected immediately for histology or immunochemistry, and the remaining tissues were snap-frozen in liquid nitrogen for performing microarray, qPCR, or western blotting.
In vivo siRNA transfection was performed using Lipofectamine-3000 (Thermo Fisher Scientific, Waltham, MA, USA). Both siRNA-CTSS (0.5 nmol, RiboBio, Guangzhou, China) and siRNA-control (0.5 nmol, RiboBio) were complexed with an equal volume of Lipofectamine-3000 prior to delivery. The mixed solutions were injected through the tail vein daily. The BOO model was administered immediately post-transfection.
Mice smooth muscle cell line (mBSMC) and macrophage cell line (RAW264.7) were
purchased from Yipu Biotechnology (Wuhan, China) and cultured in DMEM-basic
medium (Gibco, Waltham, MA, USA) with 10% FBS and 1% penicillin/streptomycin
(Thermo Fisher Scientific). The interaction between mBSMC and RAW264.7 was
detected by a Transwell system (Corning Corporation, Corning, NY, USA). mBSMC
were inoculated into the lower chamber, while RAW264.7 cell was cultivated in the
upper chamber of the Transwell system. The cells were maintained in a culture
chamber (Thermo Fisher Scientific) at 37 ℃ with 5% CO2. We incubated the
cells with 10 ng/mL TGF
The mice were placed in individual metabolic cages for 1 h with an underlying Whatman filter paper, and food and water were obtained ad libitum. The filter paper sheets were then imaged using UV light. The number and pattern of voids were noted, and the area of each voiding stain was measured using Image J (v1.8.0, NIH, Bethesda, MD, USA). The volume of urine was onverted from the stain area by using a standard curve. Sporadic noncircular small-diameter urine spots were excluded.
Total RNA was extracted from the samples using standard extraction methods. Total RNA (with the addition of PolyA control), cDNA first-strand and second-strand were synthesized, and cRNA was synthesized by in vitro transcription. After purification and quantification of cRNA, cRNA was diluted to 625 ng/µL for subsequent experiments. After purification of the synthesized 2nd-cycle single-stranded cDNA, 5.5 µg of sscDNA was diluted to 31.2 µL with enzyme-free water for subsequent fragmentation and labeling. The fragmented and labeled samples are added to the corresponding microarrays and placed into the GeneChip Hybridization Oven 645 (Affymetrix, Santa Clara, CA, USA) for hybridization at a specific temperature and speed; after reaching the specified time, the microarrays were eluted using the GeneChip Fluidics Station 450 (Affymetrix, Santa Clara, CA, USA) according to the corresponding protocol. After completion, the GeneChip 3000 7G scanner (Affymetrix, Santa Clara, CA, USA) was used for scanning. The scanner captures the fluorescence signal and converts the signal by GCOS software to obtain the signal value of each probe and generate a CEL file. False Discovery Rate (FDR) correction for high-throughput gene data.
The bladder tissues were submerged overnight in 4% paraformaldehyde and then embedded in paraffin, and 5 µm sections were sliced. Masson’s trichrome staining method was used to evaluate the extent of bladder tissue fibrosis. For immunohistochemical (IHC) staining, bladder sections were blocked with 0.3% Triton X-100 (Solarbio, Beijing, China) and 3% albumin bovine V (biotopped, Beijing, China) and incubated overnight with antibodies as follows: Anti-alpha smooth muscle Actin 2 (ACTA2) (ab5694, Abcam, Cambridge, UK), Collegen-I (Col-I) (ab270993, Abcam), Col-III (22734-1-AP, Proteintech, Chicago, IL, USA). Following incubation with a secondary antibody, 3,3-diaminobenzidine (Gene Tech) was used as a substrate, and re-staining was performed with hematoxylin (Solarbio). These slices were observed and imaged using a DM500 light microscope (Leica, Wetzlar, Germany). The results of immunochemistry were measured by using the Image J software (v1.8.0, NIH). A total of 5 randomly selected fields were captured and analyzed. For immunofluorescence (IF) staining, the cell creep was placed in a cell culture dish and cleaned 3 times using PBS. After cleaning, the cells were fixed at room temperature with 4% paraformaldehyde for 20 minutes and then rinsed with PBS 3 times. Subsequently, slides were treated with 5% BSA for 30 minutes at room temperature to block nonspecific staining. Slides were incubated with different primary antibodies (Abcam) overnight at 4 °C. On the second day, slides were cleaned with PBS 3 times and incubated with the corresponding secondary antibody (Abcam) for 1 hour at room temperature. Finally, the slides were washed with PBS 3 times, and the slides were sealed. The nuclei were counterstained with DAPI. The slides were used to observe and quantify with a DMILLED immunofluorescence microscope (Leica). The fluorescent intensity was determined using Image J (v1.8.0, NIH). A total of 5 randomly selected fields were captured and analyzed.
The bladder tissues were placed in Radio Immunoprecipitation Assay (RIPA) Lysis buffer, which was sonicated for 10 minutes and then centrifuged at 13,000 rpm for 15 minutes at 4 °C. Protein concentration was determined by the kit (Solarbio). Equal amounts of proteins were separated on the gel by sodium dodecyl sulfate - polyacrylamide gel electrophoresis and then transferred to Polyvinylidene Fluoride membranes. The membranes were then blocked in 5% skim milk and reacted overnight at 4 °C with different primary antibodies: IL-6 (AMC0864, Invitrogen, Carlsbad, CA, USA), interleukin-6 receptor (IL-6R) (ab83053, Abcam), CTSS (ab232740, Abcam), ACTA2 (ab5694, Abcam), Actin (ab8226, Abcam), Col-I (ab270993, Abcam), Col-III (22734-1-AP, Proteintech), CXCL17 (MA5-24157, Invitrogen), Tubulin (11224-1-ap, Proteintech), Angptl7 (PA5-36575, Invitrogen). After incubation with secondary antibodies coupled to horseradish peroxidase membranes, they were observed using an enhanced chemiluminescence detection kit (Millipore Sigma, Burlington, MA, USA), and the mean pixel density of protein bands was quantified by ImageJ software (v1.8.0, NIH) and was standardized to GAPDH or tubulin.
RT-qPCR was performed to detect cytokine RNA levels in bladder tissues. Total RNA was extracted using the kit (Accurate Biology, Changsha, China). The obtained RNA samples were then reverse-transcribed into cDNA using the PrimeScript RT reagent Kit (Takara, Kusatsu, Japan). Finally, quantitative PCR was performed on an Applied Biosystems 7300 Plus using a Direct TB Green qPCR kit (Takara). Results were normalized using GAPDH gene expression and expressed as relative expression values. The primer sequences were as follows:
① CTSS:
Primer-F: 5′ TGACGAGGATGCCCTGAAAGA 3′
Primer-R: 5′ GTCCCATAGCCAACCACAAGA 3′
② CXCL17:
Primer-F: 5′ AAAAGCACCACAGGAAGTCGC 3′
Primer-R: 5′ TCTTGTAGGGTAAACAGAAGGCATAA 3′
③ Angptl7:
Primer-F: 5′ TCTACCATAACAACACCGTCTTCAGC 3′
Primer-R: 5′ GATGCCATCCATGTGCTTTCG 3′
The bladder samples were homogenized according to the manufacturer’s protocol. Inflammatory factors were detected in the bladder samples using ELISA kits for CTSS, IL-6, and soluble IL-6R (sIL-6R) (KND, Wenzhou, China). The measured OD values were converted into concentration values.
All results were expressed as mean
To identify the pathological change of mice’s bladder post-obstruction, we
established an animal model using the Leadbetter operation and obtained the
result of bladder function change in mice by observing urination behavior with
VSOP. The results showed a dramatic decrease in urination volume after the
obstruction occurred, which, in particular, started on day 7 post-obstruction
(64.018
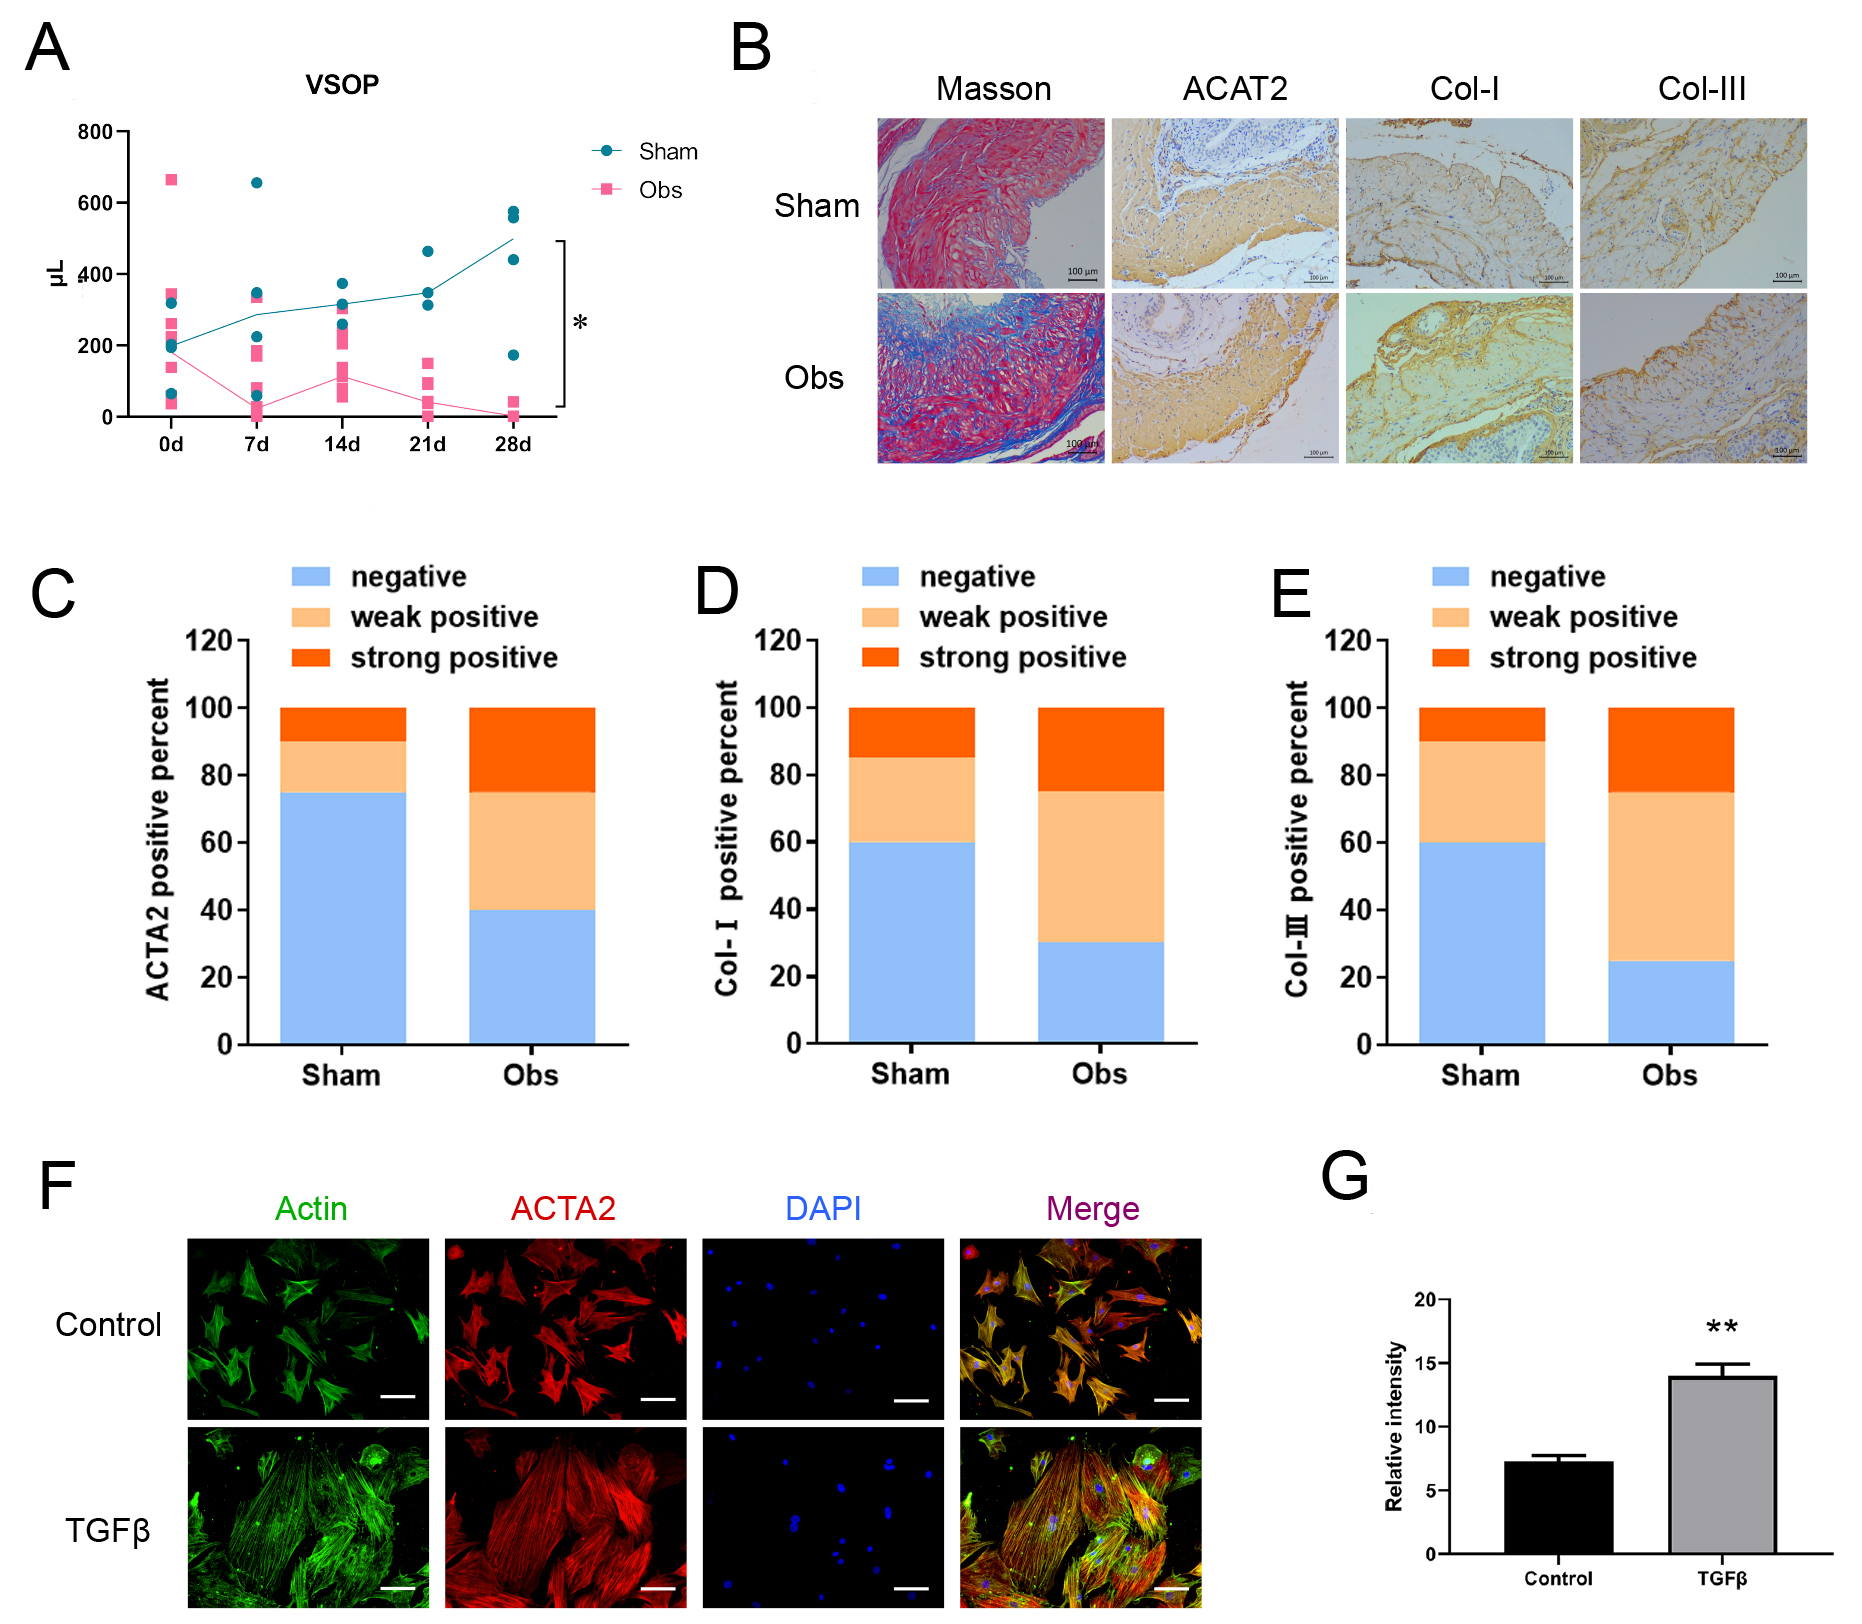 Fig. 1.
Bladder function and pathological change following BOO. (A)
Voiding behavior was assessed using VSOP. And the results showed that urine
volume decreased dramatically in the obstruction group. (B–E) Masson’s
staining showed more fibrosis, and IHC showed higher expression levels of ACTA2,
Col-I, Col-III in the obstruction group. The representative images and IHC
positivity statistics are shown. Scale bar = 100 µm. (F,G) TGF
The volcano plot displayed the distribution of differential genes, with a total
of 541 genes up-regulated and 943 genes down-regulated in the Obs group compared
to the SHAM group (Fig. 2A). The heatmap showed the differential gene clustering
analysis (Fig. 2B). Subsequent Gene Ontology (GO) enrichment analysis revealed
that the up-regulated genes were concentrated in the functions of the innate
immune response, immune system process, and cellular response to interferon-beta
(Fig. 2C). Among these differential genes, we focused on the top ten most
significantly upregulated genes in this Obs group (Fig. 2D). Combining the results
of GO analysis with literature reports, we identified CTSS, CXCL17, and ANGPTL7
as candidate genes because they are all associated with immune response. We
checked the expression level of selected proteins with qPCR, and the results
indicated that CTSS, CXCL17, and ANGPTL7 increased dramatically after obstruction
(Fig. 3A). We again examined the expression of these three candidate proteins in
bladder tissues of mice with bladder obstruction. Western blot results showed
that CTSS was most significantly upregulated compared to the control group; the
level increased approximately nine-fold (Fig. 3B,C). Consistent with these
in vivo findings, in vitro experiments demonstrated that CTSS
expression was markedly up-regulated along with ACTA2 in bladder smooth muscle
cells following TGF
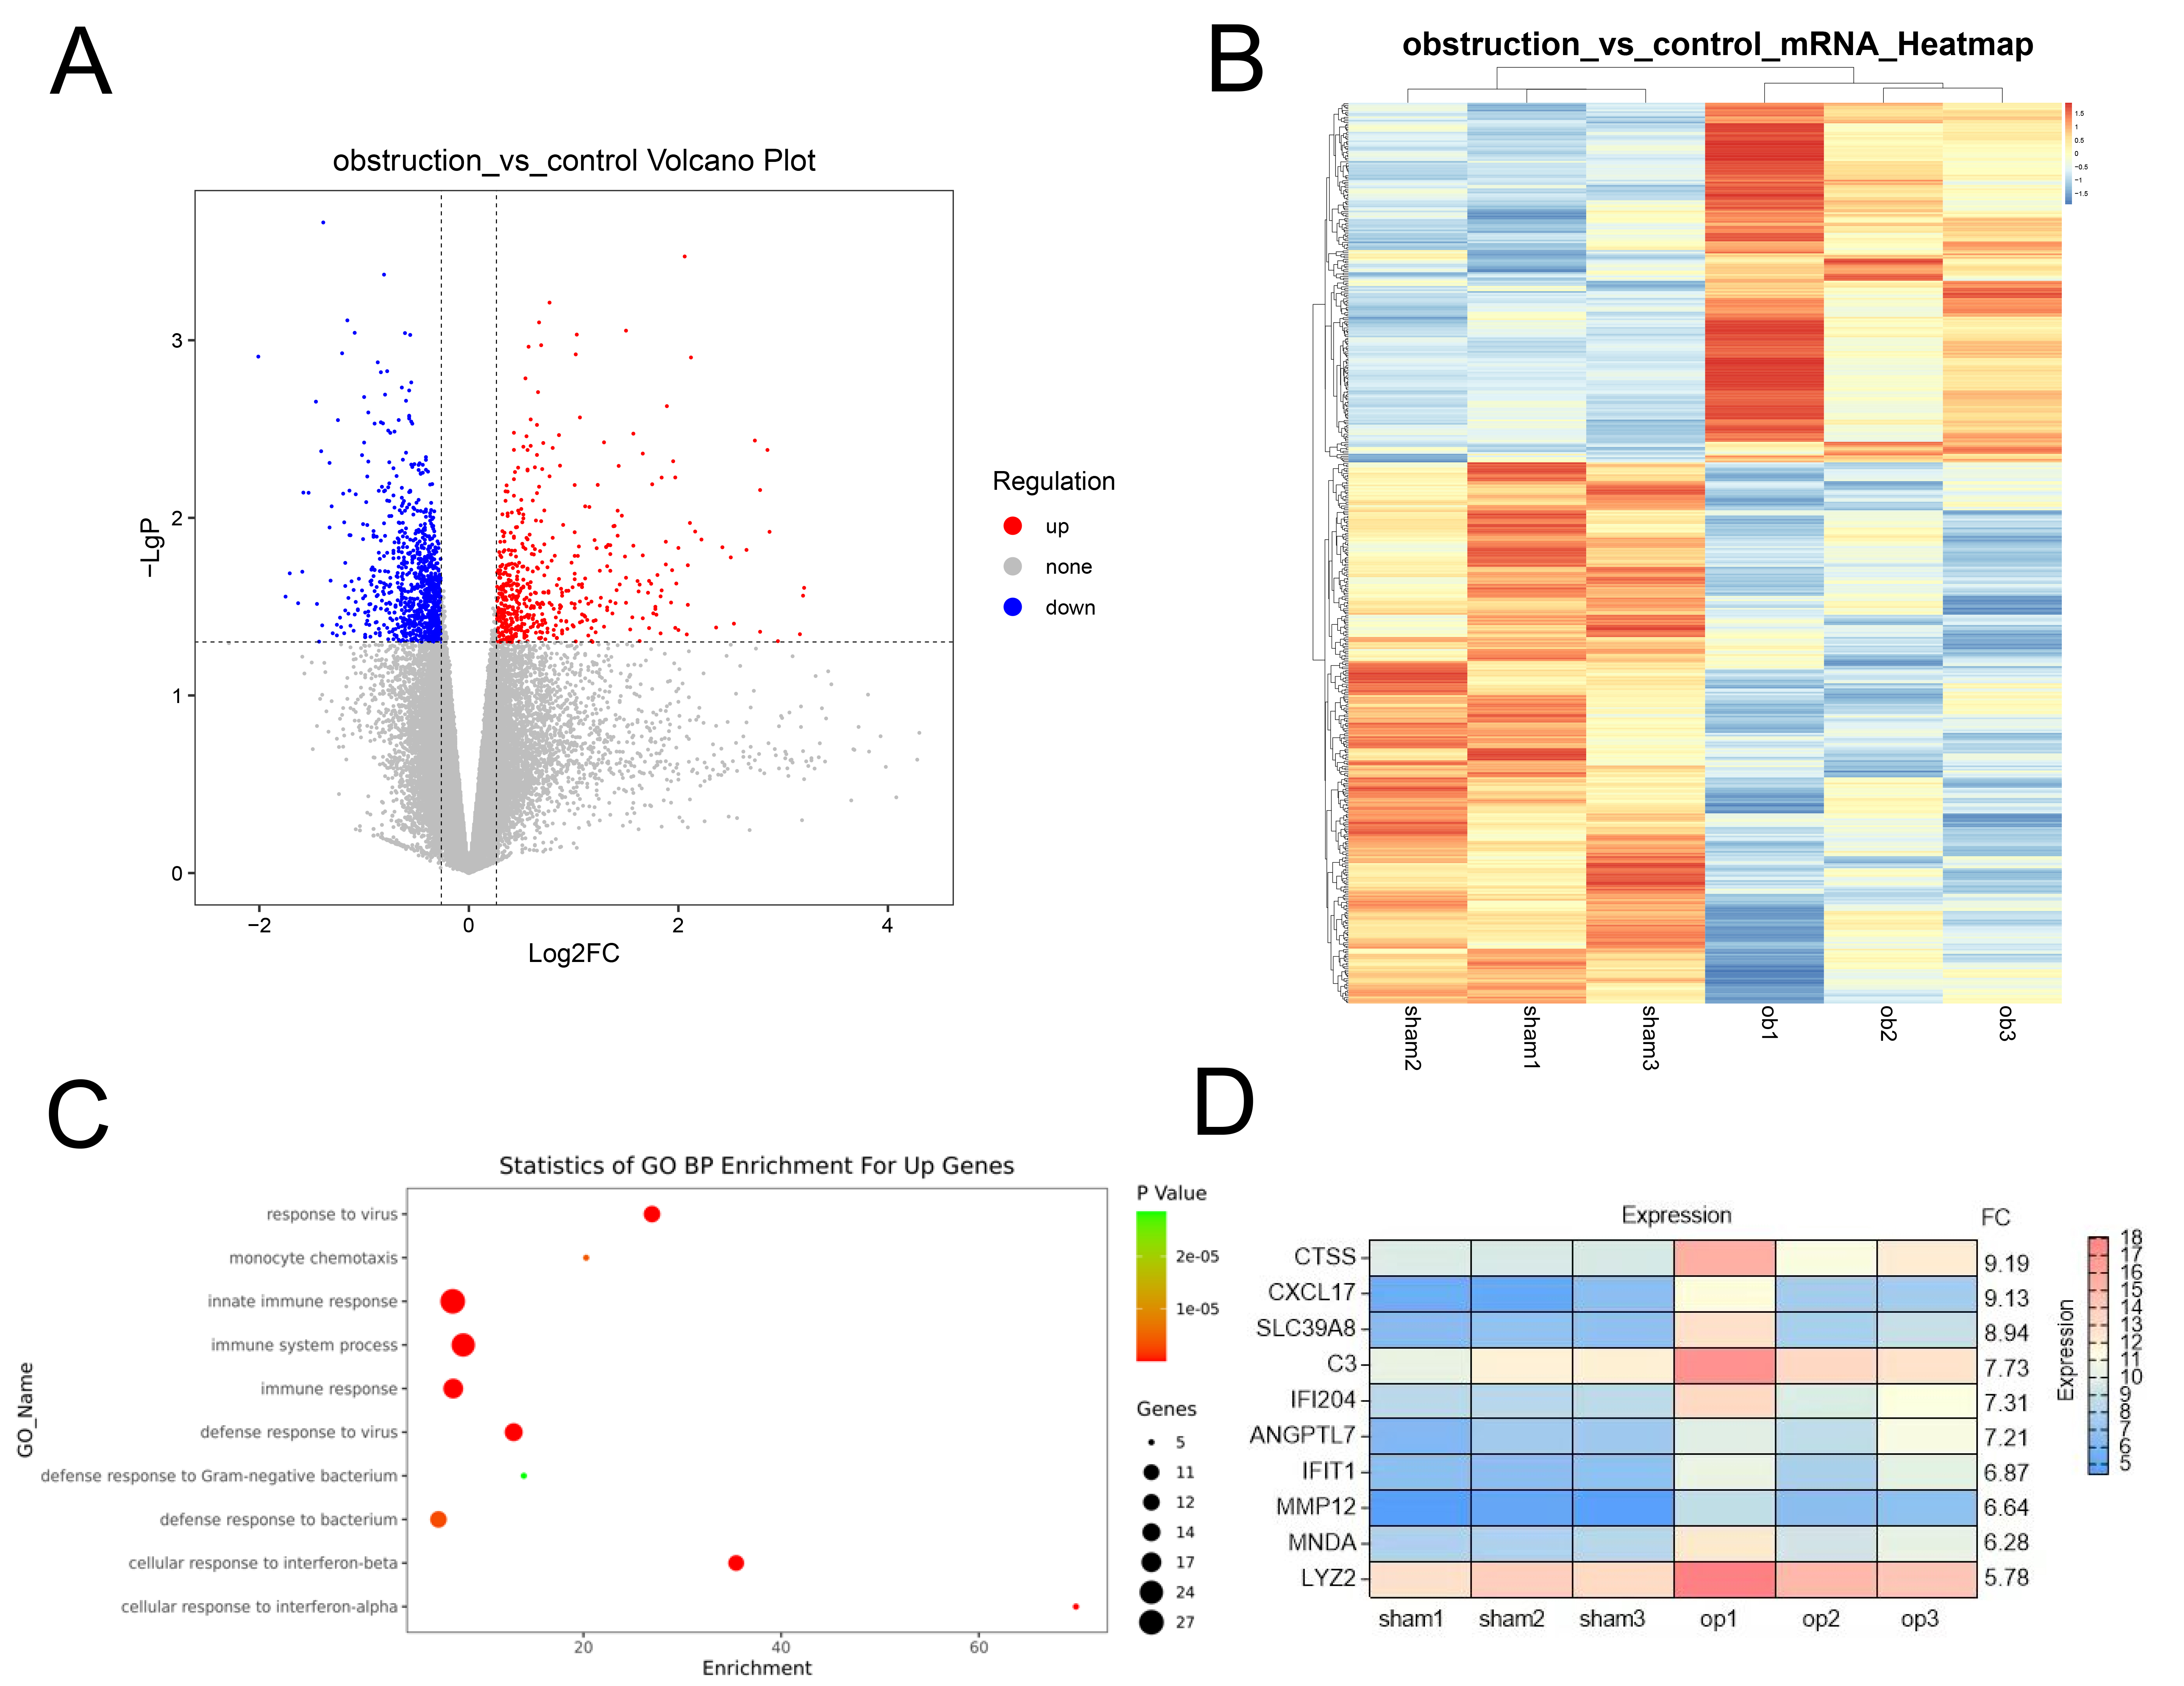 Fig. 2.
Gene expression analysis for BOO and sham mice. (A) Volcano
Plot shows the distribution of differential genes between the control group and
obstruction group. (B) Hierarchical Clustering was done for differentially
expressed genes and displayed in the form of heatmap. (C) Gene Ontology (GO)
analysis of the main functions of the genes upregulated in the Obs group. (D) The
top ten most significantly upregulated genes in the Obs group. p
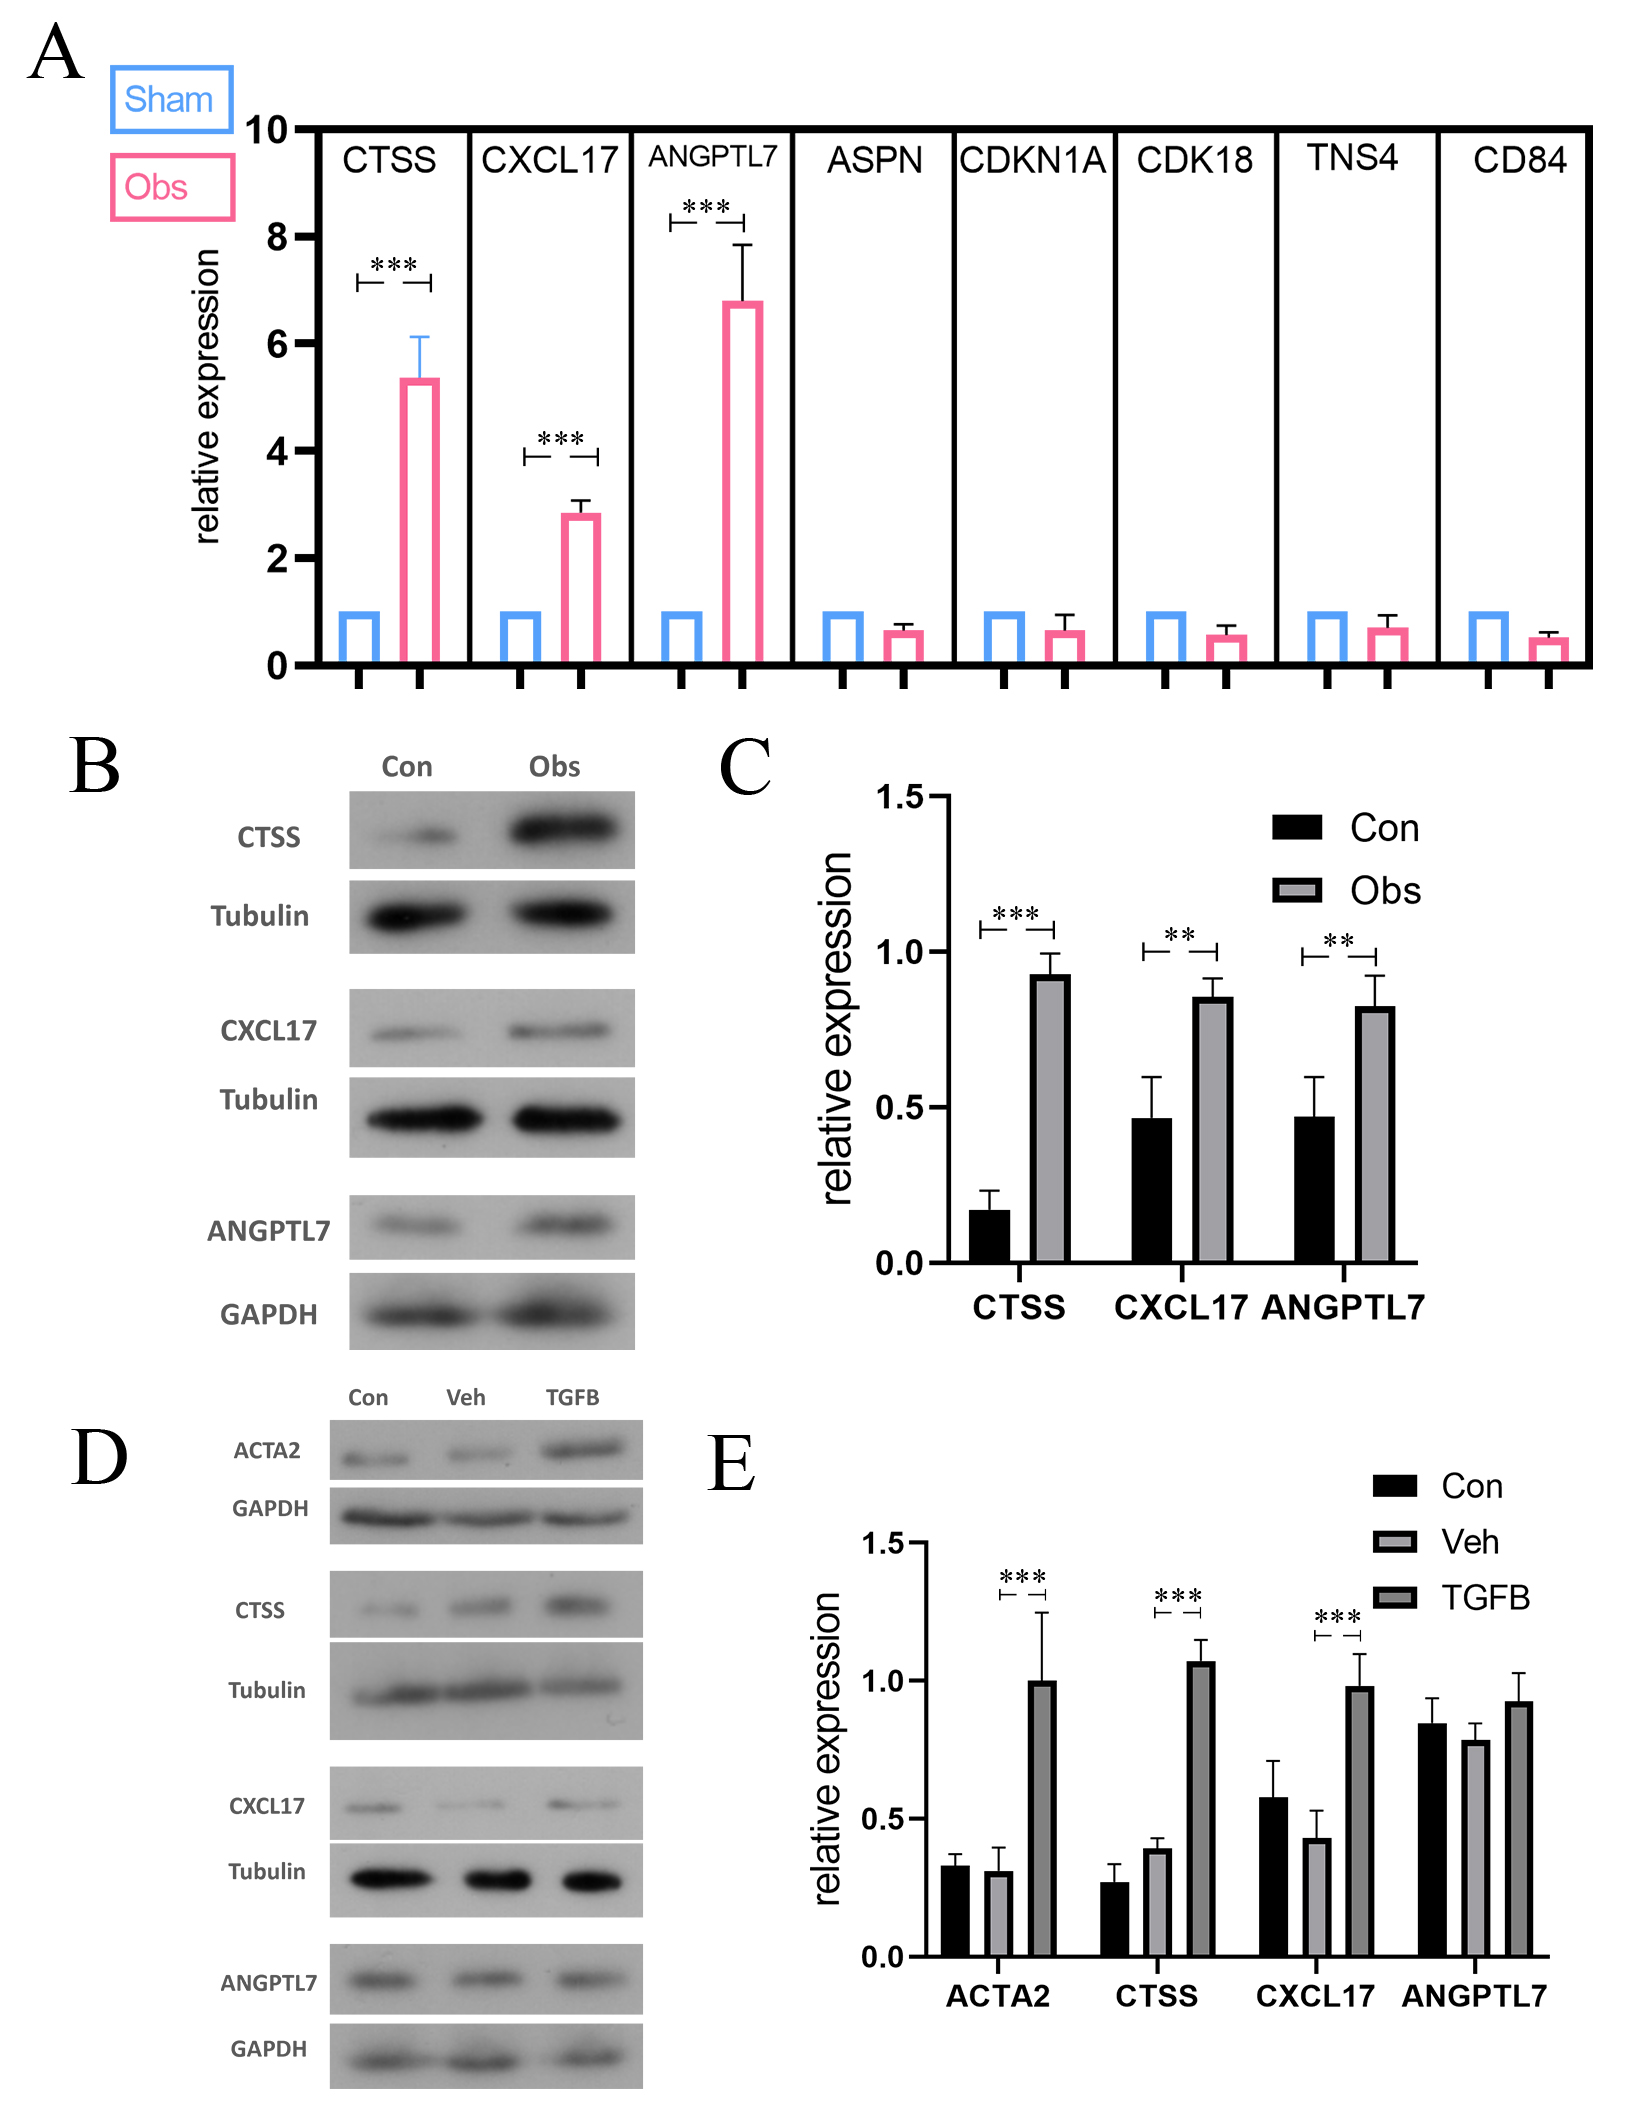 Fig. 3.
The differential expression of selected gene or protein
following BOO in vivo or in vitro. (A) qPCR test results in
genes selected from microarray result, and CTSS, CXCL17, and ANGPTL7 identified
as candidate genes in the following verification. (B,C) the expression of CTSS,
CXCL17, ANGPTL7 in mice model. (D,E) the expression of ACTA2, CTSS, CXCL17,
ANGPTL7 in smooth muscle cells. The protein levels of CTSS and CXCL17 were
upregulated in vivo and in vitro. But the expression of
ANGPTL17 was only significantly elevated in vitro. The data are
expressed as the mean
To study the effect of CTSS on the mice bladder, VSOP showed that, compared with
the obstruction group treated with siCTSS, the urine volume of the obs/siCTSS
group starting from the 7th day following BOO. Particularly, the improvements
were most significant on day 28 (123.956
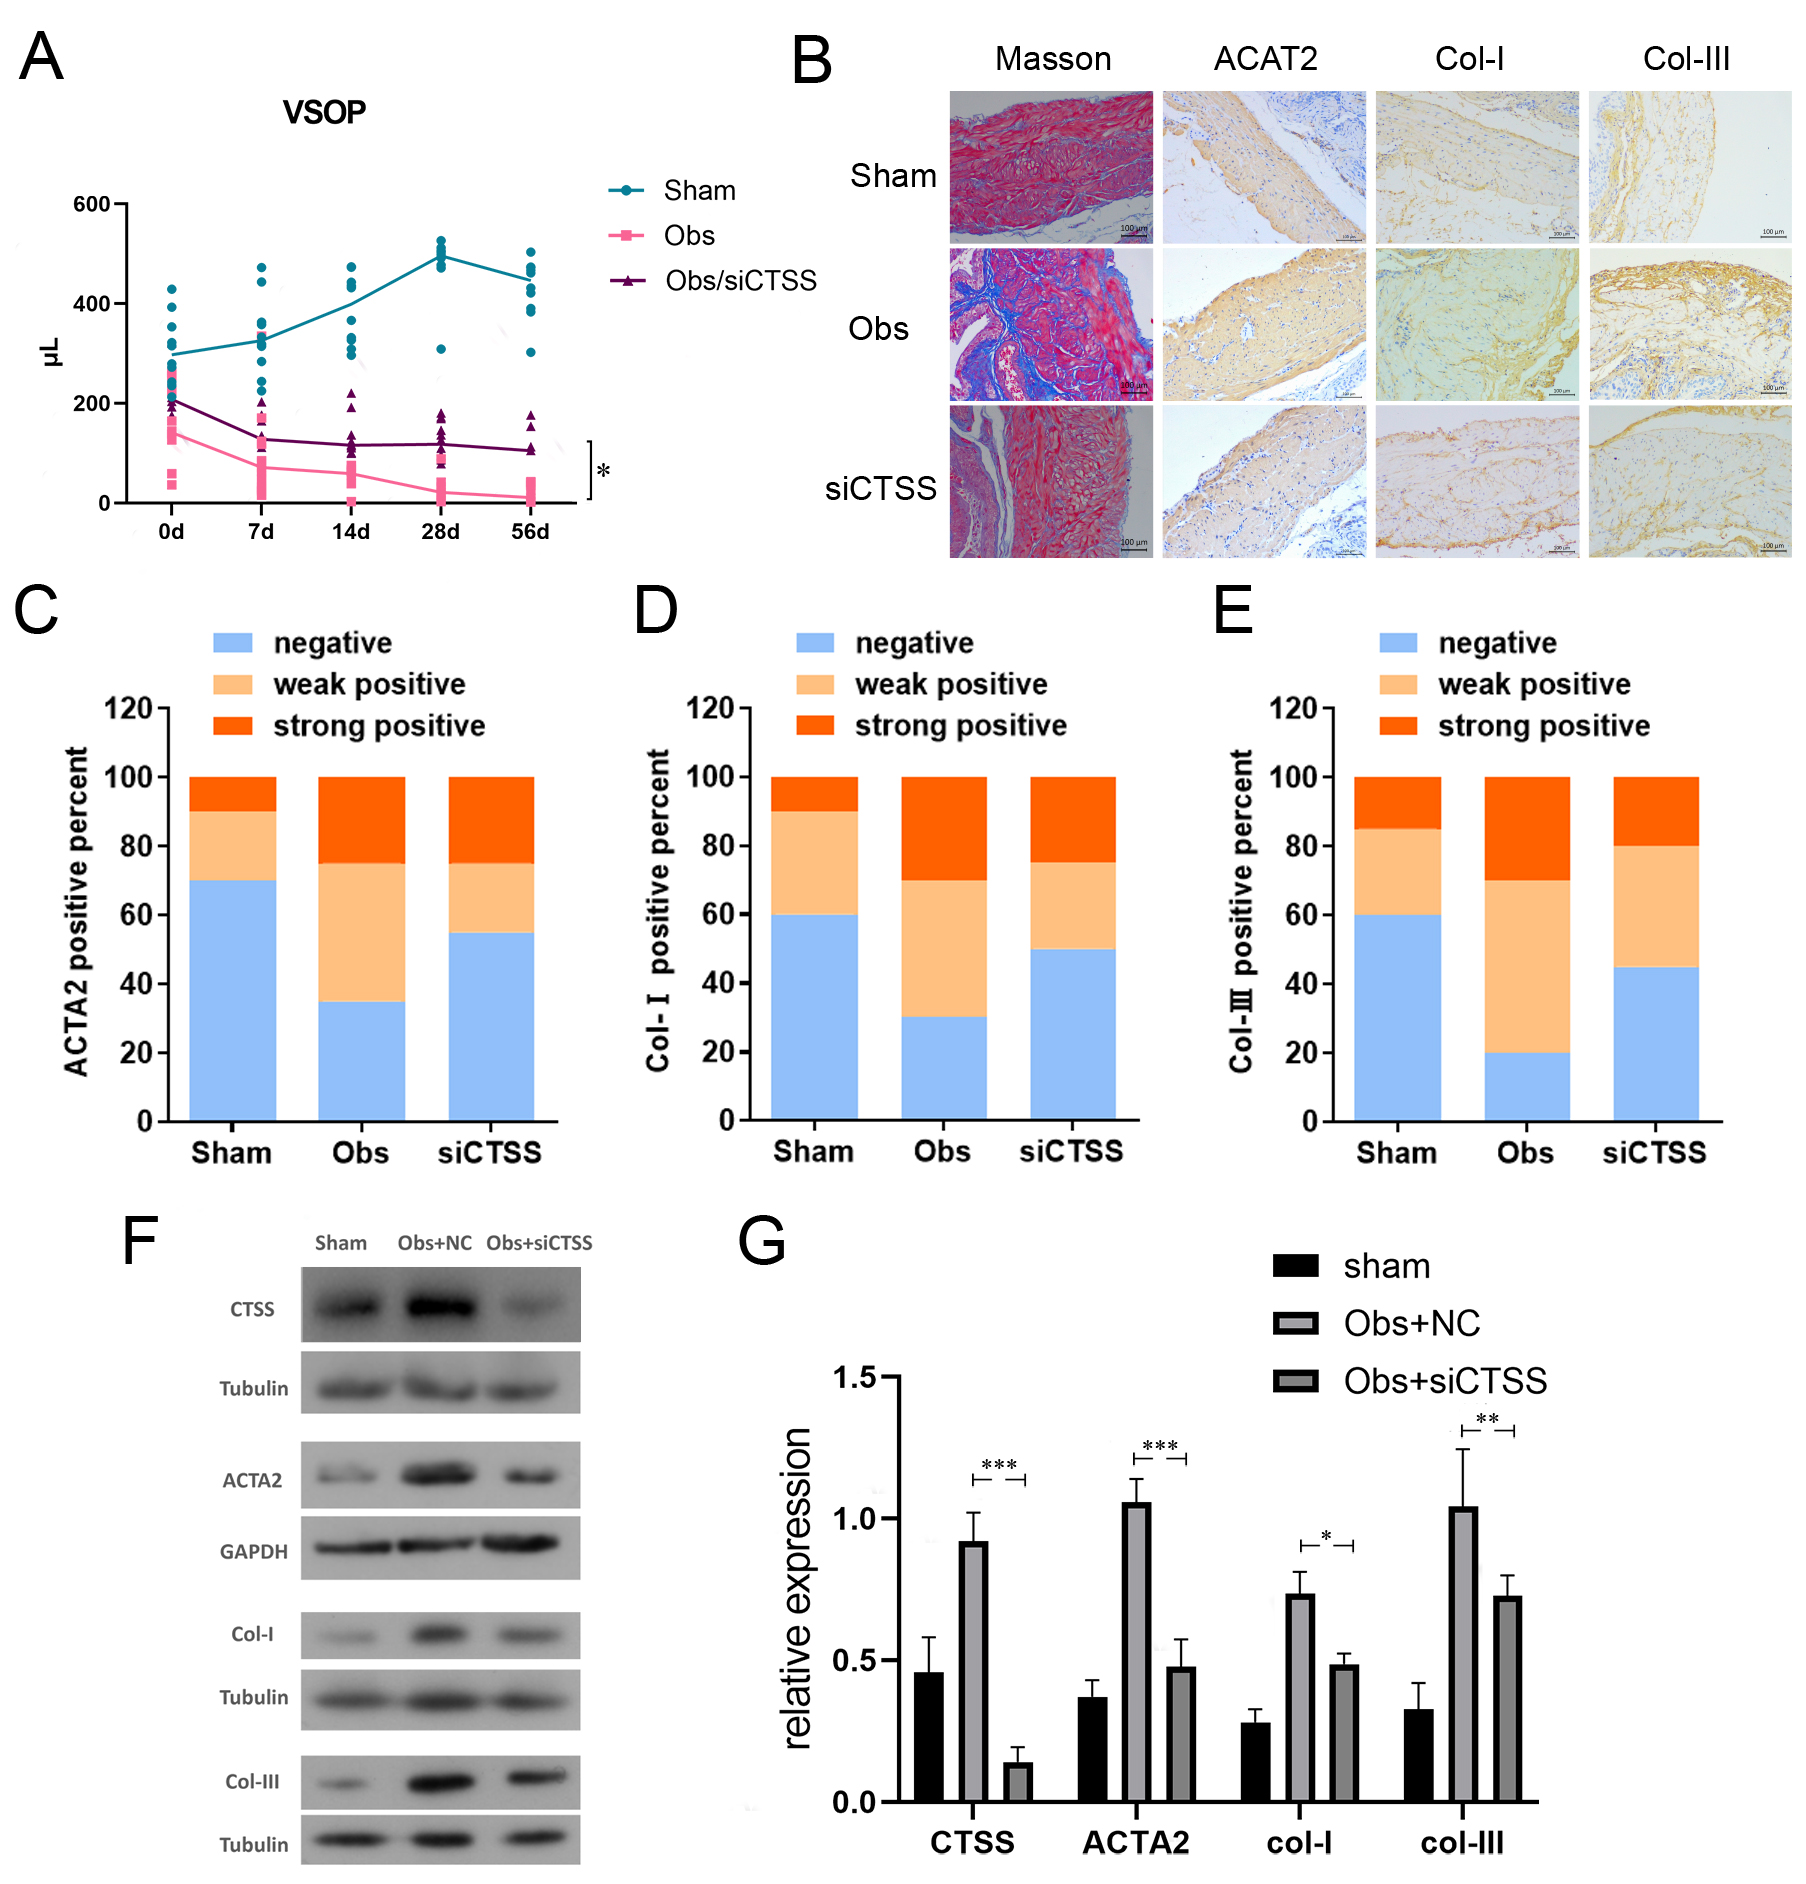 Fig. 4.
Downregulation of CTSS improved bladder function and bladder
fibrosis after BOO. (A) VSOP showed that bladder function of the Obs/siCTSS
group was improved since the 28th day after obstruction, compared with control.
(B–E) Downregulation of CTSS improved bladder fibrosis in Masson’s staining
and IHC. Representative images and IHC positivity statistics are shown. Scale bar
= 100 µm. (F,G) Downregulation of CTSS decreased the expression level of
ACTA2, Col-I, and Col-III in western blotting. The data are expressed as the mean
Our results demonstrated that the expression levels of CTSS were elevated in
both TGF
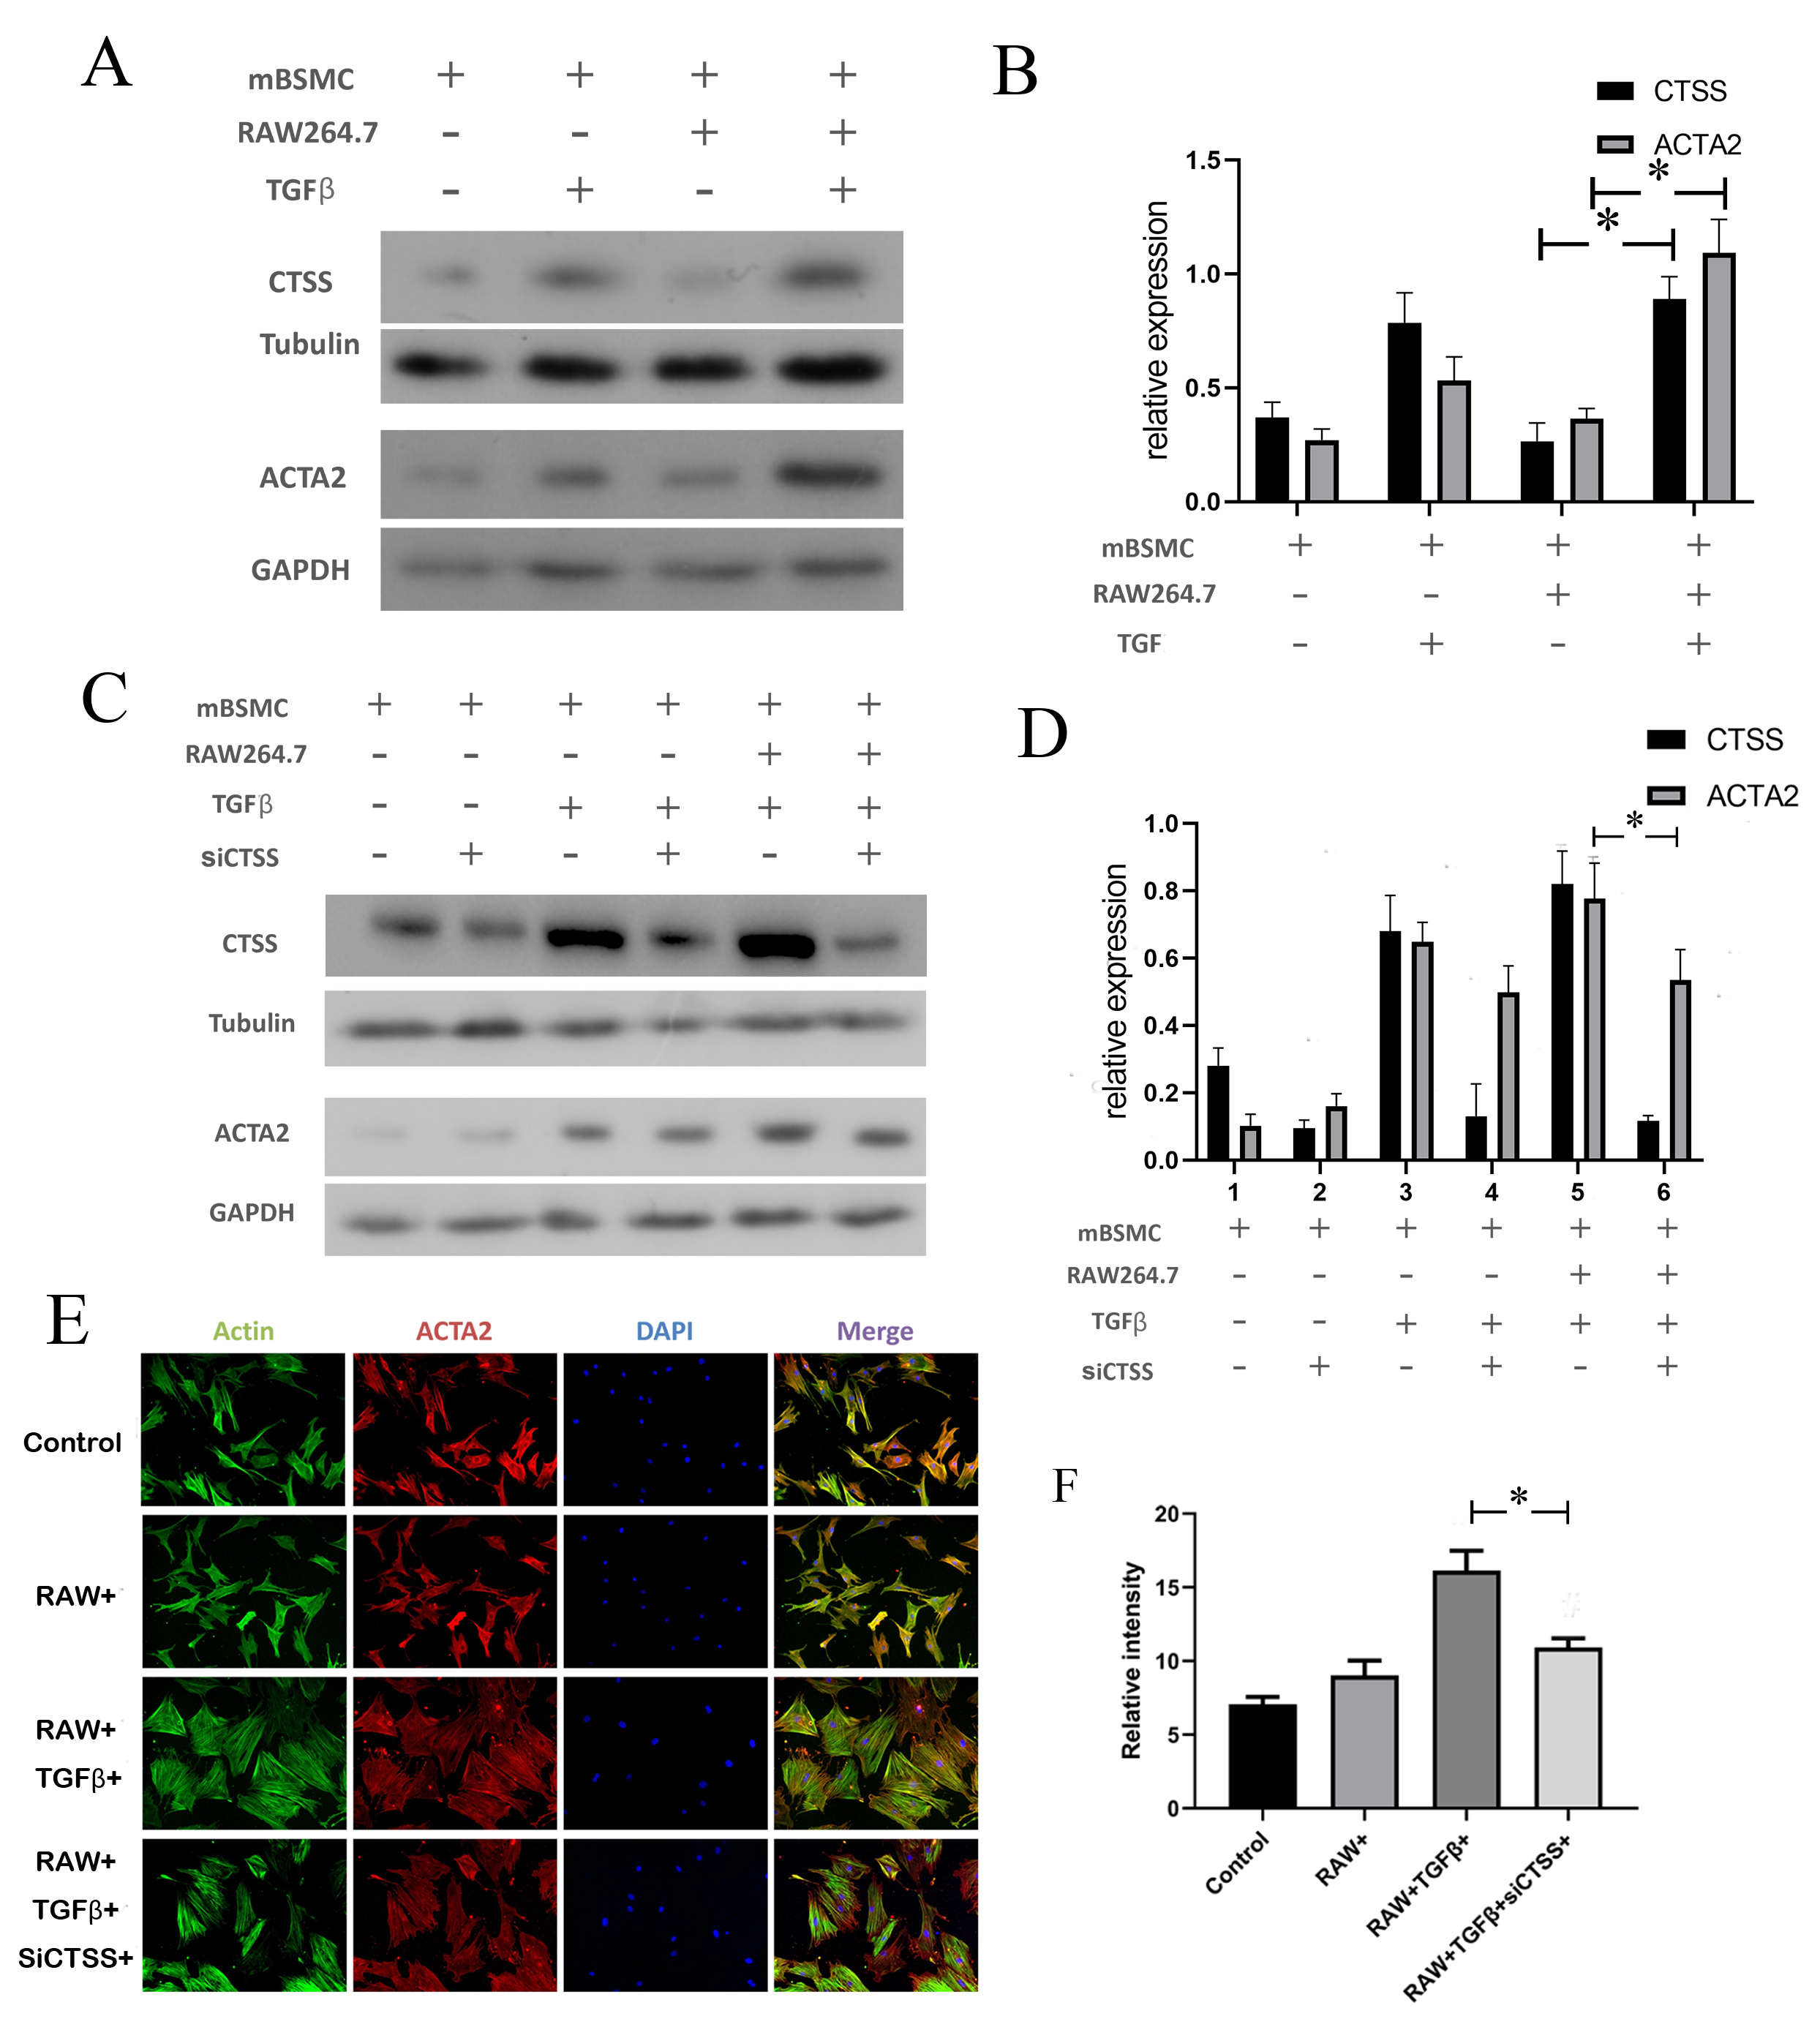 Fig. 5.
CTSS contributed to hypertrophy in smooth muscle cells when
co-cultured with monocytes. (A,B) The expression level of CTSS and ACTA2 with
TGF
The expression levels of both CTSS and IL-6 in the cell supernatant were
increased in TGF
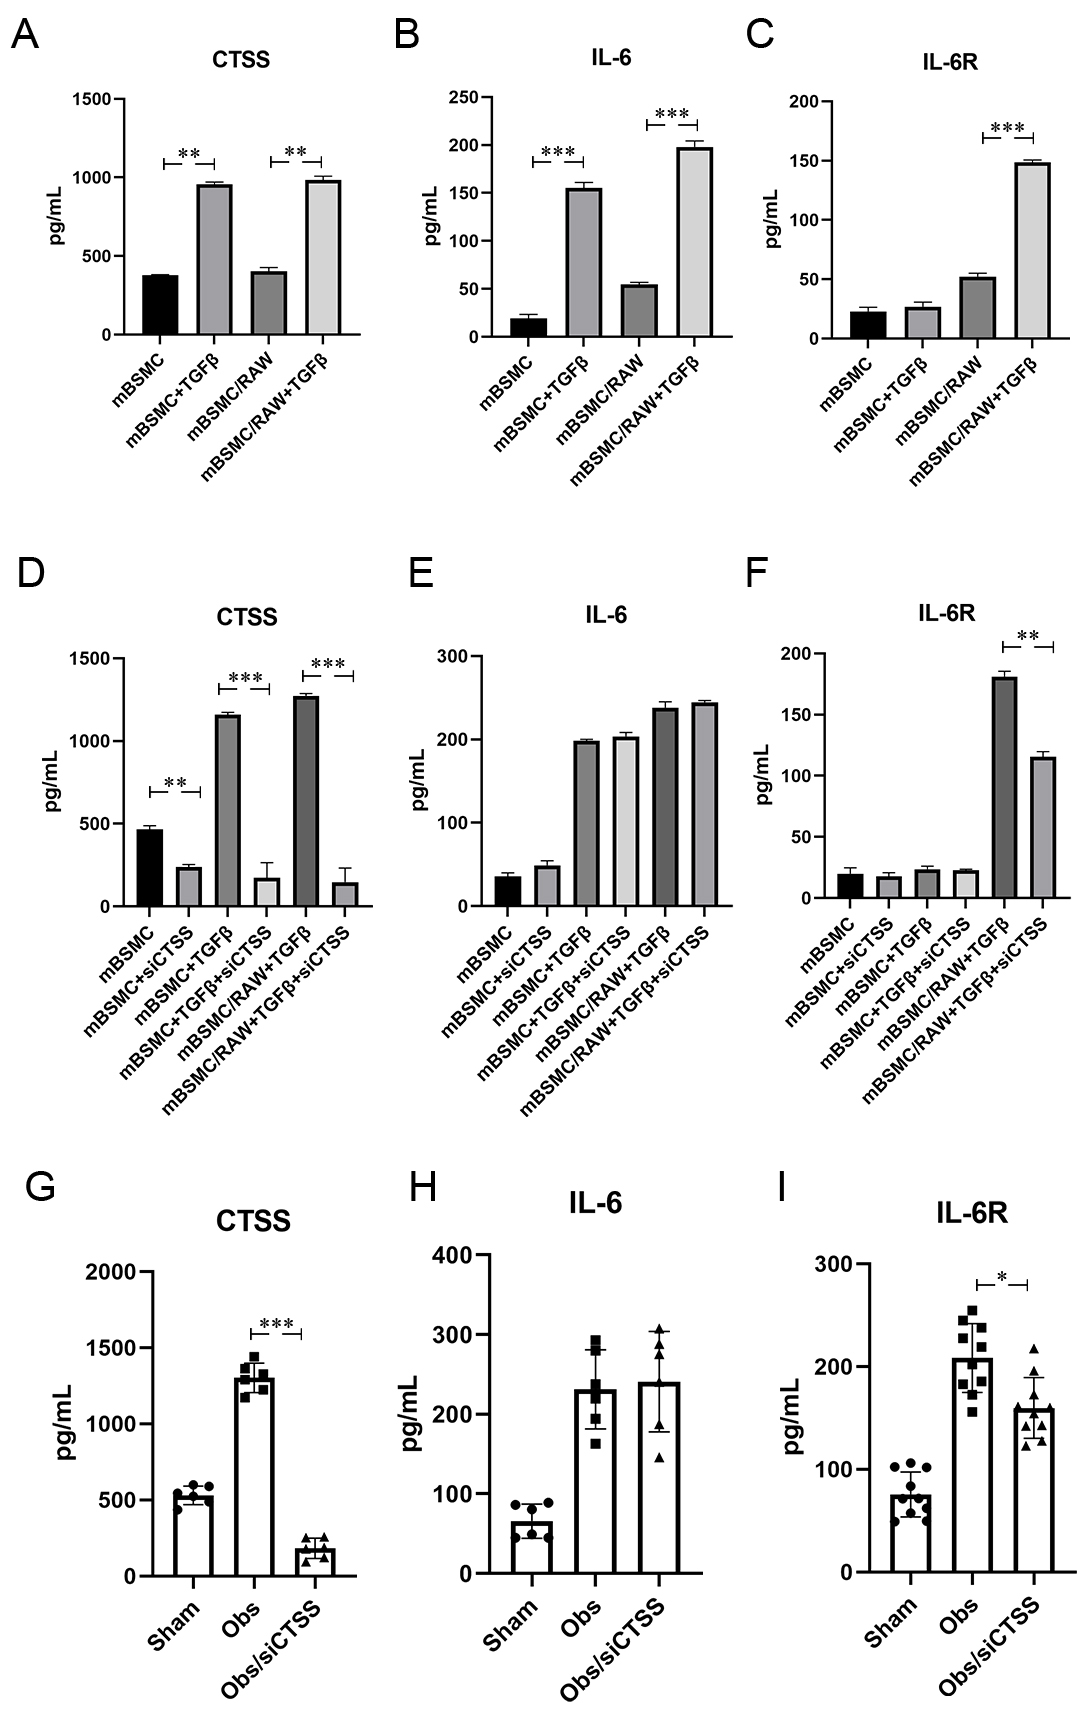 Fig. 6.
CTSS activated CTSS/sIL-6R/IL-6 signal pathway after BOO.
(A–C) TGF
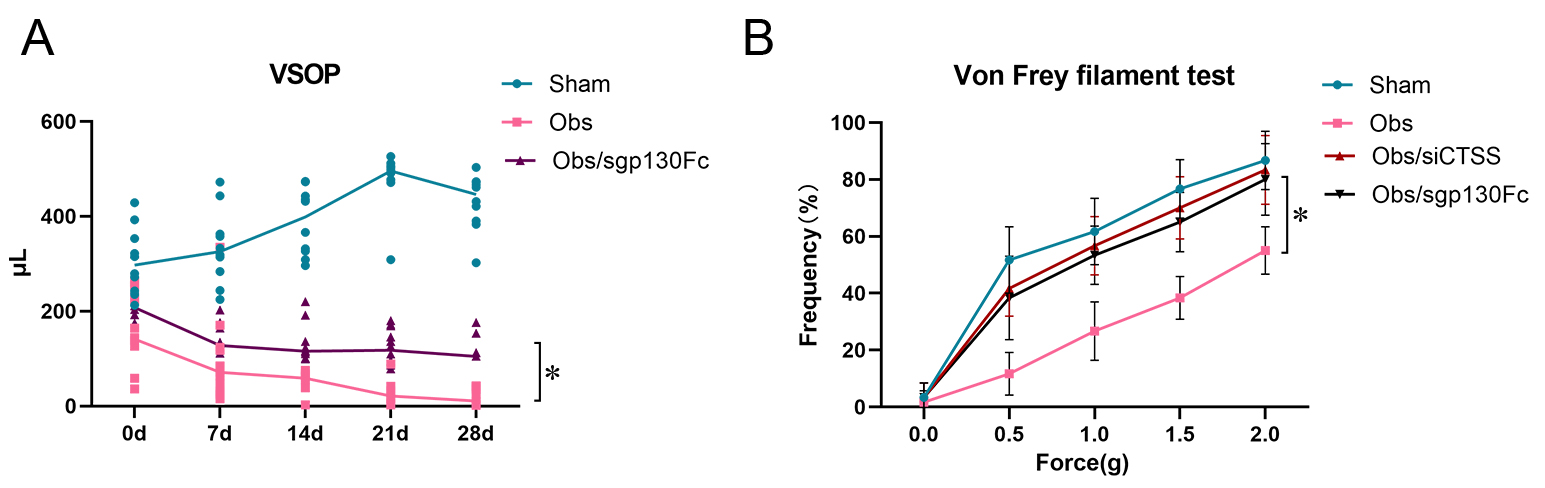 Fig. 7.
CTSS affected bladder function through CTSS/sIL-6R/IL-6
trans-signaling after BOO. (A) VSOP showed bladder function was improved when
CTSS/sIL-6R/IL-6 trans-signaling was blocked by sgp130FC. (B) Von Frey filament
test showed bladder sensibility was improved when CTSS/sIL-6R/IL-6
trans-signaling or CTSS was blocked by sgp130FC or siCTSS. The data are expressed
as the mean
Multiple histological changes in the bladder wall occurred following BOO,
including hypertrophy, tissue hypoxia, inflammation, and fibrosis, which were
characterized by increasing extracellular matrix [11]. In our study, we confirmed
the bladder dysfunction with urine volume change post-obstruction, and the
downtrend continued for four weeks (Fig. 1A). Collagen type I served as one of
the extracellular matrix produced by fibroblasts, mediated by TFG
Fibrosis involves the hyperproliferation and activation of fibroblasts, leading
to abnormal accumulation of ECM [13]. This process can be triggered by mechanical
and biochemical factors such as hydrostatic pressure, stretching force, fluid
shear stress, and ECM stiffness, which promote tissue repair and cell adhesion
[14]. Current study has indicated that ADRB2 and ADRB3 were upregulated by
hydrostatic pressure via EPAC/SMAD2/FN and EPAC/SMAD3/COL1 pathways, contributing
to bladder fibrosis in BOO models [4]. Another study showed that the upregulation
of PDE5 can be detected following BOO, modulated by nitric oxide synthase (NOS),
and leads to bladder smooth muscle hypertrophy and hyperplasia [15]. Although
research in this area is abundant, therapeutic strategies remain insufficient. In
our study, we carried out a microarray probe to detect the BOO mice bladder and
found the three genes with the highest differential expression. Compared with
controls, a total of 541 genes were upregulated and 943 genes were downregulated
in BOO mice (Fig. 2A,B). Furthermore, we subjected the differential genes to GO
analysis and the results indicated that innate immune response, immune system
process, and cellular response to interferon-beta are the major functions of
upregulated genes (Fig. 2C). The top ten most significantly upregulated genes
were selected (Fig. 2D), and we combined the results of the GO analysis with
literature reports and subjected them to Kyoto Encyclopedia of Genes and Genomes
(KEGG) analysis. Immune response-associated genes CTSS, CXCL17, and ANGPTL7 were
identified as candidate genes. Among the top ten genes, CTSS, CXCL17, and ANGPTL7
showed the highest differential expression (Fig. 3A). From other studies, we
found CTSS is associated with the fibrosis process in other organs, combining
with our results that CTSS showed the highest elevation in BOO mice bladders and
TGF
CTSS is short for cathepsin S, which is a member of the cysteine cathepsin
protease family [16]. It is defined by proteolytic activity and is characterized
as restricted tissue expression, associated with antigen-presenting cells, and
retains activity at a neutral pH [17, 18, 19, 20]. In our study, we detected the
overexpression of CTSS following obstruction. Due to its ability to respond to
inflammatory stimuli and participate in antigen presentation, CTSS can serve as a
target in immunological disorders, allergic inflammation, and asthma [21]. In
some studies, CTSS has been found to be expressed in both the upper and lower
airways of cystic fibrosis patients, which contributes to the destruction of lung
elasticity. Elevated protease/anti-protease-ratios contribute to damage of airway
tissue and premature death in the inherited disease [22]. CTSS is engaged in the
activation of epithelial sodium channels (ENaC) and cleavage of host defense
proteins, including surfactants and LL-37, in cystic fibrosis patients [23].
Furthermore, CTSS can be a potential biomarker predicting the disease progression
in idiopathic pulmonary fibrosis patients. The rise of cystatin C might trigger
the development of lung fibrosis by impairing collagenolytic activity of cysteine
cathepsins [24]. Based on all these studies, we predicted that CTSS is more
likely to be associated with the bladder fibrosis process following BOO among the
three genes. We confirmed that after the down-regulation of cathepsin S with
siRNA, bladder function and bladder fibrosis were improved compared with control
(Fig. 4A–G). To imitate the realistic microenvironment, we co-cultured SMCs and
monocyte/macrophages and stimulated them with TGF
IL-6 is maintained at low serum levels in health and dramatically increases
inflammation events [25]. IL-6 activates its target cells by binding to the
IL-6R, which is mainly expressed on hepatocytes and different leukocyte subsets
such as T cells, B cells, monocyte/macrophages, megakaryocytes, and neutrophils.
IL-6 is associated with fibrosis diseases via binding sIL-6R and initiating IL-6
trans-signaling [26]. In a recent study, IL-6 trans-signaling contributes to
renal fibrosis [27]. To investigate whether IL-6 trans-signaling participates in
bladder fibrosis and how CTSS affects bladder smooth muscle cells, we carried out
in vitro experiments and tested the cell supernatant. The results
indicated that both the smooth muscle cells group and the co-cultured group
stimulated by TGF
In summary, bladder fibrosis is a common pathological change after BOO, which is characterized by overexpression of CTSS. In this process, CTSS cleaves IL-6R on the immune cells’ surface and forms sIL-6R. Binding with IL-6, sIL-6R participates in IL-6 trans-signaling activity and initiates bladder fibrosis. Thus, CTSS can be identified as a potential therapeutic target of BOO in further studies.
Although we have proposed that CTSS promotes the progression of bladder fibrosis
by cleaving IL-6R to form sIL-6R, thereby initiating the next stage through the
formation of a CTSS/IL-6/sIL-6R complex, the deeper mechanisms—such as
downstream signaling pathways, the cleavage site of IL-6R, and the relationship
between downstream signaling pathways and IL-6R cleavage—remain insufficiently
explored. In our further studies, we observed that adding CTSS protein to a
co-culture cell system increased the phosphorylation levels of Stat3 and Stat6
(Supplementary Fig. 2). While it is well known that factors like
TGF
BPH, Benign prostate hyperplasia; BOO, Bladder outlet obstruction; CTSS, Cathepsin S; CXCL17, C-X-C Motif Chemokine Ligand 17; ANGPTL7, Angiopoietin Like 7; IL-6, Interleukin-6; IL-6R, Interleukin-6 receptor; LUTS, Lower urinary tract symptoms; ECM, Extracellular matrix; BSMC, Bladder smooth muscle cell; TGF
The datasets used or analyzed during the current study are available from the corresponding authors on reasonable request.
LW, TS and MY designed the experiments. MY, XL, HW, and TS carried out the experiments, analyzed the experimental results and wrote the manuscript. All authors contributed to editorial changes in the manuscript. All authors read and approved the final manuscript. All authors have participated sufficiently in the work and agreed to be accountable for all aspects of the work.
All procedures involving animals in this study complied with the NIH Guide for the Care and Use of Laboratory Animals and were approved by the Animal Care and Use Committee of Tianjin Medical University (approval No. IRB2024-DWFL-173).
We would like to express our gratitude to all those who helped me during the writing of this manuscript and thanks to all the peer reviewers for their opinions and suggestions.
This research was supported by The National Key Research and Development Program of China [2021YFC2009300, 2021YFC2009305], the National Natural Science Foundation of China [82203670] and the Tianjin Medical University General Hospital Young Technical Backbone Program [GG-202407].
The authors declare no conflict of interest.
Supplementary material associated with this article can be found, in the online version, at https://doi.org/10.31083/FBL45355.
Publisher’s Note: IMR Press stays neutral with regard to jurisdictional claims in published maps and institutional affiliations.