
- Academic Editor
Osteosarcoma (OS) is a highly aggressive primary bone malignancy with a prominent propensity for metastasis. The identification of the key molecular drivers for OS progression is paramount to developing effective therapies. Although kinesin family member 18A (KIF18A) has previously been suggested to play a role as a potential oncogene in the development and metastatic progression of several types of cancer, little is known about its exact functional role in OS.
OS datasets were retrieved from the GSE126209 database and the TARGET dataset, with a focus on expression data of kinesin family genes. Differential expression analysis of these genes was conducted using R, comparing tumor tissues to paired adjacent non-tumor tissues, as well as between metastatic and non-metastatic cases. In order to illuminate the functional mechanism, pathway enrichment analysis was executed through Gene Set Enrichment Analysis (GSEA), and the tumor immune microenvironment composition was analyzed comprehensively using the CIBERSORT algorithm. Functional experiments were conducted to investigate the effects of OS KIF18A on cell behaviors. In vivo experiments were used to identify the function of KIF18A on tumor growth. In addition, drug sensitivity profiling and analysis of the lncRNA-mediated regulatory network were implemented to seek possible therapeutic relevance.
Analysis of the kinesin family gene expression in the GSE126209 OS dataset revealed that KIF18A is markedly upregulated in tumor tissues compared to normal counterparts. Further analysis of the TARGET database indicated that elevated KIF18A expression is associated with metastatic OS, a finding that was validated using clinical samples from OS patients. Our functional assay indicated that KIF18A increased proliferation, invasion, and migration activity of OS cells in vitro and inhibited apoptosis. In line with this, the knockdown of KIF18A remarkably suppressed tumor growth in OS xenograft models in vivo. Pathway enrichment analysis revealed dysregulation of several key signaling pathways associated with KIF18A expression, providing mechanistic insights into its oncogenic role. Immune profiling indicated that high KIF18A expression was linked to an immunosuppressive tumor microenvironment. Furthermore, drug sensitivity analysis indicated that lower KIF18A expression was associated with a higher sensitivity to lapatinib. Additionally, a set of lncRNAs associated with KIF18A expression was identified, implicating potential regulatory networks involved in OS progression.
This study reveals that KIF18A is upregulated in OS, particularly in metastatic cases, and is linked to poor clinical outcomes. Functional experiments confirm that KIF18A promotes proliferation, migration, and invasion of OS cells while suppressing apoptosis. In vivo experiments reveal that KIF18A knockdown strongly inhibits tumor growth. KIF18A expression correlates with dysregulation of key oncogenic pathways, an immunosuppressive microenvironment, and potential immunotherapy resistance. These results highlight KIF18A’s role as a pivotal oncogene in OS progression and suggest its promise as both a prognostic biomarker and a therapeutic target.
Osteosarcoma (OS) is a primary malignant bone tumour which is mainly formed on the metaphyseal area of a long bone adjacent to joint, the femur, tibia and humerus [1, 2]. Although most frequently diagnosed in children and adolescents, OS can occur across all age groups [3]. The etiology is still not completely clear but the emerging evidence points to a genotype-environment interaction for the cause of the disease [4, 5]. Clinically, patients commonly present with localized bone pain, palpable mass or swelling, and impaired mobility in the affected limb [6]. Pain typically intensifies with disease progression and is often exacerbated at night [7]. An early diagnosis and timely treatment are crucial to clinical outcomes [8]. The standard current management uses a multimodal approach of neoadjuvant chemotherapeutic agents, surgical resection and radiotherapy, in a selection of patients [9]. Surgical goals include complete tumor excision with limb-salvage preservation whenever feasible, whereas systemic therapies aim to eradicate micrometastases and reduce the risk of recurrence [10].
Although remarkable therapeutic improvements have been achieved in recent years, prognosis of patients diagnosed with an advanced or metastatic OS remains poor and thus there remains a desperate unmet clinical need [11]. Ongoing studies towards new therapeutic approaches–including targeted and biologically informed–are thus crucial in order to optimize survival for this type of tumors and to increase patient quality of life. The kinesin superfamily proteins (KIFs) constitute one of the classes of ATP–dependent motor proteins that drive intracellular transport and regulate cell dynamics by moving along microtubules driven by the hydrolysis of ATP [12, 13]. Isoforms of these proteins have been linked to organelle, vesicle, and macromolecule trafficking and are key in governing processes that are important for the cell such as mitosis, meiosis, and neurite outgrowth [13, 14]. In cancer, KIFs have emerged as important regulators due to their involvement in driving cell proliferation, migration, and invasion [15]. Dysregulation of specific KIF family members has been implicated in tumorigenesis, contributing to malignant phenotypes and disease progression [16]. For example, evidence demonstrates that Forkhead box M1 (FOXM1) promotes hepatocellular carcinoma (HCC) proliferation through direct upregulation of KIF4A [17]. Likewise, in different studies KIF11 was observed to be overexpressed in HCC and to cause tumor growth in octamer-binding transcription factor 4-dependent manner; its inhibition with monastrol was presented as a potential therapeutic avenue [18]. Therefore, understanding the mechanistic roles of KIFs in oncogenesis not only deepens insights into tumor biology but also reveals promising targets for novel anticancer therapies.
KIF18A is an established component of the kinesin-8 family of motor proteins. In mitosis, it uses energy generated from ATP hydrolysis to travel processively along microtubules in the direction of their plus ends [19]. It accumulates in a spatial gradient along spindle microtubules and facilitates precise chromosome alignment at the metaphase plate through the regulation of microtubule dynamics [20]. Genetic or functional inhibition of KIF18A results in elongated mitotic spindles, reduced microtubule tension, increased amplitude of chromosome oscillations, and persistent chromosome misalignment [19, 20, 21]. Notably, many chromosomal instability (CIN) tumors depend on KIF18A to maintain mitotic spindle integrity and sustain proliferative capacity [22]. Consequently, targeting KIF18A may inhibit tumor growth and metastasis in chromosomally unstable tumors [23, 24, 25]. Moreover, inhibition of KIF18A may enhance immune infiltration and activation, improving CD8+ T cell-mediated anti-tumor response [26]. In CIN-driven tumor models, depletion of KIF18A leads to mitotic delay, spindle multipolarity, and significantly increased apoptosis [22, 27]. KIF18A mRNA is frequently overexpressed across diverse malignancies, including breast cancer, lung adenocarcinoma, and cervical cancer [28, 29, 30]. Consistent with its essential cellular functions, knockdown of KIF18A impairs cancer cell proliferation, tumorigenic potential, and survival in these contexts [28, 29, 30].
A recent pan-cancer analysis further confirms widespread upregulation of KIF18A across 27 tumor types [16]. In pancreatic adenocarcinoma, KIF18A overexpression promotes tumor cell proliferation and migration, an effect potentially driven by mutations in tumor protein 53 (TP53) and kirsten rat sarcoma viral oncogene homolog (KRAS) [31]. Prior preclinical research has shown that despite the non-essential role of KIF18A in the normal cycle of somatic cells, this protein is essential for cancer cell survival, especially in cases involving chromosomal instability, making it an interesting target for therapy [22]. Nonetheless, functional KIF18A involvement in OS development has not been thoroughly investigated. Here, we identify KIF18A as a key driver of OS progression, with significantly elevated expression observed in metastatic tumors. Functional experiments reveal that KIF18A promotes OS cell proliferation, invasion, and migration, while its knockdown induces apoptosis and suppresses xenograft tumor growth. Furthermore, we associate KIF18A expression with dysregulated signaling pathways, an immunosuppressive tumor microenvironment, distinct drug sensitivity profiles, and specific long non-coding RNA (lncRNA) interactions. The above observations show multiple roles for KIF18A in the development of OS and suggest that it is not only an OS prognostic marker but also a possible therapeutic target.
The OS dataset GSE126209 (https://www.ncbi.nlm.nih.gov/geo/query/acc.cgi?acc=GSE126209) was retrieved from the GEO database (https://www.ncbi.nlm.nih.gov/geo/) and includes 12 tumor samples along with 11 matched adjacent non-tumor tissues. Expression data for 40 kinesin family genes were extracted from this dataset. Differential gene expression between tumor and adjacent tissues was analyzed using R software (v4.3.2). Data visualization was performed with the aid of the ggplot2 (v3.5.2) and ggpubr (v0.6.0) packages in R. Clinical and gene expression data from 89 OS patients were retrieved from the TARGET database (https://www.cancer.gov/ccg/research/genome-sequencing/target), among which survival records were accessible for 86 individuals. Data integration was performed using customized computational scripts developed by the authors. Genes with an average expression level below 0.1 in the integrated transcriptomic dataset were excluded due to their limited biological relevance. The classification of mRNA and lncRNA was conducted using the human genome reference files downloaded from the ENSEMBL database (v113, https://www.ensembl.org). The interaction information between different proteins is directly analyzed online from the STRING database (v12.0, http://www.string-db.org) and visualized using Cytoscape software (v3.10.2, https://cytoscape.org/) [32].
Gene Set Enrichment Analysis (GSEA) is an algorithm to test if pre-defined gene sets are differentially and co-expressed significantly in two different phenotypes or conditions [33]. This method orders genes across a dataset by their relevance to a particular phenotype or state, and then it evaluates how genes from specific predefined sets are distributed within this ordered list to pinpoint significant overrepresentation. In our research, we utilized GSEA to conduct our biological enrichment analysis, leveraging gene sets from both the MSigDB hallmark gene set collection (v2024.1.Hs, https://www.gsea-msigdb.org/gsea/msigdb/collections.jsp) and Gene Ontology (GO) database (v2024-01-17, https://geneontology.org/). Patients with OS were divided into high- and low-KIF18A groups, differential expression analysis was performed and ranked gene list was selected as an input for GSEA.
The CIBERSORT (https://cibersortx.stanford.edu/) algorithm employs a computational technique to deduce the cellular composition within complex tissues through analysis of their gene expression profiles [34]. By using a distinct collection of gene expression markers unique to various cell types, it precisely assesses their relative abundances in a given sample. For our research, we utilized CIBERSORT to perform the immune microenvironment analysis, which allowed us to unravel the detailed constitution of immune cells present in our samples, offering a deeper understanding of the immune dynamics within the disease context examined.
Single-cell analysis was conducted using data from the Tumor Immune Single-cell Hub (TISCH2, http://tisch.comp-genomics.org/), a publicly available resource designed for the study of tissue-specific cellular heterogeneity [35]. The comprehensive data are given on cell identification, characterization, interaction network that facilitate the systematic study of cellular heterogeneity and how it is regulated in cellular processes. A drug sensitivity analysis was done on the data provided from the Genomics of Drug Sensitivity in Cancer (GDSC) database (https://www.cancerrxgene.org/) [36]. The Tumor Immune Dysfunction and Exclusion (TIDE) database (http://tide.dfci.harvard.edu/) was used for the quantification of the response rate of OS patients on the immunotherapy [37].
In total, 79 OS tissues and their matched non-cancerous adjacent tissues were collected from the patients undergoing surgical resection of Ningbo No. 6 Hospital within the years ranging from 2014 to 2023. After sectioning, tissue samples were snap-frozen in liquid nitrogen on site, stored at –80 °C and used thereafter. The participants that we included in the study have not yet undergone preoperative radiotherapy or chemotherapy. The written informed consents were provided from all the participants before collection. The utilization of human tissues and related procedures were reviewed and approved by the Ethics Committee of Ningbo No. 6 Hospital (Approval No.: 2025003). The hFOB, MG63, U2OS, and Saos-2 cell lines are obtained from the Cell Bank of Shanghai Branch of Chinese Academy of Sciences, which are cultured in Dulbecco’s modified Eagle medium (DMEM; Gibco BRL, Grand Island, NY, USA) supplemented with 10% fetal bovine serum (FBS; Gibco) and 1% antibiotics (Gibco) to support their growth and viability. Cells are grown in 37 °C, 5% CO2 and 95% relative humidity controlled environment. All cell lines used here are identified by short tandem repeat (STR) profiling and tested mycoplasma negative.
Total RNA was isolated from the tissues and cultured cells with TRIzol reagent (Invitrogen, Carlsbad, CA, USA) and oncolumn DNase I treatment was performed to eliminate genomic DNA contamination. The isolated RNA was following reverse transcribed into complementary DNA (cDNA) with the PrimeScript® RT Reagent Kit (TaKaRa, Dalian, China) following the manufactures recommended protocol. Quantitative real-time PCR (qRT-PCR) assays were conducted using Power SYBR Green PCR Master Mix (Applied Biosystems, Foster City, CA, USA) on real-time PCR detection system. Primer sequences are listed as follows: KIF18A, 5′-TGGACTTACTTTACACCAGCCC-3′ (forward) and 5′-GCTGTTTTGTCTTGTTGTCGC-3′ (reverse); GAPDH, 5′-GGAGCGAGATCCCTCCAAAAT-3′ (forward) and 5′-GGCTGTTGTCATACTTCTCATGG-3′ (reverse). The mRNA abundance was normalized to GAPDH and was determined through 2-ΔΔCt method.
Two effective short hairpin RNAs (shRNAs) to specifically knock down KIF18A (sh-KIF18A#1 and #2) were constructed by shRNAs from Beijing Tsingke Biotech Co., Ltd. (Beiing, China) and the non-targeting shRNA (sh-NC) as negative control. Lentiviral particles were produced in 293T cells using a three-plasmid packaging construct, the shRNA-expressing plasmids being co-transfected with lentiviral packaging plasmids by Lipofectamine™ 3000 Transfection Reagent (Invitrogen, Waltham, MA, USA). Viral supernatants were harvested 48 h later. The lentiviral particles were used to infect the OS cells in 4 µg/mL polybrene (Sigma-Aldrich, St. Louis, MO, USA) for 72 h, and were selected with 1 µg/mL puromycin for 1 week to obtained the stable KIF18A-knockdown cell lines. KIF18A overexpression was transfected with pcDNA3.1-KIF18A expression plasmid and empty pcDNA3.1 vector (Hanbio Biotechnology, Shanghai, China), respectively with LipofectamineTM 3000. We confirm the efficiency of KIF18A knockdown and overexpression by quantitative real-time PCR (qRT-PCR) and Western blot analysis. Sequences of the target shRNA was described below:
sh-KIF18A#1: CCCGATTTGTAGAAGGCACAA
sh-KIF18A#2: CGCTTGTTAAAGGATTCTCTT
Cell proliferation was assessed by Cell Counting Kit-8 (CCK-8) assay, colony
formation assay and 5-ethynyl-2′-deoxyuridine (EdU) incorporation assay. In
the CCK-8 assay, transfected OS cells (2
Transwell migration and invasion assays were carried out using Corning
Transwell-24-well plates with 8.0 µm Pore Polyester Membrane Insert
(Corning, NY, USA). Transfected OS cells (1
Transfected OS cells (1
The Annexin V-FITC/PI Apoptosis Detection Kit (556547, BD Biosciences, San Jose,
CA, USA) was used following the manufacturer’s protocol. Briefly, transfected OS
cells (1
Equal quantities of extracted proteins were resolved by SDS-PAGE using a 10%
gel and subsequently transferred onto polyvinylidene difluoride (PVDF) membranes.
The membranes were incubated with a 5% (w/v) solution of nonfat dried milk for
blocking, followed by overnight incubation at 4 °C with primary
antibodies. Following this, the membranes were probed with horseradish
peroxidase-conjugated secondary antibody (1:5000, sc-2357, Santa Cruz
Biotechnology, Santa Cruz, USA). Protein signals were visualized with an enhanced
chemiluminescence (ECL) kit (180-5001, Tanon, Shanghai, China), and the intensity
of the bands was quantified using ImageJ software. Primary antibodies were:
anti-KIF18A (1:1000, ab251863, Abcam, Cambridge, UK), anti-Bax (1:1000, ab32503,
Abcam, Cambridge, UK), anti-Bcl-2 (1:1000, ab59348, Abcam, Cambridge, UK),
anti-Cleaved Caspase-3 (1:1000, ab2302, Abcam, Cambridge, UK), anti-PARP1
(1:1000, ab32138, Abcam, Cambridge, UK), anti-Cleaved PARP1 (1:1000, ab32064,
Abcam, Cambridge, UK), as well as the internal loading controls
anti-
Ten BALB/c nude male mice (4–6 weeks old; body weight 18–24 g) were purchased
from Shanghai SLAC Laboratory Animal Co., Ltd. (Shanghai, China). They were
equally classified into two groups (n = 5 per group), injected subcutaneously
with U2OS cells stably transfected with either sh-KIF18A or
sh-NC. 1
IHC was performed as previously described [38]. In brief, xenograft sections from paraffin were incubated at 4 °C in a humid chamber with primary antibodies against Ki-67 (1:500, ab15580, Abcam, Cambridge, UK) and KIF18A (1:500, ab251863, Abcam, Cambridge, UK). The proteins were visualized in situ using the BioGenex Super Sensitive LinkLabel IHC Detection System (BioGenex, Fremont, CA, USA).
R and GraphPad Prism 10 (San Diego, CA, USA) were applied to statistical
analyses of this study. Differences between two groups were analyzed by Student’s
t test and those between multi-groups were analyzed by one-way ANOVA,
and the chi-square test was done to analyze the comparison of the rate of the
category. Spearman’s correlation analysis was done to analyze the correlation of
expression levels. Survival curves were depicted with Kaplan-Meier and
differences were analyzed by Log-rank test. The data are expressed as mean
Firstly, we identified the KIFs family in OS patients of the TARGET database and analyzed their underlying protein interaction based on the STRING database (Fig. 1A). Using the cytohubba plugin in Cytoscape software, we noticed that the KIF20A, KIF15, KIF6, KIF13B, KIF16B, KIF23, KIF11, KIF22, KIF18A and KIF2A were the key nodes of the protein-protein interaction network (Fig. 1B). We examined the expression levels of 40 kinesin family genes in the GSE126209 OS dataset by comparing tumor tissues with adjacent non-cancerous tissues (Fig. 1C,D). Analysis revealed that KIF18A was significantly overexpressed in cancerous tissues (p = 0.0009) (Fig. 1D). Then, we evaluated the expression level of the KIFs family in metastatic (n = 22) and non-metastatic (n = 64) OS patients in TARGET-OS database. We found that all members of the KIF family are not statistically significant in terms of survival analysis (Fig. 1E,F). However, considering the relatively small sample size of the TARGET-OS, we believe this limitation can be relaxed. Therefore, due to the higher expression of KIF18A in OS, we chose KIF18A for further study. Not surprisingly, we identified that KIF18A was upregulated in OS tissues compared with its paired non-tumorous tissues (Fig. 1G) and showed significantly greater expression in metastatic tissues as well (Fig. 1H). To examine the potential correlation between the expression of KIF18A and clinical features, we performed an analysis of KIF18A expression and some clinical features of 79 patients with OS. According to the mean expression level of KIF18A, the samples were divided into 2 groups, the KIF18A high expression group and the KIF18A low expression group. Table 1 showed that KIF18A expression was significantly correlated with different clinical parameters, such as tumor size (p = 0.011), distant metastasis (p = 0.041), TNM stage (p = 0.022), and degree of differentiation (p = 0.002). We also evaluated the prognostic meaning of KIF18A. Kaplan-Meier analysis revealed that OS with high expression of KIF18A showed poor overall survival (Fig. 1I). Thus, the present results imply that KIF18A is over-expressed in OS and has a prognostic value for patients with OS.
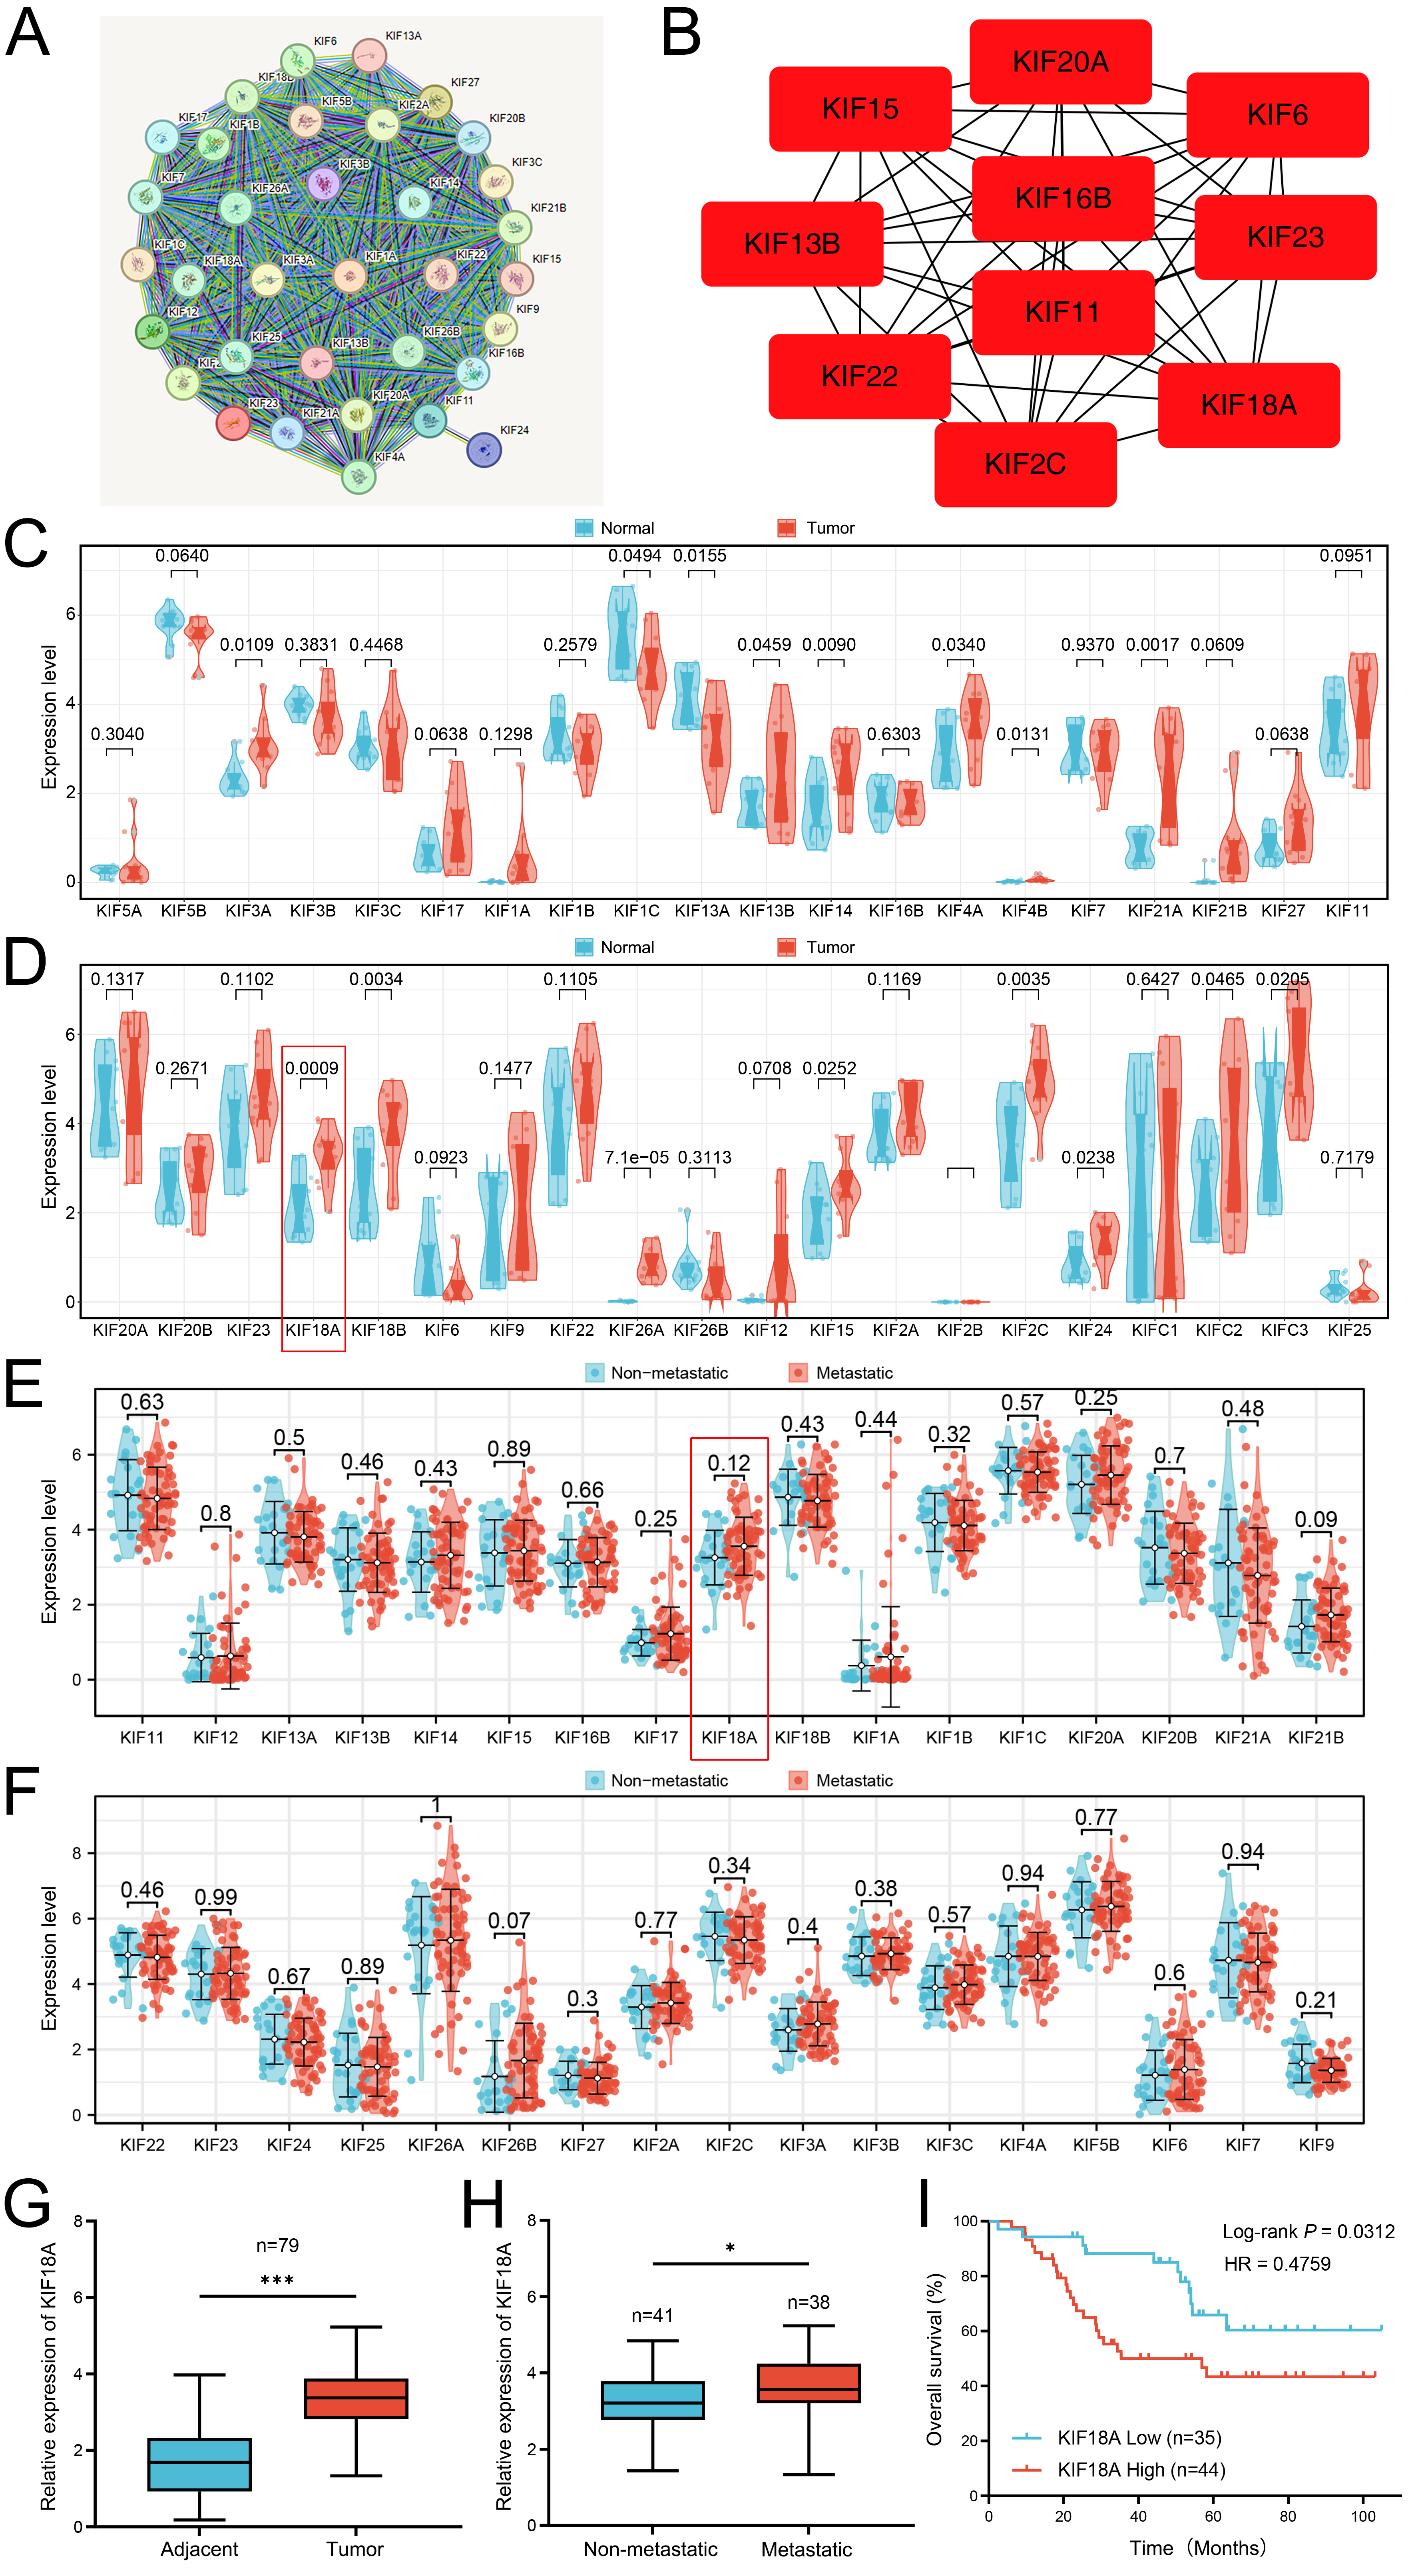 Fig. 1.
Identification of KIFs family in the OS patients. (A) The
protein-protein interaction network of KIFs family in OS. (B) The key
nodes identified by cytoHubba plug-in in the cytoscape software. (C,D)
Expression profiling of KIFs family in tumor tissues compared to paired adjacent
normal tissues. (E,F) The expression level of KIFs family in metastatic and
non-metastatic OS patients. (G) qRT-PCR was used to detect the
expression level of KIF18A in OS tissues (n = 79) and corresponding
adjacent normal tissues (n = 79). (H) qRT-PCR was used to
evaluate the expression level of KIF18A in OS tissues with (n = 38) or
without metastasis (n = 41). (I) Kaplan–Meier analysis was conducted on OS
patients categorized by low (n = 35) and high (n = 44) expression levels of
KIF18A. Statistical analysis for (C,D,G) was conducted using Paired
Samples t-test, whereas Independent Samples t-test was utilized
for (E,F,H). Data are shown as mean
| Variable | KIF18A Expression | p-value | ||
| Low | High | |||
| Gender | ||||
| Male | 17 | 23 | 0.822 | |
| Female | 18 | 21 | ||
| Age | ||||
| 24 | 27 | 0.636 | ||
| 11 | 17 | |||
| Location | ||||
| Tibia/femur | 16 | 24 | 0.500 | |
| Elsewhere | 19 | 20 | ||
| Tumor Size | ||||
| 21 | 13 | 0.011* | ||
| 14 | 31 | |||
| Distant Metastasis | ||||
| Absent | 23 | 18 | 0.041* | |
| Present | 12 | 26 | ||
| TNM | ||||
| I/II | 21 | 14 | 0.022* | |
| III/IV | 14 | 30 | ||
| Differentiated Degree | ||||
| High/middle | 22 | 12 | 0.002* | |
| Low/undifferentiation | 13 | 32 | ||
Low/high by the sample median. Pearson
KIF18A, Kinesin family member 18A; TNM, Tumor Node Metastasis.
Moreover, we explored the biological function of KIF18A in OS patients.
GSEA based on the Hallmark gene set revealed that in OS patients exhibiting
elevated KIF18A expression, several pathways were significantly
upregulated, including KRAS signaling, E2F targets, G2M checkpoint, mitotic
spindle formation, cholesterol homeostasis, androgen response, and
Wnt/
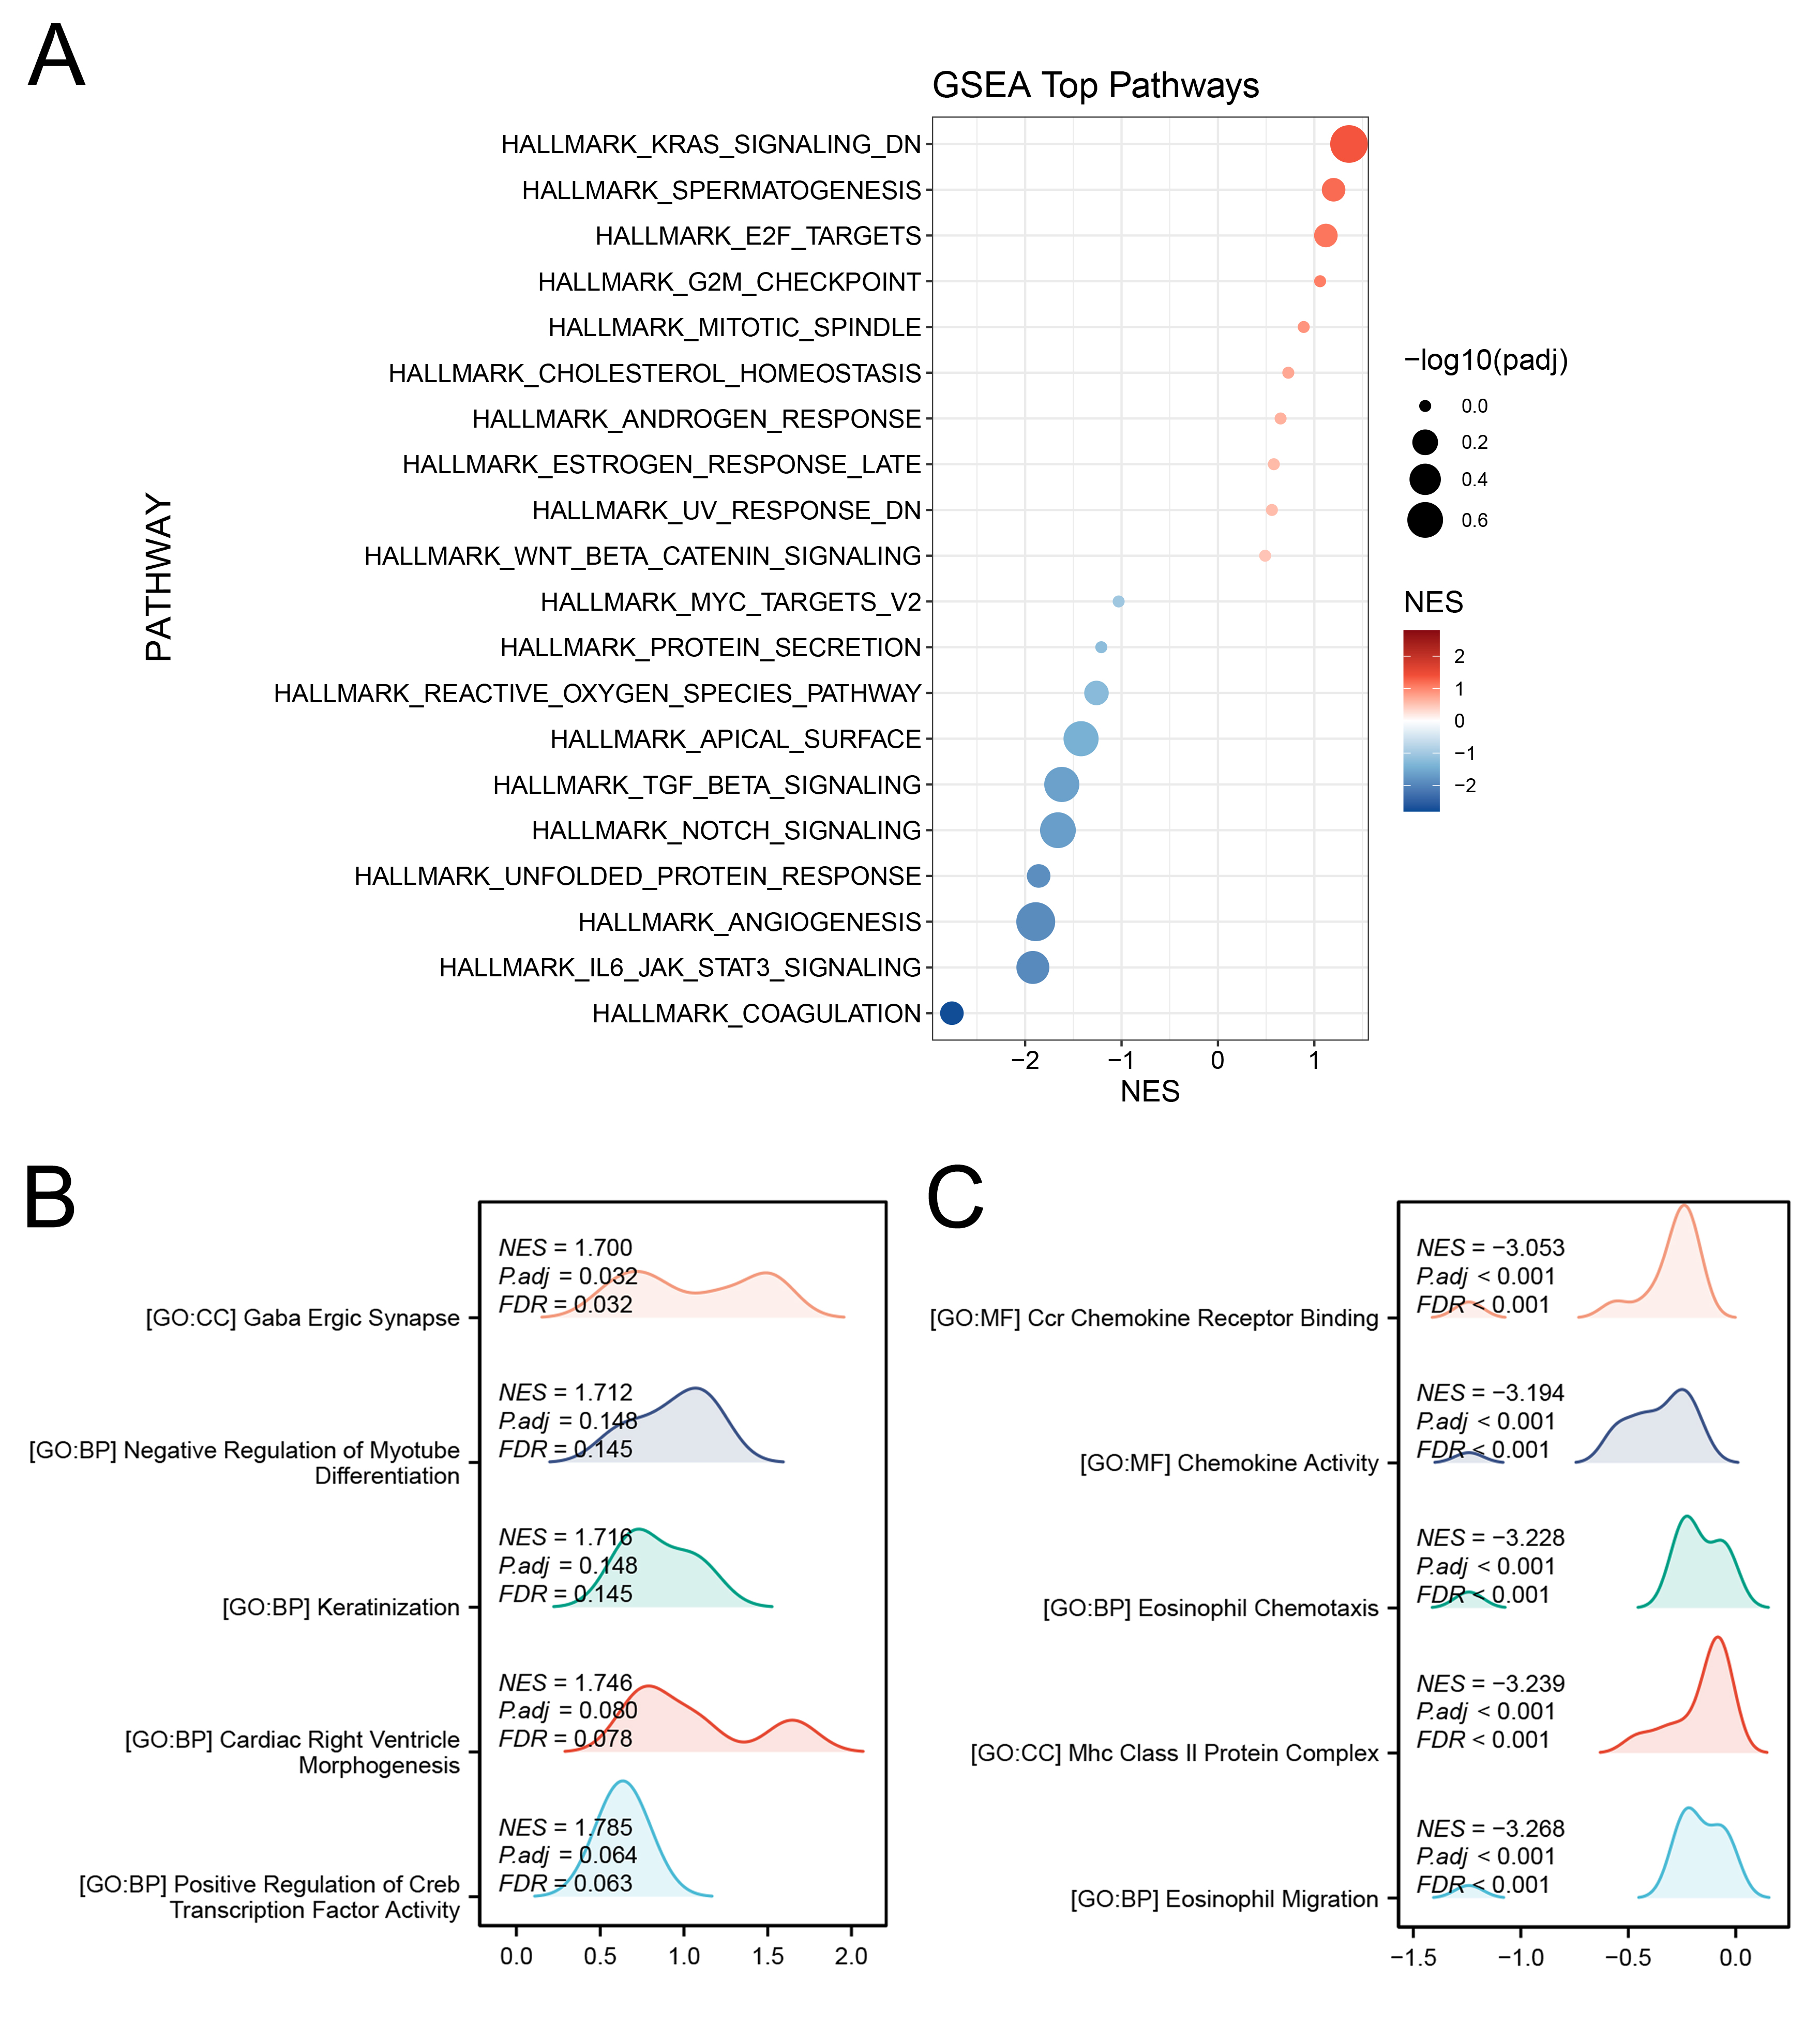 Fig. 2.
Biological role of KIF18A in OS. (A) GSEA analysis of KIF18A based on Hallmark gene set. The color scheme represents the Normalized Enrichment Score (NES), while circle size corresponds to -log₁₀(adjusted p-value), reflecting the level of statistical significance for each enriched pathway. (B,C) GSEA analysis of KIF18A based on GO gene set. GSEA, Gene Set Enrichment Analysis.
Since the function of KIF18A in OS has not been fully elucidated, we first assessed its expression levels in OS cell lines and clinical tissue specimens. Subsequently, we explored the impact of KIF18A on the biological behaviors of OS cells. KIF18A expression was assessed in OS cell lines in comparison to normal hFOB cells. Both mRNA and protein levels of KIF18A were markedly increased in OS cell lines relative to normal controls, with protein expression levels showing a strong correlation to the corresponding mRNA expression trends (Fig. 3A,B). Then, we tried to knock down the KIF18A expression and found that the sh-KIF18A#2 exhibited the highest knockdown efficiency (Fig. 3C,D). Colony formation and CCK8 assay indicated that the inhibition of KIF18A can significantly suppress the proliferation ability of OS cells (Fig. 3E–G). Also, the EdU assay indicated a significantly reduced ratio of EdU-positive cells in the KIF18A knockdown group compared with the normal group (Fig. 3H). Transwell assay results demonstrated that silencing KIF18A significantly suppressed the invasive and migratory capacities of OS cells (Fig. 4A). The wound-healing assay also indicated the same trend (Fig. 4B). Furthermore, we constructed a plasmid for the overexpression of KIF18A and observed a significant increase in KIF18A levels in OS cells following plasmid transfection (Supplementary Fig. 1A–C). KIF18A overexpression enhances the proliferation (Supplementary Fig. 1D–G), invasion (Supplementary Fig. 2A), and migration (Supplementary Fig. 2B) of OS cells.
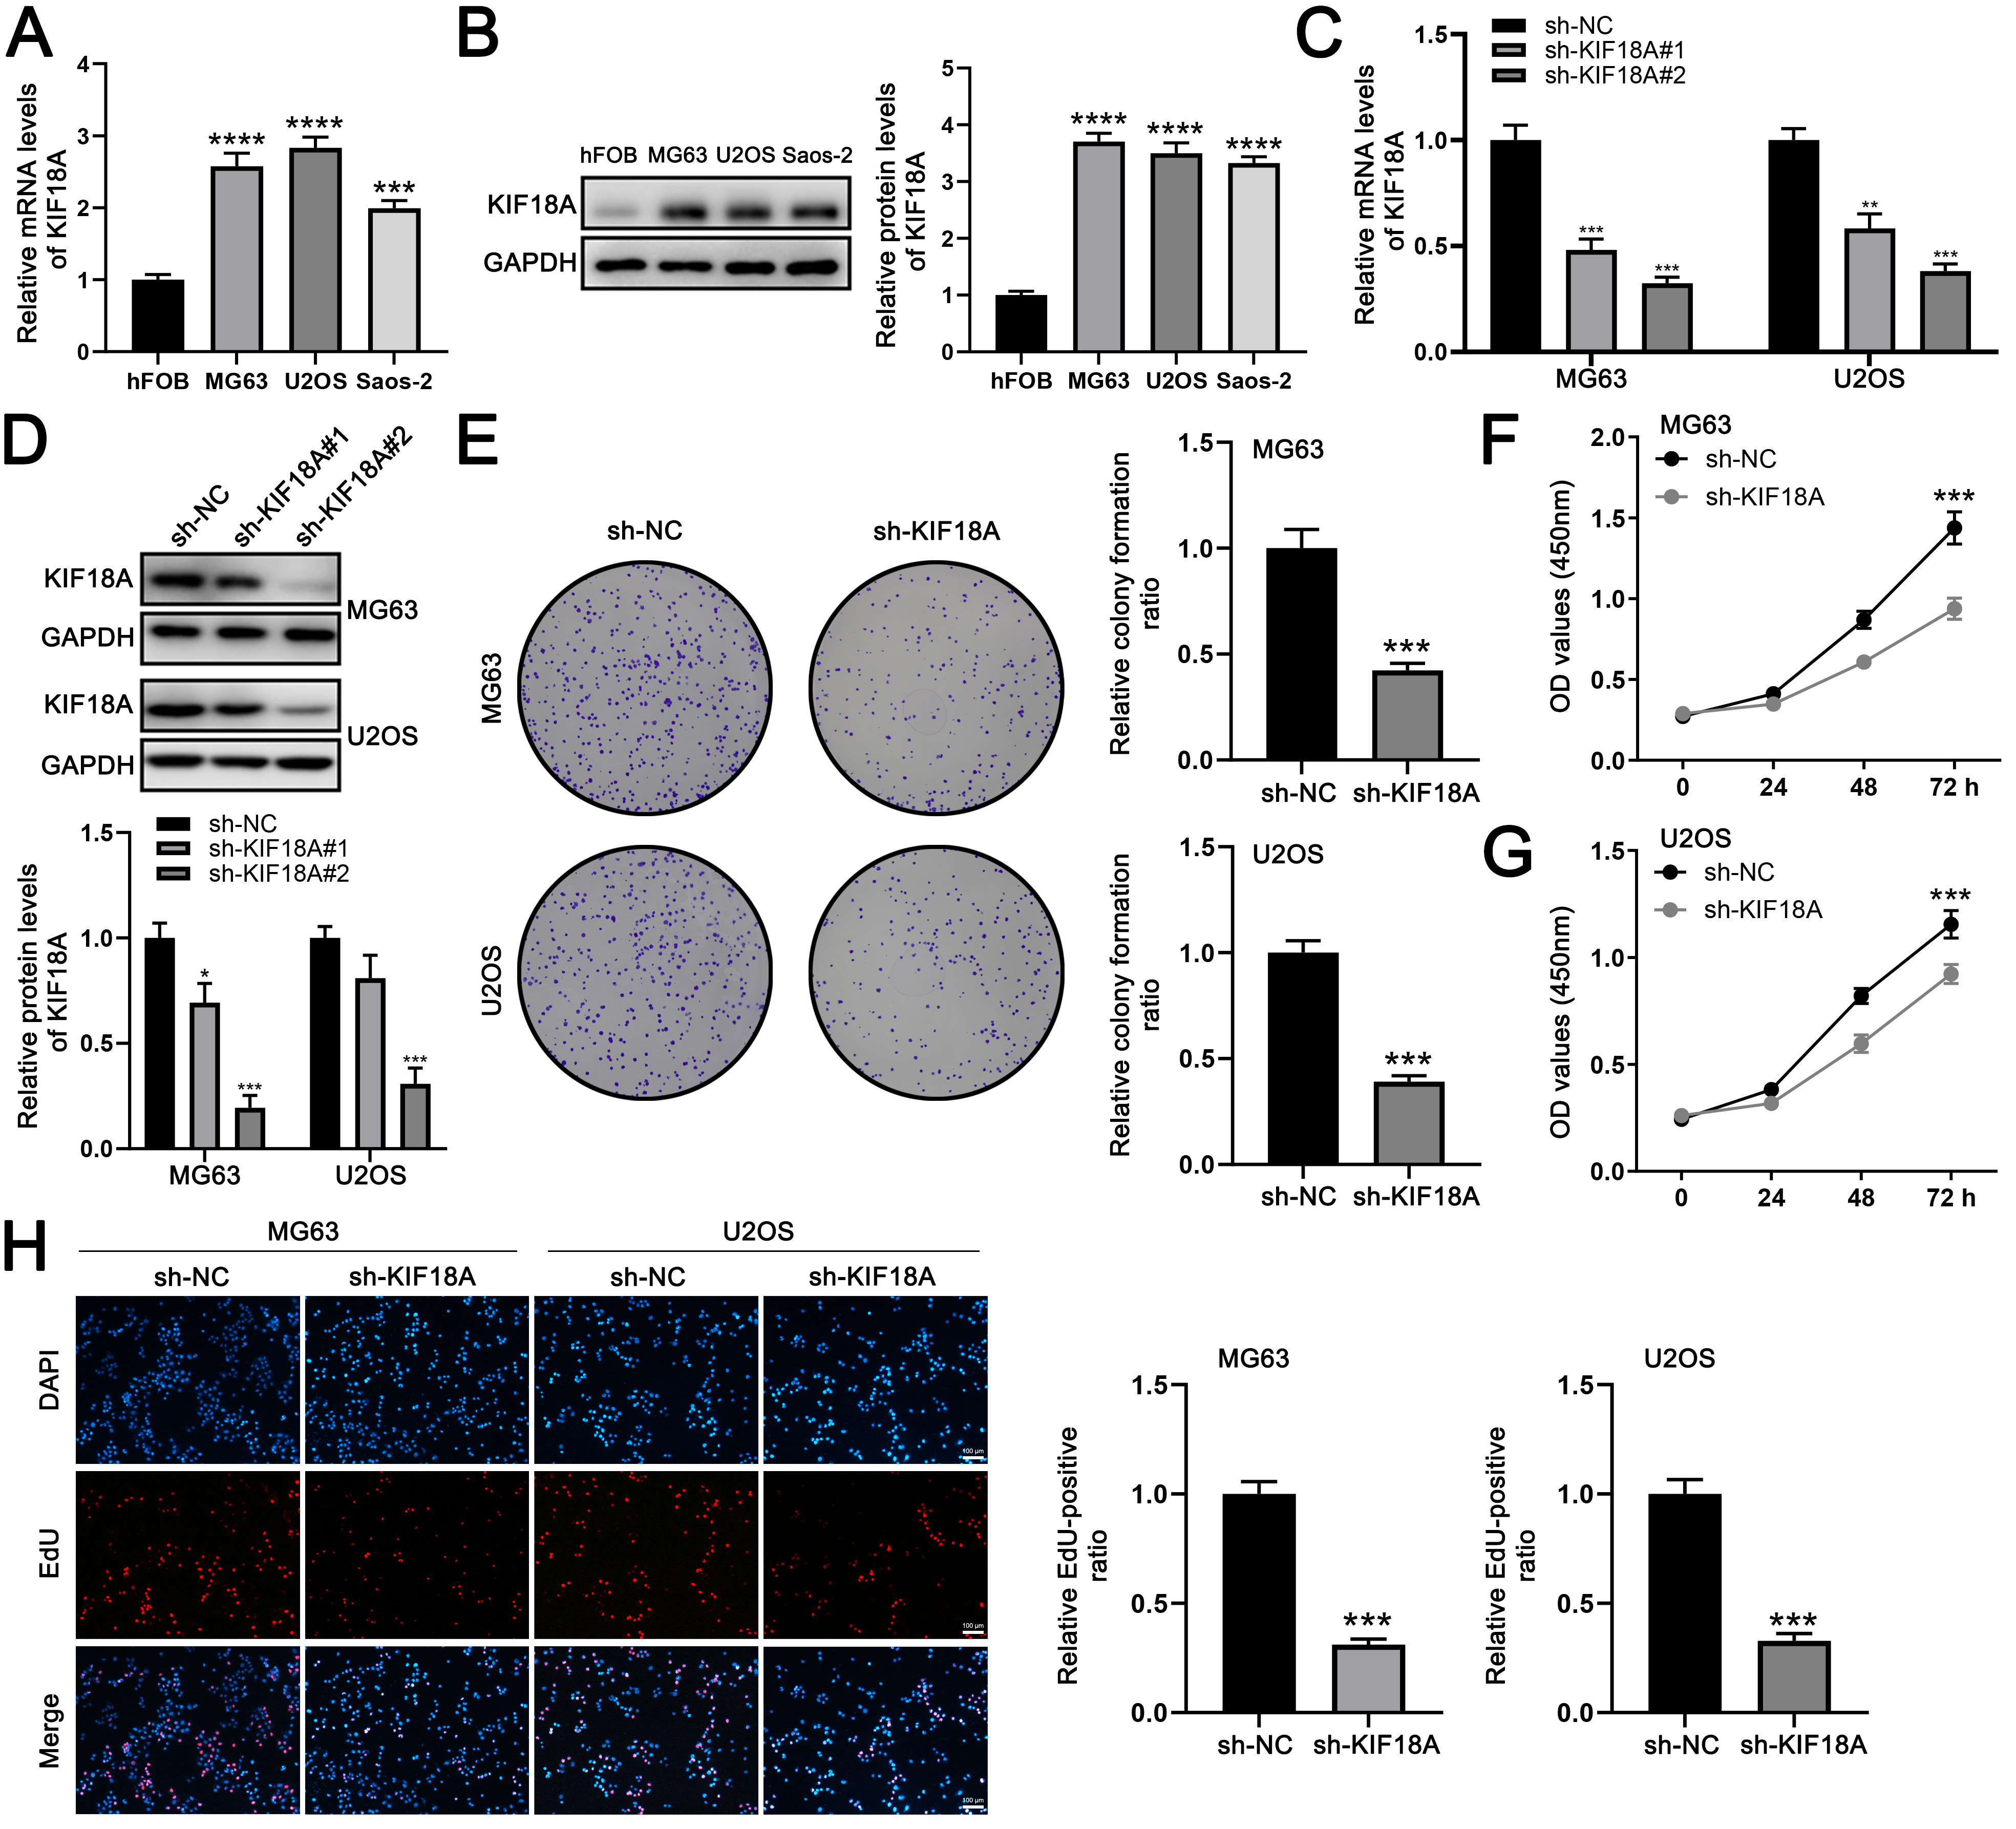 Fig. 3.
KIF18A promotes the proliferation ability of OS cells.
(A) The expression level of KIF18A in OS and normal cells. (B)
Western blot analysis was performed to detect the expression of the indicated
proteins in OS and normal control cell lines. (C) qRT-PCR was used to evaluate
the knockdown efficiency of KIF18A. (D) Western blot analysis
was conducted to evaluate the expression of the indicated proteins in OS cells 48
hours post-transfection with sh-KIF18A lentiviruses. (E–G) Colony formation and CCK-8 assays were conducted to compare
KIF18A-knockdown cells with control cells. (H) EdU assays were
conducted in both KIF18A-knockdown and control cells. Scale bar: 100
µm. Statistical analysis for (A–E) was conducted using Independent
Samples t-test. Data are shown as mean
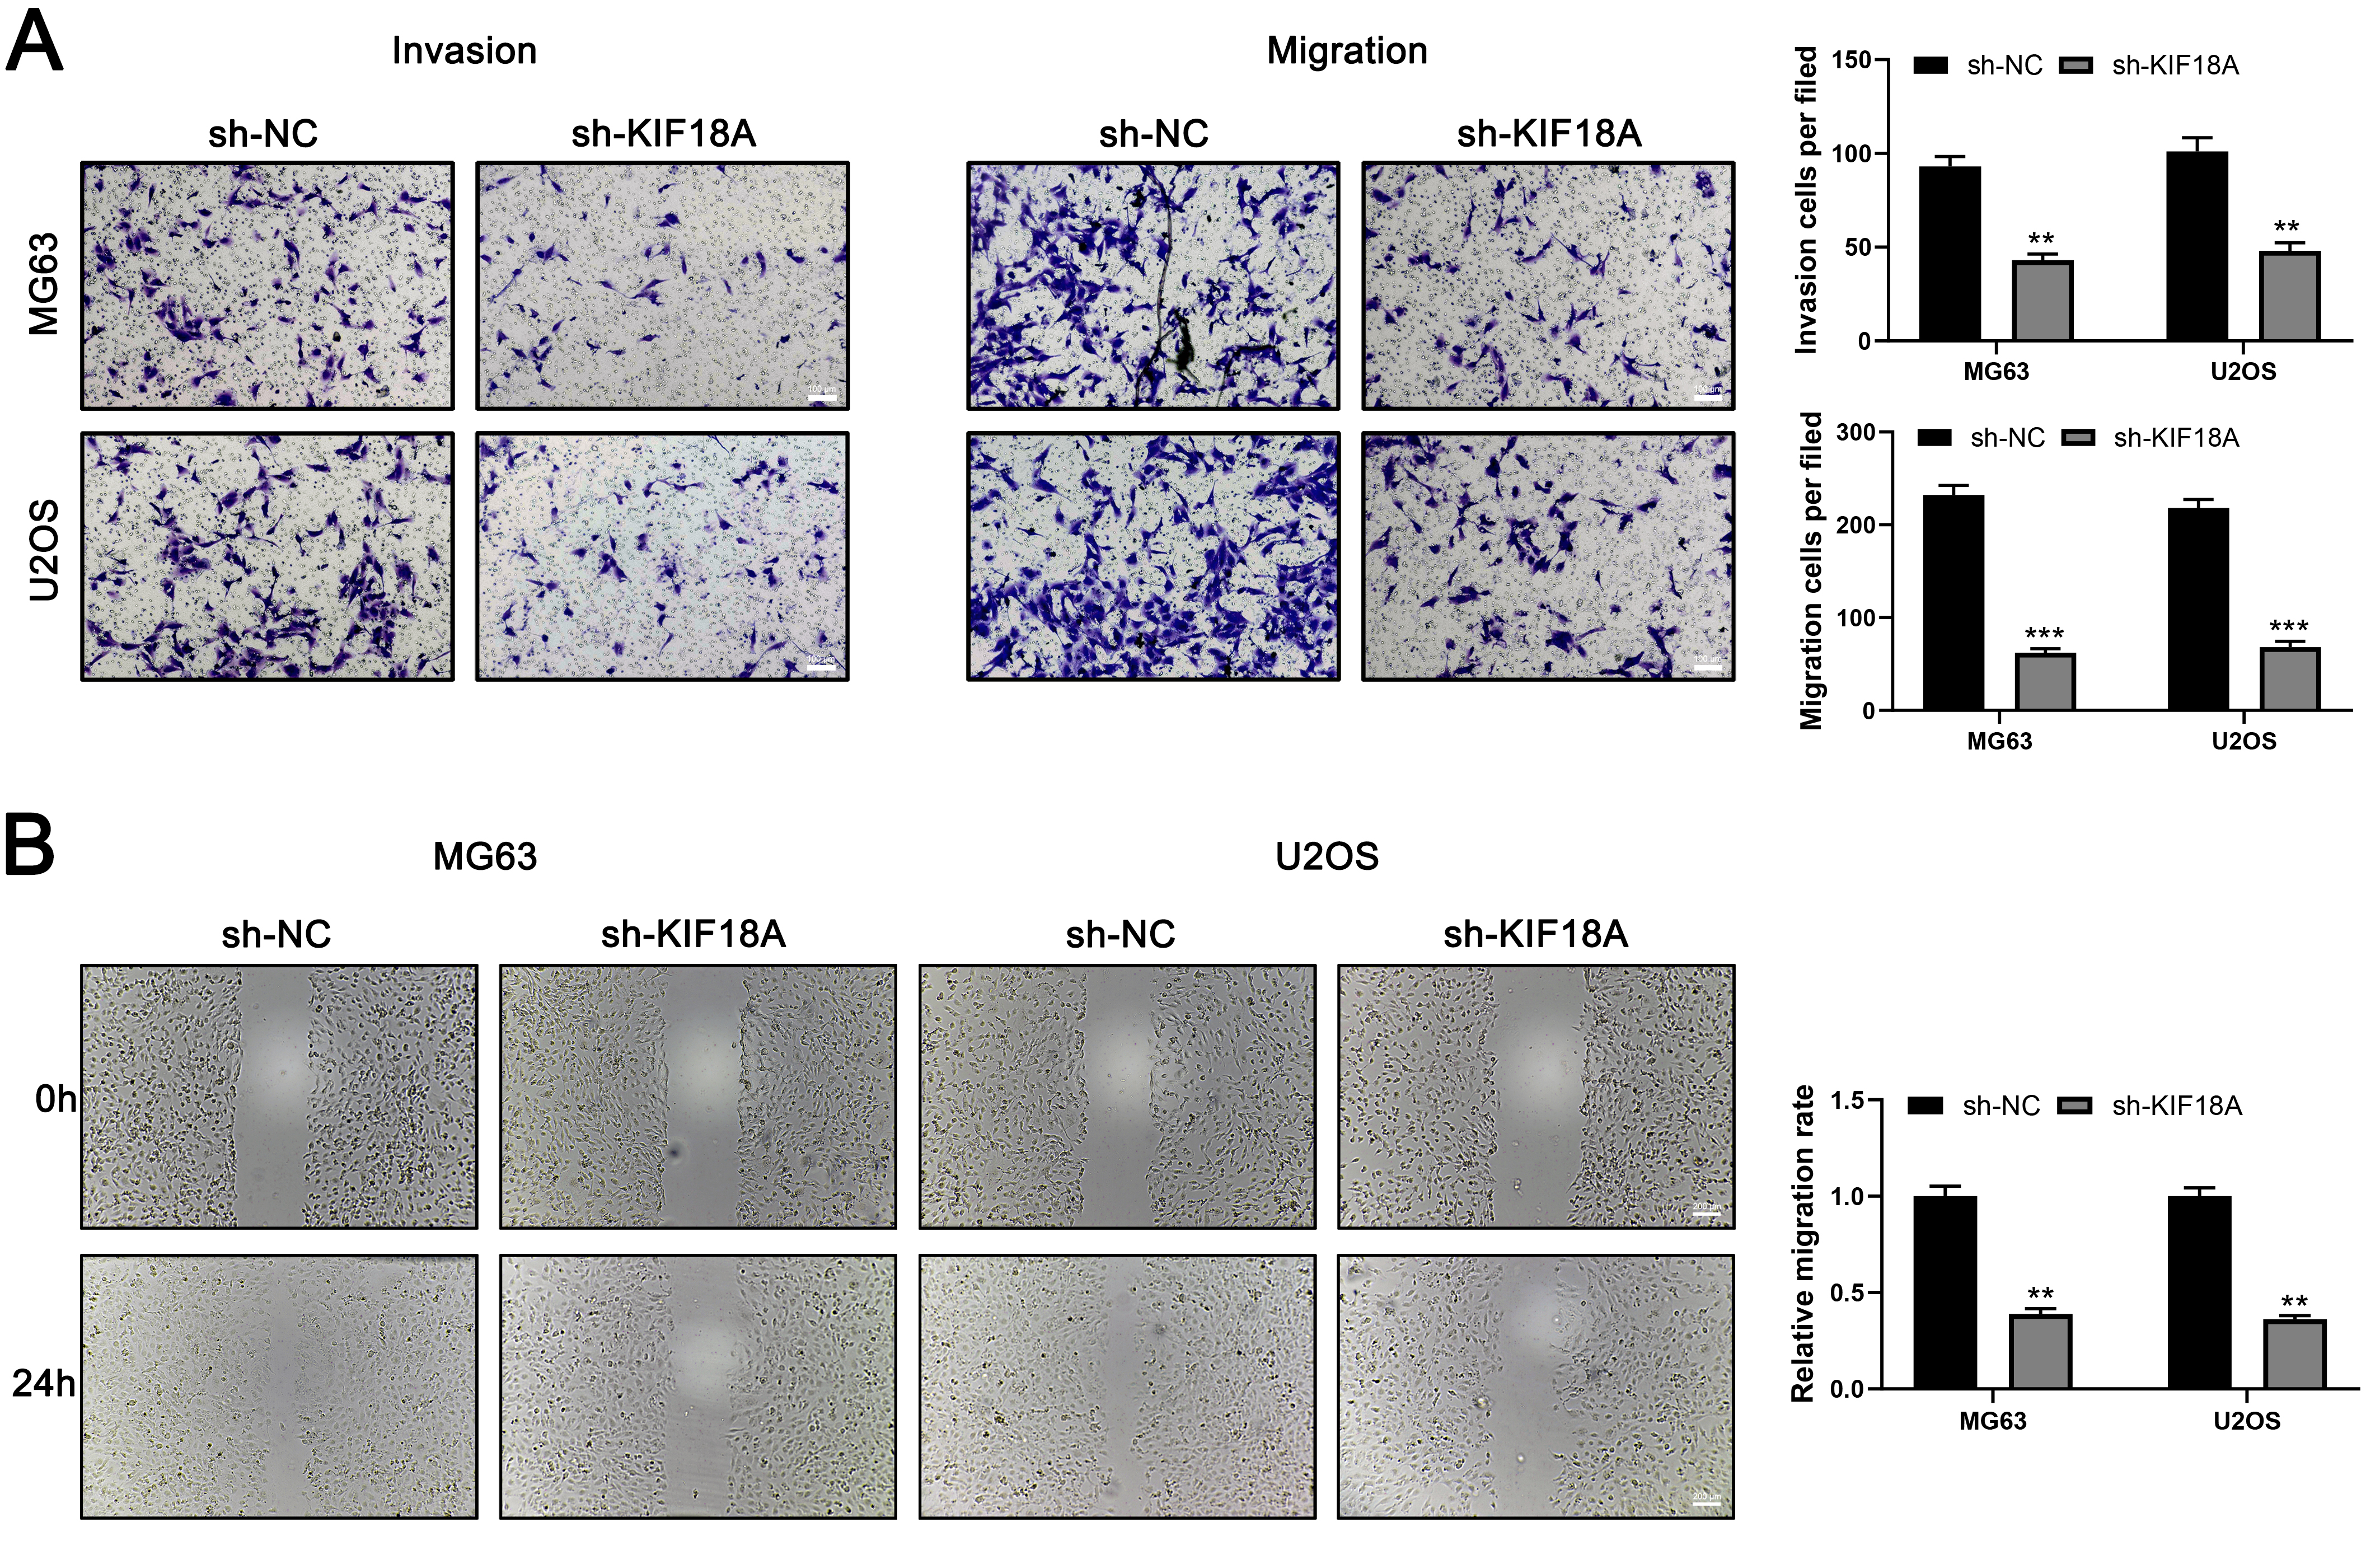 Fig. 4.
KIF18A promote invasion and migration ability of OS
cells. (A) Transwell assay was performed in control and KIF18A
knockdown cells. Scale bar: 100 µm. (B) Wound-healing assay was
conducted in control and KIF18A knockdown cells. Scale bar: 200
µm. Statistical analysis for (A,B) was conducted using Independent
Samples t-test. Data are shown as mean
Then we transfected sh-KIF18A into the OS cells in order to study the effect of KIF18A on cellular apoptosis. By cell apoptosis analysis, we observed that the rate of cell apoptosis was increased remarkably in MG63 and U2OS cells treated with KIF18A knockdown (Fig. 5A). In accordance with these observations, the expressions of the apoptosis-related protein, Cleaved Caspase-3, Cleaved PARP, and Bax, was significantly upregulated in KIF18A knockdown cells (Fig. 5B). Conversely, the expression of Bcl-2 was notably downregulated (Fig. 5B). The data indicate that the downregulation of KIF18A expression in MG63 and U2OS cells triggers apoptosis.
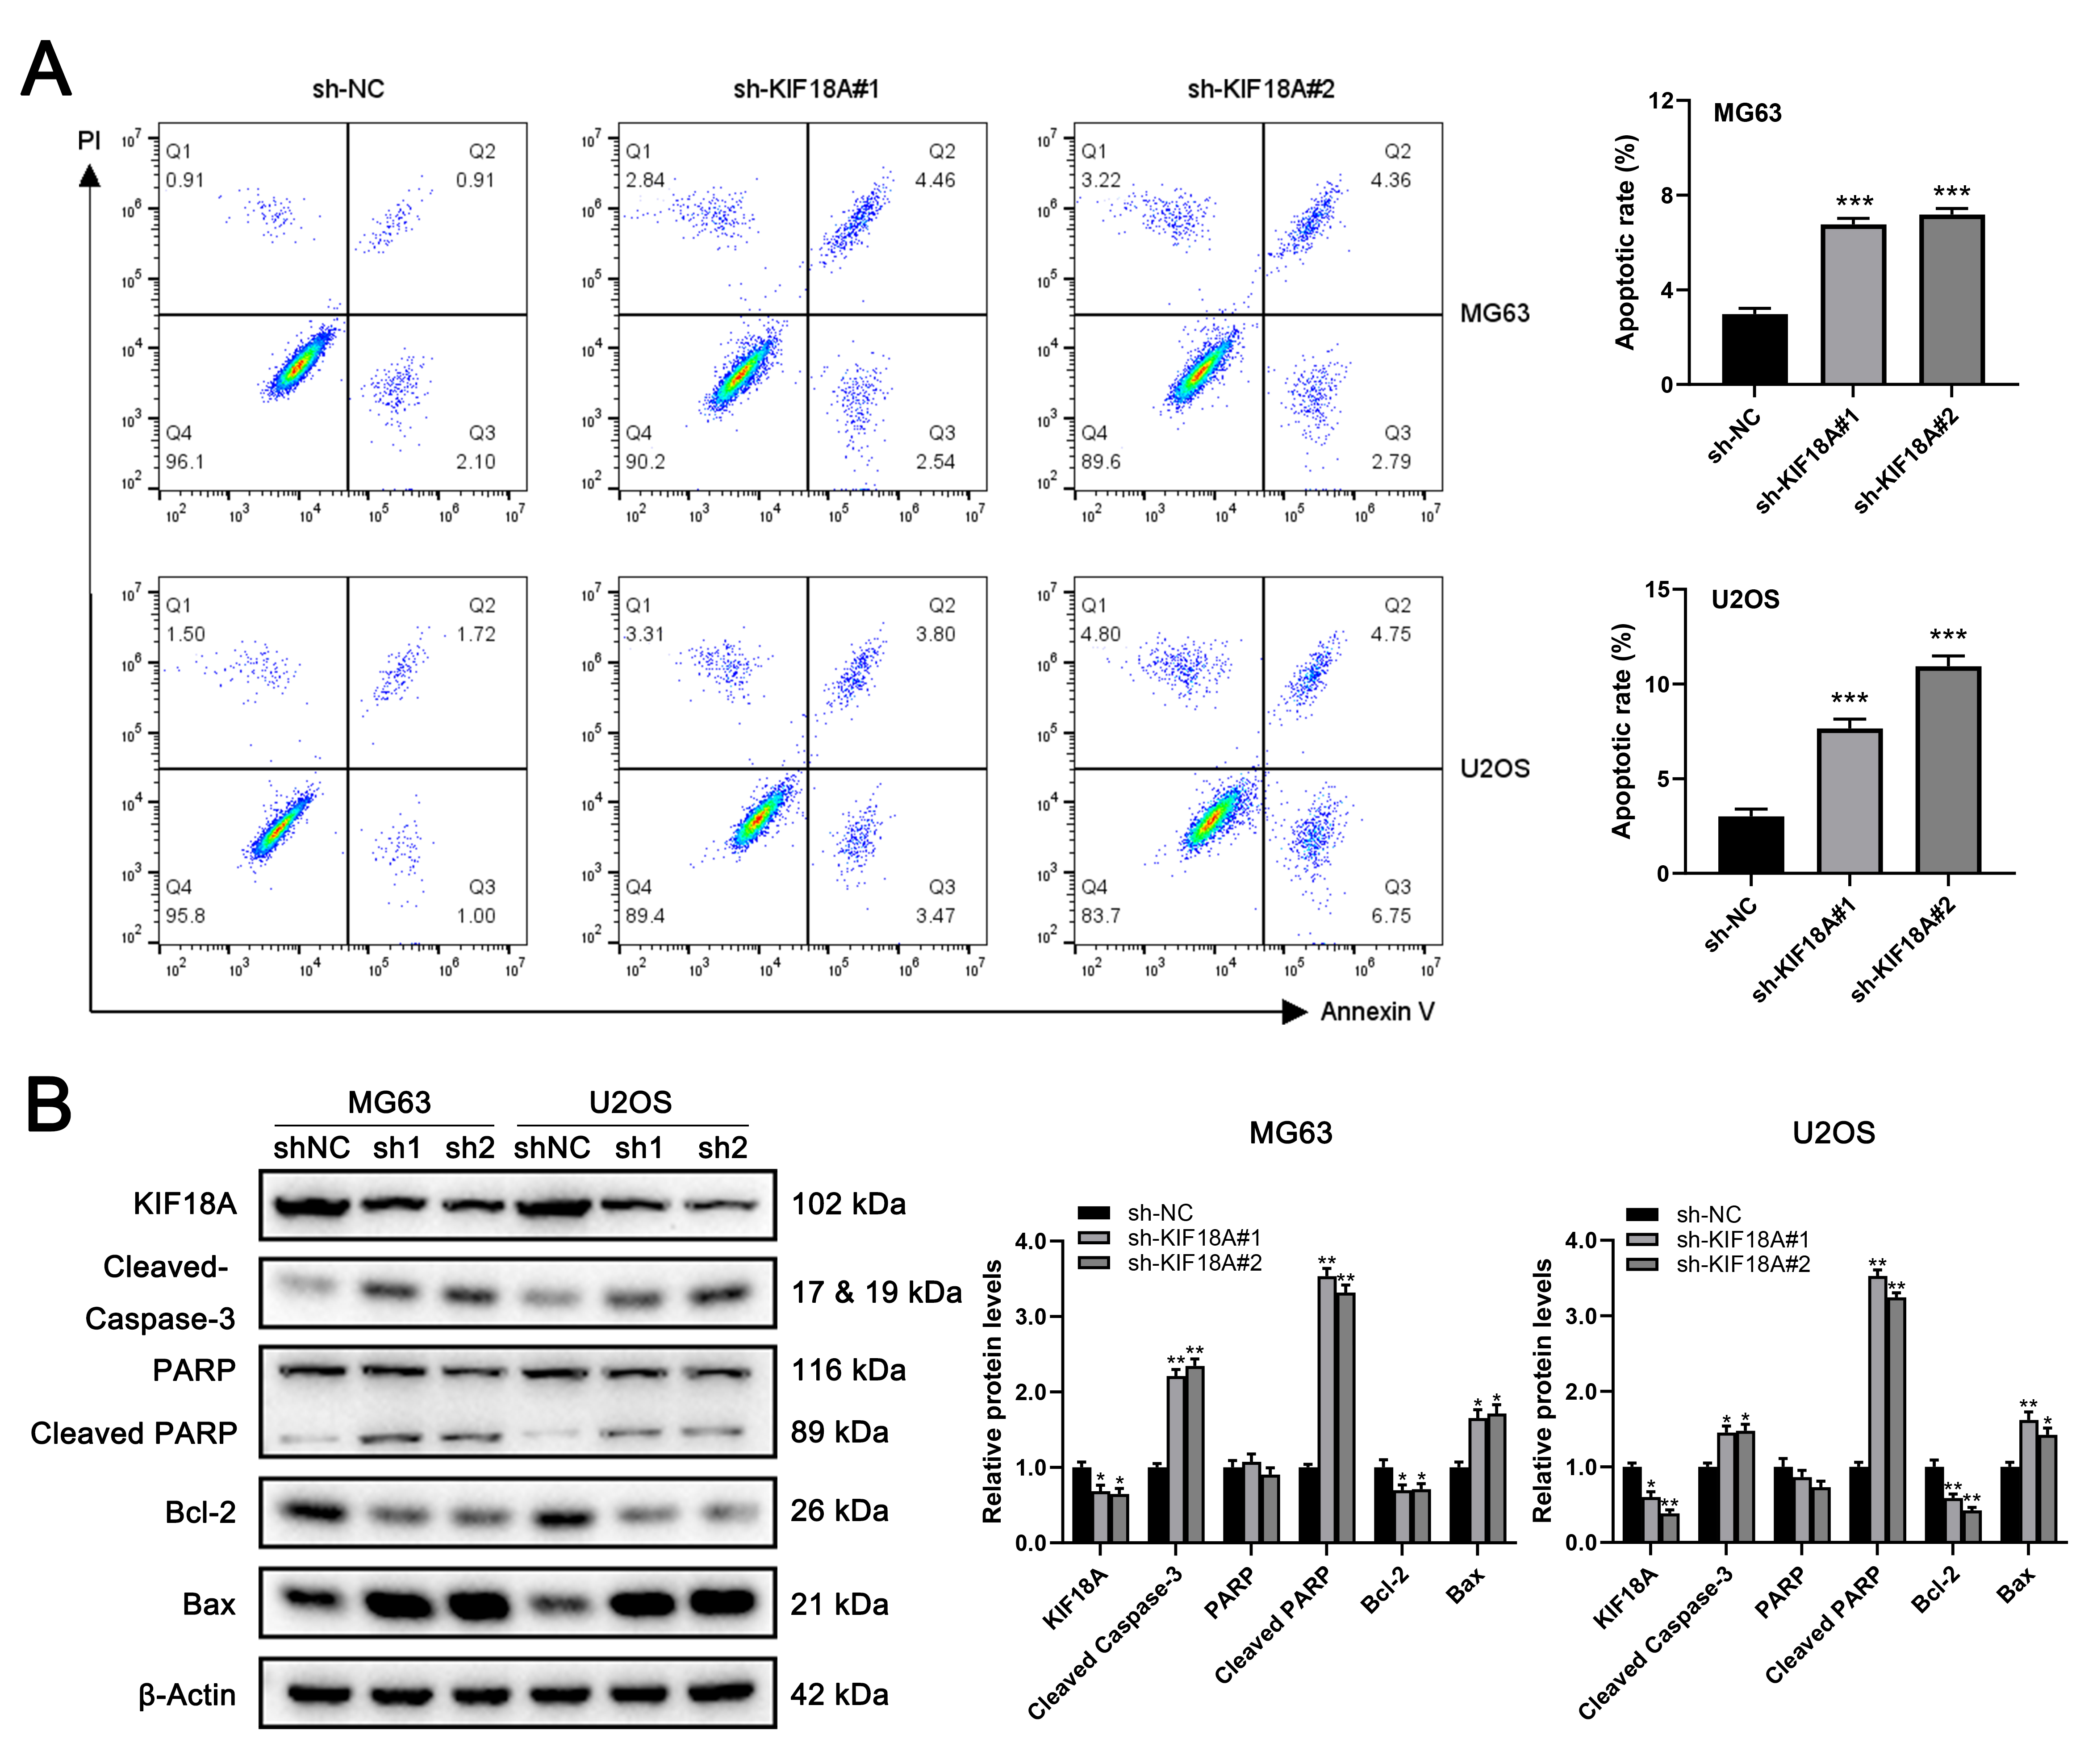 Fig. 5.
Knockdown of KIF18A promotes apoptosis of OS cells. (A) The apoptosis of MG63 and U2OS cells was assessed through an
apoptosis assay, conducted both with and without the silencing of
KIF18A. (B) Western blotting was performed to evaluate
the expression of apoptosis-associated proteins after transfection with
sh-NC or sh-KIF18A. Statistical analysis for A and B
was conducted using Independent Samples t-test. Data are shown as mean
We subsequently examined the impact of KIF18A on the growth of OS cells
in vivo. While all U2OS cells were capable of tumor formation when
injected at a density of 1
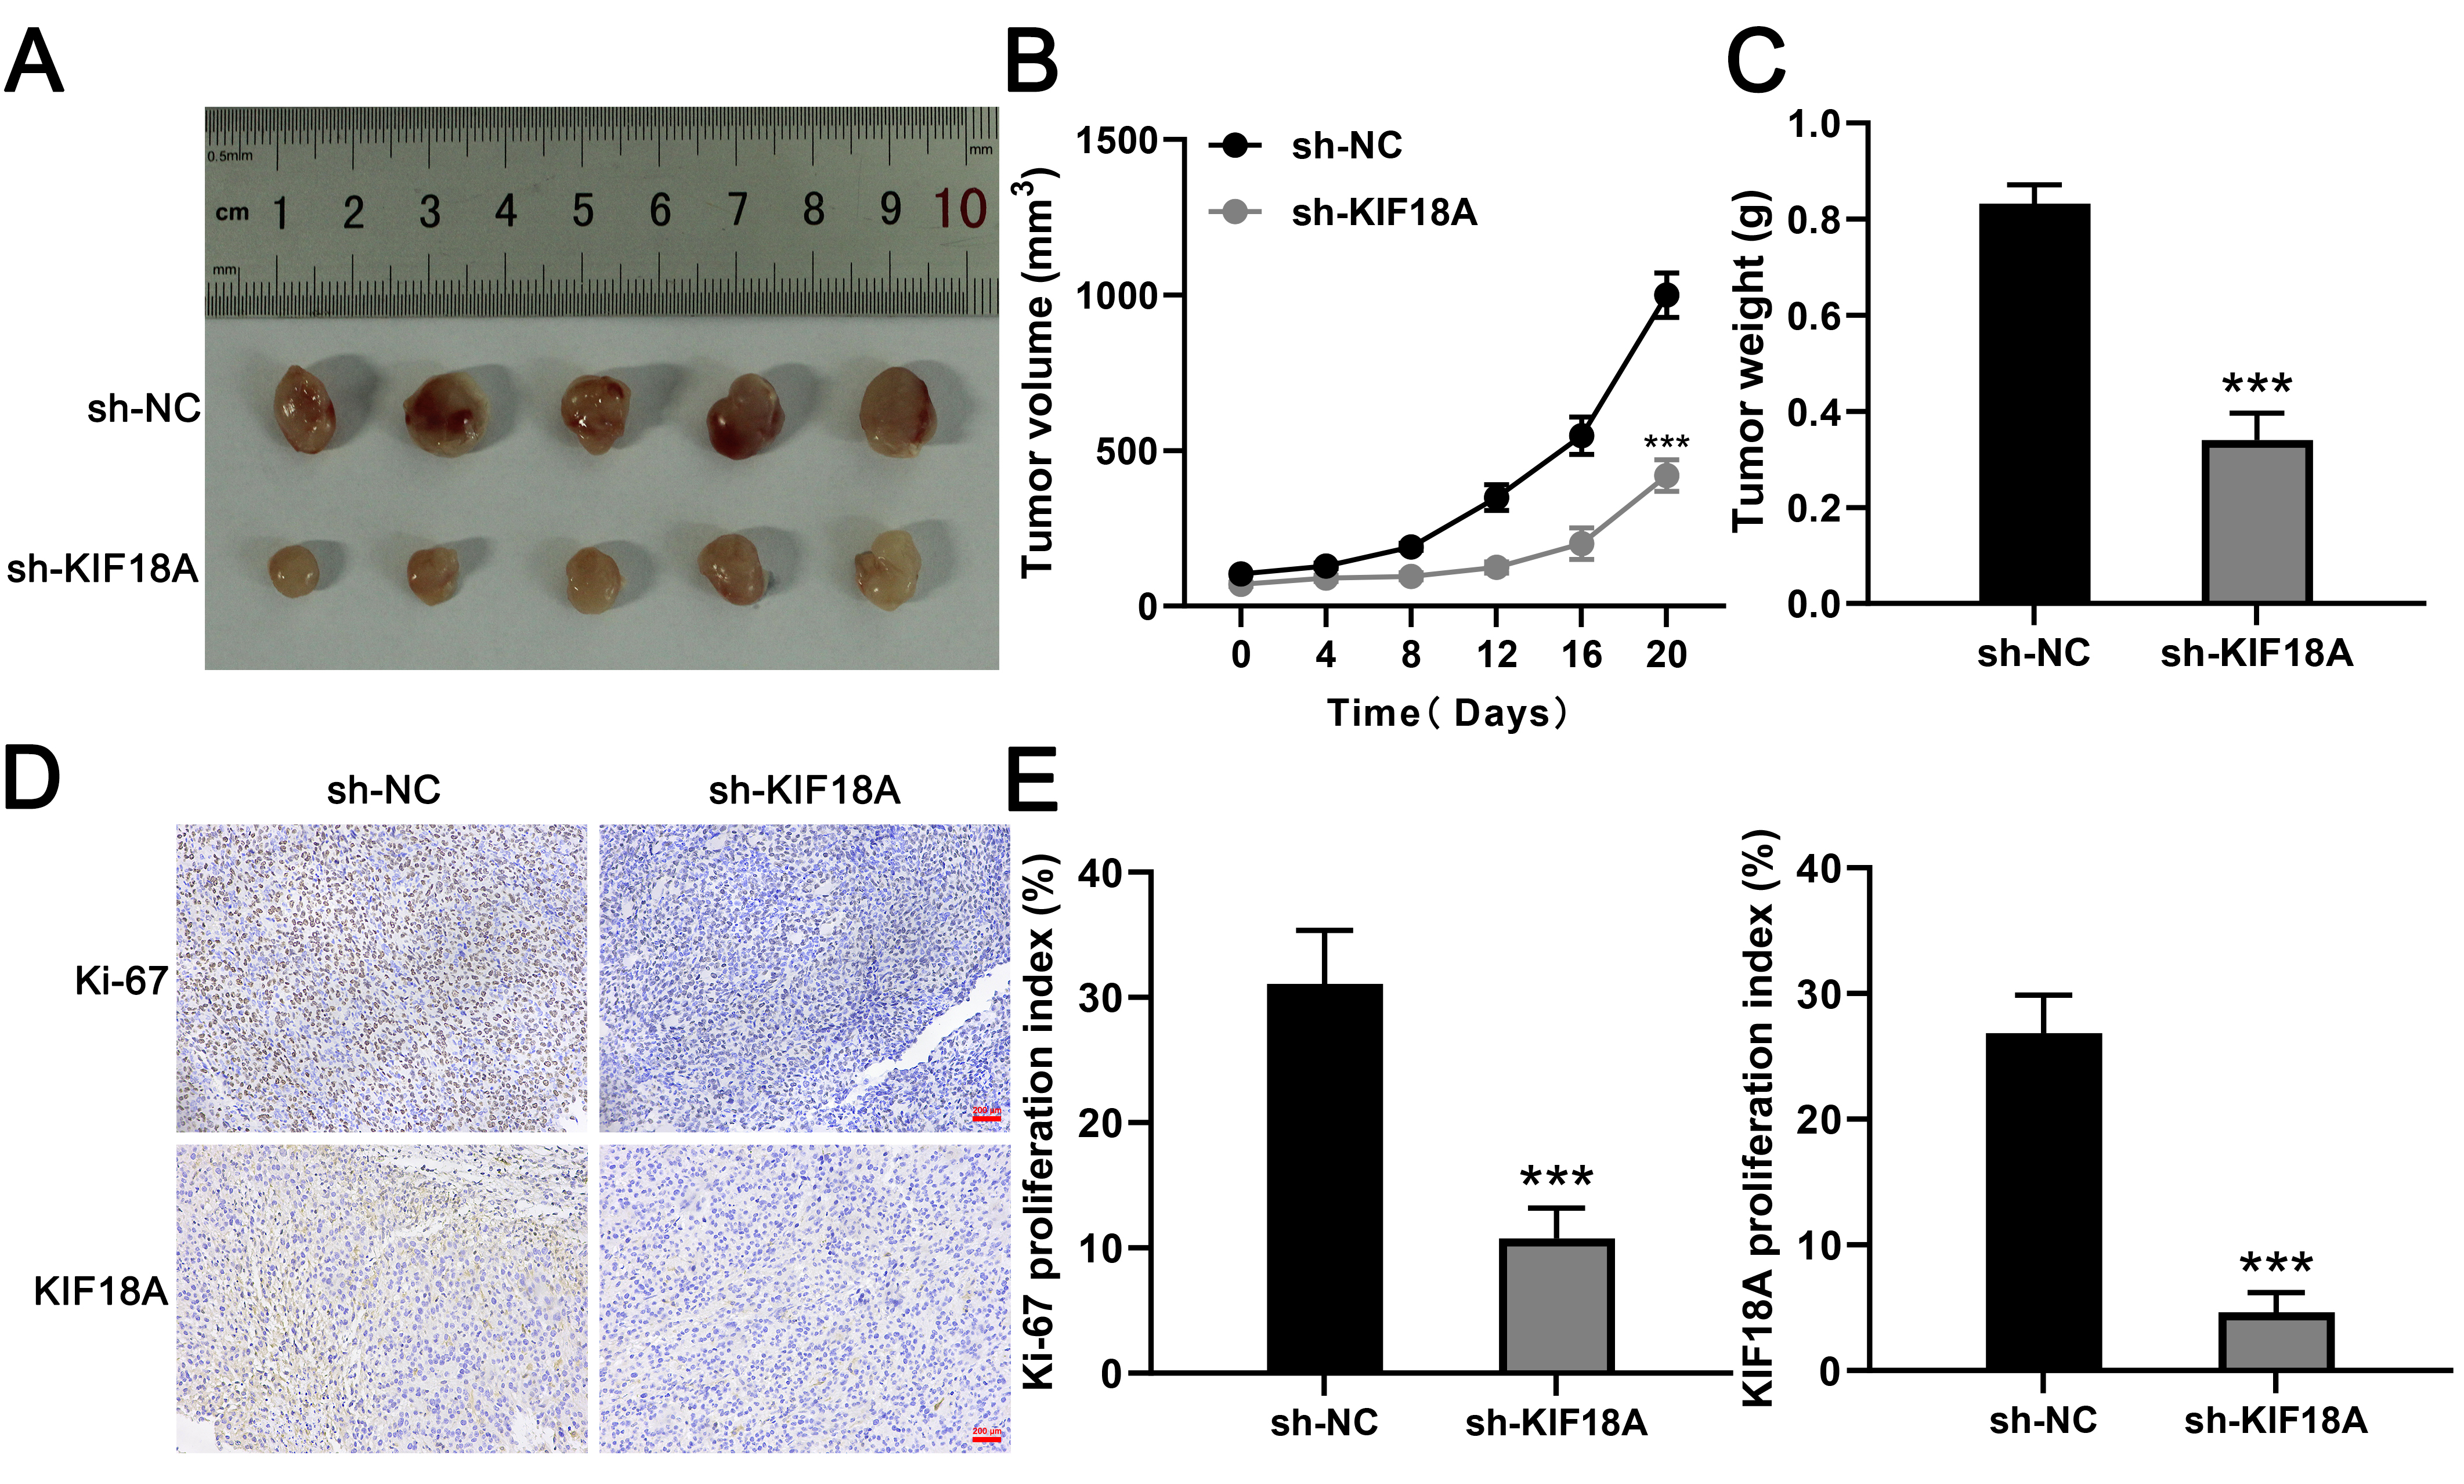 Fig. 6.
Knockdown of KIF18A inhibits OS cell growth in
vivo. (A) Typical images of tumors harvested from the sh-KIF18A and
sh-NC groups. (B,C) Tumor volume and weight were assessed in
both the sh-KIF18A and the sh-NC group. (D,E) Representative
images illustrate the staining of Ki-67 and KIF18A in xenograft
sections, with the percentages of positively stained cells indicated. Scale bar:
200 µm. Statistical analysis for (B,C,E) was conducted using
Independent Samples t-test. Data are shown as mean
Immune microenvironment has an important impact on the disease progression. To assess the immune landscape of OS, we employed the CIBERSORT algorithm for quantification (Fig. 7A). Correlation analysis revealed that KIF18A was positively associated with CD4+ memory resting T cells, activated NK cells, and CD4+ naïve T cells, but inversely correlated with follicular helper T cells, M2 macrophage, and resting dendritic cells (Fig. 7B). Immune function assessment indicated that patients exhibiting high KIF18A expression may have an inhibited immune function, like APC_co_inhibition, CCR, Check_point, HLA, inflammation_promoting and T_cell_co_stimulation (Fig. 7C). Meanwhile, we found that the immune-related gene HMGB1 was upregulated (p = 0.00132) in the OS patients with high KIF18A expression (Fig. 7D). Single-cell analysis showed that in the OS microenvironment, KIF18A was mainly expressed in the malignant, fibroblasts, osteoblasts and also several immune cells (Fig. 8A,B). Cell interaction results indicated an obvious interaction between fibroblasts and malignant (Fig. 8C). Then, the TIDE algorithm was utilized to estimate the immunotherapy response in OS patients (Fig. 8D). We noticed a positive correlation between KIF18A and TIDE score, indicating that patients with high expression of KIF18A are more likely to develop immune therapy resistance compared to those with low expression (Fig. 8E). Also, we noticed that KIF18A was negatively correlated with immune dysfunction, but positively correlated with MDSC infiltration (Fig. 8F–H).
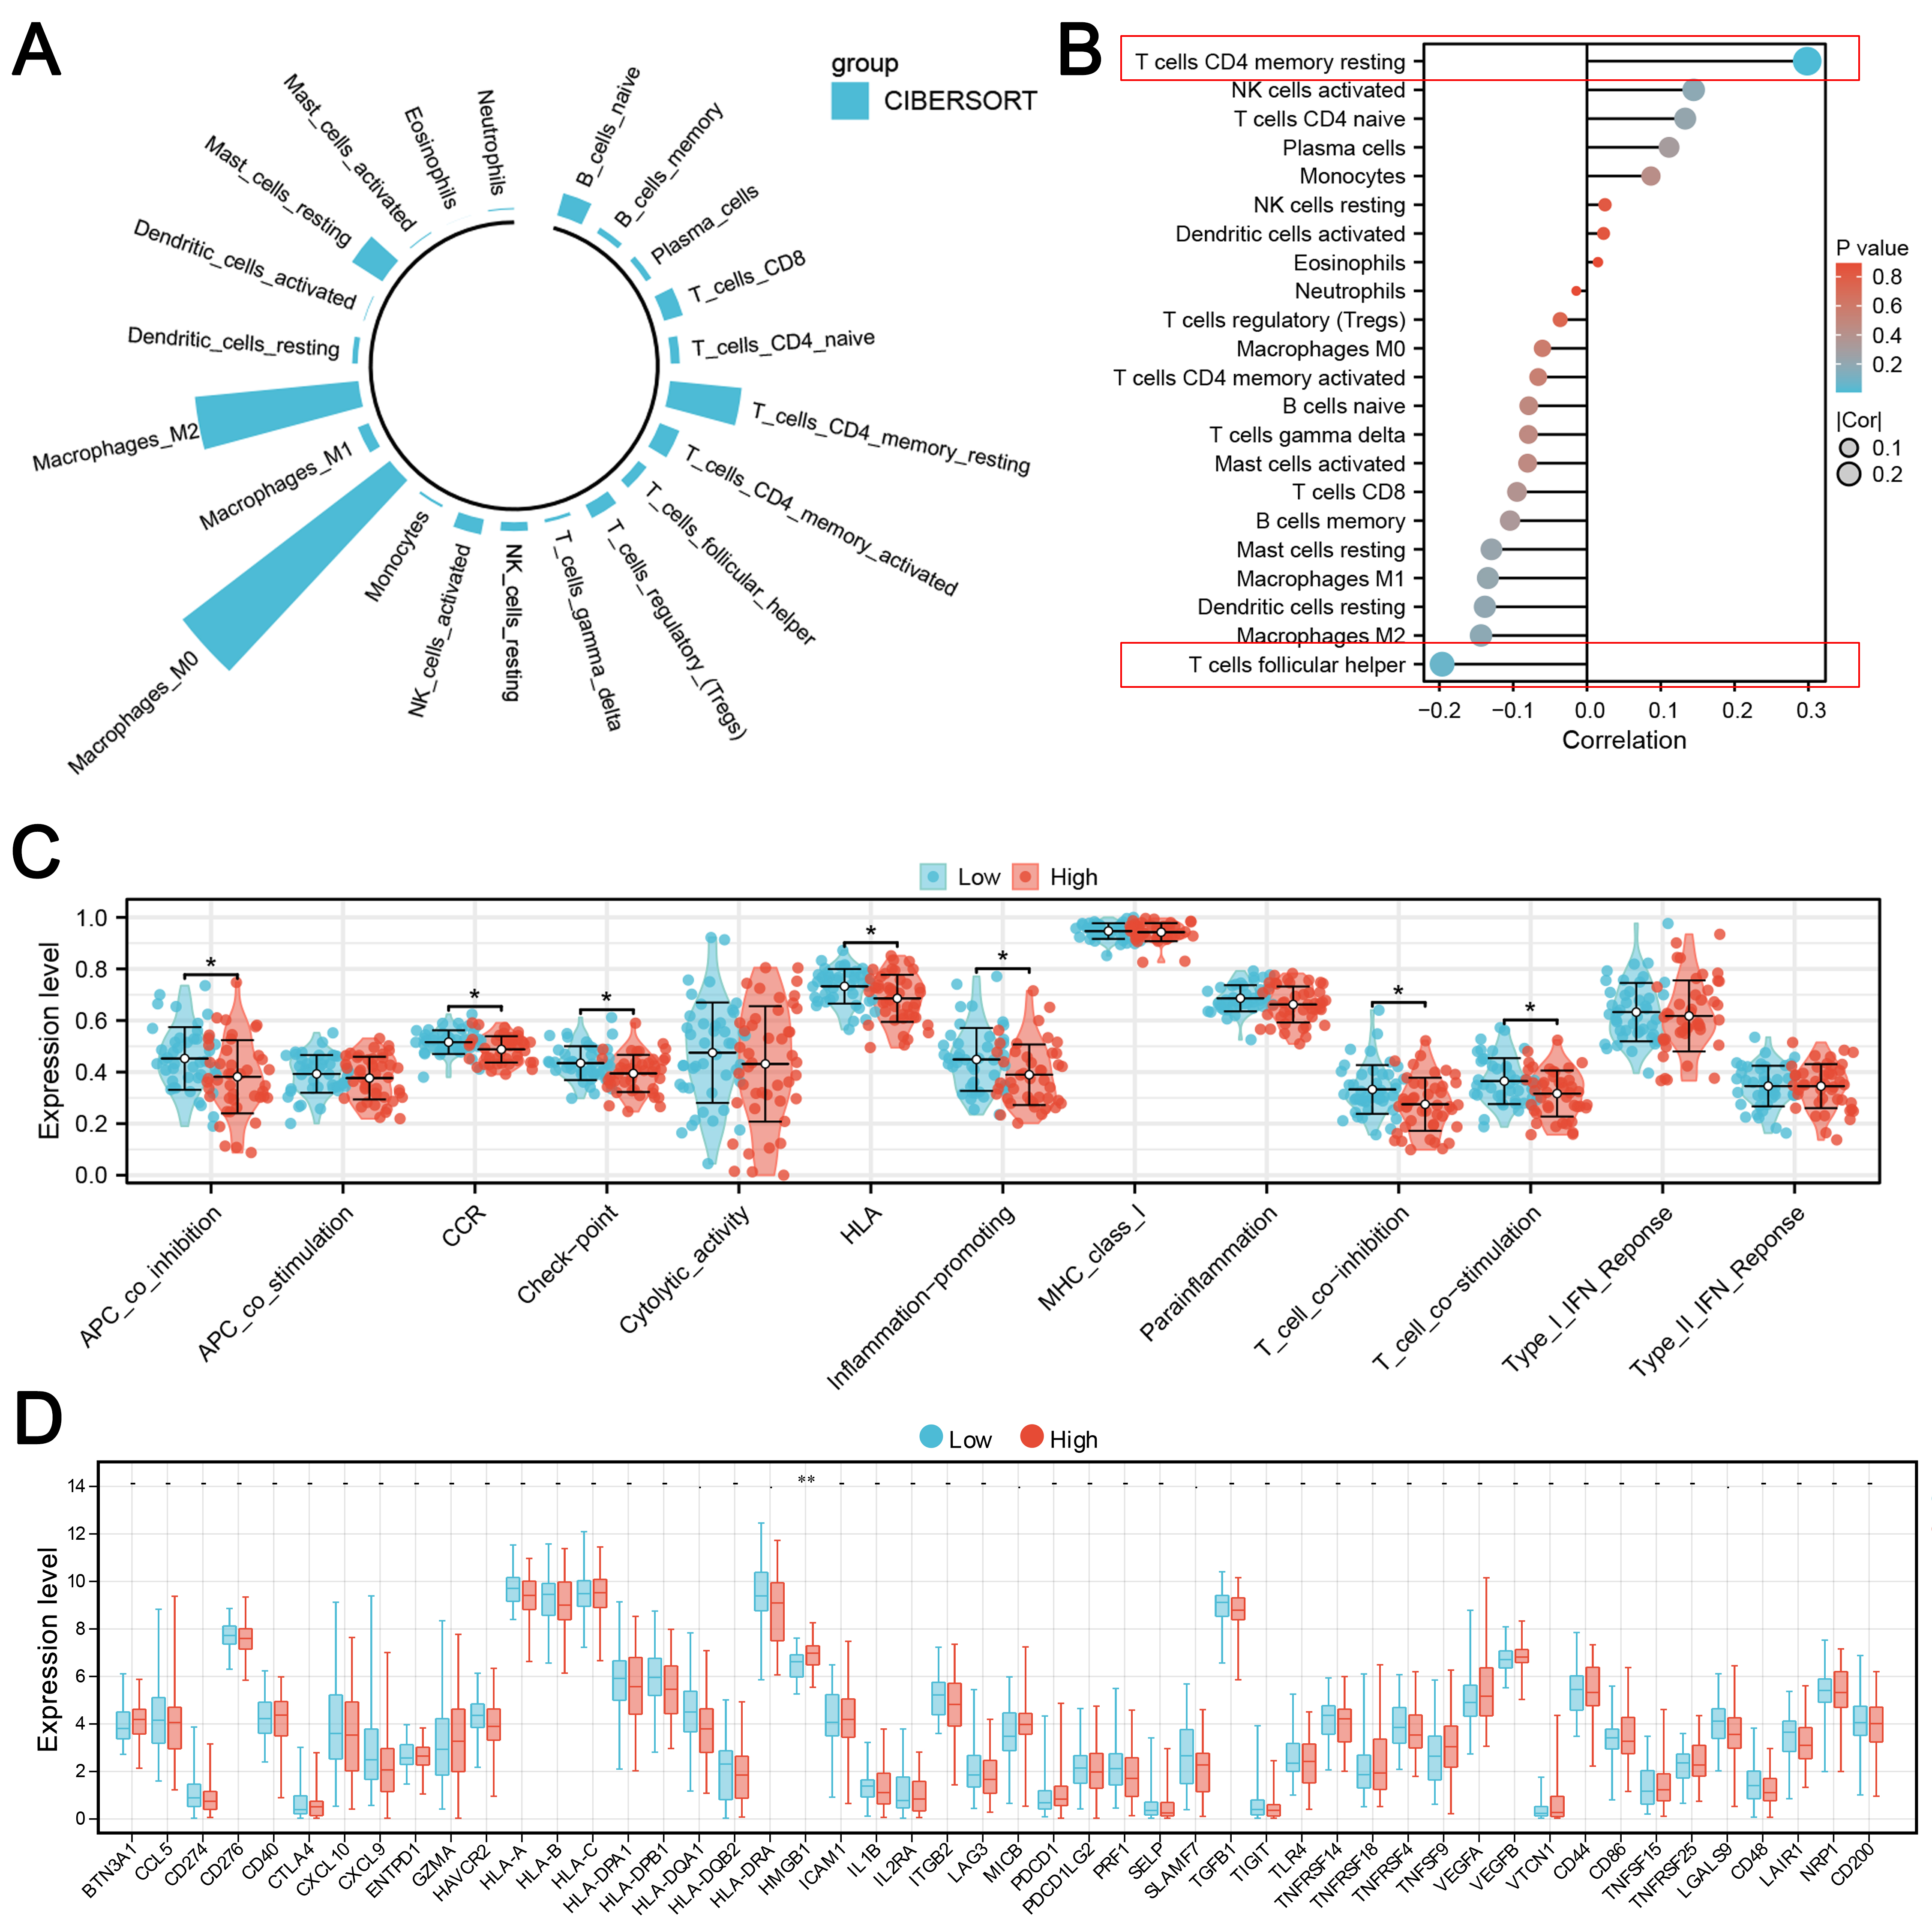 Fig. 7.
Immune microenvironment analysis of KIF18A.(A) The immune microenvironment of OS patients was quantified using the
CIBERSORT algorithm. (B) Correlation between KIF18A and quantified
immune cells. (C) The immune function terms in patients with high and
low KIF18A expression. (D) The immune checkpoints level in patients with
high and low KIF18A expression. Statistical analysis for (C,D)
was conducted using Independent Samples t-test. Data are shown as mean
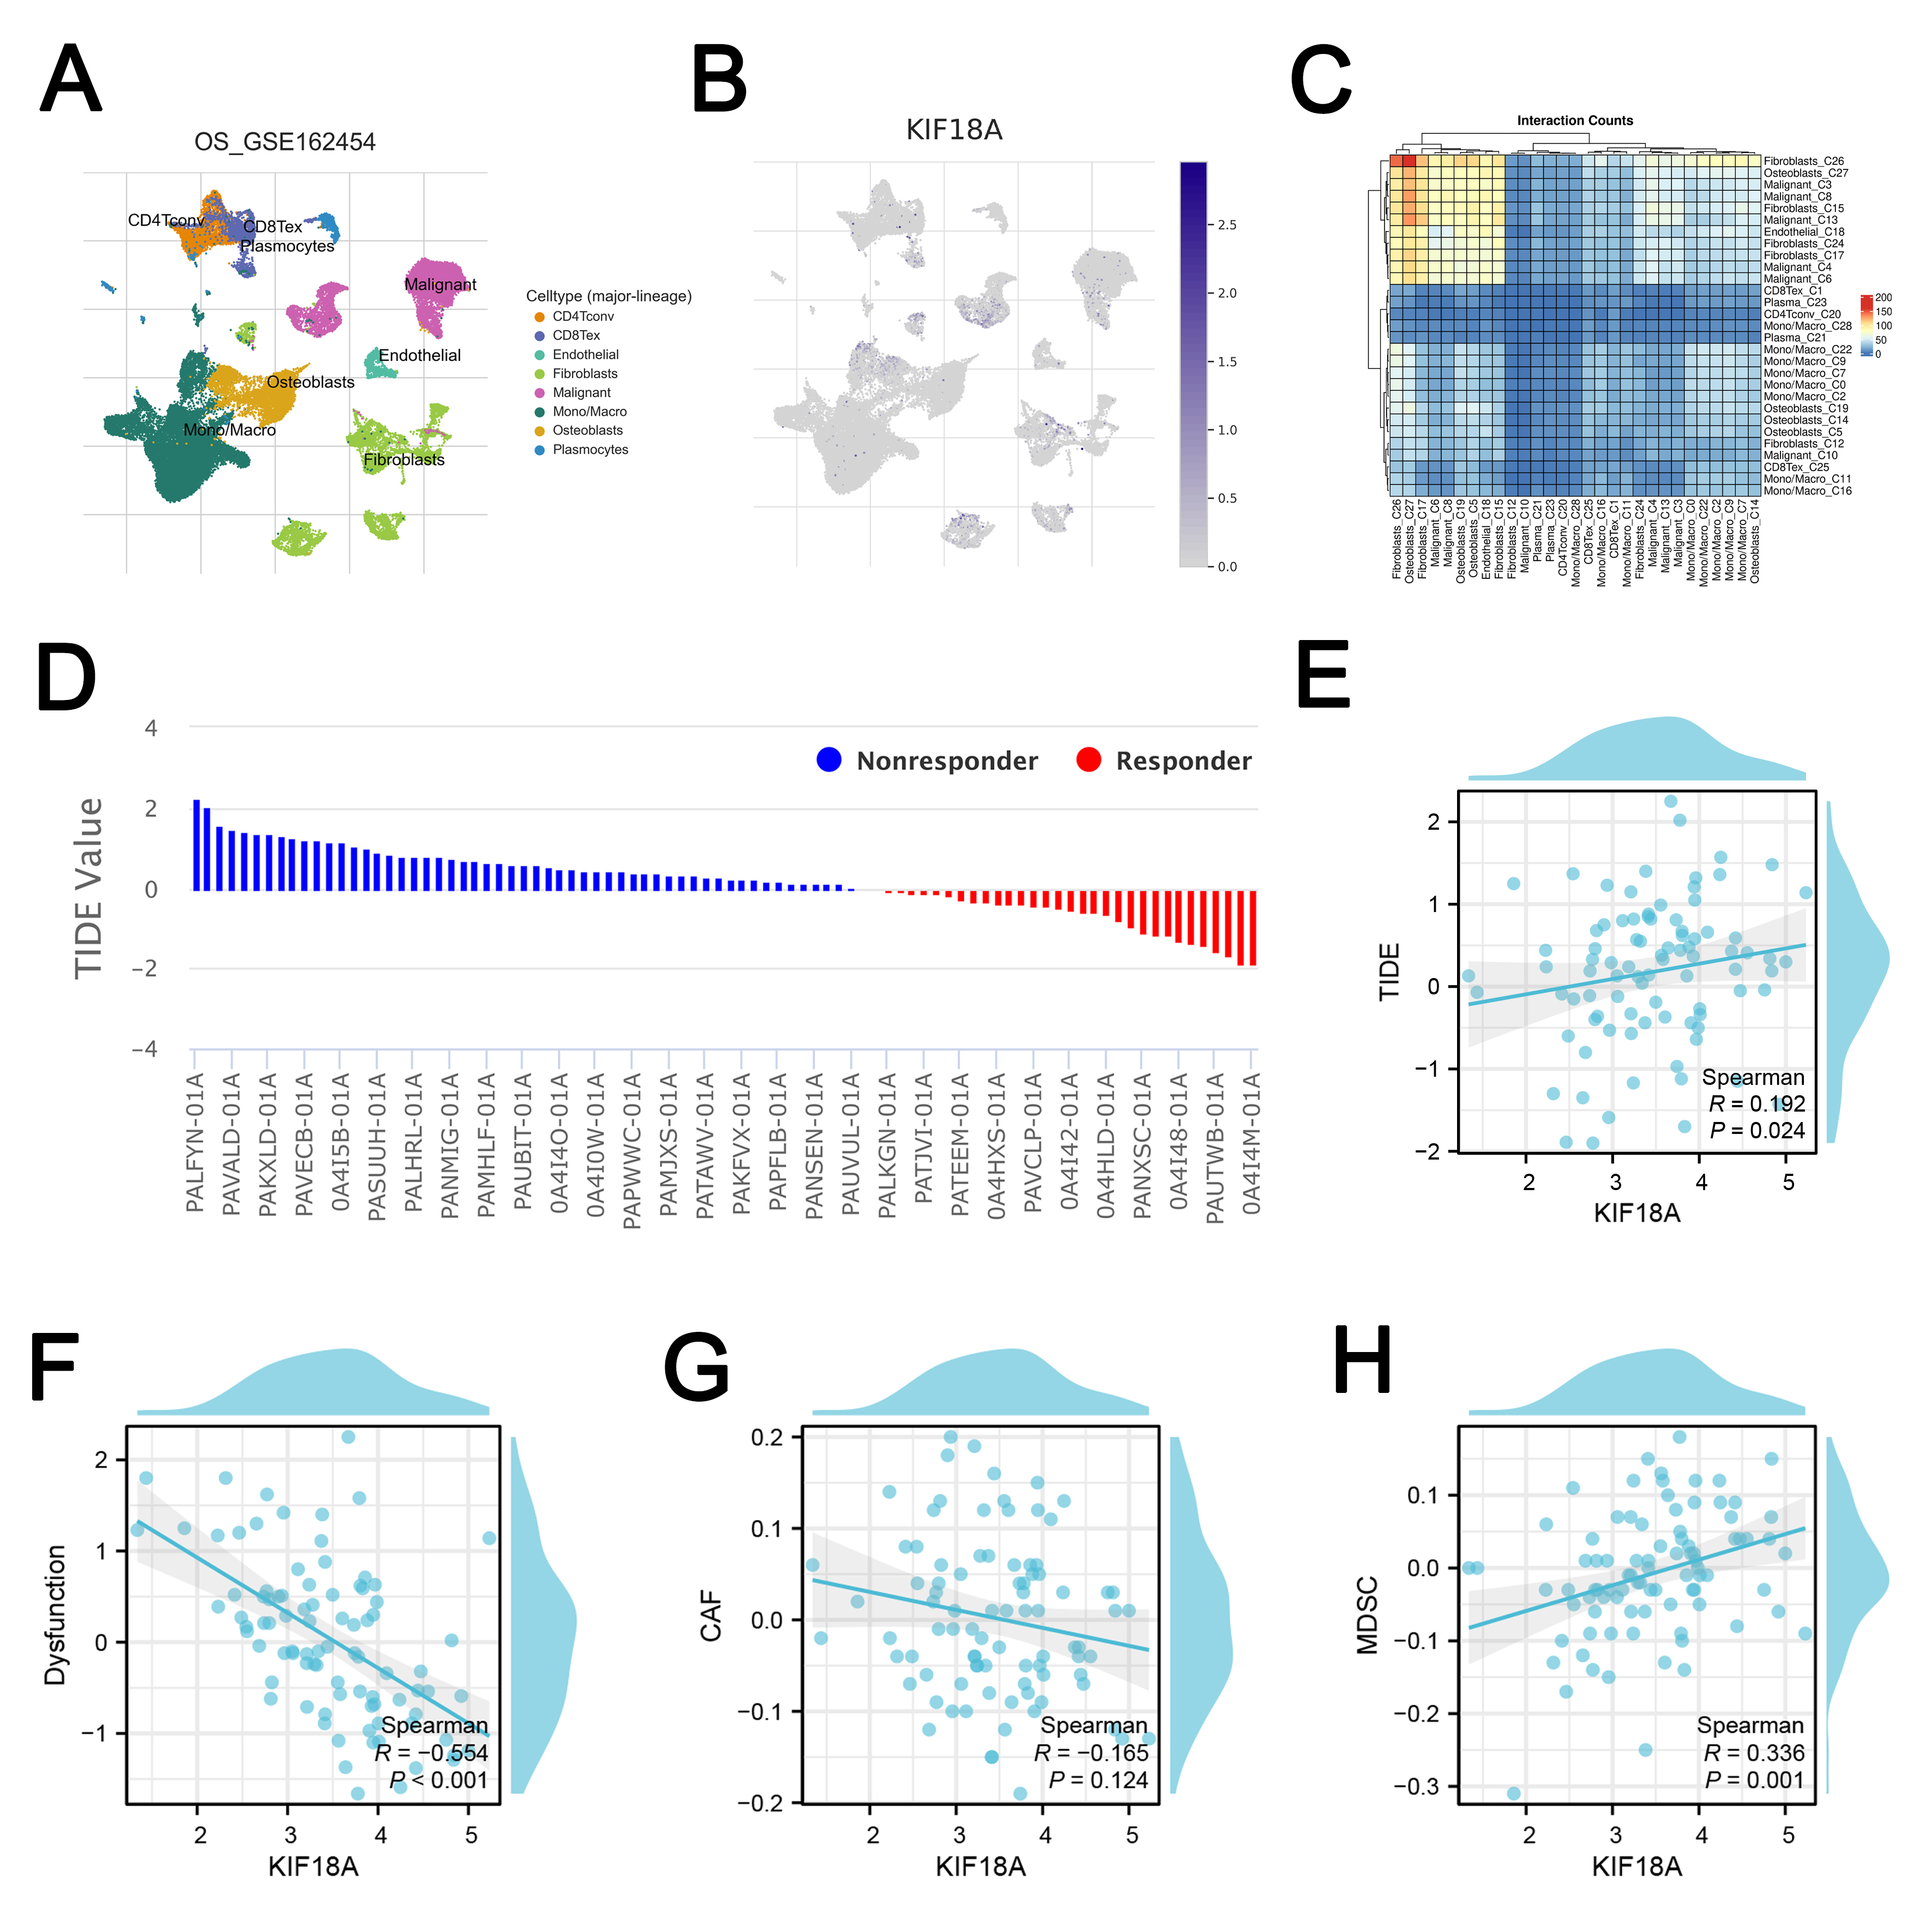 Fig. 8.
Single-cell and immunotherapy analysis. (A,B) The single-cell expression of KIF18A in OS microenvironment. (C) Cell interaction at single-cell level in OS microenvironment. (D) TIDE analysis was used to quantify the immunotherapy response of OS patients. (E) Correlation between KIF18A and TIDE score. (F) Correlation between KIF18A and immune dysfunction. (G) Correlation between KIF18A and CAFs infiltration. (H) Correlation between KIF18A and MDSC infiltration.
Subsequently, we performed a drug sensitivity analysis of common drugs for OS
patients. We found that the patients with low KIF18A expression might be
more sensitive to lapatinib (Fig. 9A). Following this, we tried to identify the
lncRNA associated with KIF18A with the threshold of
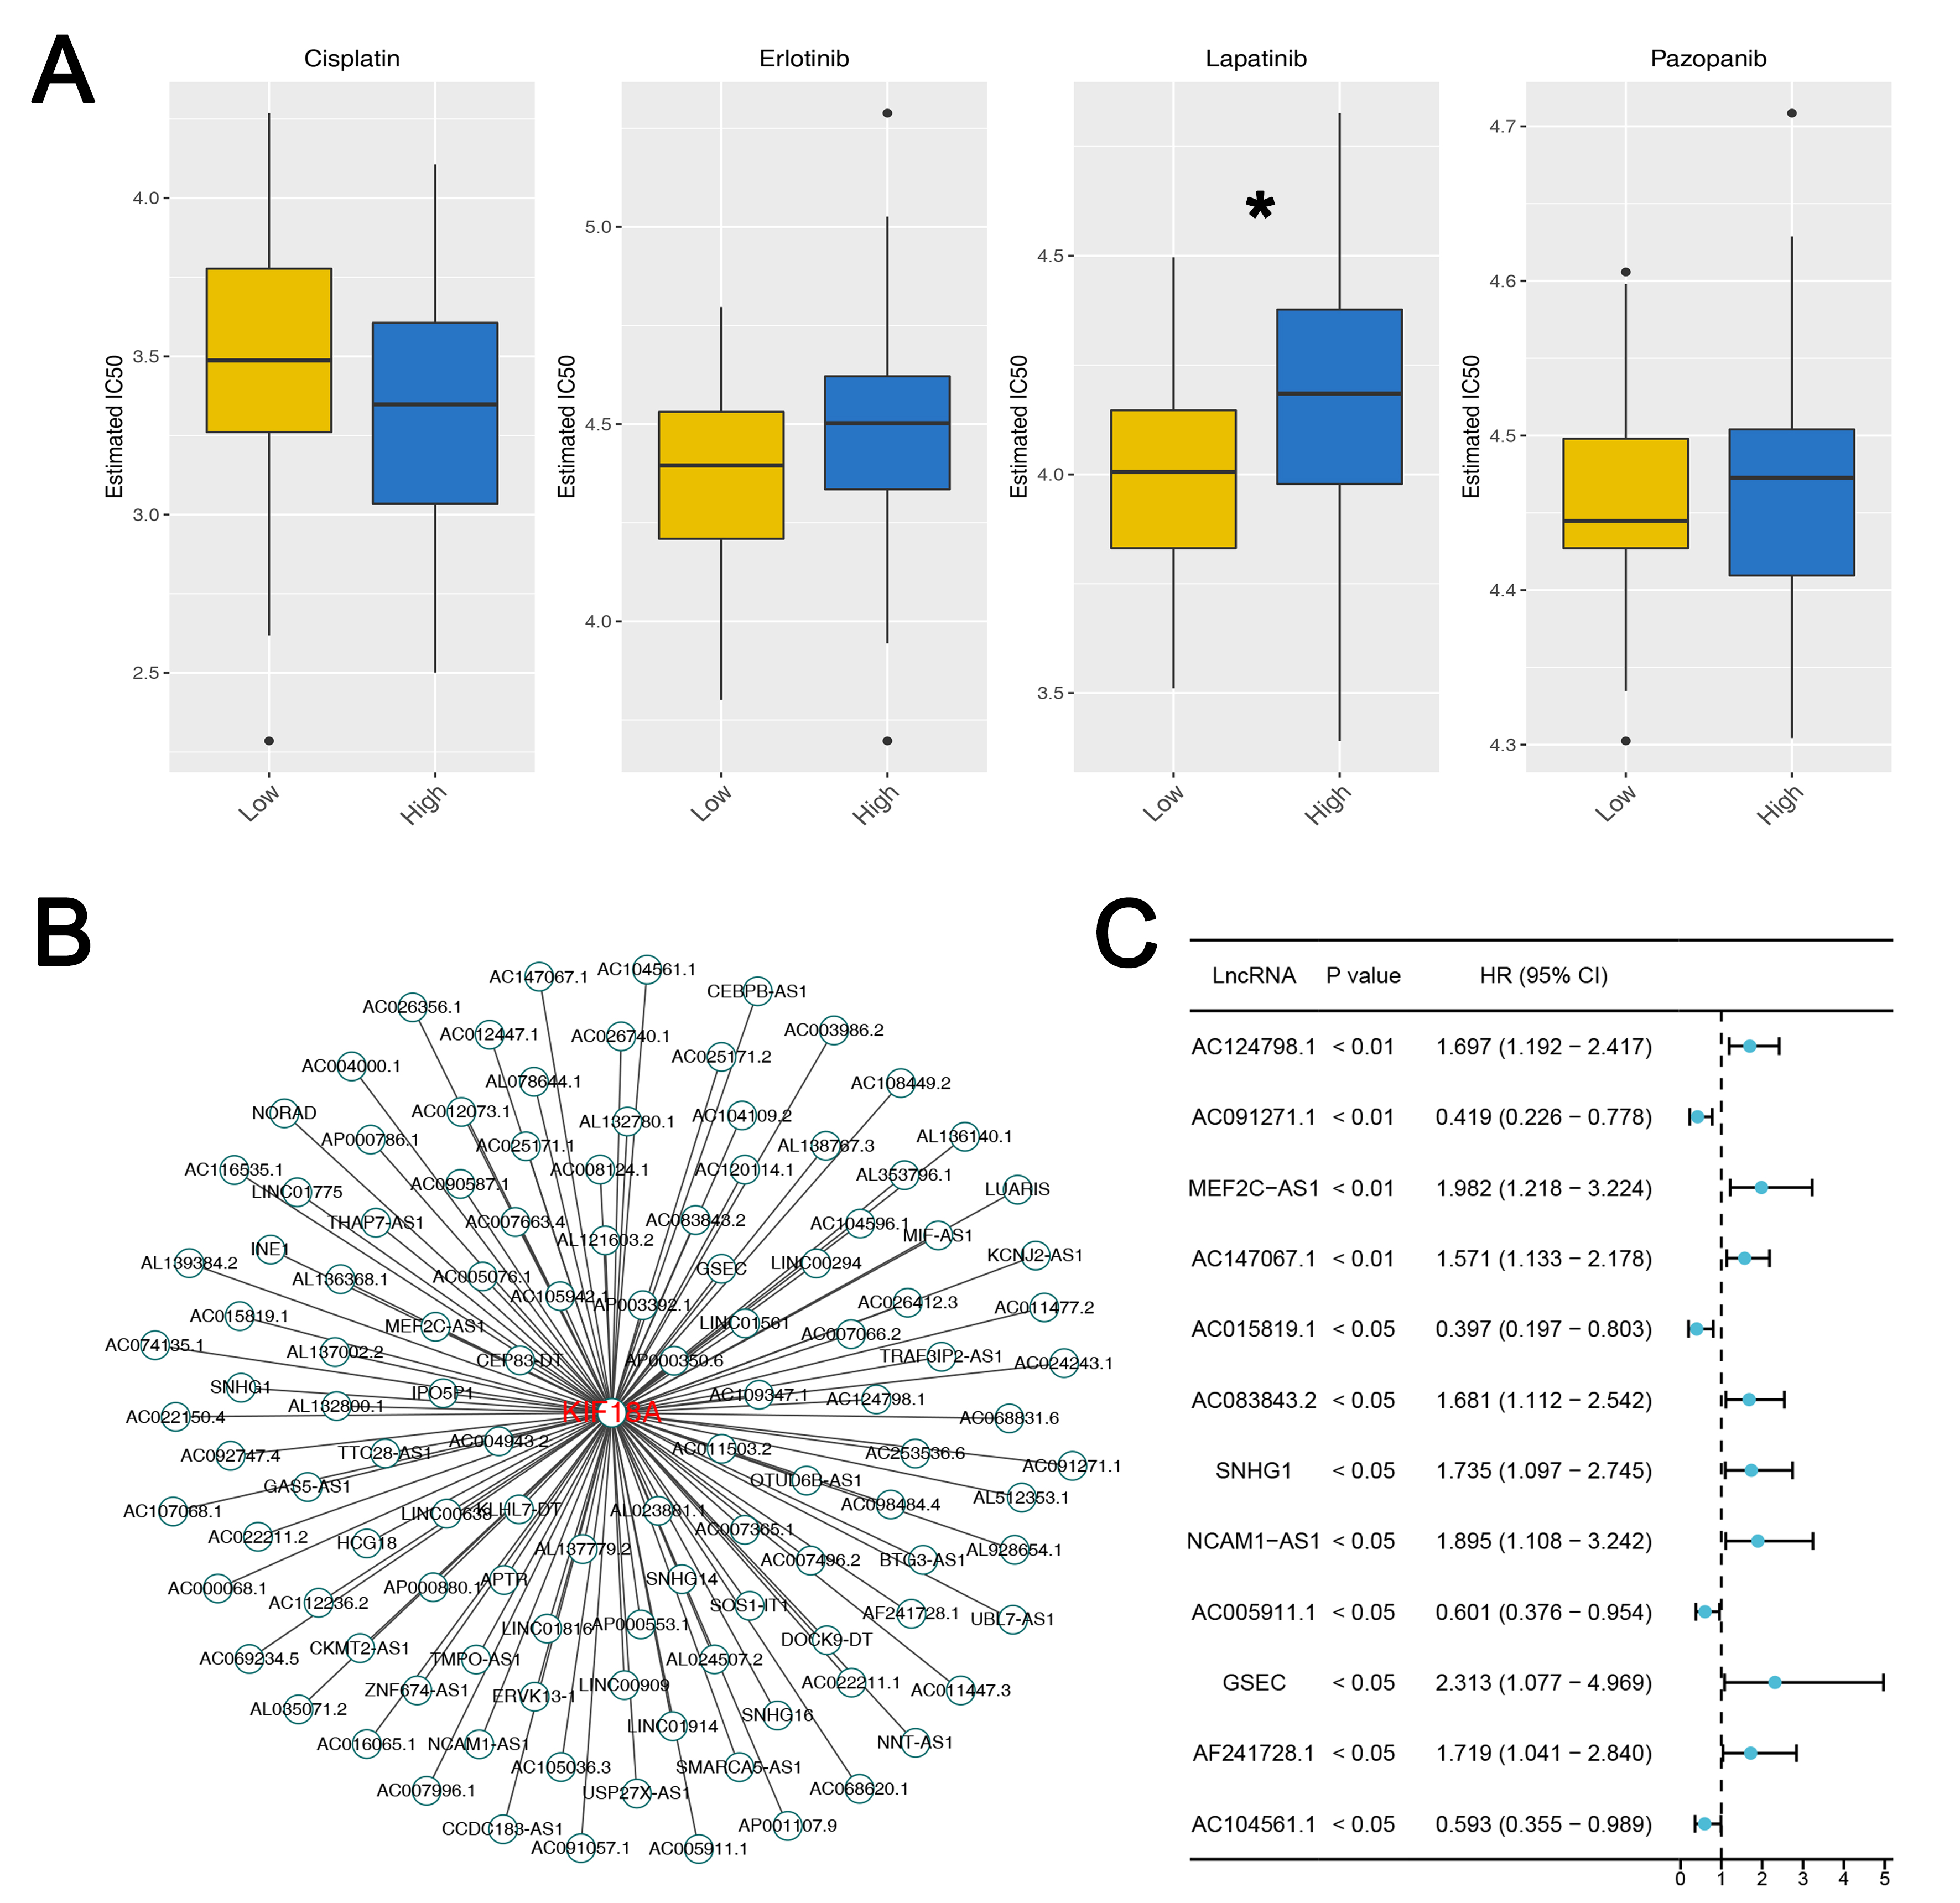 Fig. 9.
Drug sensitivity analysis and lncRNA network of KIF18A. (A) The IC50 difference of specific drugs in patients with high and low
KIF18A level. Statistical analysis for Figures A was conducted using
Independent Samples t-test. Data are shown as mean
OS, the most common primary malignant bone tumor, predominantly involves adolescents and young adults with a second incidence rise in aged population seen in conjunction with the disease such as Paget’s disease or prior radiation therapy [39]. OS clinically reveals pain and swelling in localized manner mainly in the knee region; specifically distal femur and proximal tibia, and proximal humerus, which are the most commonly affected regions [3]. In addition metastases to lungs and bones profoundly affect patient outcomes. Patients with metastatic presentation have much worse prognosis [40]. In spite of emerging therapeutic options, disease in patients with recurrent or metastatic OS has poor prognosis indicating high unmet needs of new therapeutic strategies and deeper knowledge of the biology of OS [41].
This study establishes KIF18A as a critical regulator of OS progression, with markedly elevated expression in metastatic cases. KIF18A is significantly overexpressed in OS tissues, showing a strong association with disease onset. Comparative analysis reveals higher KIF18A levels in metastatic versus non-metastatic patients. Functional studies demonstrate that KIF18A drives OS cell proliferation, invasion, and migration. Apoptosis assays and Western blotting confirm that KIF18A knockdown induces apoptosis, likely through activation of the extrinsic apoptotic pathway. In mouse xenograft models, silencing KIF18A significantly suppresses tumor growth. Furthermore, KIF18A is associated with alterations in key signaling pathways and the tumor immune microenvironment, suggesting a potential role in modulating immunotherapy response. lncRNAs have emerged as pivotal regulators in the pathogenesis of OS, modulating key cellular processes such as proliferation, metastasis, and chemoresistance through epigenetic, transcriptional, and post-transcriptional mechanisms of gene expression regulation [42, 43]. Notably, KIF18A expression correlated with sensitivity to certain drugs and exhibited interactions with specific lncRNAs. These findings shed light on KIF18A’s multifaceted role in OS pathogenesis, offering insights into its therapeutic potential and highlighting its relevance as a biomarker for prognosis and treatment response.
We demonstrated that patients with high KIF18A expression showed
various differentially activated signalings from those with low expression. A
member of the RAS family of oncogenes; the KRAS gene
participates in the initiation of the tumor [44]. Earlier findings indicate that
KIF18A enhances the proliferation and migratory capacity of pancreatic
adenocarcinoma cells, potentially affected by KRAS mutations [31]. A
previous study has demonstrated a link between KRAS and OS, indicating
that KRAS may facilitate the growth of OS cells [45]. The abnormal KRAS
signaling in the pathogenesis and progression of OS has been evidenced by the
disruption of the cell cycle, the apoptosis and the metastasis of the tumors via
downstream MAPK/ERK and PI3K/AKT axes [46]. Although KRAS mutations may
not be as prevalent in OS as in other cancers, the KRAS signaling pathway’s role
in tumor cell biology suggests it could be a potential target for therapeutic
intervention. The G2/M checkpoint is a critical phase in the cell cycle that
ensures cells do not enter mitosis (M phase) until their DNA is fully replicated
and any DNA damage is repaired after the G2 phase [47]. This checkpoint helps
prevent the propagation of damaged DNA, thus avoiding genomic instability and
cancer development [48]. In the context of OS, disruptions or dysregulations in
the G2/M checkpoint can contribute to the malignant transformation of cells,
their proliferation, and the aggressiveness of the tumor. Such dysregulations may
also make OS cells more resistant to certain chemotherapies, as these treatments
often target rapidly dividing cells [49]. The NOTCH signaling pathway is a
conserved cell signaling in most multicellular organisms that is critical to
cellular differentiation, proliferations and apoptosis [50]. Within the realm of
oncology, notably in OS, altered NOTCH signaling has been linked to the onset,
development, and spread of tumors [51]. Research indicates that NOTCH signaling
affects the OS microenvironment by enhancing tumor blood vessel formation and
supporting cancer stem cells. These stem cells contribute to a resistance against
standard treatments and are linked to a worse outlook for patients [52, 53]. In
fact, TGF-
Also, we observed that the KIF18A expression was significantly associated with CD4+ memory resting T cells positively and follicular helper T cells negatively. On the one hand, CD4+ memory resting T cells are a subset of T cells that have previously encountered antigens and can quickly respond upon re-exposure, playing a crucial role in long-term immune memory [56]. CD4+ memory resting T cells are also related to tumors, including their role in cancer immunity and potential implications for cancer prognosis and therapy [57]. On the other hand, follicular helper T cells play a critical role in the immune system by helping B cells produce antibodies, and their involvement in cancer, including OS, has been an area of growing interest [58]. Finally, the TIDE algorithm constitutes a sophisticated computational framework designed to prognosticate patient responses to immune checkpoint blockade therapies. Considering the variable responses to immune checkpoint blockade therapies directed at the PD-1/PD-L1 and CTLA-4 pathways, TIDE offers a predictive insight, enhancing personalized cancer treatment [59]. Our analysis revealed that patients with low KIF18A expression tended to have lower TIDE scores, and that subset of patients may show a better response to immunotherapy. Patients with low KIF18A expression might be more sensitive to lapatinib. Lapatinib is a tyrosine kinase inhibitor that simultaneously inhibits EGFR and HER2 [60]. EGFR and HER2 may be associated with chromosomal instability [61]. The result indicates that KIF18A may be an indicator for therapeutic outcomes and prognosis to OS.
In conclusion, our study elucidates the pivotal role of KIF18A in the initiation, progression, and metastatic behavior of OS, while also exploring its underlying biological functions (Fig. 10). However, some limitations exist in our study. Firstly, a larger sample number is needed to strengthen the robustness of our findings. Secondly, more experiments need to be done to elucidate how KIF18A affects the pathogenesis in OS at its specific mechanism level. In the future, investigations into the detailed molecular pathogenesis mediated by KIF18A, and assessment of therapeutic interventions against KIF18A in preclinical experimental settings remain to be determined.
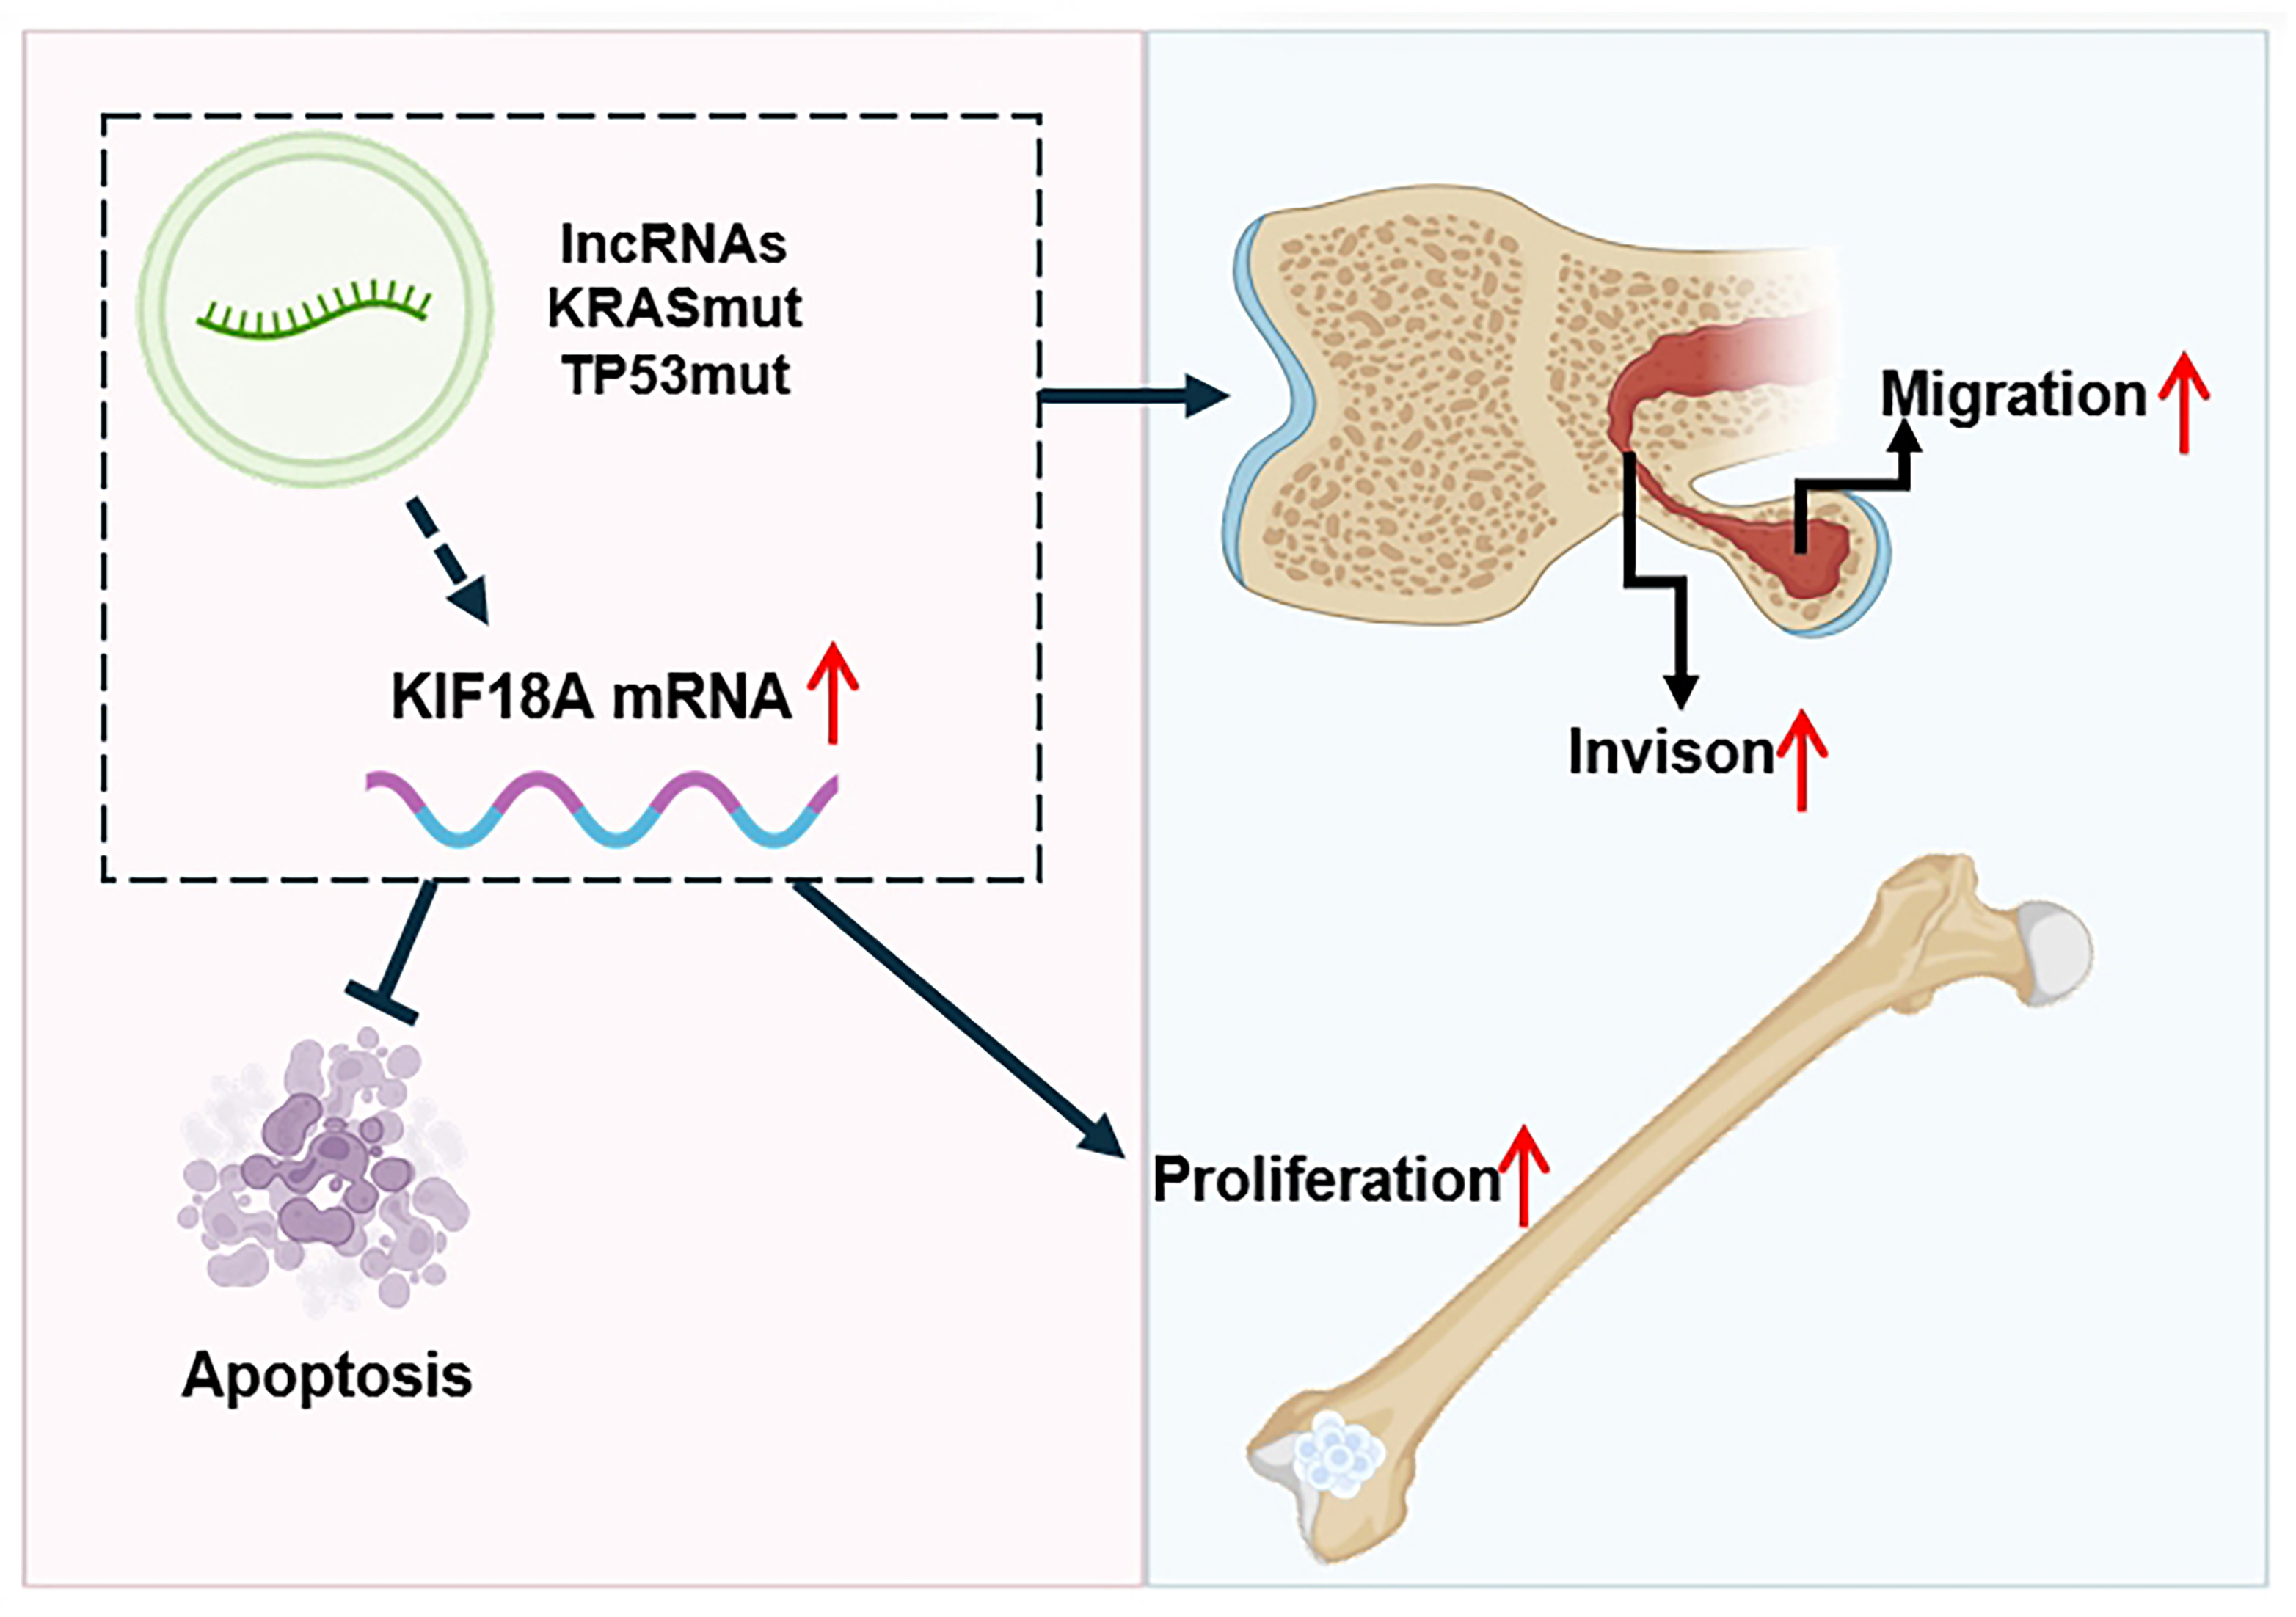 Fig. 10.
Schematic diagram of KIF18A’s role in OS progression. KIF18A is overexpressed in OS, which may be induced by certain lncRNAs and mutations of the TP53 gene and KRAS gene. KIF18A is involved in promoting proliferation, invasion and migration of OS cells, also KIF18A knockdown induces apoptosis of OS cells. The red arrow indicates a significant increase. This figure created by Adobe Illustrator 2020 (Adobe Systems Incorporated, San Jose, CA, USA).
The data used to support the findings of this study are available from the corresponding author upon request.
Conceptualization, ZG, WM and HC; Data curation, YW and JR; Funding acquisition, ZG; Investigation, NX; Methodology, ZG and SZ; Software, ZG and XH; Writing – original draft, ZG; Writing – review & editing, WM and HC. All authors contributed to editorial changes in the manuscript. All authors read and approved the final manuscript. All authors have participated sufficiently in the work and agreed to be accountable for all aspects of the work.
The study was carried out in accordance with the guidelines of the Declaration of Helsinki. A written consent was signed by the patients or their families/legal guardians. The use of patients’ samples and collection procedures has been reviewed and approved by the Ethics Committee of Ningbo No. 6 Hospital (Approval No.: 2025003). Animal experiments were conducted in accordance with the National Regulations on the Administration of Laboratory Animals (Beijing, China). The animal use protocol has been reviewed and approved by the Animal Ethics and Welfare Committee (AEWC) of Ningbo University (Approval No.: AEWC-2024-0002).
Thanks to Laboratory Animal Center of Ningbo University for the technical support.
This study is supported by Ningbo Natural Science Foundation (202003N4283), Medical Health Science and Technology Project of Zhejiang Provincial Health Commission (2020KY840), Ningbo Clinical Research Center for Orthopedics, Sports Medicine & Rehabilitation (2024L004).
The authors declare no conflict of interest.
Supplementary material associated with this article can be found, in the online version, at https://doi.org/10.31083/FBL44663.
Publisher’s Note: IMR Press stays neutral with regard to jurisdictional claims in published maps and institutional affiliations.