
- Academic Editor
†These authors contributed equally.
Macrophage infiltration is prevalent in lung cancer tissues, significantly influencing disease progression and clinical outcomes. Lung squamous cell carcinoma (LUSC) is often diagnosed at advanced stages, resulting in poor prognosis. Identifying effective diagnostic biomarkers, particularly those associated with macrophage infiltration, is crucial for early detection and improved treatment outcomes. This study aims to identify diagnostic markers specifically linked to M1 macrophages in LUSC.
Differential gene expression analysis and immune cell infiltration assessment were conducted using the limma and CIBERSORT packages. The WGCNA algorithm was then applied to identify genes in modules related to M1 macrophages. Gene Ontology (GO) and Kyoto Encyclopedia of Genes and Genomes (KEGG) enrichment analyses were used to investigate the biological functions of M1 macrophage-related differentially expressed genes (DEGs). To identify M1 macrophage-associated biomarkers in LUSC, a diagnostic model was developed using four machine learning algorithms, with validation through nomogram visualization, calibration curves, and external datasets. Finally, immunohistochemical staining was performed to further confirm the expression of hub genes and the predictive accuracy of M1 macrophage-related biomarkers in LUSC.
A total of 143 M1 macrophage-related DEGs were identified, which were involved in regulating immune response pathways. The support vector machine (SVM) model based on these genes demonstrated exceptional performance, with area under the curve (AUC) values of 0.995 in the training cohort and 1.000 in three external validation datasets. Immunohistochemical analysis further confirmed the diagnostic accuracy of Matrix metalloproteinase-7 (MMP7), Reticulon-1 (RTN1), Zinc finger protein ZIC 2 (ZIC2), Killer cell lectin-like receptor subfamily B member 1 (KLRB1), and C-X-C motif chemokine 13 (CXCL13), yielding an AUC of 0.992. These results highlight the strong diagnostic capability of the 5 hub genes in LUSC.
The study highlights the pivotal role of M1 macrophage-related DEGs in LUSC tumorigenesis. The newly identified 5 hub genes provide a highly accurate diagnostic tool for LUSC, offering potential improvements for both diagnostic and therapeutic strategies.
Lung cancer remains the leading cause of cancer incidence and mortality globally, affecting 185 countries [1]. In 2022, approximately 1,060,600 new lung cancer cases and 733,300 lung cancer-related deaths were reported in China [2]. Lung squamous cell carcinoma (LUSC) is the second most common subtype of non-small cell lung cancer (NSCLC), accounting for approximately 30% of all NSCLC cases [3]. Typically located in the central region of the lung and originating in the proximal bronchi, LUSC has a heightened risk of invading larger blood vessels [4]. The five-year survival rate for LUSC ranges from 73% at stage IA to 13% at stage IV [5]. Unfortunately, most patients are diagnosed at advanced stages [6, 7]. Consequently, identifying novel biomarkers is essential to improving early diagnosis and treatment strategies for LUSC. Furthermore, understanding the pathogenesis of LUSC could contribute to improving survival outcomes.
Tumor-infiltrating immune cells (TICs) play a critical role in LUSC pathogenesis, profoundly influencing clinical characteristics and patient survival rates [8, 9]. While immunotherapy has revolutionized cancer treatment, it still presents considerable clinical challenges. For patients with advanced LUSC, the median overall survival (OS) remains only 17.1 months, even with the use of PD-(L)1 inhibitors [10]. Although PD-L1 expression serves as a predictive marker for therapeutic benefit, it is not an infallible biomarker. Growing evidence suggests that TICs may serve as indicators of therapeutic response and prognosis in cancer patients, but their diagnostic value remains insufficiently explored.
Macrophages are highly adaptable cells capable of responding to environmental
signals and polarizing into M1 or M2 phenotypes. Tumor-associated macrophages
(TAMs), a major subset of TICs within the tumor microenvironment, play pivotal
roles in the growth, invasion, and metastasis of LUSC [11, 12, 13]. M2 macrophages
typically promote tumor progression and suppress anti-tumor immune responses,
whereas M1 macrophages can kill tumor cells through the release of inflammatory
cytokines, reactive oxygen species, phagocytosis, and the activation of other
immune cells [14]. In lung cancers, higher densities of M1 macrophages and lower
densities of M2 macrophages are associated with more favorable clinical outcomes.
Recent studies have further elucidated the complex regulation of M1 macrophages
in LUSC. For instance, SIRPG promotes the differentiation of macrophage
into M1 phentotype [15], while mutations in the TTN gene, a higher tumor
mutational burden (TMB), and a more favorable prognosis, are linked to
significant enrichment of M1 macrophages [16]. Conversely, NKX2-1
expression is negatively correlated with M1 macrophages infiltration [17], and
CHRNA6 expression levels are also correlated with the proportion of M1
macrophages [18]. These findings collectively underscore M1 macrophages as a
crucial anti-tumor component in LUSC. Accumulating evidence has demonstrated the
link between TICs and hub genes involved in tumorigenesis. For instance, elevated
Signal-regulatory protein alpha (SIRP
This study analyzed seven Gene Expression Omnibus (GEO) datasets and identified 143 M1 macrophage-related differentially expressed genes (DEGs) using the limma, CIBERSORT, and WGCNA algorithms. These DEGs were then used to construct a 5-gene diagnostic signature, derived from the optimal predictive model selected from four machine learning algorithms: Support Vector Machine (SVM), Random Forest (RF), Generalized Linear Model (GLM), and Extreme Gradient Boosting (XGB). The predictive performance of this signature was validated through nomogram visualization, calibration curves, decision curve analysis (DCA), and external validation datasets. Ultimately, MMP7, RTN1, ZIC2, KLRB1, and CXCL13 were identified as potential diagnostic biomarkers associated with LUSC-infiltrating M1 macrophages, highlighting their critical roles in LUSC pathogenesis.
Fig. 1 illustrates the workflow of the bioinformatics analysis. Seven microarray datasets related to LUSC, including GSE19188, GSE2088, GSE30219, GSE33479, GSE33532, GSE21933, and GSE8569, were sourced from the GEO database (https://www.ncbi.nlm.nih.gov/geo/), with detailed dataset information provided in Supplementary Table 1. The probe IDs in the series matrix files were annotated to gene symbols according to the corresponding platform files. For genes with multiple probes, the expression values were averaged and normalized using the “limma” package (Version 3.56.2, Bioconductor, USA, https://www.bioconductor.org/) in R software (Version 4.3.1, R Foundation for Statistical Computing, Vienna, Austria) to minimize discrepancies across datasets. Among these datasets, GSE19188, GSE2088, GSE30219, and GSE33479, comprising 150 patients with LUSC and 122 normal controls, were designated as the training dataset. External validation was performed using three additional GEO datasets: GSE33532, GSE21933, and GSE8569.
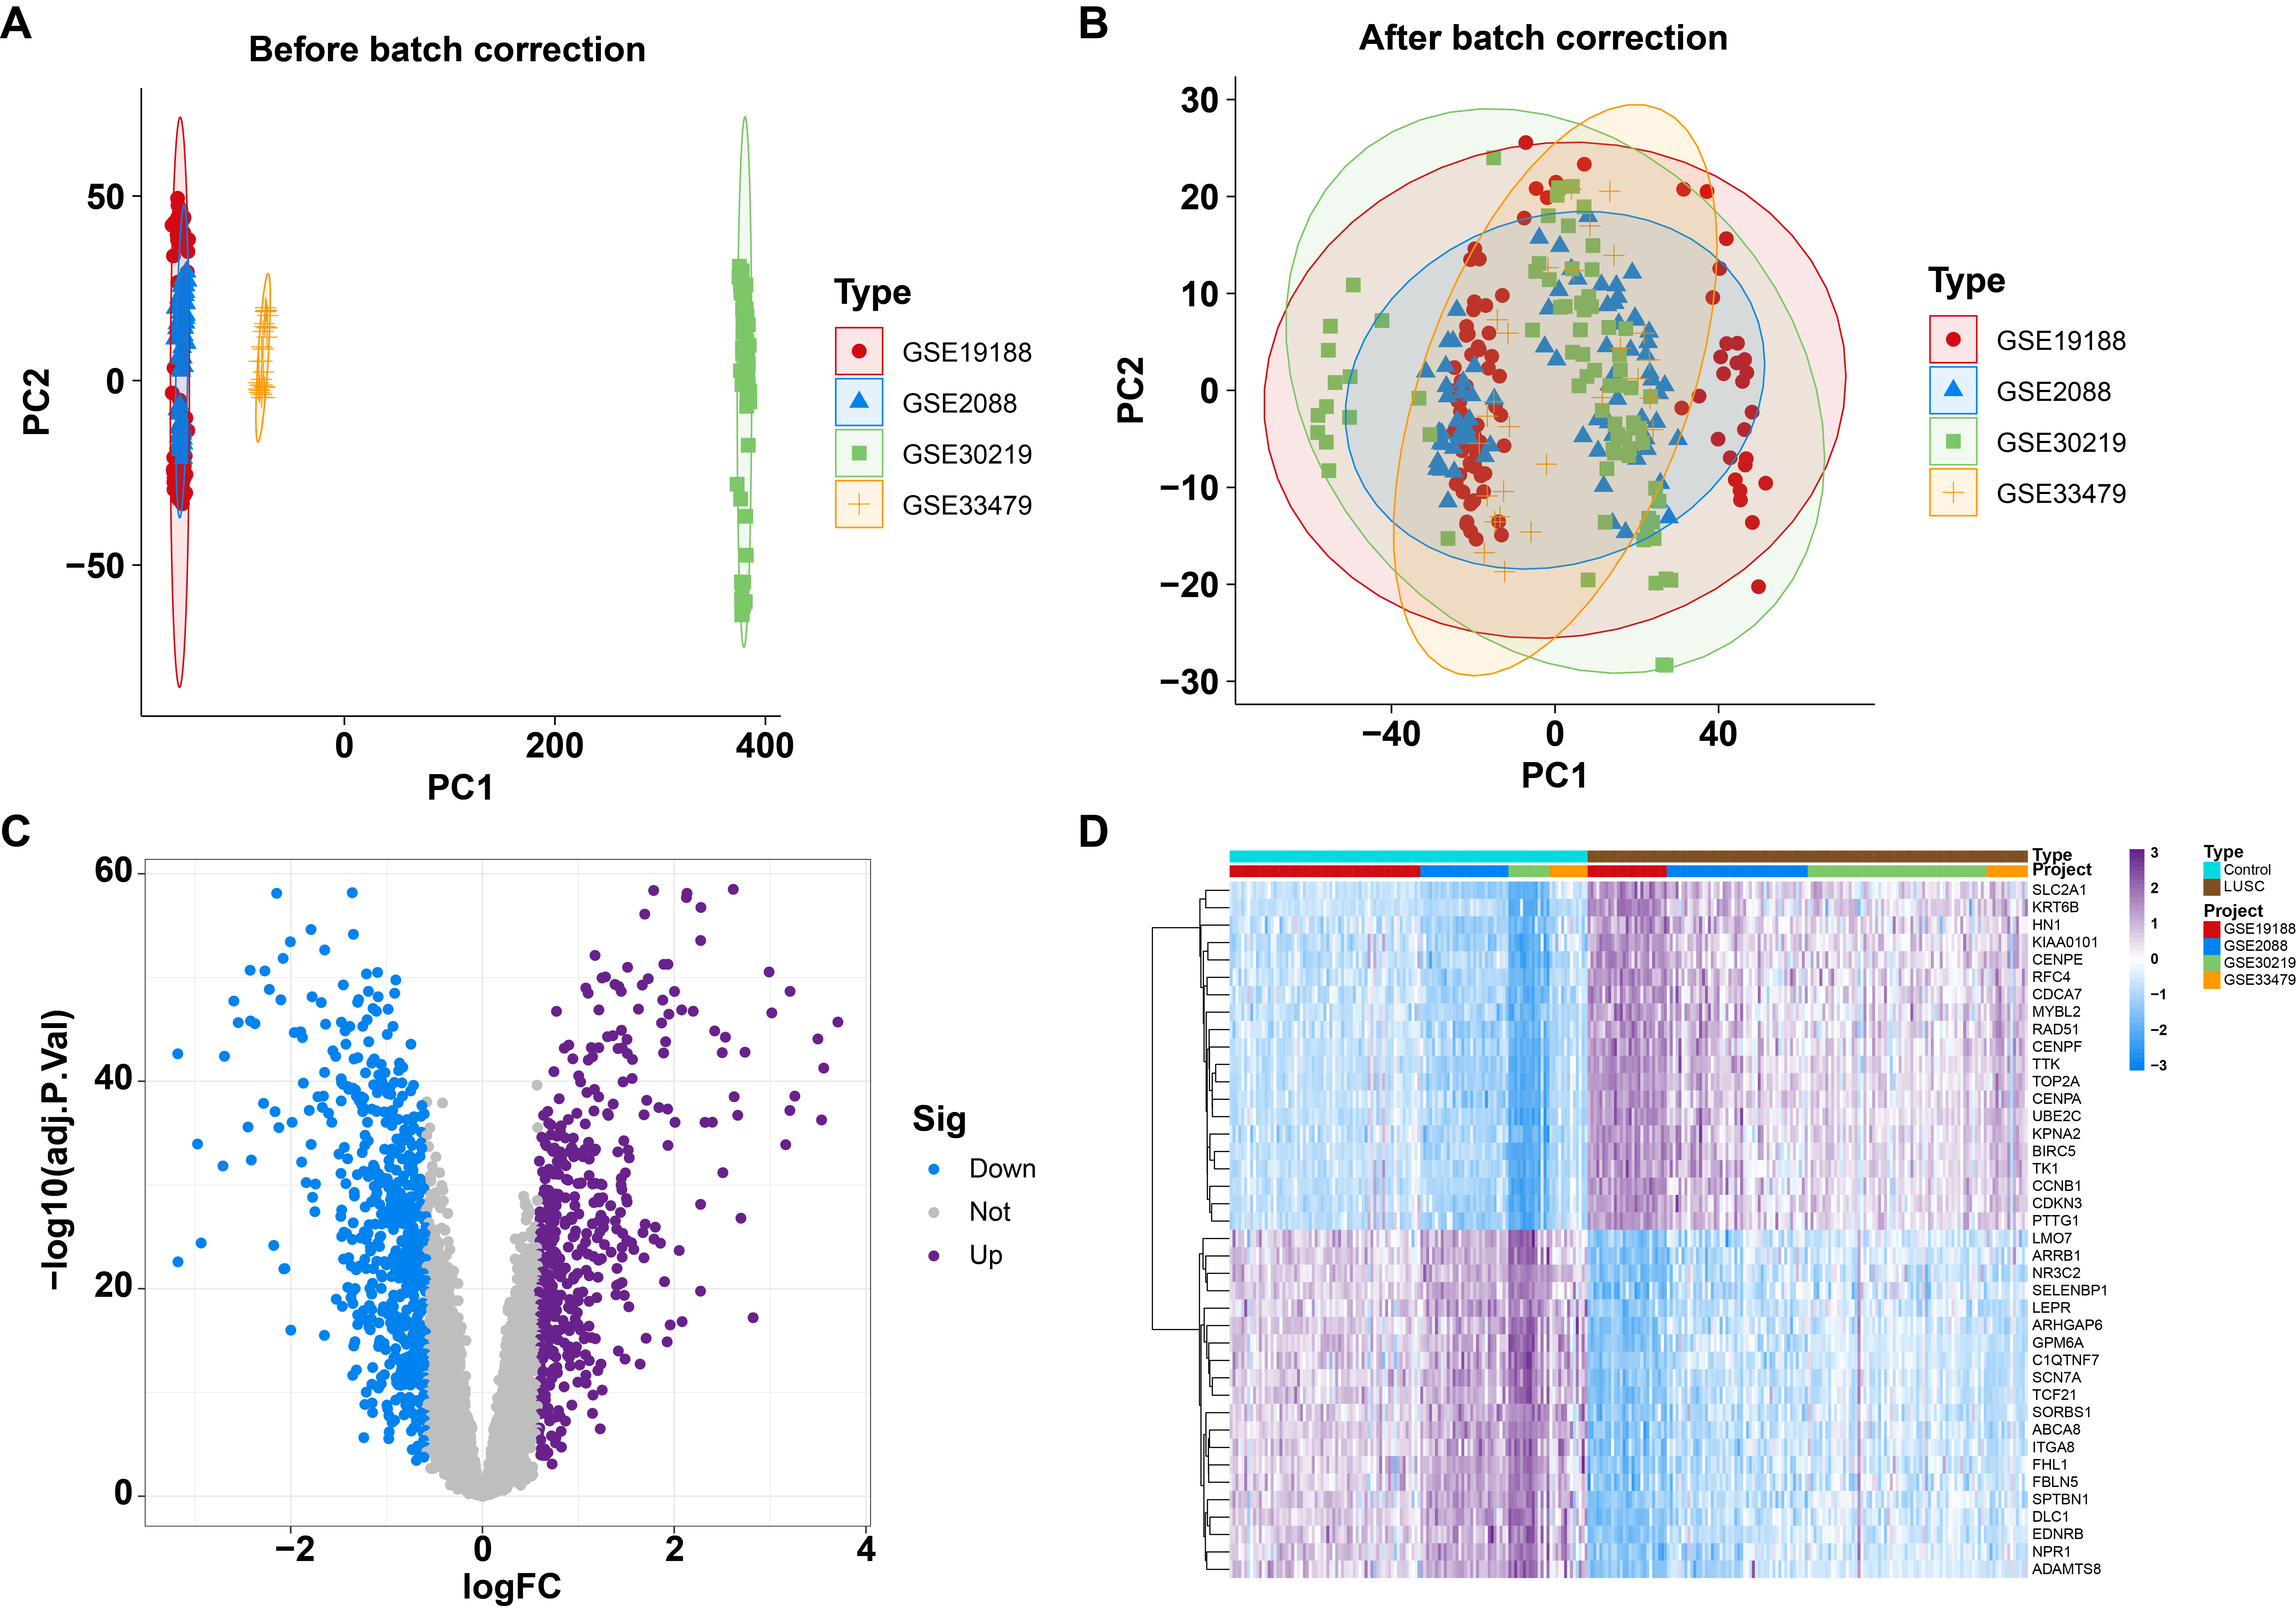 Fig. 1.
Identified differentially expressed genes (DEGs) between normal and lung squamous cell carcinoma (LUSC) individuals from four Gene Expression Omnibus (GEO) datasets. (A) Principal component analysis (PCA) of four GEO datasets before batch correction. (B) PCA of four GEO datasets after batch correction. (C) Volcano plot illustrating DEGs between normal and LUSC patients. (D) Heatmap depicting DEGs between normal and LUSC patients.
To integrate the datasets (GSE19188, GSE2088, GSE30219, and GSE33479) into a
unified training set, batch effects were corrected using the Combat function from
the “sva” package (Version 3.48.0, Bioconductor, USA). DEGs between patients
with LUSC and normal controls were identified using the “limma” package. Genes
with a
The LM22 signature matrix, which includes 22 types of immune cells, was employed
to estimate the relative abundances of infiltrating immune cells for each sample
in the merged training dataset through the CIBERSORT algorithm
(https://cibersort.stanford.edu). The total proportion of the 22 immune cell types
in each sample was normalized to 1. The type and distribution of infiltrating
immune cells were analyzed using the “ggplot2” package (Version 3.4.4, R
Foundation for Statistical Computing, Vienna, Austria) in R software and
presented as barplots and boxplots. Significant differences in the relative
abundances of immune cell types between patients with LUSC and normal controls
were assessed using the Wilcoxon test, with a p-value
To identify the significant co-expression module associated with macrophages, the top 50% of genes exhibiting the highest variance were selected for analysis using the WGCNA package (Version 1.72.1, Bioconductor, USA), ensuring robust results [21, 22]. The optimal soft-thresholding power was determined using a weighted adjacency matrix, which was then converted into a topological overlap matrix (TOM). A minimum module size of 50 genes was set to ensure biologically relevant modules. Modules were assigned distinct colors based on their TOM dissimilarity measure, calculated as 1 minus the TOM value, using hierarchical clustering. The eigengenes of each module were used to represent the overall gene expression profiles within the module. The significance of each module was evaluated for its association with corresponding immune cells. Additionally, gene significance was assessed by evaluating the strength of the relationship between individual genes and immune cells. Higher gene significance values indicated stronger correlations between specific genes and immune cells [22]. Ultimately, 567 key genes in the blue module associated with M1 macrophages were identified.
The R package “VennDiagram” was used to identify 142 overlapping genes between DEGs and blue module-associated genes. To investigate the biological functions of these genes, GO functional enrichment and KEGG pathway analyses were conducted using the R packages “clusterProfiler” (Version 4.8.3, Bioconductor, USA), “org.Hs.eg.db” (Version 3.17.0, Bioconductor, USA), and “enrichplot” (Version 1.20.3, Bioconductor, USA). Statistical significance was determined with an adjusted p-value threshold of less than 0.05. Results were visualized using bar plots and circle plots, generated with the “ggplot2” (Version 3.4.4, R Foundation for Statistical Computing, Vienna, Austria) and “circlize” (Version 0.4.15, R Foundation for Statistical Computing, Vienna, Austria) packages in R, respectively.
The 142 overlapping genes were then used as input features for four machine learning models: SVM, RF, GLM, and XGB, aimed at identifying significant predictive genes associated with LUSC. The 150 LUSC samples were randomly split into two datasets: a training dataset (60%, N = 90) and an internal validation dataset (40%, N = 60). These models were executed with default parameters, and the “caret” R package (Version 6.0.94, R Foundation for Statistical Computing, Vienna, Austria) was employed to optimize model parameters via grid search. The “DALEX” package (Version 2.4.3, R Foundation for Statistical Computing, Vienna, Austria) was subsequently used to analyze residual distributions and assess feature importance for the four models [23]. To evaluate the predictive accuracy of the models, the internal validation dataset was used for area under the curve (AUC) analysis via 5-fold cross-validation. Higher AUC values indicate superior model performance [24]. The most effective machine learning model was identified, and the top five variables from this model were determined as key predictive genes linked to LUSC. Finally, receiver operating characteristic (ROC) curves were generated using three external datasets (GSE33532, GSE21933, and GSE8569) to validate the diagnostic value of the signature derived from the best-performing machine learning model.
A nomogram model was constructed using the “rms” package (Version 6.6.0, R Foundation for Statistical Computing, Vienna, Austria) to predict the likelihood of LUSC. Scores were assigned to five key genes, and their sum formed the “total score”, which was used as an indicator of LUSC risk severity. Calibration curve analysis and DCA were also performed to assess the predictive accuracy and clinical utility of the nomogram model.
The discriminative ability of the predictive model to distinguish between patients with LUSC and healthy controls was validated using three independent external datasets (GSE33532, GSE21933, and GSE8569). ROC analysis was conducted, and the “pROC” R package (Version 1.18.5, R Foundation for Statistical Computing, Vienna, Austria) was employed to generate and visualize the ROC curves.
Forty-eight pairs of LUSC tissue samples were collected from
Tianjin Medical University Cancer Institute and Hospital, with approval from the
Ethics Committee (No. bc2023152). Informed consent was obtained from all subjects involved in the study. The study was carried out in accordance with
the ethical guidelines of the Declaration of Helsinki. Immunohistochemical (IHC)
analysis was performed on a cohort of 48 individuals diagnosed with LUSC
following the manufacturer’s protocol (#PV-9000, ZSGB-BIO, Beijing, China).
Tissue sections were dewaxed and hydrated using a gradient ethanol approach.
After antigen retrieval in citric acid buffer (pH 6.0) with microwave heating,
endogenous peroxidase was blocked for 10 minutes. Sections were then incubated
overnight at 4 °C with primary antibodies: ZIC2 rabbit polyclonal
antibody (1:100, HA500195, Huabio, Hangzhou, Zhejiang, China), RTN1 rabbit
polyclonal antibody (1:50, 15048-1-AP, Proteintech, Wuhan, Hubei, China), MMP7
rabbit polyclonal antibody (1:50, 10374-2-AP, Proteintech, Wuhan, Hubei, China),
KLRB1 mouse monoclonal antibody (1:500, 67537-1-lg, Proteintech, Wuhan, Hubei,
China), and CXCL13 rabbit monoclonal antibody (1:50, HA722117, Huabio, Hangzhou,
Zhejiang, China). After washing, sections were treated with a reaction enhancer
and enzyme-linked secondary antibody (sheep anti-rabbit/mouse IgG) (#PV-9000,
ZSGB-BIO, Beijing, China). Staining was visualized using DAB chromogen, and
counterstaining was performed with hematoxylin. Digital images at
Statistical analyses were performed using R software (Version 4.3.1). For
comparisons between two groups, unpaired Student’s t-tests were applied
for normally distributed variables, and Wilcoxon rank-sum tests were used for
non-normally distributed variables. Spearman correlation analysis was conducted
to estimate correlation coefficients. Statistical significance was defined as
p
To identify differential expression between lung squamous cell carcinoma (LUSC) and normal samples, four GEO datasets (GSE19188, GSE2088, GSE30219, and GSE33479) underwent batch correction and were subsequently merged into a large sample pool to form the training cohort. Principal component analysis (PCA) and boxplot analyses confirmed that batch effects were effectively minimized across the four original datasets (Fig. 1A,B; Supplementary Fig. 1). Differential expression analysis identified a total of 1032 DEGs, including 466 upregulated and 566 downregulated genes, between 122 control samples and 150 LUSC samples (Fig. 1C; Supplementary Table 2). Heatmaps depicted the top 20 genes with the most significant expression changes, either upregulated or downregulated (Fig. 1D).
Next, we explored the immune landscape in LUSC by assessing the abundance of 22 immune cell types using the CIBERSORT algorithm (Fig. 2A). Significant differences between control and LUSC samples were analyzed using the Wilcoxon rank-sum test. Boxplots and statistical results revealed that T cells CD4 memory resting, monocytes, mast cells resting, T cells CD4 memory activated, and M1 macrophages were the top five immune cell types showing significant differences between control and LUSC groups (Fig. 2B; Supplementary Table 3). Correlation analyses of the 22 types of infiltrating immune cells in patients with LUSC are shown in Fig. 2C.
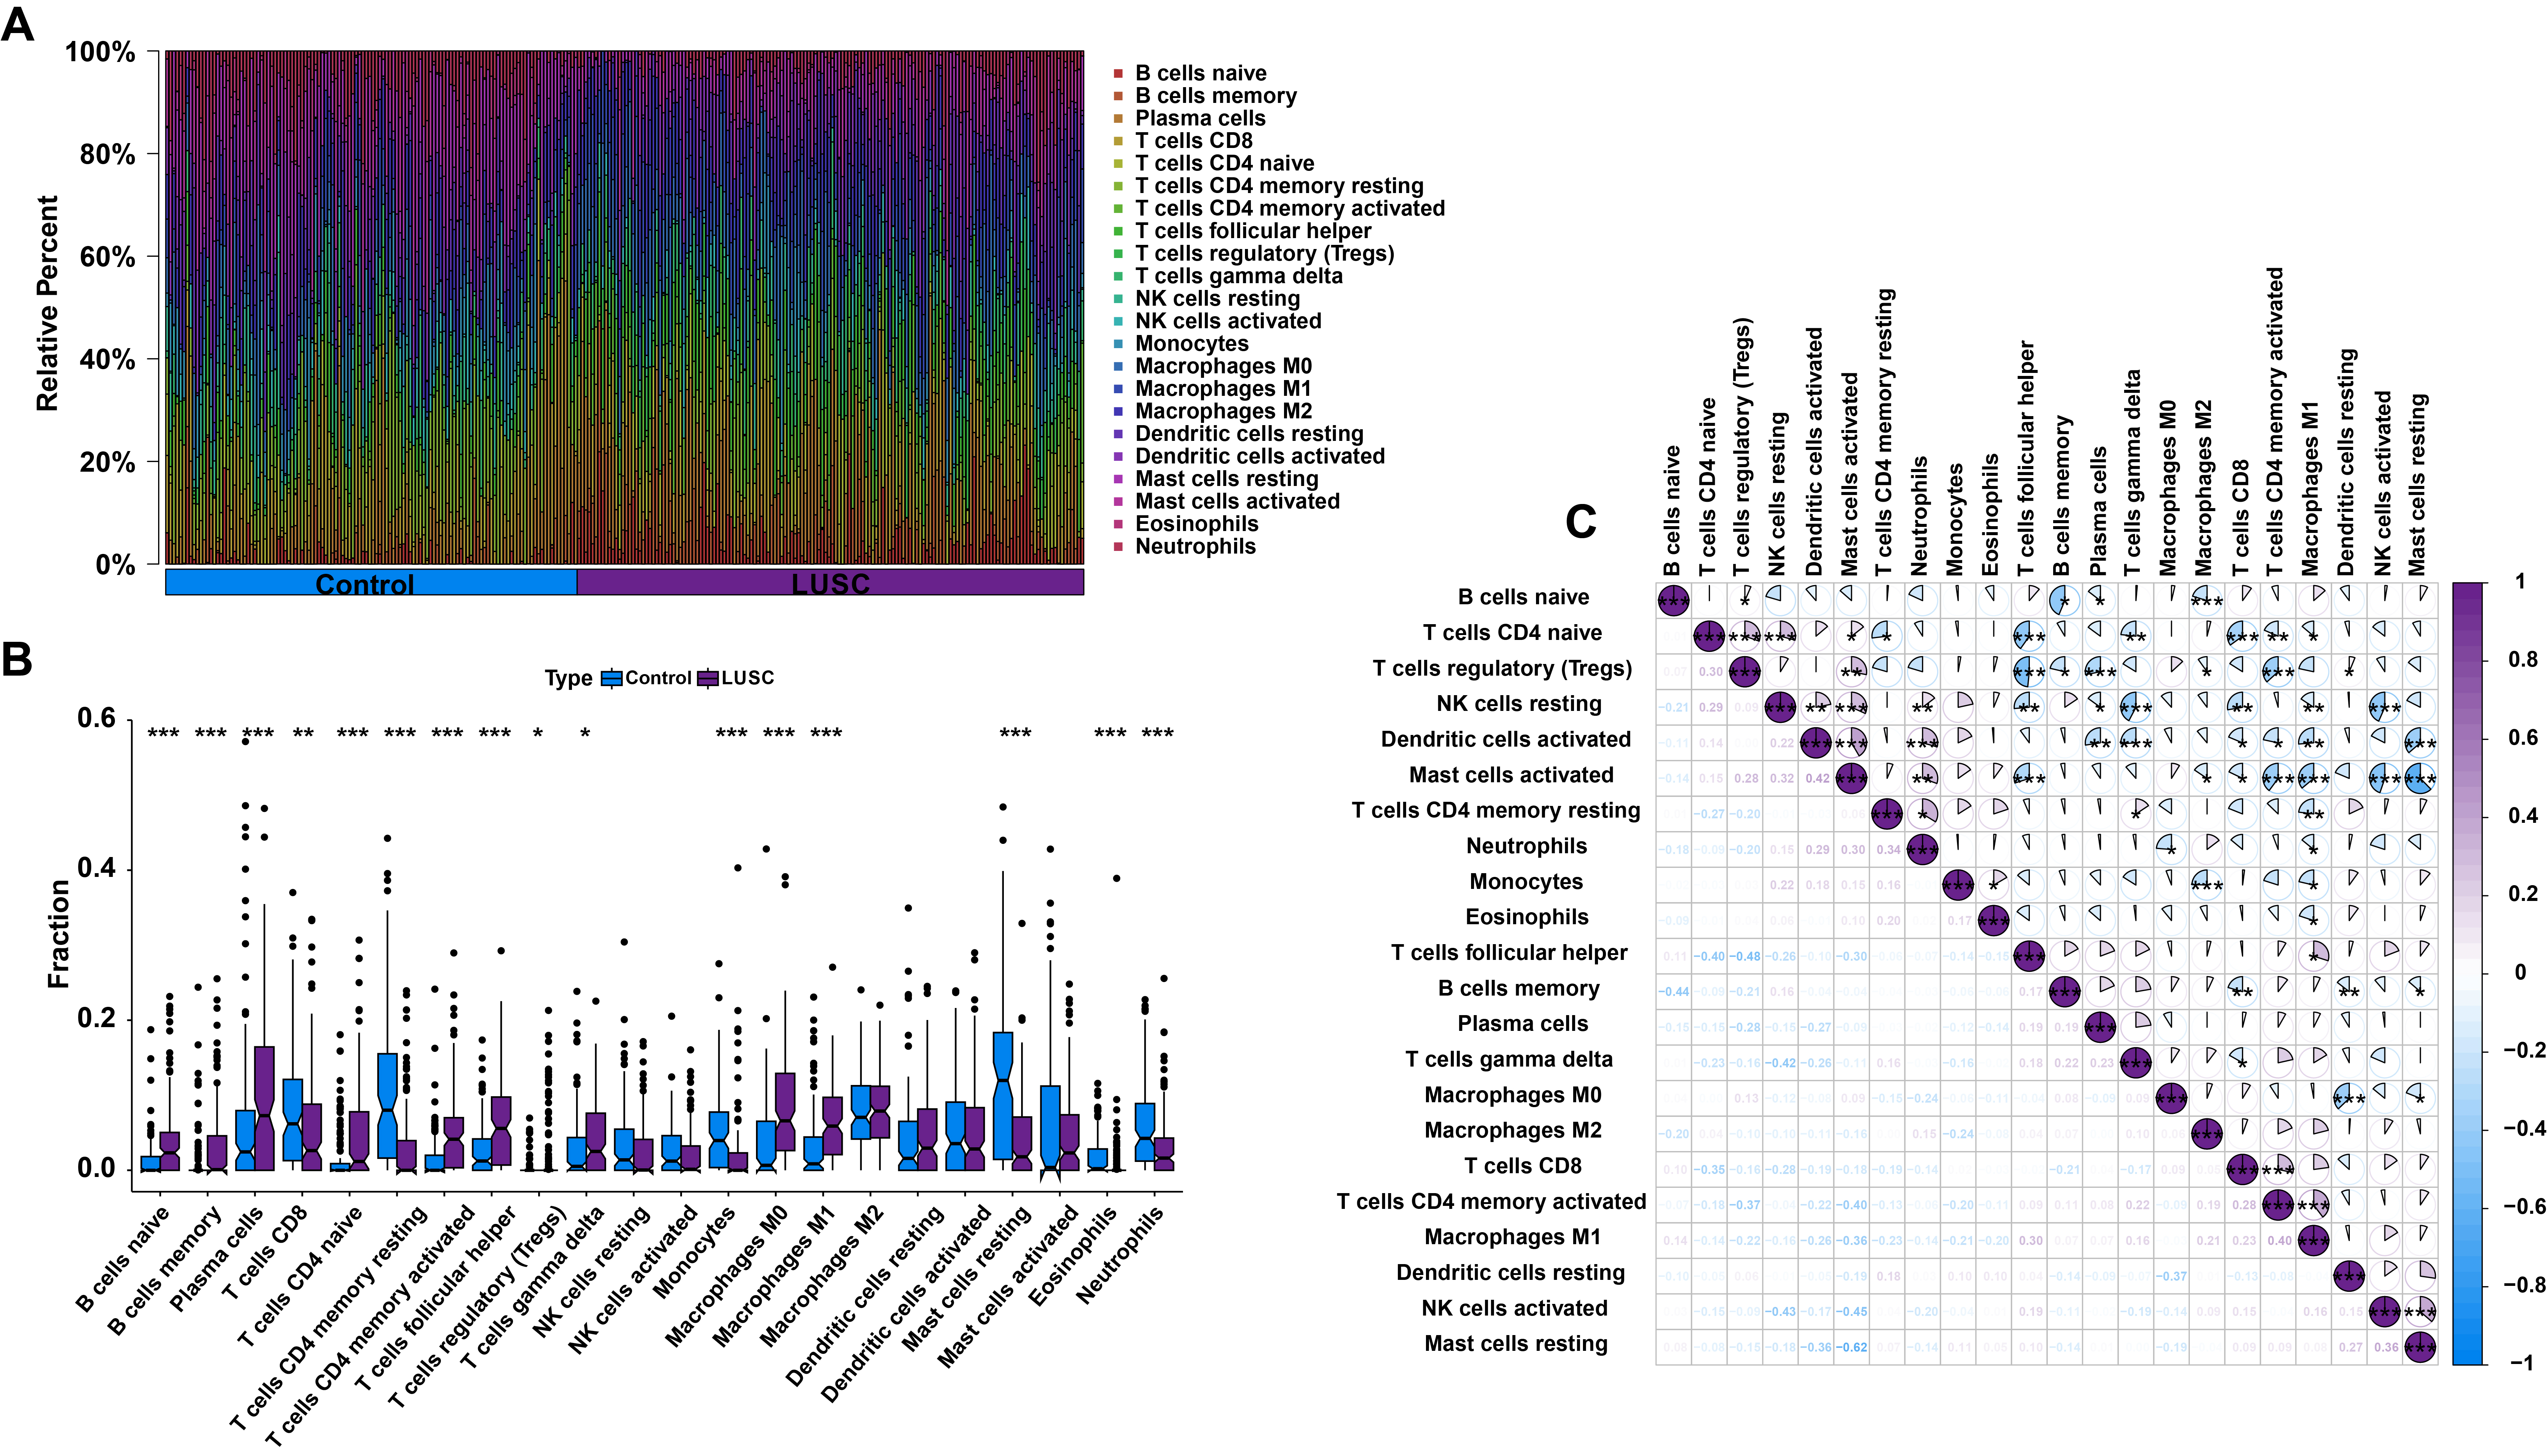 Fig. 2.
Analysis of immune characteristics in LUSC. (A) Barplot showing
the distribution of 22 types of infiltrating immune cells in control and LUSC
samples. (B) Differential expression analysis of 22 types of infiltrating immune
cells between control and LUSC samples. (C) Correlation analysis among 22 types
of infiltrating immune cells in LUSC patients. *p
To gain insight into the genes associated with M1 macrophages, the WGCNA
algorithm was applied to identify gene modules strongly associated with immune
cell types. The optimal soft-thresholding parameters were determined as
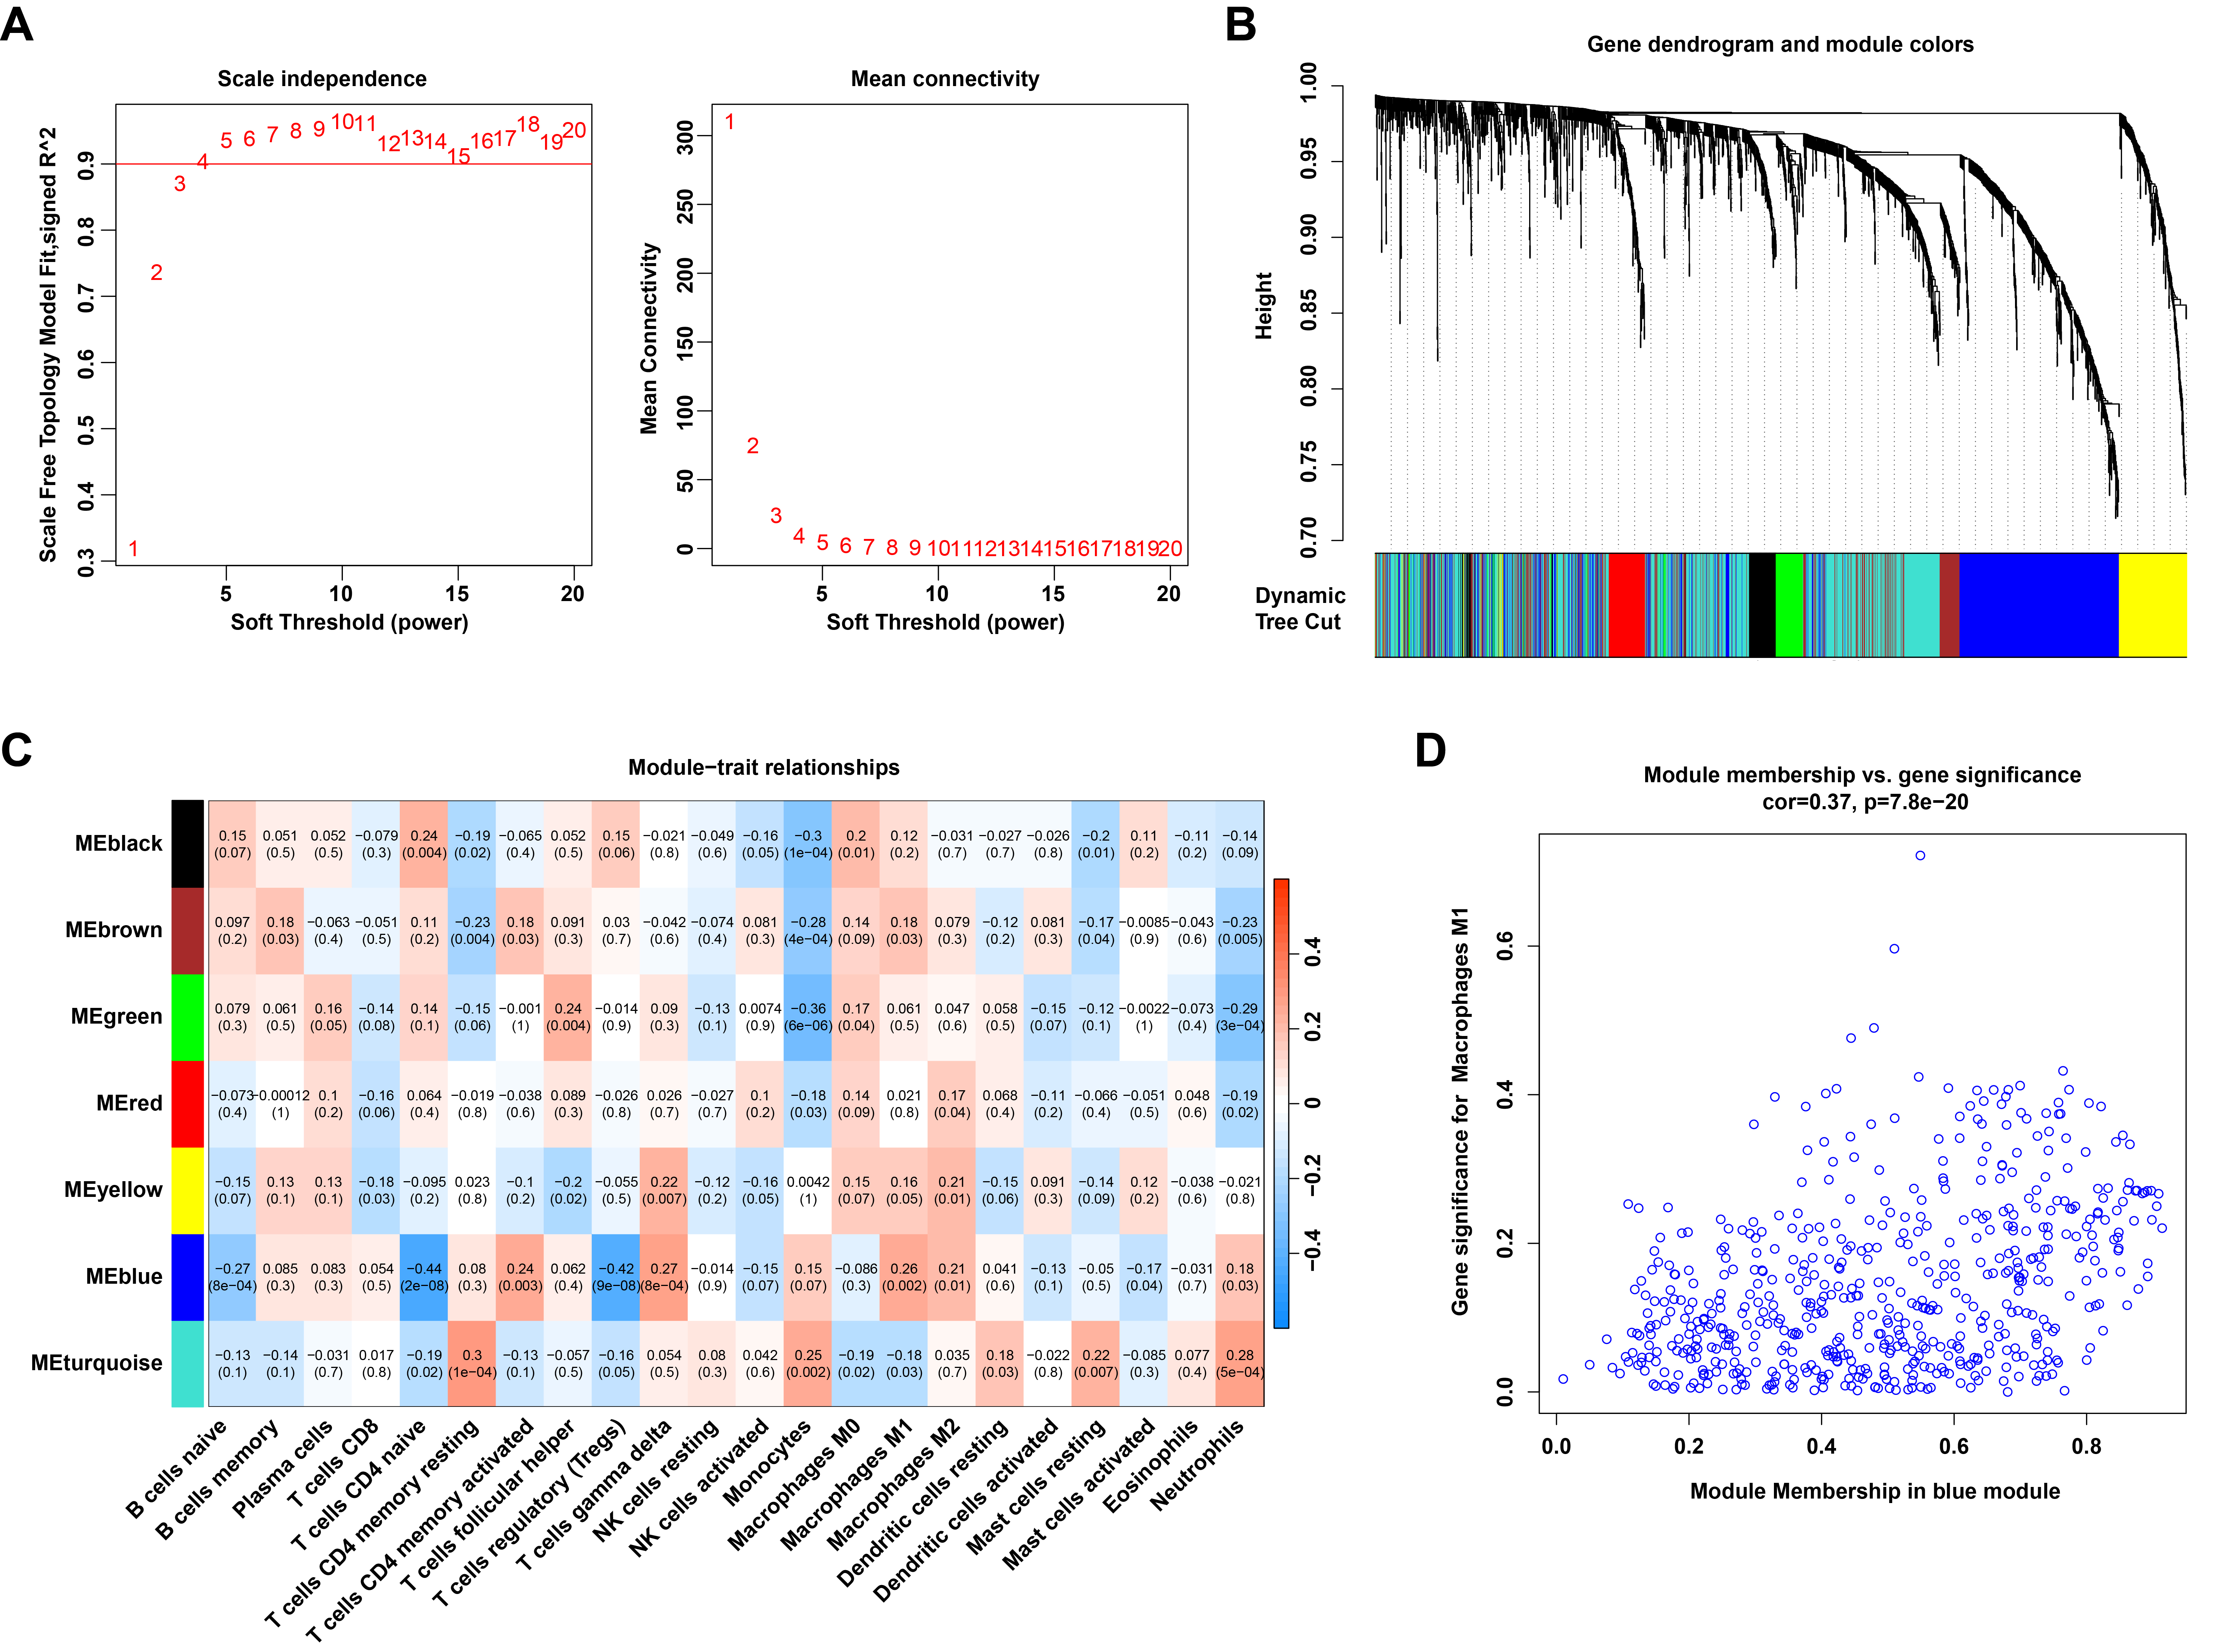 Fig. 3.
Identification of M1 macrophage-related genes through WGCNA. (A) The process for selecting the soft threshold power. (B) Cluster dendrogram of genes grouped into co-expression modules, with various modules represented by distinct colors. (C) Correlation analysis between module eigengenes and 22 types of infiltrating immune cells. (D) Scatter plot showing the relationship between module membership in the blue module and gene significance for M1 macrophages.
To identify M1 macrophage-related DEGs, the DEGs were intersected with the genes from the WGCNA blue module. A Venn diagram revealed that 143 M1 macrophage-related DEGs were obtained (Fig. 4A; Supplementary Table 4). GO analysis indicated that these genes are involved in leukocyte- or lymphocyte-mediated immunity, antigen processing and presentation of peptide antigens, assembly of major histocompatibility complex (MHC) class I or II protein complexes, regulation of immune response signaling pathways, and positive regulation of immune cell-cell adhesion (Fig. 4B; Supplementary Table 5). KEGG pathway analysis revealed that these genes are associated with signaling pathways in rheumatoid arthritis, asthma, Fc epsilon RI signaling, chemokine signaling, and Tumor Necrosis Factor Signaling (TNF) signaling (Fig. 4C; Supplementary Table 6).
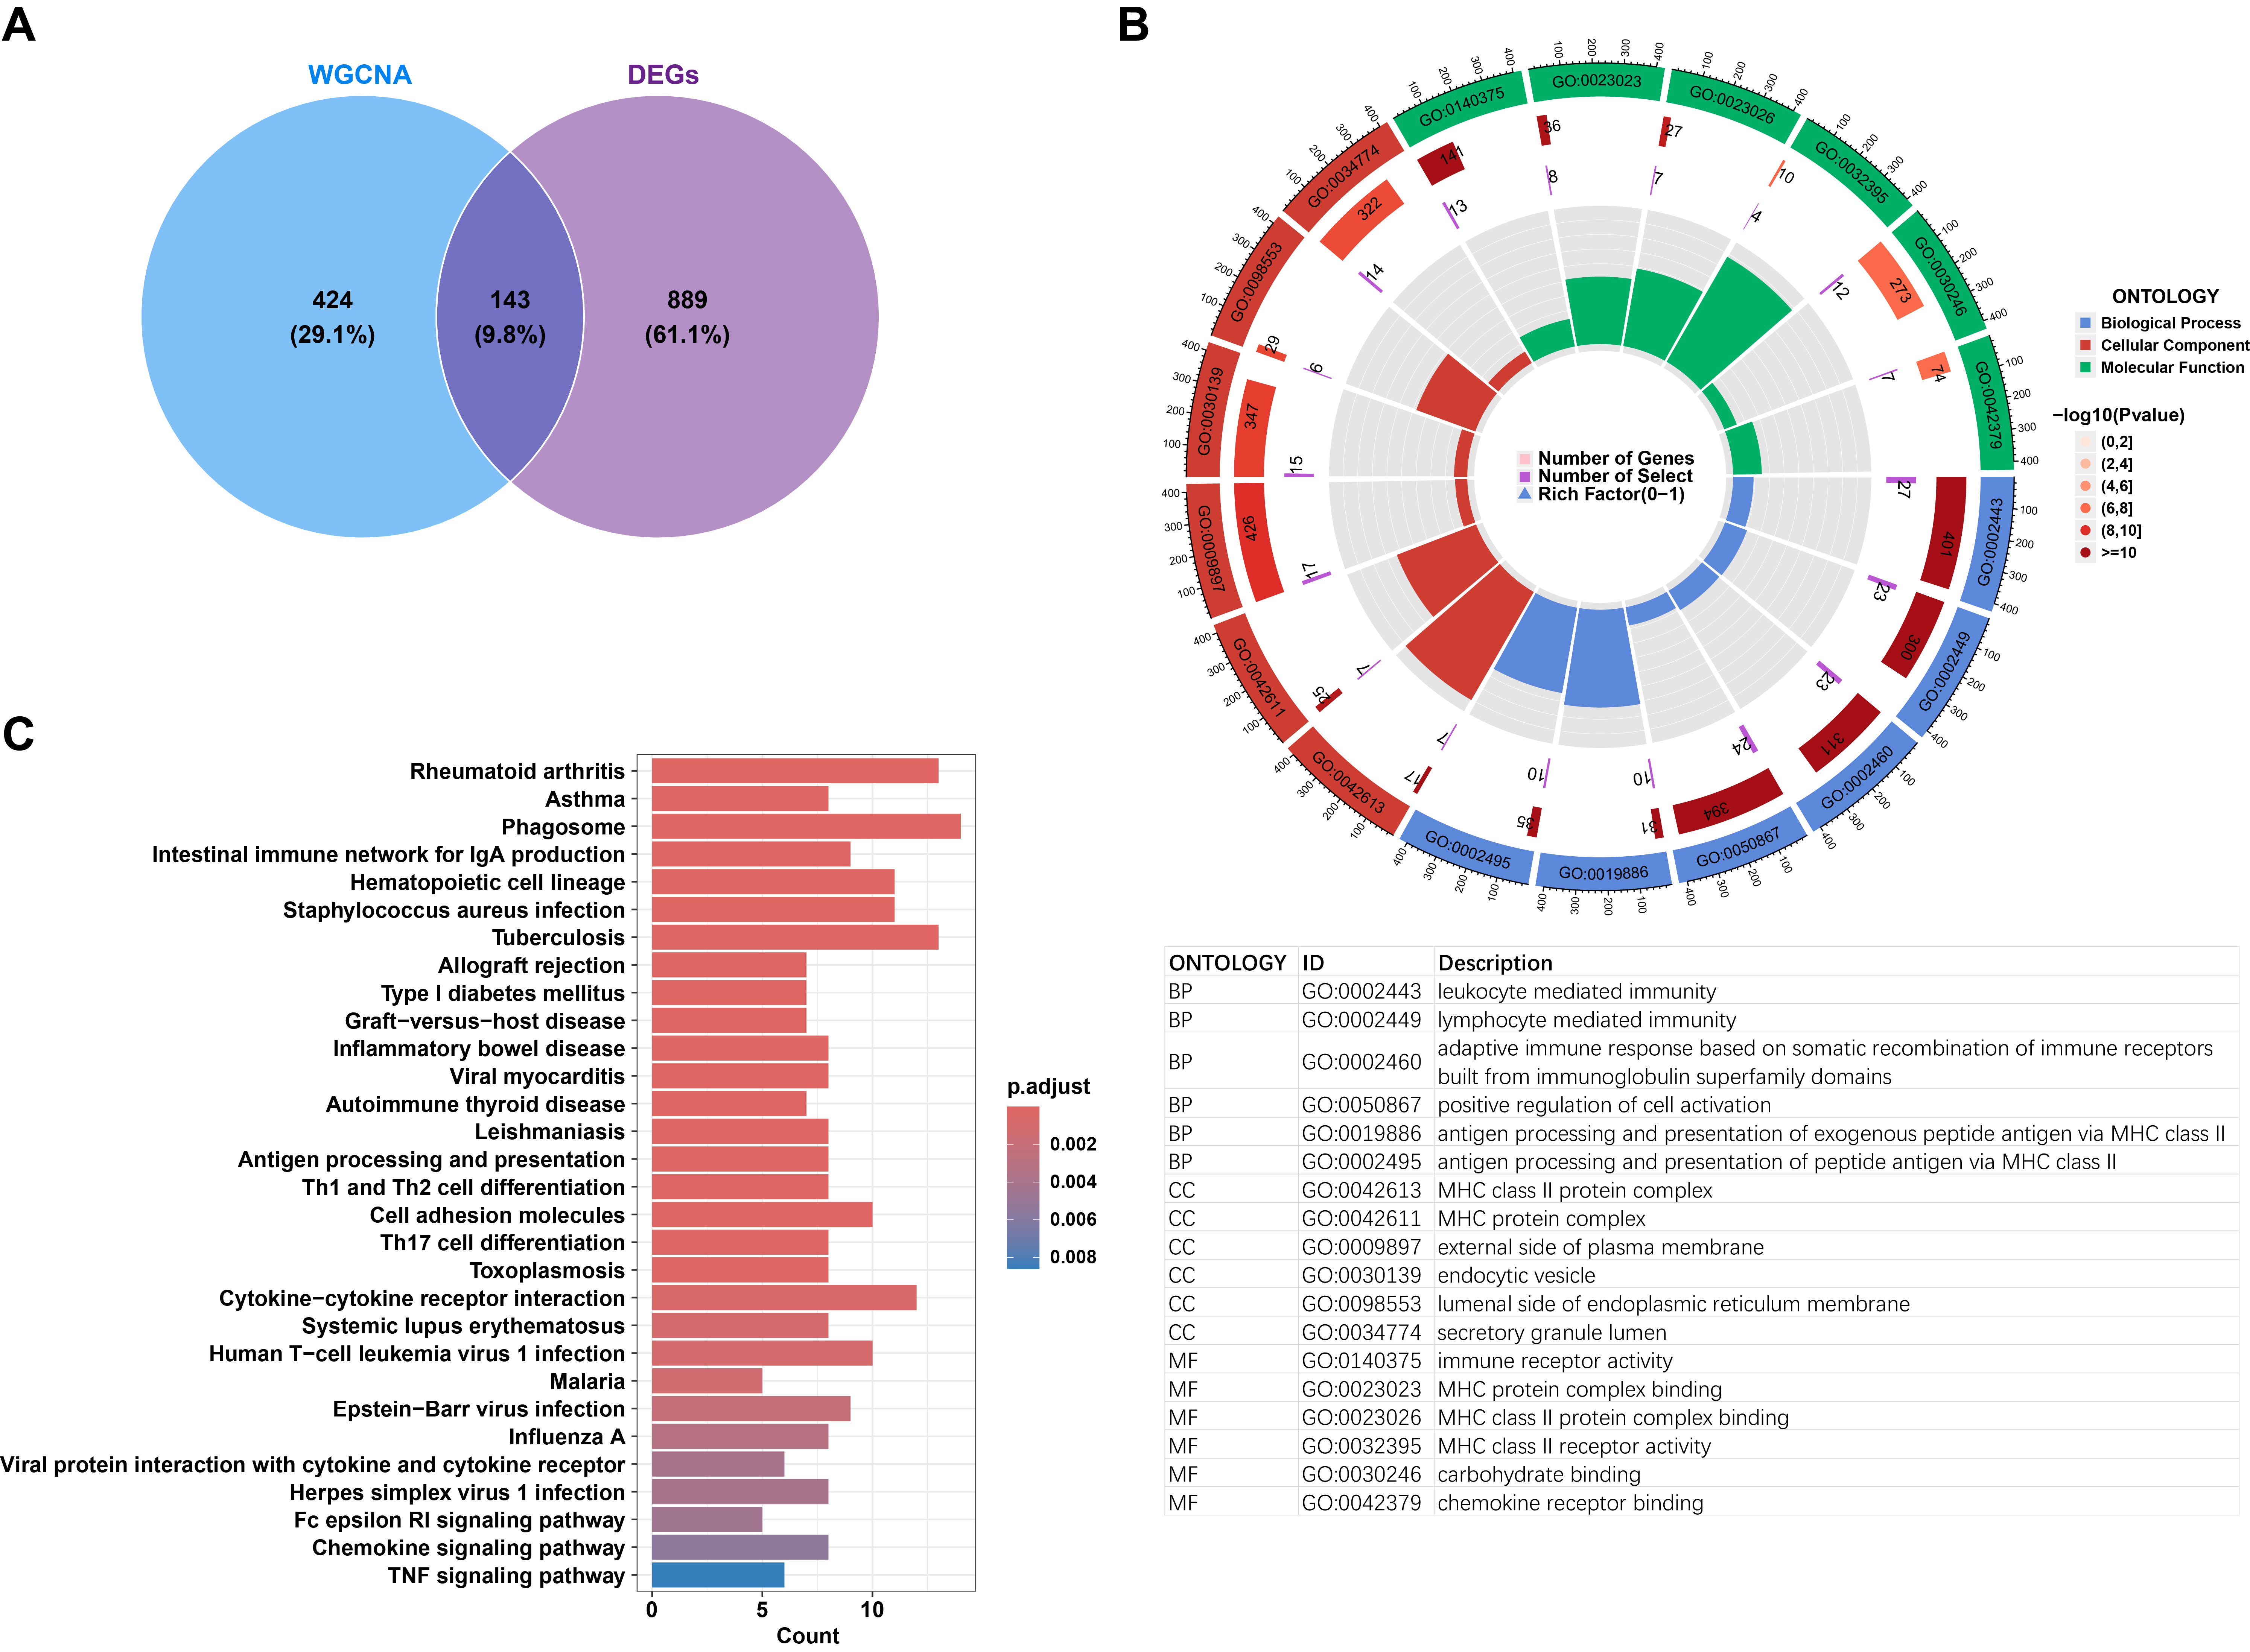 Fig. 4.
Biological functional analysis of differentially expressed M1 macrophage-related genes. (A) Venn diagram illustrating the overlapping and unique differentially expressed M1 macrophage-related genes. (B) Circular visualization of Gene Ontology (GO) analysis highlighting the biological functions associated with differentially expressed M1 macrophage-related genes. (C) Barplot depicting the signaling pathways enriched in the differentially expressed M1 macrophage-related genes.
To explore the potential of these M1 macrophage-related DEGs for LUSC diagnosis, four machine learning models—SVM, XGB, RF, and GLM—were constructed based on the expression profiles of 143 M1 macrophage-related DEGs in the training dataset to identify diagnostic genes for LUSC. Residual distribution analysis revealed that SVM and XGB exhibited smaller residuals compared to RF and GLM (Fig. 5A,B). The top 10 feature variables for each model were ranked by their root mean square error (RMSE), and their corresponding feature importance was visualized in Fig. 5C. Additionally, the performance of each machine learning model was evaluated using ROC curves generated through five-fold cross-validation on the testing datasets. The results showed that the SVM model achieved the highest AUC value (AUCSVM = 0.995, AUCRF = 0.988, AUCXGB = 0.983, and AUCGLM = 0.622) (Fig. 5D). These findings demonstrate that the SVM model was the most effective for distinguishing patients with LUSC. Consequently, MMP7, RTN1, ZIC2, KLRB1, and CXCL13 were identified as novel predictive genes (5-gene signature) for LUSC due to their high significance in the SVM model.
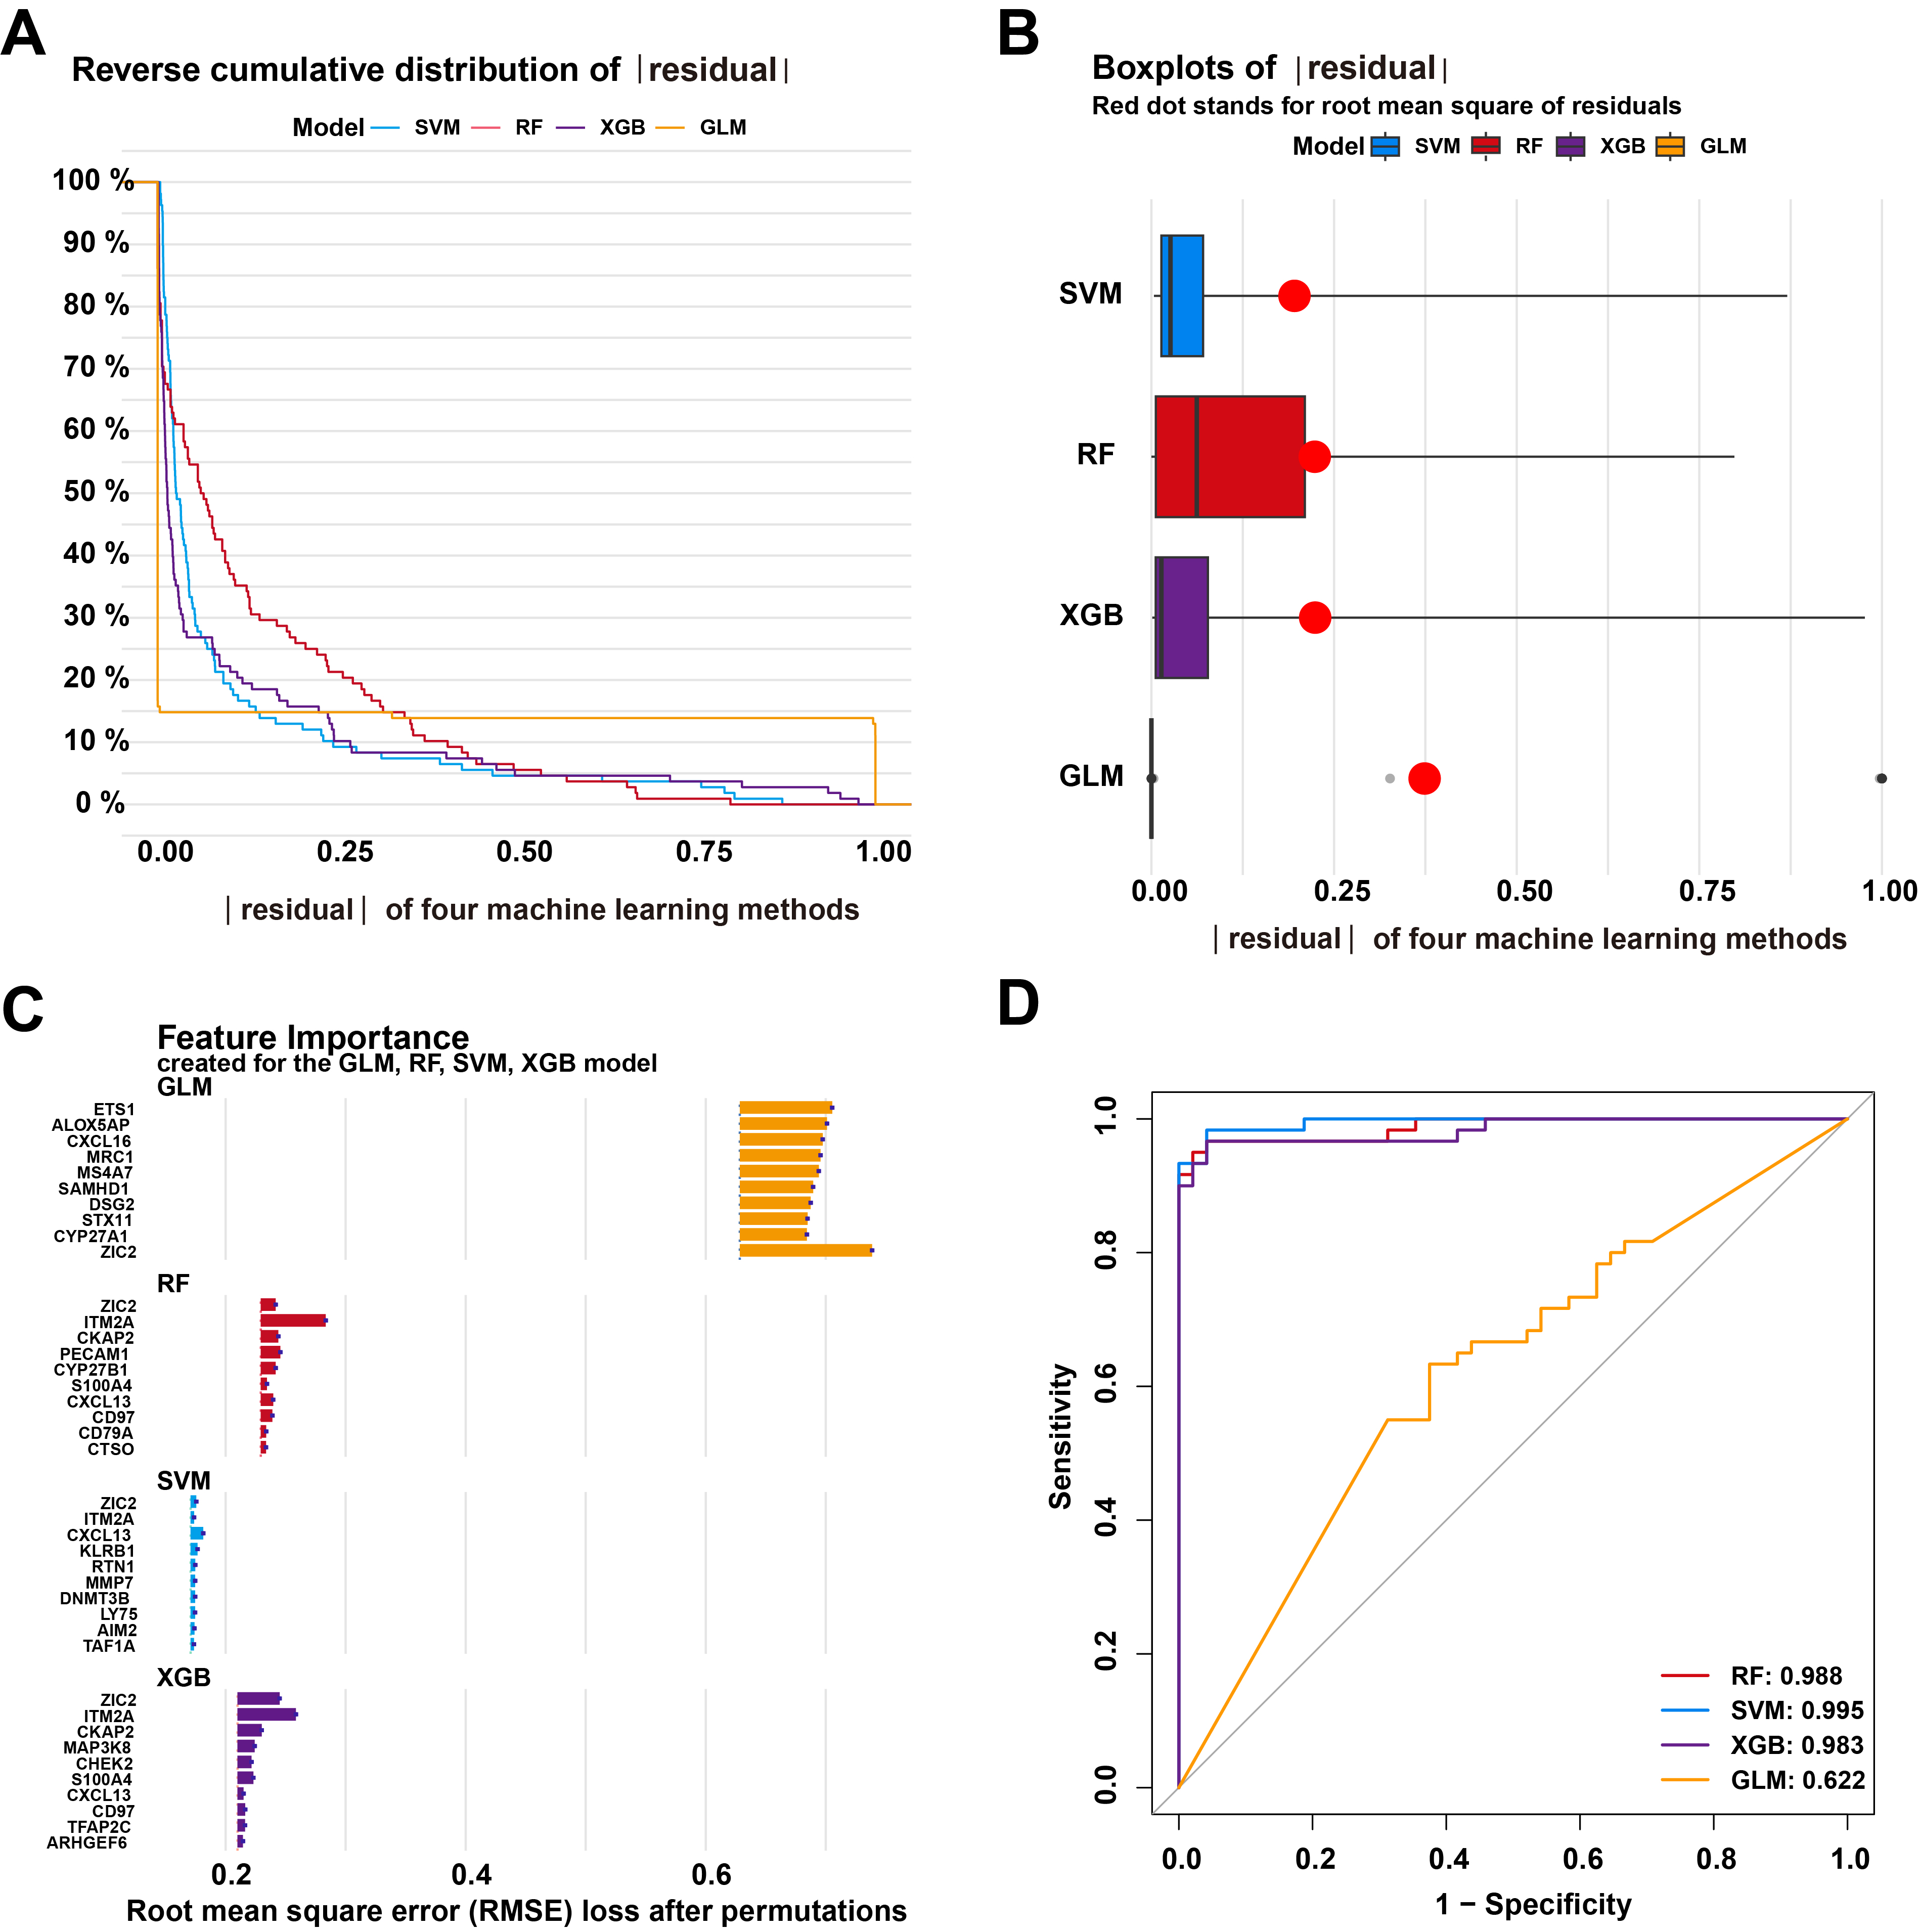 Fig. 5.
Development and evaluation of the machine learning models based on 143 M1 macrophage-related genes. (A) The cumulative residual distribution of Support Vector Machine (SVM), Extreme Gradient Boosting (XGB), Random Forest (RF), and Generalized Linear Model (GLM) models. (B) The residual boxplots of the four machine learning models. (C) The important features of the four machine learning models. (D) Receiver operating characteristic (ROC) analysis of these models using 5-fold cross-validation in the internal testing dataset.
To assess the predictive power of the 5 hub genes, a nomogram was developed to estimate the risk associated with LUSC (Fig. 6A). The calibration curve showed excellent agreement between actual and predicted risks (Fig. 6B). DCA further validated the high accuracy and clinical utility of the nomogram (Fig. 6C). The predictive performance of the 5 hub genes was also evaluated in three independent external testing datasets. The AUC values for GSE33532, GSE21933, and GSE8569 were all 1.000, as demonstrated by the ROC curves (Fig. 6D–F). These results confirm that the diagnostic signature developed in this study exhibits robust performance in distinguishing LUSC from normal individuals across both internal and external validation cohorts.
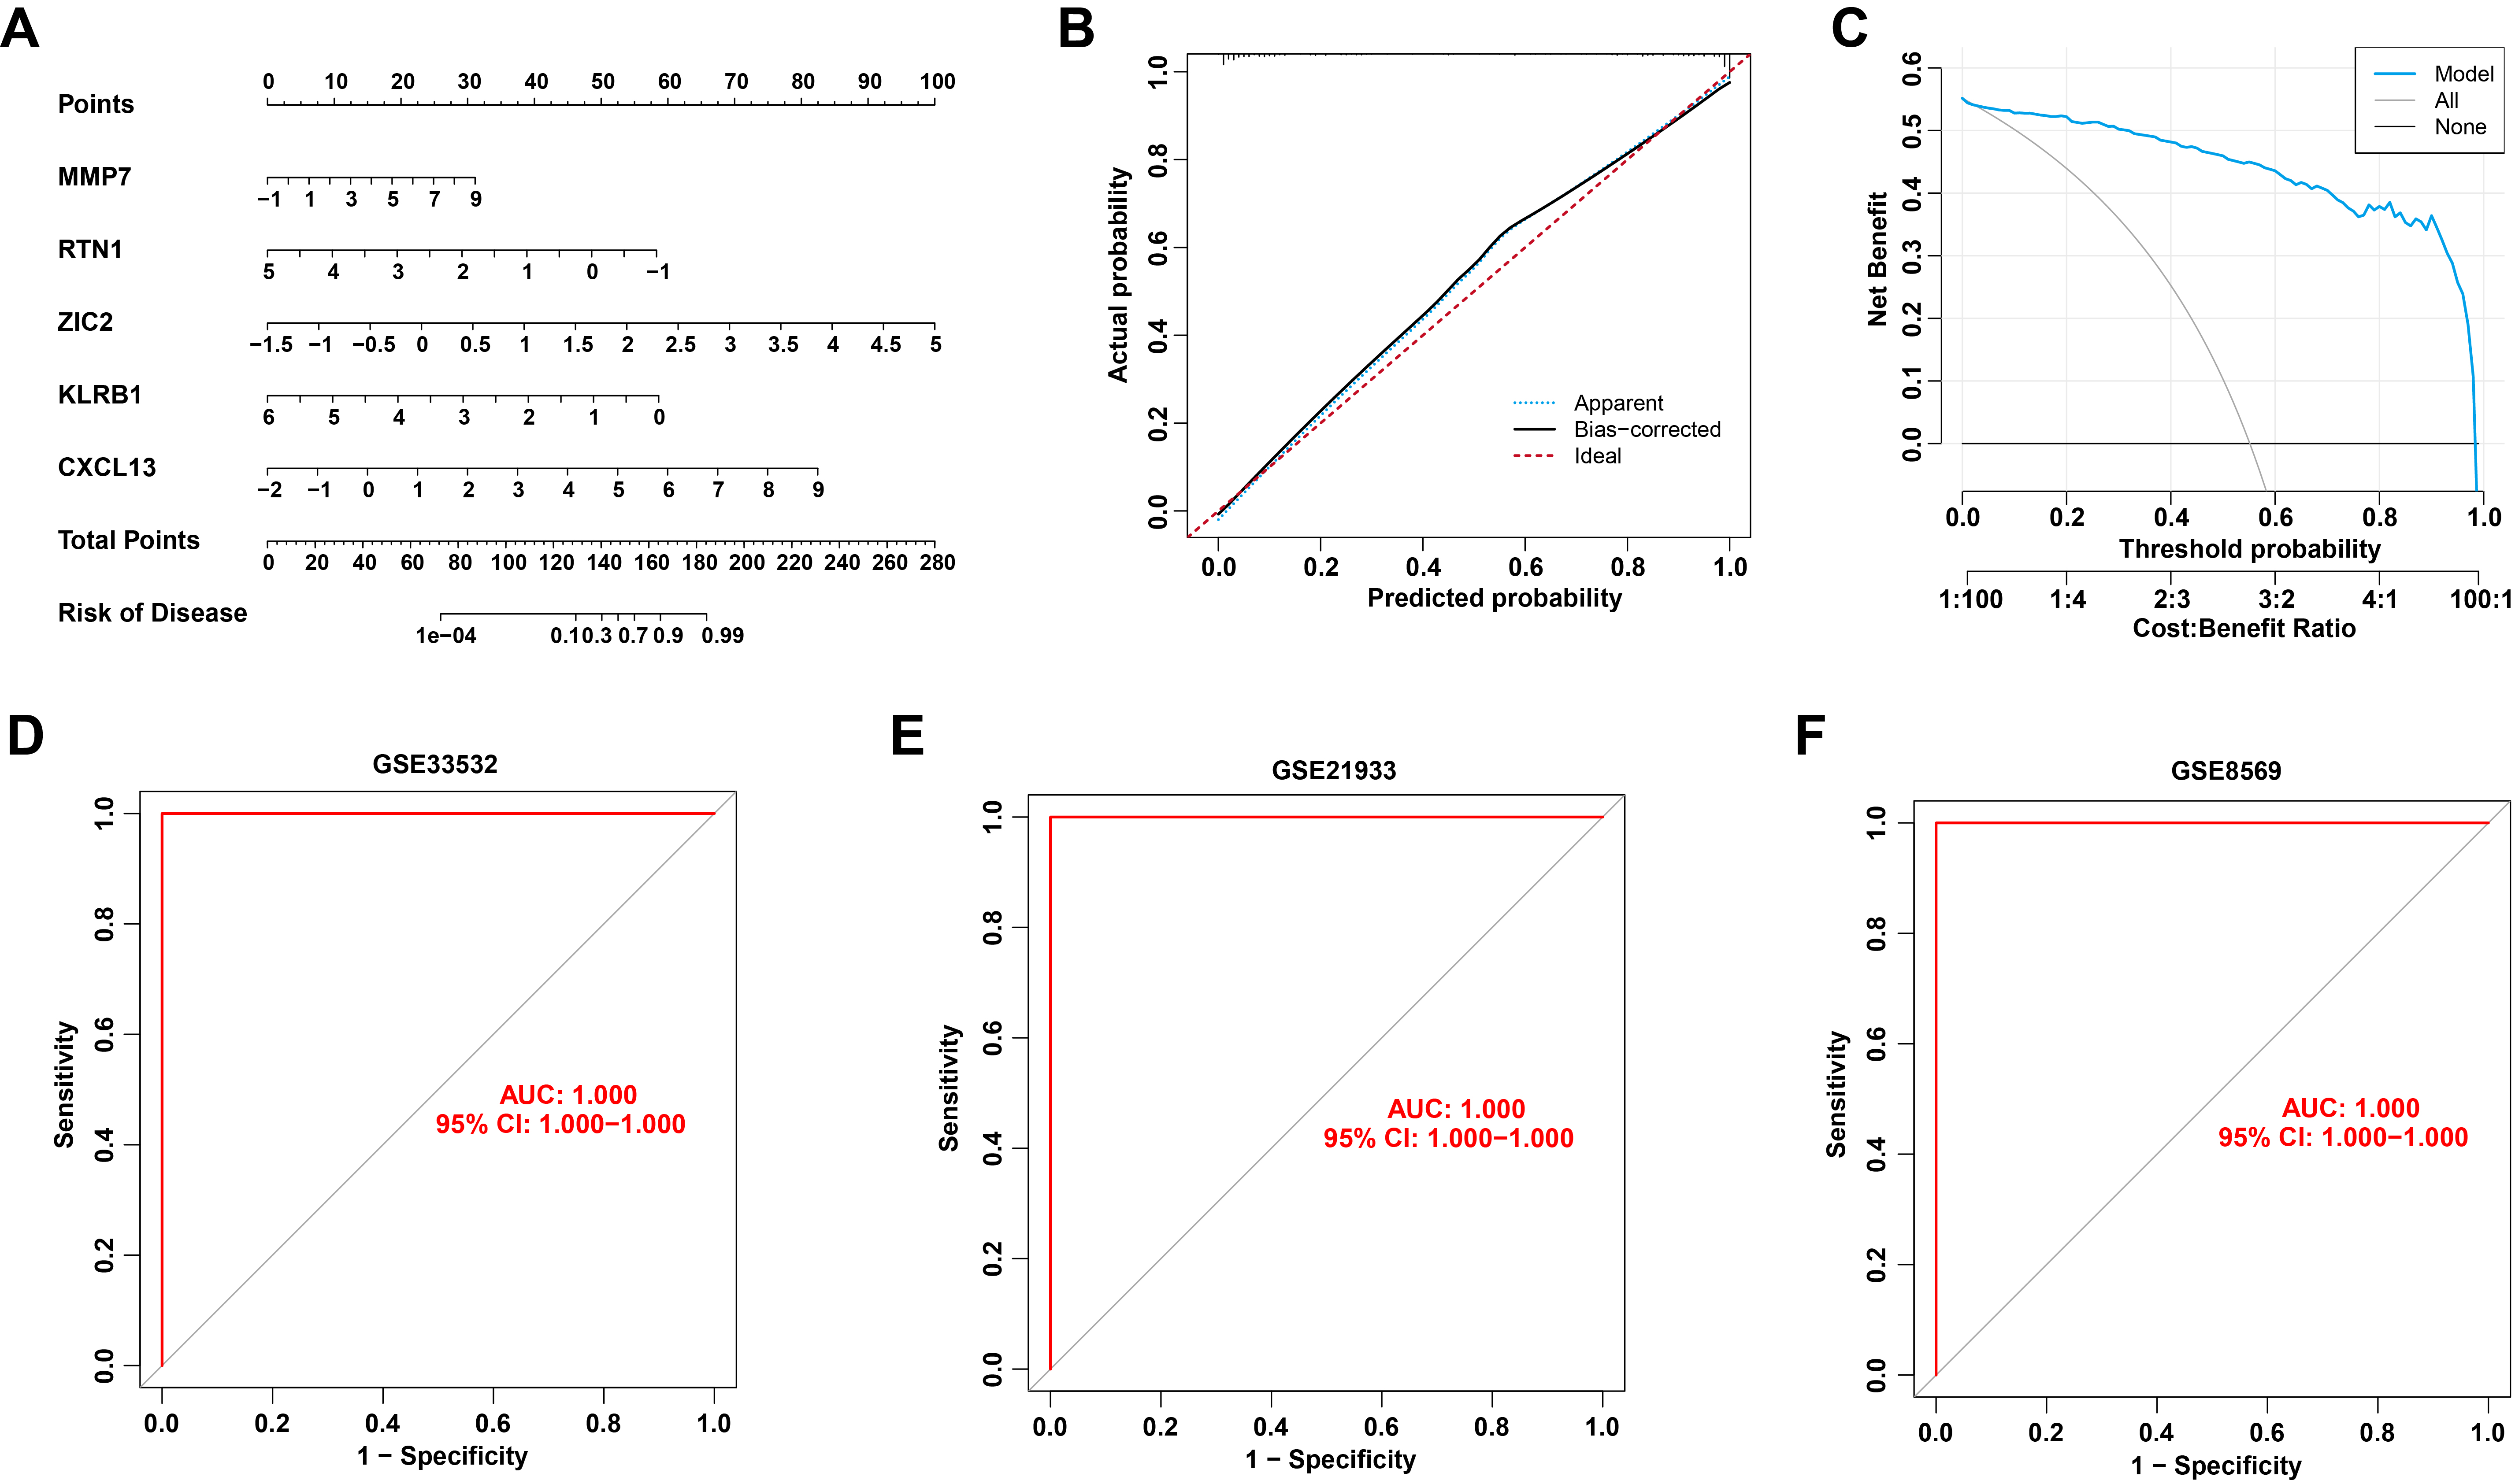 Fig. 6.
Validation of the 5-gene diagnostic signature. (A) Nomogram of 5 hub genes for predicting the risk of LUSC. (B,C) Calibration curve (B) and decision curve analysis (DCA) (C) for validating the predictive accuracy of the nomogram. (D–F) ROC curve of the 5 hub genes in external GSE33532 (D), GSE21933 (E), and GSE8569 (F) datasets.
To validate the predictive performance of M1 macrophage-associated biomarkers, IHC experiments were performed to evaluate the protein expression levels of candidate genes in tissue samples. IHC results show ZIC2 is predominantly expressed in the nuclei of lung cancer cells, with elevated levels in cancer tissues. RTN1 is mainly found in the membrane of lung cancer cells, but its expression is downregulated in these tissues. MMP7, a secreted protein, is present in the nucleus, cytoplasm, and extracellular matrix, with elevated expression in lung cancer tissues. KLRB1, a transmembrane protein, is downregulated in lung cancer tissues. CXCL13 is expressed in the cytoplasm and extracellular matrix, with upregulation in lung cancer tissues. The results showed that the protein expression of those 5 hub genes was largely consistent with their corresponding mRNA expression levels in both the training dataset and the TCGA dataset (Fig. 7A,B; Supplementary Fig. 2; Supplementary Table 2). Furthermore, the predictive efficacy of the five hub genes was assessed based on the IHC results, yielding an AUC value of 0.992 in the ROC curve analysis (Fig. 7C). These results confirm the reliability of the data mining outcomes and highlight their potential for LUSC diagnosis.
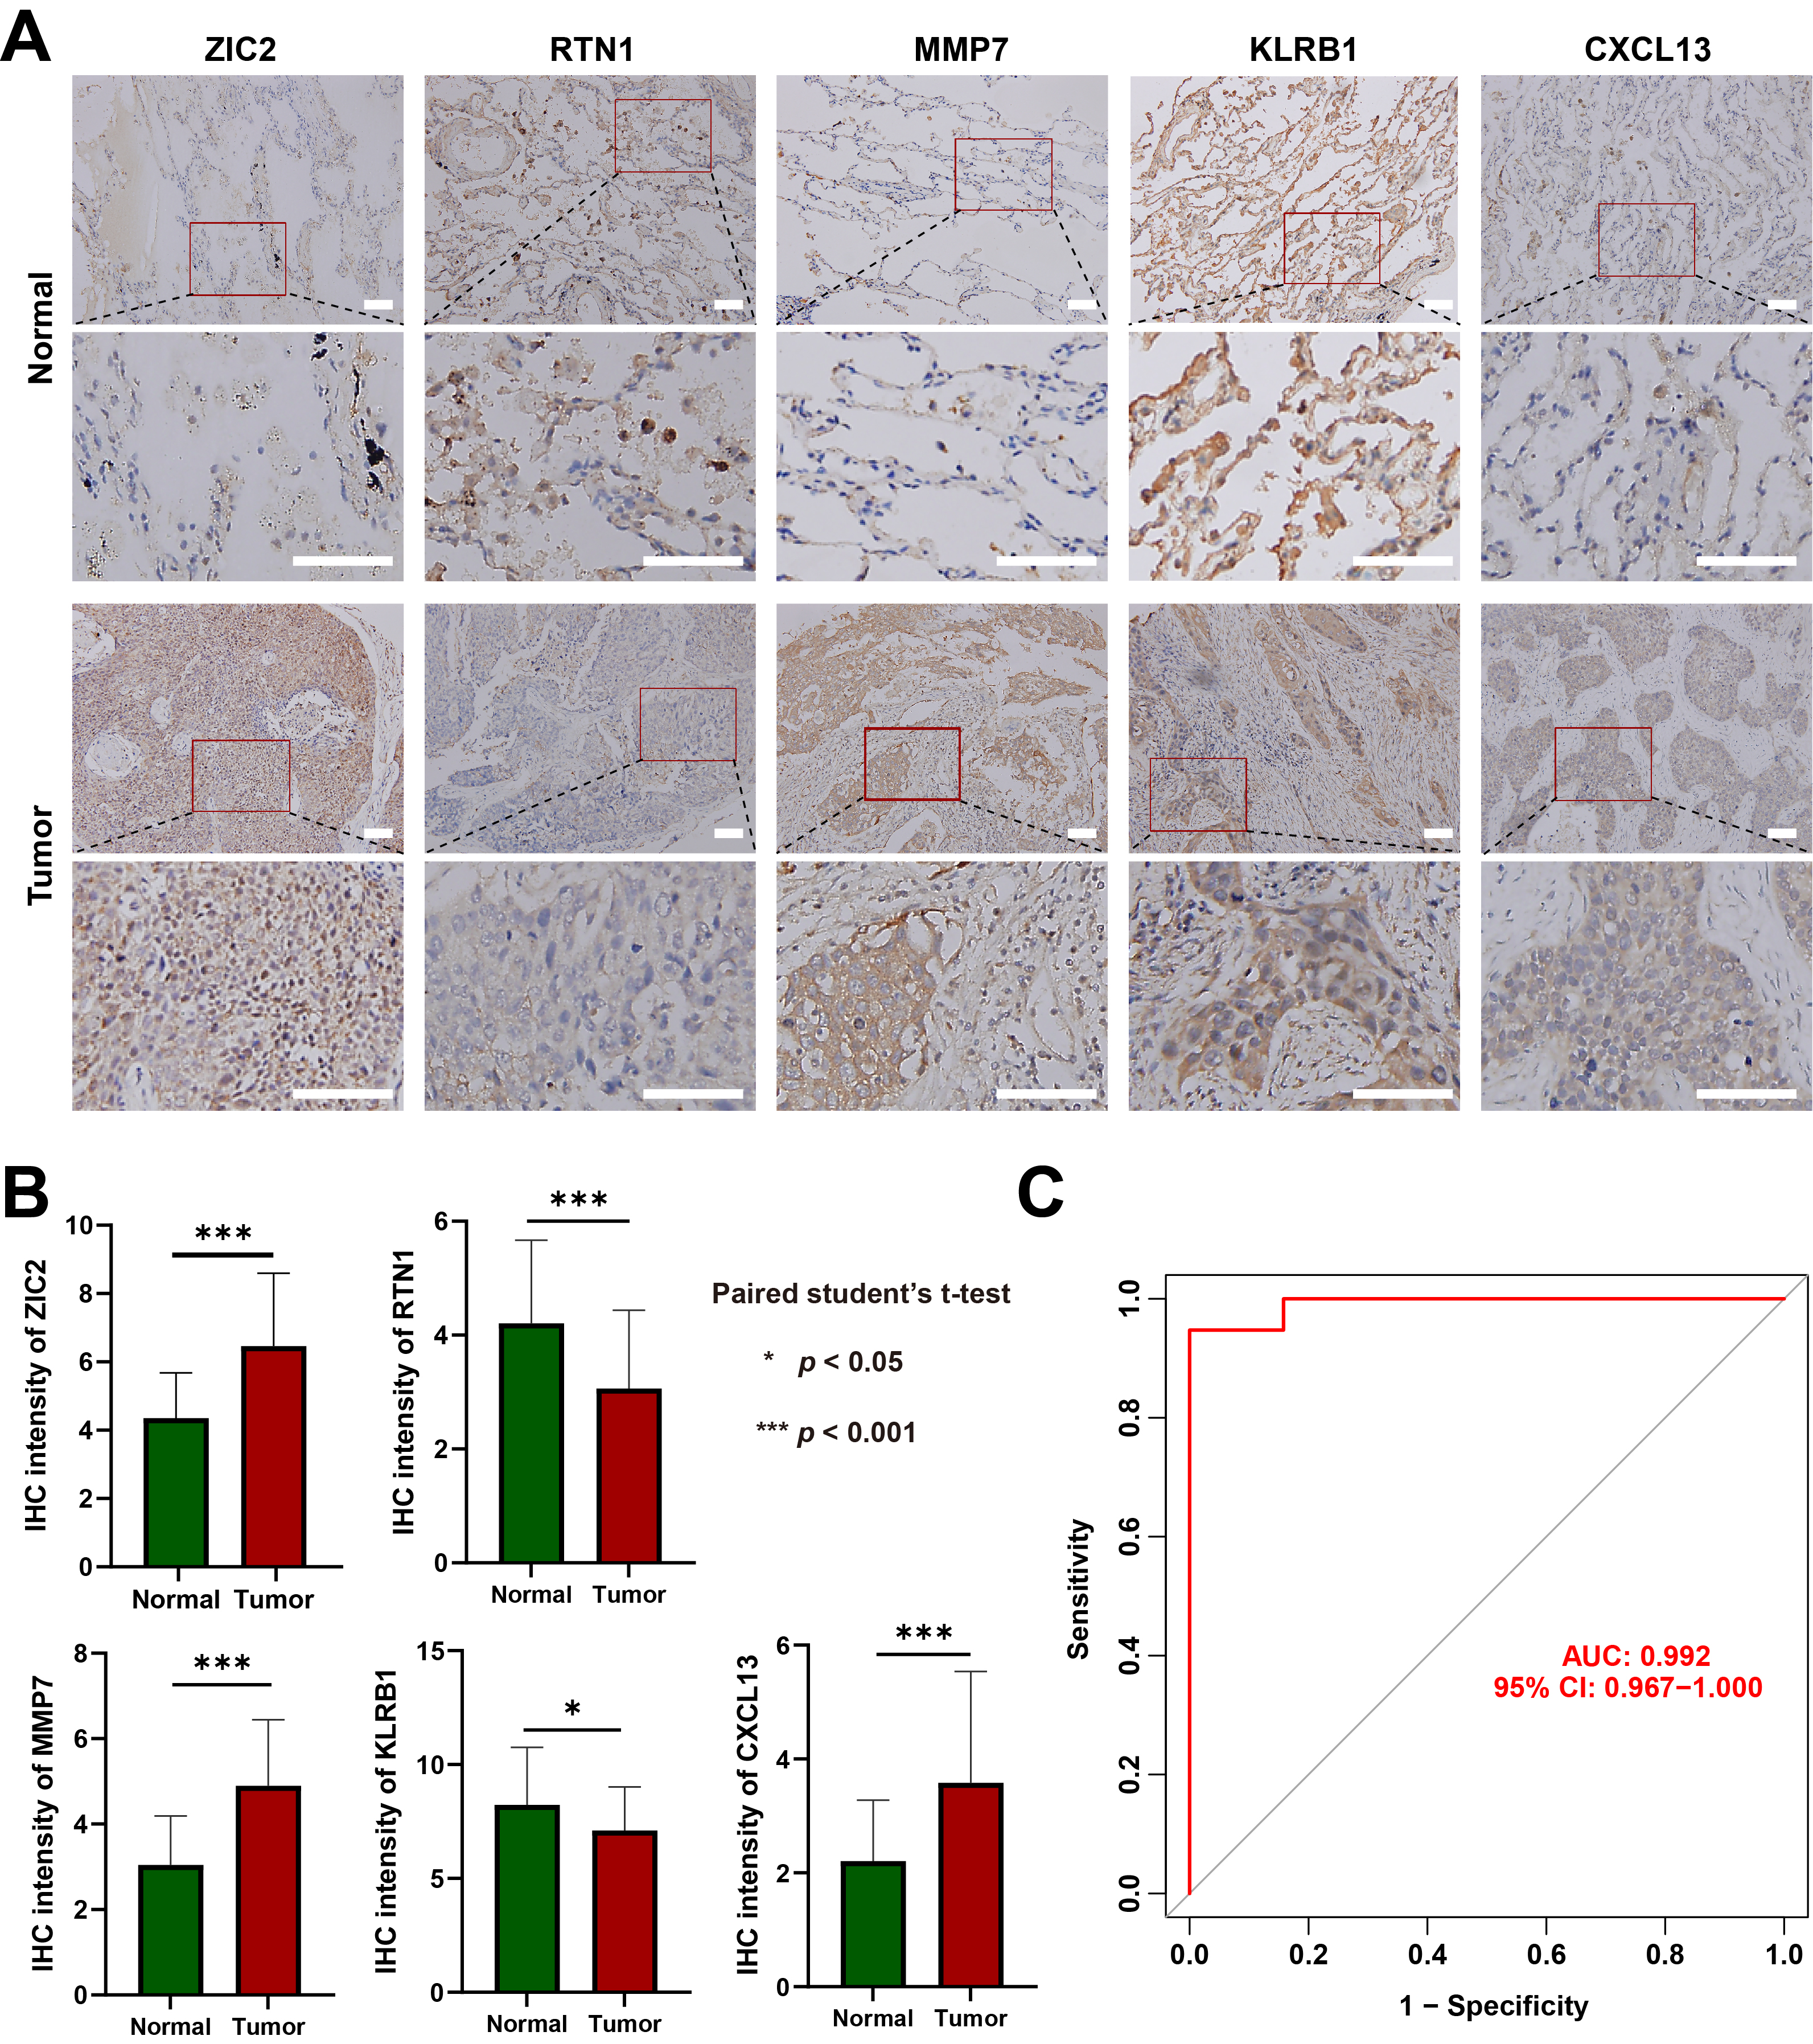 Fig. 7.
Immunohistochemistry validation of the predictive performance of
M1 macrophage-associated biomarkers. (A) Representative images of
immunohistochemical staining for Zinc finger protein ZIC 2 (ZIC2), Reticulon-1
(RTN1), Matrix metalloproteinase-7 (MMP7), Killer cell lectin-like receptor
subfamily B member 1 (KLRB1) and C-X-C motif chemokine 13 (CXCL13) in normal lung
tissues and LUSC tissues (scale bar,
50 µm). (B) Statistical analysis of immunohistochemistry results in normal
lung tissues and LUSC tissues. Data are mean
Macrophages are notably abundant in lung cancer tissues and play a pivotal role in determining disease progression and outcomes [25]. Traditionally, macrophages are categorized into two main types: classically activated (M1) and alternatively activated (M2) macrophages [26]. In LUSC, higher densities of M1-like macrophages and an increased M1/M2 ratio within tumor islets and stroma are strongly associated with improved patient survival [25]. Most patients with LUSC are diagnosed at advanced stages, leading to a low five-year survival rate [10, 27]. This study utilized seven GEO microarray datasets, which were divided into training and testing cohorts, to identify novel diagnostic signatures for LUSC, with the goal of enhancing diagnostic accuracy and improving survival rates. A total of 143 M1 macrophage-related DEGs were identified using the limma, CIBERSORT, and WGCNA algorithms. These genes were significantly involved in antigen processing and presentation, MHC protein complex assembly, leukocyte- or lymphocyte-mediated immunity, and regulation of immune response signaling pathways—key processes influencing LUSC progression [28, 29]. Through application of the optimal machine learning model, SVM, during both training and external validation, MMP7, RTN1, ZIC2, KLRB1, and CXCL13 were identified as novel five hub genes associated with LUSC-infiltrating M1 macrophages, playing critical roles in the pathogenesis of LUSC.
TICs are closely linked to hub genes involved in tumorigenesis [30, 31, 32, 33]. For instance, the expression of purinergic receptor P2RY13 was positively correlated with dendritic cell infiltration across various tumor types [31]. Zhang et al. [34] identified four key hub genes—LAPTM5, C1QC, CSF1R, and SLCO2B1—that promote the exhaustion of CD8+ T cells in LUSC tumor tissues. Additionally, COL1A1, COL4A1, COL12A1, and PDGFRB were found to be potential prognostic biomarkers associated with M2 macrophage infiltration in gastric cancer [30]. In contrast, CXCL6 and POSTN were overexpressed in M0 macrophage-enriched clusters and served as poor prognostic factors in hepatocellular carcinoma [35]. Based on immune cell infiltration analysis in the training datasets, a significant increase in tumor-infiltrating M1 macrophages was observed in LUSC tissues compared to control samples. Furthermore, MMP7, RTN1, ZIC2, KLRB1, and CXCL13 were found to be significantly correlated with M1 macrophage infiltration in LUSC.
Our study focused on the application of machine learning to further refine diagnostic strategies. Four machine learning models—SVM, GLM, RF, and XGB—were employed to identify the optimal model by comparing their predictive performances. The SVM model outperformed the others, achieving the highest AUC value of 0.995. The 5-gene SVM model consistently demonstrated high accuracy in predicting LUSC across three externally validated datasets. Because our model is built on a highly refined set of 143 genes, carefully selected for their strong association with both DEGs in LUSC and M1 macrophages. This approach effectively reduces noise and enhances biological relevance. Additionally, the SVM algorithm is particularly adept at finding optimal boundaries in high-dimensional data, which is suited for this work. As a result, the AUC value has reached 1.000 in each dataset. These findings suggest that the model offers a novel diagnostic approach for LUSC. To our knowledge, no predictive signature based on M1 macrophage-related DEGs has been previously reported. Joon et al. [36] identified 40 genes using an XGBoost model that exhibited better predictive performance for LUSC than SVM, RF, k-Nearest Neighbor (kNN), and Decision Tree (DT) models. Ye et al. [37] identified ten feature miRNAs using the SVM model that could distinguish LUSC tissues from adjacent tissues. Therefore, our 5-gene SVM model offers the advantage of achieving similar predictive accuracy with fewer genes, while also providing insights into the relationship between M1 macrophages and LUSC.
Additionally, a nomogram model was developed for diagnosing LUSC based on the
expression profiles of MMP7, RTN1, ZIC2,
KLRB1, and CXCL13, with further validation of its predictive
power and clinical utility. MMP7 exhibits anti-inflammatory effects [38] and is
upregulated in various tumors, including LUSC [39]. Takayuki Shiomi et
al. [40] have demonstrated CD151 may function as a possible docking molecule for
proMMP-7 activation in LUAD. Loss of MMP7 resulted in M1 macrophage polarization
within H. pylori-infected stomachs [41]. Reticulon 1 (RTN1), associated with the
endoplasmic reticulum, is a specific marker for neurological diseases and cancers
[42]. McGonigle et al. [43] demonstrated that RTN1 regulates macrophage
differentiation and migration. Alterations in RTN1 expression can further lead to
an increased proportion of immune effector cells, including CD4+ T cells and
CD8+ T cells, which are often associated with a favorable prognosis.
Importantly, RTN1 expression was significantly correlated with the
expression of multiple immune checkpoints, such as CD274 (PD-L1), CTLA4, HAVCR2,
LAG3, PDCD1 (PD-1), PDCD1LG2 (PD-L2), TIGIT, and SIGLEC15, suggesting a potential
immunomodulatory role that may involve macrophage-mediated regulation of the
tumor immune microenvironment [44]. Zinc finger protein of cerebellum 2 (ZIC2)
drives immunosuppressive M2 macrophage polarization in nasopharyngeal carcinoma
by activating JUNB transcription and stimulating M-CSF secretion [45]. It also
correlates with a suppressed tumor immune microenvironment, showing negative
associations with tumor-infiltrating lymphocytes and immune checkpoint expression
in breast cancer [46]. Furthermore, ZIC2 enhances cancer stem cell traits by
upregulating OCT4 expression in lung adenocarcinoma cells [47]. This study
provides the first evidence linking ZIC2 to LUSC. KLRB1 (CD161), a C-type
lectin-like receptor predominantly expressed on NK cells and CD8 T cells, has
been identified together with its ligand LLT1 (CLEC2D) as an emerging immune
checkpoint [48]. Studies indicate that high KLRB1 expression is
associated with increased infiltration of M1 macrophages and CD8 T cells in the
tumor microenvironment [49]. This effect is likely mediated indirectly through
the secretion of pro-inflammatory cytokines such as Interferon gamma
(IFN-
While our study used comprehensive bioinformatics analyses and machine learning models, there are limitations that must be acknowledged. First, although machine learning models and comprehensive bioinformatics analyses were used and validated in both training and external validation datasets, the external validation dataset has a relatively small sample size and lacks standardized clinical phenotype information. This limitation may affect the generalizability of the model, suggesting that more detailed clinical data are needed to fully confirm its predictive performance. Second, further experimental studies are required to explore the functional relationship between the 5 hub genes and M1 macrophages.
These five genes are expected to be included in routine pathological diagnosis and liquid biopsy, such as detecting the expression levels of these genes in circulating immune cells or exosomes from blood samples for non-invasive early detection for LUSC. However, it still faces challenges such as technical standardization, clinical validation, and improvement of sensitivity. The prognostic and diagnostic value of these five genes must be validated in large-scale, multi-center clinical trials to ensure their applicability across diverse patient populations. With the development of big data, artificial intelligence and multi-omics technologies, it is expected that these barriers will be overcome in the future to achieve early diagnosis and precise treatment of LUSC.
This study identified 143 M1 macrophage-related DEGs. Among the machine learning models evaluated, the SVM model based on five genes was selected as the optimal approach after comparison with four other models. The genes MMP7, RTN1, ZIC2, KLRB1, and CXCL13 exhibited high predictive accuracy for LUSC, potentially improving diagnostic precision and informing more effective treatment strategies for the disease.
Publicly available datasets were analyzed in this study. These data can be found here: https://www.ncbi.nlm.nih.gov/geo/. The datasets used and analyzed during the current study are available from the corresponding author on reasonable request.
HTD, ZLW and QZZ collected, analyzed and generated data. HTD, ZLW and QZZ wrote the manuscript. QZZ and ZLW initiated the idea and supplied resources. All authors contributed to editorial changes in the manuscript. All authors read and approved the final manuscript. All authors have participated sufficiently in the work and agreed to be accountable for all aspects of the work.
The clinical experiments were approved by the Tianjin Medical University Cancer Institute and Hospital Medical Research Ethics (No. bc2023152). All participators signed the written informed consent. The study was carried out in accordance with the guidelines of the Declaration of Helsinki.
We thank Wei Su (Tianjin Medical University Cancer Institute and Hospital) for providing clinical experiments for our study.
This work was supported by the National Natural Science Foundation of China [grant numbers 82373028 and 82400730], and the Natural Science Foundation of Tianjin [grant numbers 21JCQNJC00130].
The authors declare no conflict of interest.
Supplementary material associated with this article can be found, in the online version, at https://doi.org/10.31083/FBL44661.
Publisher’s Note: IMR Press stays neutral with regard to jurisdictional claims in published maps and institutional affiliations.