
- Academic Editor
†These authors contributed equally.
The goal of this study was to investigate the effects of dexamethasone on human lens epithelial cells (HLECs) and the potential mechanisms.
HLECs (HLE-B3) were cultured in vitro to assess the effects of dexamethasone on cell size at different concentrations. Immunofluorescence staining was used to detect specific protein expression in HLE-B3 cells. The cell size was observed using phase-contrast microscopy, and the length and area were quantitatively measured with ImageJ software for statistical analysis. Flow cytometry was used to verify these outcomes. The means of three groups were statistically analyzed using one-way analysis of variance, whereas the means of two groups were statistically analyzed with the parametric Student’s t-test. Additionally, high-throughput transcriptome sequencing was performed to compare messenger RNA (mRNA) expression levels between different concentrations of dexamethasone treatment groups and the control group, to identify potential signaling pathways. Subsequently, we performed quantitative Polymerase Chain Reaction (qPCR), immunofluorescence staining, and molecular docking experiments on the key differentially expressed genes.
Dexamethasone affected the size of HLE-B3 cells. Both 0.25 and 0.5 μmol/L dexamethasone increased cell length and area, exhibiting no significant difference between the two treatment groups. Flow cytometry showed that dexamethasone increased cell size and granularity, with 0.25 μmol/L dexamethasone leading to larger cell areas and higher intracellular granularity. High-throughput transcriptome sequencing revealed significant upregulation of lysophosphatidic acid receptor 1 (LPAR1) and the pathways related to the glucocorticoid (GC) receptor.
Certain concentrations of dexamethasone impact the morphology and biological functions of HLECs. As a subtype of G protein-coupled receptors, LPAR1 on the cell membrane may interact with dexamethasone, affecting cell size and inhibiting autophagy via the phosphoinositide 3-kinase (PI3K)/protein kinase B (AKT)/mammalian target of rapamycin (mTOR) pathway. These discoveries offer crucial biological insights into how dexamethasone influences the morphology and function of HLECs and the pathogenesis of GC-induced cataracts, offering potential molecular targets for future therapeutic strategies.
Cataracts are the primary cause of blindness globally, affecting 17.2% of people worldwide [1, 2]. Glucocorticoids (GCs) are a kind of drugs widely used to treat inflammation, autoimmune diseases, and certain cancers. However, long-term or high-dose GC therapy is associated with a variety of adverse effects, and posterior subcapsular opacities of the lens is one of its common side effects in ophthalmology, known as induced GC-induced cataracts (GIC). Its prevalence is about 14% to 16% of all cataracts [3]. Black et al. [4] first suggested in 1960 that GC is closely related to cataracts development. Since then, a large amount of epidemiological and clinical data has confirmed that long-term large amounts of oral, inhalation, and ocular surface drops of GCs and intraocular injection of GC extended-release agents can cause cataracts [5, 6, 7, 8]. Surgery can improve vision in patients with cataracts, but carries financial costs [9] and some postoperative complications such as dry eye or macular cystoid edema, and increases the risk of posterior capsular opacification and endophthalmitis [10, 11]. Unlike diabetes mellitus and age-related cataract (ARC), GIC severely restrict the fine vision requirements of young and middle-aged patients, and even post-cataract surgery, the visual quality may not be comparable to that of normal eyes [12]. Consequently, research into the precise molecular pathways underlying GIC is imperative.
Lens epithelial cells (LECs) play a significant role in regulating the transparency of lens, and abnormalities in the morphology and function of these cells can lead to cataracts. Dexamethasone, a classic GC used clinically, can cause morphological changes in LECs including cellular disorganization and vacuolization of intercellular junctions by decreasing waveform protein expression [13]; cellular edema by inhibiting the Na+/K+-ATPase enzyme [14]; and cellular loss of polarity, reduction of adhesion function, hyperproliferation, and migration by lack of calcineurin [15]. These effects, in turn, cause functional abnormalities in LECs; however, the precise cellular and molecular mechanisms in humans are not fully understood. Therefore, to determine the effects of dexamethasone on human lens epithelial cells (HLECs) and the underlying mechanism, we employed high-throughput transcriptome sequencing to search for the potential molecular pathways.
In the messenger RNA (mRNA) expression profiles from transcriptome sequencing, we found that
lysophosphatidic acid receptor 1 (LPAR1), as a hub gene in the transcriptomic
changes following dexamethasone treatment, was significantly upregulated along
with phosphoinositide 3-kinase/protein kinase B (AKT) pathway expression, which is one of the
pathways through which dexamethasone affects the function of LECs [16]. LPAR1, a
subtype of G protein-coupled receptors (GPCRs), is involved in cellular survival,
proliferation, adhesion, migration, and cytoskeletal alterations. As part of the
GPCR superfamily, LPAR1 triggers the activation of the phosphoinositide 3-kinase
(PI3K)/AKT signaling pathway by interacting with G
Our study investigated the mechanisms and potential signaling pathways that influence the morphology and function of HLECs upon the potential connection of dexamethasone with LPAR1.
The experimental workflow for this study is illustrated in Fig. 1.
 Fig. 1.
Study workflow. This diagram outlines the entire process from cell culture to data analysis. Initially, human lens epithelial cells (HLE-B3) were cultured and treated with different concentrations of dexamethasone (0, 0.25, and 0.5 µM) for 60 days. Subsequent steps included cell size measurement using phase-contrast microscopy, flow cytometry analysis, and high-throughput transcriptome sequencing. By Figdraw (https://www.figdraw.com/#/).
The HLE-B3 cell line was purchased from American Type Culture Collection (ATCC; Manassas, VA, USA), an internationally recognized institution that provides ethically reviewed cell lines. The ATCC ensures that all cell lines, including the HLE-B3, are obtained and distributed in compliance with ethical standards. An analysis certificate verifying their provenance and quality is in the Supplementary Materials. The HLE-B3 cell line is an immortalized HLEC line frequently used to study the biological properties of HLECs and their responses under various conditions. HLE-B3 cells exhibit stable proliferation and a prolonged lifespan, making them widely used in ophthalmic research, particularly in studies related to lens-associated diseases such as cataracts [19]. HLE-B3 cells were cultured in a nutrient-rich Dulbecco’s Modified Eagle Medium (Gibco, Waltham, MA, USA) supplemented with 10% fetal bovine serum (FBS; Gibco) and the antibiotics penicillin (100 U/mL) and streptomycin (100 µg/mL). These cells were cultured at 37 °C with 5% CO2. Regular mycoplasma screening was carried out using the MycoAlert Detection Kit (Lonza, Walkersville, MD, USA) to verify the absence of mycoplasma contamination and the test result is negative. Furthermore, the authenticity of the cell line was confirmed through rigorous short tandem repeat (STR) profiling. Authentication and STR profiling were conducted using the Cell Line Authentication Service by ATCC, in accordance with the guidelines of the International Cell Line Authentication Committee (ICLAC) and the ExPASy Cellosaurus database to avoid cross-contamination or misidentification. HLE-B3 cells were divided into three groups: control group with no dexamethasone treatment, 0.25 µmol/L dexamethasone, and 0.5 µmol/L dexamethasone groups. We used HLE-B3 cells treated with 0 µM dexamethasone as the baseline comparison, referred to as the control group, where the cells were treated with the same volume of water used to dissolve the dexamethasone. Each group consist of three samples. All groups were cultured for 60 days, with medium changes and passaging performed weekly.
After 15 min fixation in 4% paraformaldehyde (Sigma-Aldrich, St. Louis, MO, USA) at room temperature, HLE-B3 cells
were permeabilized with 0.1% Triton X-100 (Sigma-Aldrich, St. Louis, MO, USA) for 10 min. Then the cells were
blocked in 1% bovine serum albumin (Sigma-Aldrich, St. Louis, MO, USA) for 1 h. Next,
HLE-B3 cells were incubated overnight at 4 °C with
primary antibodies against
HLE-B3 cells, either untreated or co-cultured with 0.25 µM dexamethasone for 60 days, were fixed for 15 minutes in 4% paraformaldehyde at room temperature. After fixation, cells were permeabilized using 0.1% Triton X-100 for 10 minutes and then blocked with 1% bovine serum albumin (BSA) for 1 hour at room temperature. Cells were incubated overnight at 4 °C with primary antibodies against LPAR1 and phosphorylated S6K1 (p-S6K1). Following three washes with PBS, cells were incubated with appropriate fluorophore-conjugated secondary antibodies for 1 hour in the dark at ambient temperature. Nuclei were stained with DAPI for 5 minutes, and coverslips were mounted on slides using anti-fade mounting medium. Fluorescence images were acquired using a fluorescence microscope, and ImageJ software 1.54f (National Institutes of Health, Bethesda, MD, USA) was employed to quantify the fluorescence intensity of LPAR1 and p-S6K1. Three independent repeat experiments were conducted.
Cell size was measured under a phase-contrast microscope (DMI3000B inverted
phase contrast microscope; Leica, Wetzlar, Germany) at 2000
Harvested cells were rinsed with PBS, and then resuspended in a modified PBS solution supplemented with 2% FBS. For detailed analysis of cellular dimensions and granularity, we employed the advanced FACSCalibur flow cytometer (BD Biosciences, Franklin Lakes, NJ, USA). FlowJo™ v.10.10 (Tree Star, Ashland, OR, USA) was used for data processing. Three independent repeat experiments were conducted. Flow cytometry analysis focused on assessing changes in cell size and granularity between the control group and the 0.25 µM dexamethasone-treated group, utilizing forward scatter (FSC) and side scatter (SSC) respectively. FSC measurements provide insight into the relative cell size, as FSC correlates with the cell volume or diameter. SSC, on the other hand, measures the granularity or internal complexity of cells, reflecting aspects such as the presence of internal structures like granules. Given the nature of our investigation into the basic cellular responses to dexamethasone, specific markers were not employed in the flow cytometry analysis. The gating strategy and analysis process, detailed in Supplementary Fig. 1, was based on guidelines from the FlowJo official gating tutorial. We excluded debris and dead cells by setting appropriate thresholds on FSC and SSC parameters, selecting a population that predominantly represents live HLE-B3.
HLE-B3 cells were cultured in vitro and incubated with 0, 0.25, and 0.5
µmol/L dexamethasone for 60 days. Total RNA was extracted from cells with
TRIzol® reagent. The integrity and quality of the extracted RNA
were assessed utilizing the Agilent 5300 Bioanalyzer (Agilent Technologies,
Wilmington, DE, USA). For quantitative analysis, the NanoDrop 2000
spectrophotometer (NanoDrop Technologies Inc., Wilmington, DE, USA) was employed.
Only high-quality RNA samples (optical density [OD] 260/280 = 1.8–2.2, OD
260/230
RNA purification, coupled with reverse transcription, library assembly, and ultimately sequencing, were conducted in accordance with the instructions of the manufacturer (Illumina, San Diego, CA, USA). The Illumina Stranded mRNA Prep Ligation Kit was used to construct the RNA sequencing (RNA-seq) transcriptome library, which was accomplished with precise input of 1 µg total RNA, ensuring the highest degree of precision and conformity with academic rigor. Using oligo (dT) beads and polyA selection, mRNA was separated and fragmented using designated buffers. Double-stranded cDNA synthesis was achieved using the SuperScript III First-Strand Synthesis System (Invitrogen, Carlsbad, CA, USA) and random hexamer primers (Illumina). The cDNA was subjected to phosphorylation, ‘A’ tailing, and end repair in accordance with Illumina’s methodology, enhancing its suitability for library construction. The cDNA (300 bp) was separated on a 2% ultra-agarose gel (Thermo Fisher Scientific, Waltham, MA, USA), followed by PCR amplification utilizing phusion DNA polymerase (New England Biolabs, Ipwich, MA, USA) for 15 cycles. Subsequently, the paired-end RNA-seq library was quantified with Qubit 4.0 (Thermo Fisher Scientific, Waltham, MA, USA) and sequenced on the advanced NovaSeq X Plus platform (Illumina). The initial paired-end sequencing data were trimmed and Fastp was adopted for quality control [20], utilizing its standard parameter settings. Next, using HISAT2 v2.2.1 (Daehwan Kim Lab, Johns Hopkins University, Baltimore, MD, USA), clean reads were separately aligned to the reference genome in orientation mode [21]. The StringTie reference-based transcriptome assembler was used to assemble each sample’s mapped readings [22].
To detect differentially expressed genes (DEGs) between different samples,
transcripts per million methodology was used to assess transcript abundance.
RNA-Seq by Expectation-Maximization was employed for quantitative gene expression
profiling [23]. DESeq2 or DEGseq was used for differential expression analysis
[24, 25]. DEGs were considered significantly differentially expressed if they had
To investigate the co-expression network in our cohort, we conducted intricate analysis leveraging the weighted gene co-expression network analysis (WGCNA) framework. Utilizing comprehensive transcriptomic profiles derived from HLECs, we conducted methodical identification of the optimal soft-thresholding parameter, harnessing the pickSoftThreshold functionality within the WGCNA package 1.71. This step ensures adherence to the stringent scale-free topology principle, which is fundamental for constructing robust networks. Subsequently, we computed the adjacency matrix and converted it into the topological overlap matrix (TOM). Employing this refined TOM, we quantified dissimilarity metrics pivotal for hierarchical clustering. To identify distinct, biologically meaningful gene modules exhibiting coordinated expression patterns, we applied the dynamic tree cutting algorithm, implementing a threshold of a minimum module size of 30. To establish the relevance of these gene modules to our study, we assessed the gene significance values and module membership values. This approach enabled us to pinpoint key modules associated with our experimental variables, thereby shedding light on the intricate molecular machinery underlying the phenotypic alterations observed in LECs.
We performed protein–protein interaction (PPI) analyses of DEGs focusing on the
phosphoinositide 3-kinase/AKT pathway using the Search Tool for the Retrieval of
Interacting Genes/Proteins (STRING) database (https://string-db.org/) with a
confidence score threshold of
cDNA synthesis employed the PrimeScript RT Reagent Kit sourced from Takara, Japan. qPCR analysis was conducted on the ABI 7500 Real-Time PCR System (Applied Biosystems, Waltham, MA, USA), utilizing SYBR Premix Ex Taq (Takara, Japan). The levels of expression for LPAR1 and mammalian target of rapamycin (mTOR) were quantified using the 2-ΔΔCt method, normalizing to GAPDH as a reference point internally. The primers specific to these genes were procured from Sangon Biotech, Shanghai, China. Three independent repeat experiments were conducted.
The crystal structure of the LPAR1 protein (PDB ID: 7YU4) was obtained from the RCSB PDB database (https://www.rcsb.org/). PyMOL software (version 2.x, Schrödinger, LLC, New York, NY, USA) was used for initial processing, where solvent molecules and small ligands were removed. The protein structure was further processed using ADFRsuite-1.0 (Scripps Research, La Jolla, CA, USA), retaining its native charges, and was converted into the pdbqt format for docking. For the ligand, the small molecule structure of dexamethasone was downloaded from the PubChem database. Similar preprocessing steps were performed using ADFRsuite-1.0 to retain charges and convert it into pdbqt format.
The docking process was carried out using AutoDock Vina 1.2.5 (The Scripps Research Institute, La Jolla, CA, USA). The docking grid for LPAR1 was centered at the coordinates (center_x = 165.337, center_y = 151.376, center_z = 152.603), with a box size of (size_x = 64.36 Å, size_y = 44.56 Å, size_z = 50.91 Å). A grid spacing of 0.375 Å and an exhaustiveness parameter of 32 were used. The prepared pdbqt files of LPAR1 and dexamethasone were input into AutoDock Vina, and docking was executed with these parameters. The resulting docking conformations were ranked by binding energy, and the best-scoring pose was selected for analysis.
This sample size was determined based on our preliminary experimental data and
sample size calculation, aiming to achieve a statistical power of 0.8 at a 0.05
significance level. We used SPSS 29.0.2 (IBM Corporation, Armonk, New York, NJ,
USA) to conduct statistical analysis and created the statistical graphs by using
GraphPad Prism software, version 10.2.2. Depending on the dexamethasone
concentration, cells were categorized into 0 µM, 0.25
µM, and 0.5 µM groups. Variables in each group followed
a normal distribution, tested by Shapiro-Wilk. For comparison of variables among
the three groups, one-way ANOVA was used and test for homogeneity of variance
were first performed. The nuclear area of HLE-B3 cells satisfied variance
alignment among the groups and further post hoc comparisons were made using
Tukey’s test. The groups of HLE-B3 cell length, cell area, cytoplasmic area, and
nuclear-cytoplasmic ratio did not satisfy variance alignment, and then corrected
for this using Welch’s test with a Tamhane T2 test for post hoc comparison. For
direct comparisons between pairs, the student’s t-test was adopted.
The comparison of FSC and SSC between the control group and
the 0.25 µM dexamethasone group was performed using a t-test, as the
data followed a normal distribution and had equal variances. For the PCR
experiment, the mRNA expression levels between the control group and the 0.25
µM dexamethasone group were also analyzed using a t-test, with the
data meeting the assumptions of normal distribution and equal variances. The
average fluorescence intensity of LPAR1 in immunofluorescence staining between
the control group and the 0.25 µM dexamethasone group was calculated
using a t-test, with the data normally distributed and variances equal. However,
for the average fluorescence intensity of S6K1 in immunofluorescence staining
between the control group and the 0.25 µM dexamethasone group, where
the variances were unequal, Welch’s correction was applied. p
The concentration of dexamethasone in the blood that leads to GC-induced cataracts is 0.15 µmol/L, with this level of exposure typically occurring over a period of 2 years [27, 28]. A previous study has shown that low-dose dexamethasone (0.1 µM) leads to increased proliferation of HLECs, while exposure to dexamethasone concentrations above 1 µM results in the apoptosis of HLECs [29]. Therefore, we chose 0.25 µM and 0.5 µM concentrations based on their relevance to physiological conditions and clinical scenarios.
We cultured HLE-B3 cells in vitro and treated them with different
concentrations of dexamethasone (0, 0.25, and 0.5 µM). To analyze
the expression of specific proteins and intermediate filament proteins in HLE-B3
cells, we performed immunofluorescence staining for
 Fig. 2.
Morphologic effects of different concentrations of dexamethasone
on HLE-B3 cells and immunofluorescence staining of HLE-B3 cells. (A) The
morphology of HLE-B3 cells is shown for the 0, 0.25, and 0.5 µM
groups. The white circles represent the cell contours, whereas the yellow circles
represent the cell nuclei. Scale bars represent 100 µm for the first column, 50 µm for the second
column, and 20 µm for the third column, respectively. (B) Immunofluorescence staining of
HLE-B3 cells for
The cell length, cell area, nuclear area, cytoplasmic area,
and nuclear-cytoplasmic ratio after 60 days of cell culture are expressed as the
mean
We further analyzed the cell size and intracellular granularity of the control
group and 0.25 µM dexamethasone group using flow cytometry. We used
the parametric Student’s t-test to compare the cell
size and intracellular granularity between the control group and 0.25
µM dexamethasone group. Flow cytometry results indicated that the
average cell size was greater in the 0.25 µM group than in the
control group (t = 3.528, p = 0.0243; Fig. 3A,B), and there was an
increase in cell granularity (t = 24.41, p
 Fig. 3.
Dexamethasone increases HLE-B3 cell size and
granularity. (A) The relative sizes of HLE-B3 cells were
compared by measuring forward scatter (FSC) values through fluorescence-activated
cell sorting analysis. (B) The mean sizes of HLE-B3 cells were obtained and are
shown in a graph (n = 3). (C) The relative cell granularity of HLE-B3 cells was
compared using side scatter (SSC) analysis. (D) The mean granularity of the
HLE-B3 cells was obtained and are shown in a graph (n = 3). The data are shown as
the mean
To investigate the specific mechanisms by which dexamethasone affects the morphology and function of HLECs, we performed high-throughput transcriptome sequencing on the control, 0.25, and 0.5 µM groups. Analysis of DEGs suggested that there was only one DEG between the 0.25 and 0.5 µM dexamethasone groups (Fig. 4A,B). Therefore, we subsequently chose to compare the control group and 0.25 µM dexamethasone group for further analyses.
 Fig. 4.
Differential gene
expression analysis in HLE-B3 cells treated with
dexamethasone. (A) Statistical chart of
DEGs between groups. (B) Venn diagram of DEGs between groups. (C) Volcano plot
showing the changes in HLE-B3 genes in the 0.25 µmol/L dexamethasone
group (fold change
Using a corrected p
 Fig. 5.
GO and KEGG enrichment analyses. (A) Bubble plot illustrating the GO enrichment analysis between the control group and 0.25 µmol/L dexamethasone group. The x-axis represents the rich factor, whereas the y-axis lists the GO terms. The bubble size indicates the number of genes, and the bubble color corresponds to the adjusted p-value (padjust). (B) Bubble plot illustrating KEGG pathway enrichment analysis between the control group and the 0.25 mmol/L dexamethasone group. The x-axis represents the rich factor, whereas the y-axis lists the KEGG pathways. The bubble size indicates the number of genes, and the bubble color corresponds to the padjust. (C) Enriched chordal diagram showing the relationships between the DEGs and enriched GO terms. The different colors represent various GO terms. (D) Enriched chordal diagram showing the relationships between DEGs and enriched KEGG terms. Different colors represent various KEGG terms. DEGs, Differentially expressed genes; GO, Gene Ontology; KEGG, Kyoto Encyclopedia of Genes and Genomes.
We identified the top 20 pathways related to the morphological and biological effects of dexamethasone on HLECs using KEGG and GO analyses. Genes within these pathways were compiled into a gene set (Supplementary Table 3). WGCNA analysis was conducted to identify gene modules and central genes within the group. We established a scale-free co-expression network with a soft threshold of 9 and a scale-free index of –0.095, demonstrating good mean connectivity (Fig. 6A,B). The clustering dendrogram is depicted in Fig. 6C, and the genes were ultimately clustered into two modules (Fig. 6D).
 Fig. 6.
WGCNA analysis and discovery of potential hub genes. (A) Soft threshold power of WGCNA. (B) Mean connectivity of WGCNA. (C) WGCNA cluster dendrogram. (D) WGCNA clustered modules. (E) Analysis of module significance. WGCNA, Weighted gene co-expression network analysis.
We calculated the correlation between the two modules and the effects of dexamethasone on the size of HLECs. The module significance analysis indicated that the MEblue module was the most significant (Fig. 6E). The MEblue module included 56 genes and was considered important in the effects of dexamethasone on cell size. A network visualization of genes within the MEblue module showed key gene interactions (Fig. 7A). Hub genes identified in this module included atypical chemokine receptor 1, secreted frizzled related protein 1, collagen type IV alpha 4 chain, LPAR1, and growth arrest specific 1, which may play crucial roles in the effects of dexamethasone on cell size. Among these, LPAR1, a subtype of GPCRs, has not been previously reported to interact with dexamethasone and affect cell morphology and function. LPAR1 activates the PI3K/AKT pathway, one of the top 20 KEGG enriched pathways, and is associated with the “response to organophosphorus” term in the top 20 GO enriched pathways. To understand the interactions between LPAR1 and other proteins in the PI3K/AKT pathway, we screened the top 20 KEGG enriched pathways of DEGs, focusing on genes in the PI3K/AKT pathway, and constructed a PPI network diagram using the STRING database (Fig. 7B).
 Fig. 7.
Recognition of hub genes and the protein–protein interaction network. (A) Network display of key genes. (B) Each node represents a protein, and the lines represent an association between proteins. COL4A6, Collagen Type IV Alpha 6 Chain; COL6A6, Collagen Type VI Alpha 6 Chain; COL4A4, Collagen Type IV Alpha 4 Chain; COL4A3, Collagen Type IV Alpha 3 Chain; COL6A3, Collagen Type VI Alpha 3 Chain; LAMC2, Laminin Subunit Gamma 2; LAMA4, Laminin Subunit Alpha 4; ITGB4, Integrin Beta 4; ITGA10, Integrin Alpha 10; ITGA2, Integrin Alpha 2; TNC, Tenascin C; COMP, Cartilage Oligomeric Matrix Protein; LPAR1, Lysophosphatidic Acid Receptor 1; THBS2, Thrombospondin 2; PDGA, Platelet-Derived Growth Factor Alpha; PDGFD, Platelet-Derived Growth Factor D; ERBB4, Erb-B2 Receptor Tyrosine Kinase 4; ANGPT1, Angiopoietin 1; AREG, Amphiregulin; FLT1, Fms Related Tyrosine Kinase 1; IL6, Interleukin 6; EFNA1, Ephrin A1; TGFA, Transforming Growth Factor Alpha; IGF2, Insulin-Like Growth Factor 2; IRS1, Insulin Receptor Substrate 1; IL7, Interleukin 7; TILR2, T cell immunoreceptor with Ig and ITIM domains 2.
Moreover, high-throughput transcriptome sequencing revealed differentially expressed autophagy-related genes, such as DDIT4, RPS6KA2, and IRS1 (Supplementary Table 4). KEGG enrichment analysis of these DEGs also indicated the involvement of key autophagy-related pathways, including mTOR, PI3K/AKT, and AMPK signaling.
Based on the changes in the PI3K/AKT signaling pathway indicated by KEGG and GO analyses, we speculate that dexamethasone interacts with LPAR1, triggering a series of signaling responses that affect the PI3K/AKT/mTOR pathway. These effects, in turn, lead to increased LEC length, enhanced crystallin protein synthesis, and autophagy inhibition.
We have conducted PCR validation, which
showed significantly increased expression of LPAR1 and mTOR in the 0.25
µM dexamethasone group (t =
9.158, p
 Fig. 8.
Quantitative polymerase chain reaction (qPCR) and immunofluorescent staining of HLE-B3 cells with (0),
0.25 µM dexamethasone treatment. (A) qPCR analysis of the mRNA
expression levels of LPAR1 and mTOR. qPCR analysis is presented relative to the
GAPDH expression data (n = 3). (B,C) Immunofluorescent staining of LPAR1 (green)
merged with DAPI (blue) and relative fluorescence intensity of LPAR1 was
quantified (n = 5). (D,E) Immunofluorescent staining of p-S6K1 (green) merged
with DAPI (blue) and relative fluorescence intensity of p-S6K1 was quantified (n
= 3). Data are shown as mean
In addition, we have performed molecular docking between LPAR1 and dexamethasone shown in Fig. 9, and the results suggest that the binding between the LPAR1 protein and dexamethasone molecule is spontaneous, with a relatively high affinity (binding energy of –8.16 kcal/mol). Interaction analysis revealed multiple types of interactions, including one salt bridge, one electrostatic interaction, four hydrogen bonds, one halogen bond, and six hydrophobic interactions. Key residues involved in these interactions were LYS294 (salt bridge), LYS39 (electrostatic interaction), GLU293, LYS39, and GLN125 (hydrogen bonds), and several leucine residues contributing to hydrophobic interactions. These interactions significantly stabilize the binding of dexamethasone to LPAR1.
 Fig. 9.
Molecular docking results of LPAR1 protein with dexamethasone. (A) Surface representation of LPAR1 protein (blue) bound to dexamethasone (sticks in the binding pocket) illustrating the spatial fit and overall surface interactions. (B) 2D interaction diagram highlighting the key residues involved in the interaction between LPAR1 and dexamethasone. The diagram shows hydrogen bonds (green lines), attractive charge interactions (red lines), and salt bridges (orange lines). Involved residues include LYS39, LYS294, GLU293, GLN125, and several hydrophobic interactions (LEU105, LEU297, LEU278, and LEU277). (C) 3D cartoon representation of LPAR1 with a close-up of the binding pocket. The detailed view shows hydrogen bonding and electrostatic interactions between LPAR1 residues (blue sticks) and dexamethasone (beige sticks), with LYS39, GLU293, and LYS294 playing key roles.
These results further provide molecular-level evidence to back the mechanistic claim that LPAR1 interacts with glucocorticoids, impacting the PI3K-AKT-mTOR pathway (Fig. 10), which in turn affects the morphology, area, and autophagic functions of LECs.
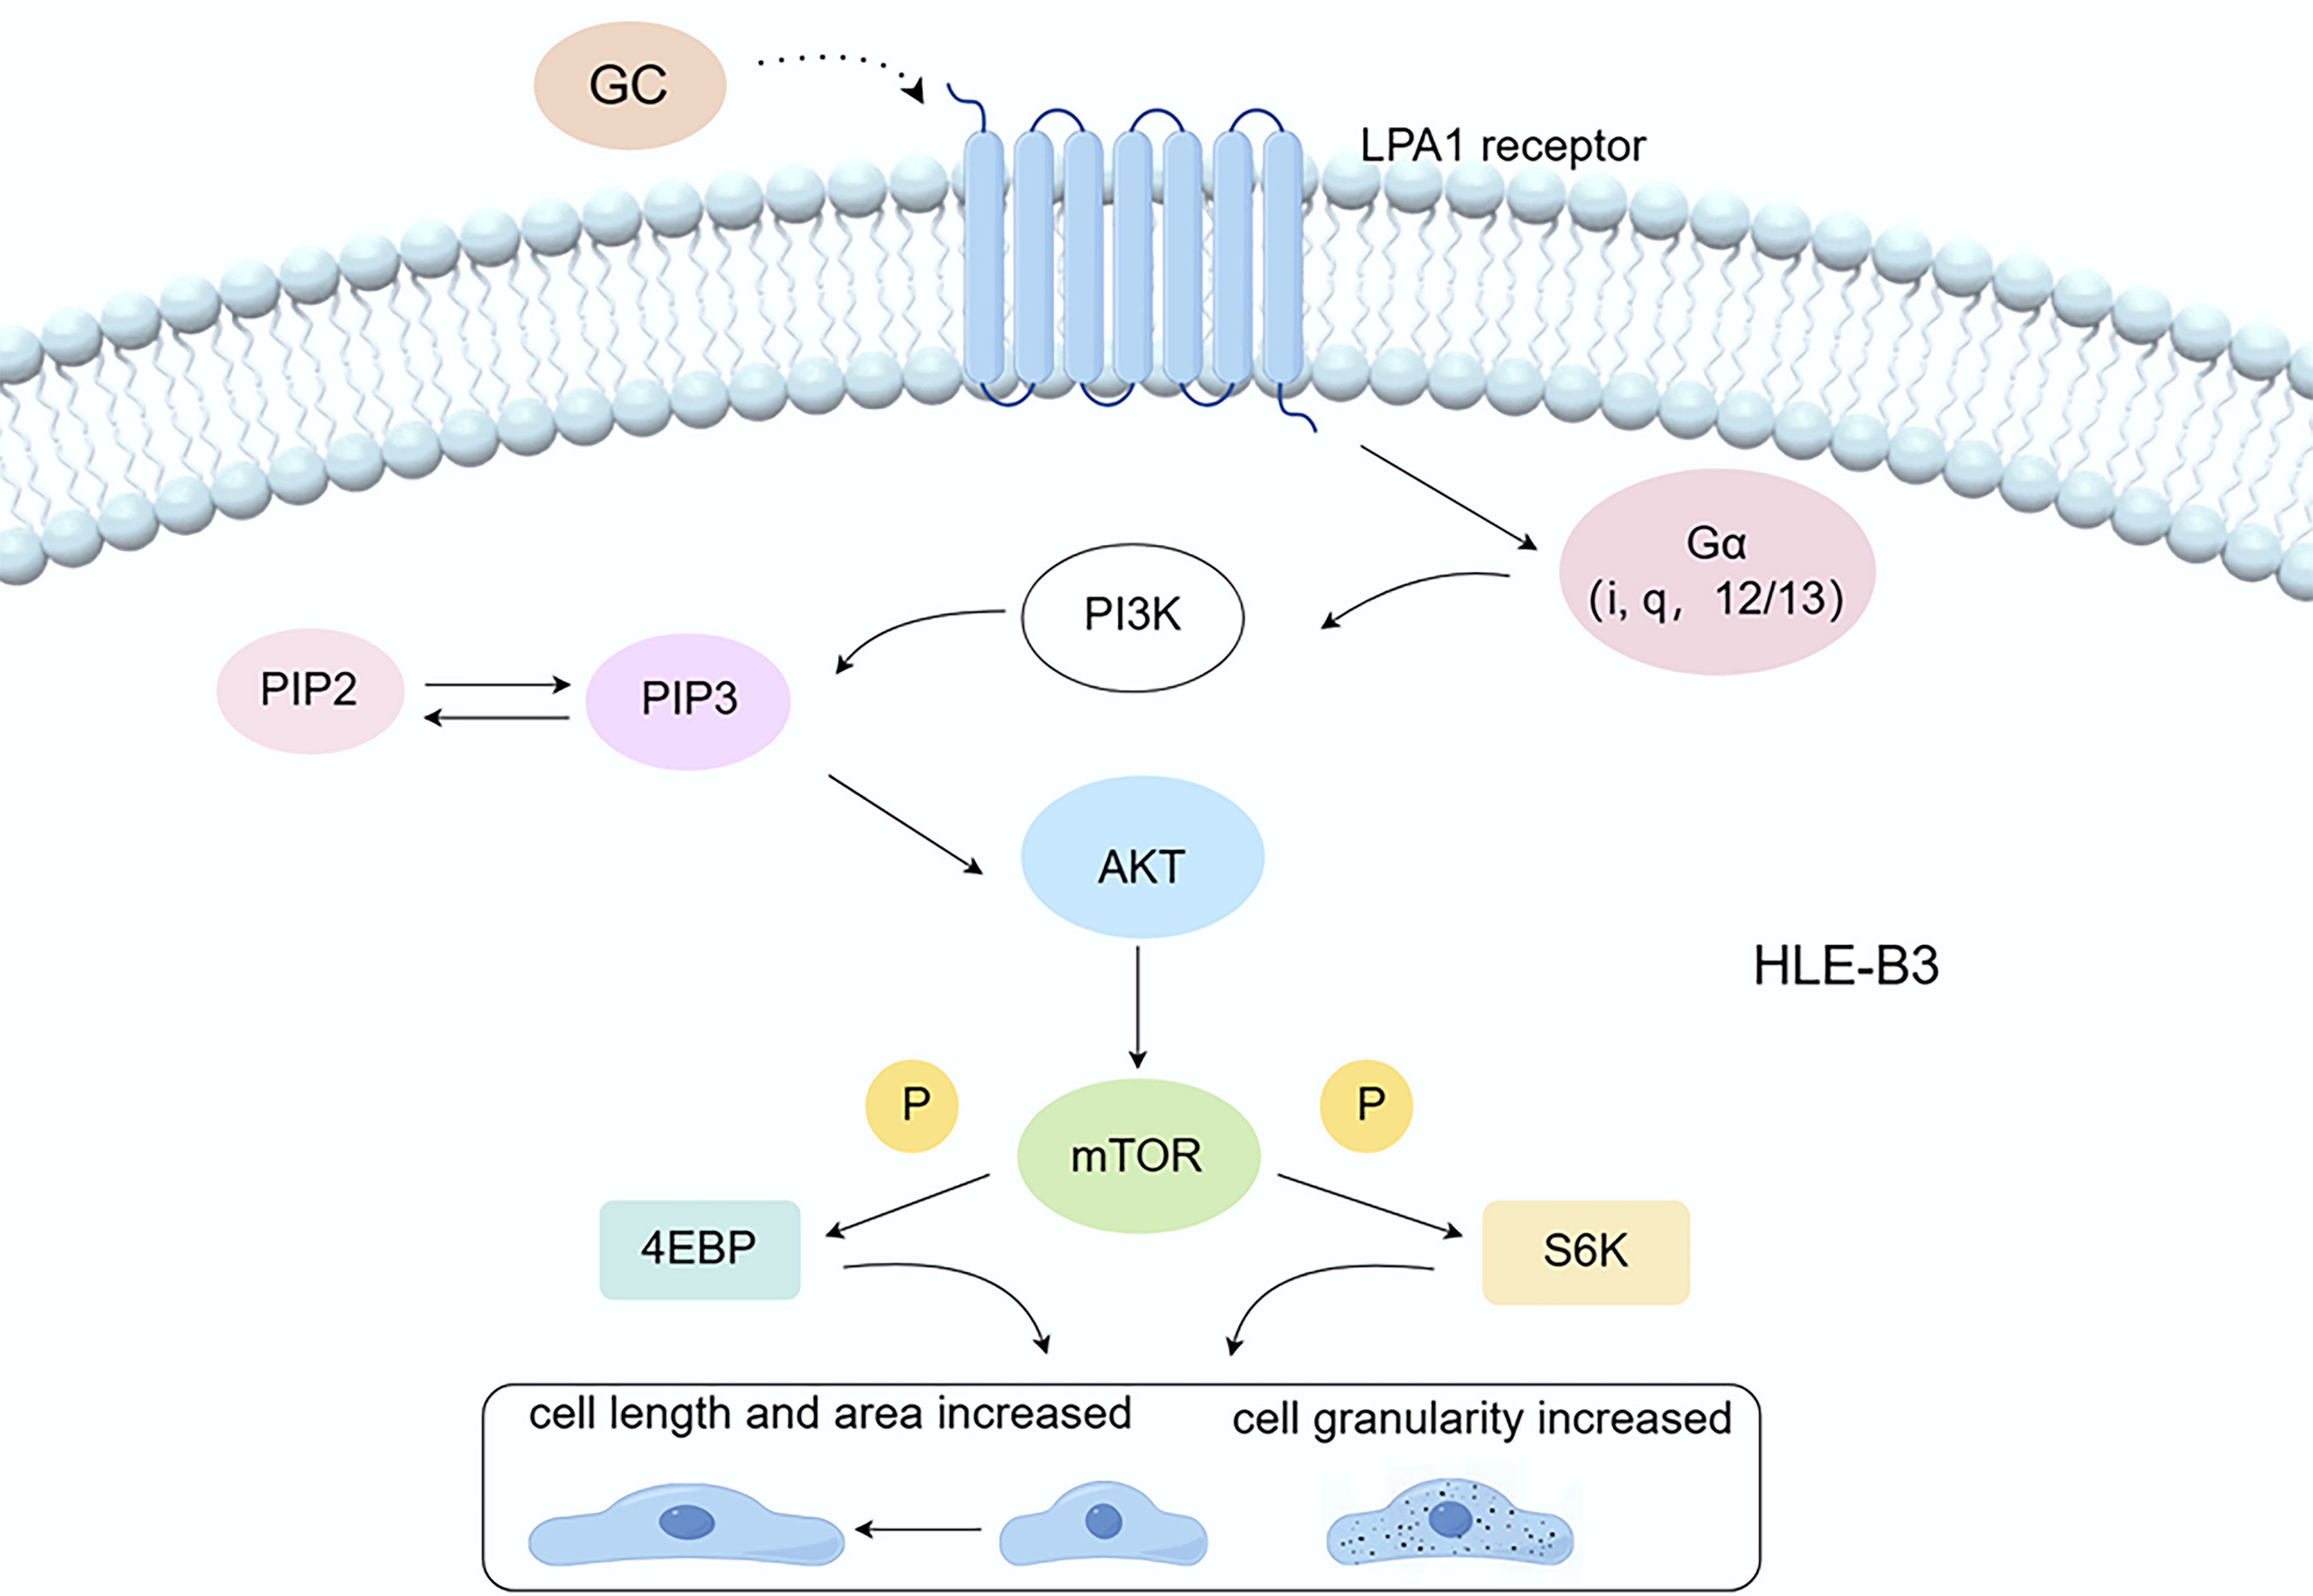 Fig. 10.
The LPAR1/PI3K/AKT/mTOR pathway. Dexamethasone interacts with LPAR1, activating the PI3K/AKT/mTOR signaling pathway, which subsequently stimulates cell growth, increases cell size, and potentially enhances cell granularity relative to the group not treated with dexamethasone by inhibiting autophagy. GC, glucocorticoid; LPAR1, Lysophosphatidic acid receptor 1; PI3K, Phosphoinositide 3-kinase; PIP2, phosphatidylinositol-4,5-bisphosphate; PIP3, phosphatidylinositol-3 ,4,5-trisphosphate; AKT, protein kinase B; mTOR, Mammalian target of rapamycin; P, Phosphorylation; 4EBP, 4E-binding protein; S6K, p70 Ribosomal Protein S6 Kinase. By Figdraw (https://www.figdraw.com/#/).
LECs play an important role in maintaining the transparency of lens. It has been demonstrated that dexamethasone can affect the morphology and function of LECs, which in turn leads to the development of GIC [36, 37]. However, the specific molecular mechanism remains unclear. In the current study, we demonstrated in vitro that dexamethasone increases the length, area, and granularity of HLECs and inhibits autophagy, thereby affecting their biological functions.
Flow cytometry (FCM) is a sophisticated method that utilizes light scattering and fluorescence emission principles as cells tagged with fluorescent probes move through a laser beam. When a laser beam is directed at a cell, the excitation light is scattered in both the forward and lateral directions. FSC reflects cell size, SSC reflects intracellular granularity. It enables fast, relatively quantitative multi-parameter analysis of cell populations at the single-cell level. Cell size, the integrity of the membrane, and the relative quantity of biomolecules are among the properties of cells that are frequently examined. Using this technique, up to 70,000 cells can be detected per second [38]. Phase contrast microscopy is not as efficient and does not allow for observation of granularity, so we use flow cytometry as a complement to quantitative analysis of cell morphology. The results showed that dexamethasone resulted in increased cell size and increased granularity in HLECs. Our research indicates that a certain concentration of dexamethasone leads to an increase in the size of LECs, resulting in a decrease in cell density. This reduction in the number of cells functioning as Na+/K+-ATPase and Ca2+-ATPase may impair the overall ion-pumping capacity of the lens epithelium, thereby affecting ion metabolism within the lens and leading to cataract [39, 40]. Additionally, LECs synthesize cholesterol, an essential component of the cell membrane that helps maintain low oxygen pressure, which is crucial for preserving lens transparency [41]. A decrease in the density of LECs may reduce cholesterol synthesis, potentially contributing to cataract [42].
A large number of previous studies have been done on lens epithelial cells using different methods with the aim of identifying potential pathways that affect their normal morphology and function. A study performed proteomic analysis of HLEC line (SRA01/04) after ultraviolet B irradiation to investigate the relationship between lens ubiquitination and the development of age-related cataracts (ARC) [43]. Gong et al. [44] used lipidomics to study metabolic differences in LECs in patients with ARC of varying severity, and pathway analysis showed that glycerophospholipid metabolism was significantly affected. Additionally, other studies have used microarray analysis to identify genes and transcription factors related to the effects of GCs on HLECs. These studies showed that GCs can regulate the PI3K/AKT signaling pathway, downregulate the expression of C-C motif chemokine ligand 2, and upregulate the expression of dual specificity phosphatase 1 and FAS cell surface death receptor [45, 46, 47]. However, the number of detected genes by these methods are limited, and no studies have reported a role for LPAR1 and its mediated signaling pathways in GIC.
In the present study, we used high-throughput transcriptome sequencing to identify potential signaling pathways. High-throughput transcriptome sequencing, a second-generation sequencing technology, is based on the Illumina platform and sequences all mRNAs transcribed in a particular eukaryotic tissue or cell at a certain period of time [48]. Transcriptome sequencing directly analyses mRNA molecules, providing direct information about gene expression, whereas proteomics requires translation and modification before proteins can be detected, which can be affected by the state of the tissue and environment. Compared with the microarray approach, high-throughput transcriptome sequencing features high resolution to background interference and high sensitivity to low-expression genes, and is able to detect not only differential genes but also the expression abundance of related genes [49]. This study is the first to use a high-throughput sequencing approach to gain insights into the transcriptome changes in dexamethasone-treated HLECs [50].
G protein-coupled receptors (GPCRs) are the largest family of cell surface receptors in the human genome, with seven transmembrane helices of transmembrane protein receptors. Several studies have demonstrated the involvement of GPCRs in the pathogenesis of cataract. Frizzled protein (FZD), an F-like GPCR, mediates the planar cell polarity pathway, which regulates directional cell migration and cellular polarization, such as lens epithelial differentiation and the highly ordered arrangement of fibroblasts, resulting in a variety of disorders, such as cataracts [51]. UV irradiation significantly increased the expression of let-7b in LECs, which promotes apoptosis through direct action on its target gene, G protein-coupled receptor 4 (Lgr4) [52]. What’s more, Lgr4 deficiency impaired the resistance of rats’ LECs to oxidative stress and accelerated the progression of age-related cataract [53]. Previously, researchers discovered a high-affinity membrane receptor for GCs, GPR97, and analyzed the structure of the complex between GPR97 and Go proteins under the activation of GCs by single-particle cryo-electron microscopy, which elucidated the structural basis for the binding and activation of the membrane receptor, GPR97, by GCs [16].
In the present study, our experimental results showed that the combination of
dexamethasone and LPAR1 activates the downstream PI3K/AKT
signaling pathway. LPAR1 is a GPCRs isoforms that are mediated by the second
messenger pathway after coupling with G proteins Gi/0, G
As part of the GPCR superfamily, LPAR1 triggers the activation of the PI3K/AKT
signaling pathway by interacting with G
The pathophysiologic mechanisms and potential therapeutic targets of GIC need to be explored in more depth. Currently, a few drugs targeting LPAR1 have been researched and developed and have shown promising clinical significance. BMS-986278 is an LPAR1 inhibitor for the treatment of pulmonary fibrosis and idiopathic pulmonary fibrosis. It has shown positive results in Phase 2 clinical trials, slowing the decline in lung function in patients with progressive pulmonary fibrosis [71]. In Addition, Ki-16425, an inhibitor of LPAR1, has been demonstrated to inhibit the proliferation of hepatocellular carcinoma (HCC) cells in a preclinical study [72]. By LPAR1 inhibition, HCC cells can be induced to enter an oncogene-induced senescence state, thereby suppressing tumor growth [72]. We hypothesize that an LPAR1 inhibitor could be developed in the future, perhaps in the form of an eye drop, to block the action of glucocorticoids on the HLECs and thus prevent GIC. Given the widespread use of glucocorticoids in the treatment of ocular inflammation and the study showing that ophthalmic preparations combining glucocorticoids with anti-infective drugs are effective in short-term therapy [73], treatment with dexamethasone in combination with an LPAR1 inhibitor may reduce the risk of cataracts.
Future research could further explore the application of exosomes, nanomedicine, and RNA technologies in targeting LPAR1 for the treatment of GIC. Nanomedicine, including nano micelles, nanoparticles, nanosuspensions, nano emulsions, microemulsions, nanofibers, dendrimers, liposomes, vesicles, nano wafers, contact lenses, hydrogels, microneedles, and other technologies, can serve as methods for ocular drug delivery [74]. Compared to traditional drug delivery methods, nanocarriers can overcome ocular barriers, enhance corneal permeability, prolong drug retention time, reduce drug degradation, lower dosing frequency, improve patient compliance, and achieve sustained/controlled release, drug targeting, and gene delivery [75]. Nanomaterial-mediated gene silencing is also a novel and promising approach for treating eye diseases [76]. Exosomes have been reported to treat ocular diseases with higher efficacy and fewer immune reactions [77], and targeting LPAR1 through exosome delivery may enhance therapeutic outcomes. Moreover, therapeutic small interfering RNA (siRNA) can be loaded into exosomes via membrane fusion-mediated methods to exert therapeutic effects [78]. RNA technology could also be used to target the LPAR1 gene for treatment. Intravitreal injection of lipid nanoparticles loaded with the circular RNA derived from the nerve growth factor gene has been shown to protect retinal ganglion cells and axons from degeneration caused by injury [79]. Additionally, a study has combined modified mRNA technology with adipose-derived mesenchymal stem cell therapy, where IGF-1 modRNA (modIGF1)-engineered ADSCs (ADSC modIGF1) were applied to corneal alkali burns in mice, promoting corneal repair [80]. Additionally, we plan to conduct preliminary preclinical studies in large animal models, such as canines, non-human primates, and swine, to validate the potential of LPAR1 inhibitors. Following these studies, we will proceed with human clinical trials, particularly focusing on cataract patients who have long-term exposure to glucocorticoids. Further research are also needed to determine whether the effects of dexamethasone on HLECs involve other signaling pathways, such as those that inhibit autophagy [81] or organelle degradation [82], which may contribute to cataracts.
One limitation of our study is that while we have verified the involvement of the PI3K/AKT/mTOR pathway through PCR, immunofluorescence staining and molecular docking, we have not yet conducted knockdown experiments, such as LPAR1 silencing, to fully confirm its role. To further address the functional validation of this interaction, we are planning to perform knockdown and inhibition of LPAR1 in our future work. Future studies should include these functional assays to further clarify the effects of dexamethasone on HLECs and the specific pathways involved in GIC.
Certain concentrations of dexamethasone cause HLECs to elongate, increase in area, and change from a round to a spindle shape. Notably, the interaction between dexamethasone and LPAR1, a subtype of GPCRs, may modulate cell size and inhibit autophagy via the LPAR1/PI3K/AKT/mTOR pathway. These findings clarify the molecular mechanisms by which dexamethasone regulates lens function and contributes to GIC, thereby providing new molecular targets for the prevention and treatment of GIC.
ARC, Age-related cataract; DEGs, Differentially expressed transcripts; FSC, Forward scatter; GCs, Glucocorticoids; GIC, Glucocorticoid-induced cataracts; GPCR, G protein-coupled receptor; GO, Gene Ontology; KEGG, Kyoto Encyclopedia of Genes and Genomes; LECs, Lens epithelial cells; LPAR1, Lysophosphatidic acid receptor 1; mTOR, mammalian target of rapamycin; PI3K, phosphoinositide 3-kinase; PPI, Protein–protein interaction; S6K1, Ribosomal protein S6 kinase beta-1; SSC, Side scatter; WGCNA, Weighted gene co-expression network analysis.
All data from this study are available on reasonable request from the first author or the corresponding author.
XS, YG, and JL designed the research study. XS and QL performed the research. XS, JG, and HX analyzed the data. XS, JG, and HX wrote the manuscript. JL and YG provided experimental funding and advice on the entire research process. All authors participated in the editorial revision of the manuscript. The final manuscript was read and approved by all authors. All authors have participated sufficiently in the work to take public responsibility for appropriate portions of the content and agreed to be accountable for all aspects of the work in ensuring that questions related to its accuracy or integrity.
This study was approved by the Ethics Committee of Chongqing Medical University Affiliated University Town Hospital, with the approval number LL-202364. All research procedures adhered to relevant laws and regulations.
We thank Figdraw (https://www.figdraw.com/#/) for helping with the design of Figs. 1,10. We also express our gratitude to Associate Professor Hao Wang for his guidance in the writing of this article.
This research was funded by the Natural Science Foundation Project of Chongqing, Chongqing Science and Technology Commission (Grant No. CSTB2022NSCQ-MSX0065 and CSTB2023NSCQ-MSX0194); CQMU Program for Youth Innovation in Future Medicine (Grant No. W0158); and the Research Start-up Fund of “High-level Talent Introduction Program” of University-Town Hospital of Chongqing Medical University.
The authors declare no conflict of interest.
Supplementary material associated with this article can be found, in the online version, at https://doi.org/10.31083/j.fbl2911391.
Publisher’s Note: IMR Press stays neutral with regard to jurisdictional claims in published maps and institutional affiliations.