


1 Guangzhou Key Laboratory of Forensic Multi-Omics for Precision Identification, School of Forensic Medicine, Southern Medical University, 510515 Guangzhou, Guangdong, China
2 School of Forensic Medicine, Kunming Medical University, 650500 Kunming, Yunnan, China
3 Clinical Research Center of Shaanxi Province for Dental and Maxillofacial Diseases, College of Stomatology, Xi’an Jiaotong University, 710004 Xi’an, Shaanxi, China
Academic Editors: Said El Shamieh and Alika K. Maunakea
Abstract
Background: Chinese Yunnan Hani group is an East Asian ethnic group mainly distributed in China, Thailand, Laos, Vietnam, and Burma. The genetic makeup of Chinese Yunnan Hani ethnic group remains to be further investigated. The insertion/deletion (InDel) polymorphism genetic markers are highlighted by their merits such as shorter amplified fragments, lower mutation rates, and are considered effective tools for population genetic investigations. Methods: The 221 individuals of Chinese Yunnan Hani group were enrolled to obtain the genetic data and polymorphic profiles of 57 autosomal InDels through multiplex amplification and genotyping. Population genetic analyses were performed between Chinese Yunnan Hani group and 30 global reference populations. Results: The forensic parameters, especially cumulative power of discrimination and combined probability of exclusion values, which were 0.9999999999999999999999968 and 0.999958, separately, illustrated that this novel InDel multiplex amplification system could be utilized as a powerful tool for personal identification and paternity testing in Chinese Yunnan Hani group. The results of population genetic analyses indicated that Chinese Yunnan Hani group showed relatively smaller genetic distances and similar genetic structures with the reference East Asian populations. Conclusions: The genetic polymorphisms and results of intercontinental population architecture differentiation analyses demonstrated the high efficiency of this novel InDel multiplex amplification system. The genomic data and findings of this research will contribute to the ongoing genetic exploration of Chinese Yunnan Hani group and increase our insights into the genetic architecture of worldwide populations.
Keywords
- insertion/deletion polymorphism
- forensic parameter
- population structure
- Chinese Yunnan Hani group
Insertion/deletion (InDel) polymorphism genetic markers refer to the DNA length polymorphisms formed by the insertion or deletion of DNA fragments, which are mainly manifested as biallelic polymorphisms [1]. InDels possess the advantages of both single nucleotide polymorphisms (SNPs) and short tandem repeats (STRs), such as lower mutation rates; and shorter amplified fragments, which are profitable for the DNA typing of degraded samples. The ability to use capillary electrophoresis platform for detection and genotyping has facilitated promotion at the grassroots level, making InDels ideal genetic markers for forensic applications [2]. Over the last few years, InDels have been increasingly utilized in the detection of forensic degraded sample [3], inference of biogeographic ancestry [4, 5], and the identification of unbalanced mixed stain [6, 7]. Researchers have now turned their attentions to developing a series of novel InDel multiplex amplification systems for different forensic detection purposes [8, 9, 10].
Previously, a novel PCR-capillary electrophoresis (CE)-based six-dye direct and multiplex genotyping system was developed for forensic application purpose in East Asia populations, particularly for Chinese various populations. The new multiplex amplification system consisted of 57 autosomal InDels, 2 Y-chromosomal InDels, and an Amelogenin gene locus [11]. Personal identification and paternity testing are two major tasks in forensic practice, and the successful genotyping detection for degraded sample remains an existing challenge. However, commonly used STR genotyping technique may not yield a complete genotype profile for highly degraded sample due to the large size loss of amplicons (typically between 200 and 450 bp) [12, 13]. Of note, all the amplicons of this novel InDel multiplex amplification system are less than 230 bp, making it suitable for acquiring complete DNA genotyping of degraded sample [11]. The previous validation results of this new amplification system indicated that this system was accurate, specific, reproducible, robust, and the contained autosomal 57 InDels exhibited high polymorphisms in Chinese several populations [11, 14, 15, 16, 17]. Based on the Scientific Working Group on DNA Analysis Methods (SWGDAM), one of the approaches to assess the availability of these loci for forensic DNA analysis is population genetic survey.
The Hani group is a traditional ethnic minority mainly distributed in China, Thailand, Laos, Vietnam, and Burma. Chinese Hani group is one of the formally recognized fifty-six ethnic groups. The result of the seventh national census in 2020 demonstrated that the Chinese Hani group had a population of 1.73 million (http://www.stats.gov.cn/tjsj/ndsj/2021/indexch.htm). Over 90% of Chinese Hani people live on the high plateau of the Yunnan province in Southern China. The language spoken by most of the Hani people is a member of the Yi language of the Tibeto-Burman branch and the Sino-Tibetan language family. Prior to 1949, the Hani people kept records by notch-carving sticks since they lacked their own script. Based on the Latin alphabet, the central government assisted them to develop the script in 1957 (http://www.yunnanadventure.com/minorities/Hani-Ethnic-Minority_11.html). In-depth systemic investigations of the genetic background and architecture of Chinese Yunnan Hani group were very important forensic significance. However, the genetic makeup of modern Yunnan Hani ethnic group still needs to be further explored, and few studies based on InDel polymorphic markers have been conducted in Chinese Yunnan Hani group [18]. In the current study, we utilized the novel 57 autosomal InDels to further validate the forensic property of this novel amplification system and explore the genetic polymorphisms of the 57 autosomal InDels in Chinese Yunnan Hani group. In addition, a variety of statistical analyses of the 57 autosomal InDels were used to probe the genetic differentiations and relationships between Chinese Yunnan Hani group and 30 worldwide reference populations.
After obtaining written informed consents, blood samples of 221 unrelated healthy individuals were gathered from the Hani group residing in the Yunnan province of China. According to self-reported statements, all the participants included in present study had no common ancestors within three generations, and no migration events occurred in their family history. The sample collections strictly observed the principles of human and ethical research and were approved by the ethics committee of Xi’an Jiaotong University Health Science Center (Approval No. 2019-1039). In the 4008 individuals from 30 reference populations, 26 worldwide populations were from the 1000 Genomes Project Phase 3 database, and the remaining four populations were from previously published studies [14, 15, 16, 17, 19]. The detailed information and corresponding abbreviations for 31 populations are listed in Supplementary Table 1.
The Chelex-100 method was used to extract genomic DNA. The multiplex PCR amplification of the novel panel was conducted on the GeneAmp PCR system 9700 Thermal Cycler (Thermo Fisher Scientific, Foster City, CA, USA) with the corresponding reaction system and amplification condition as previously reported [15]. Subsequent PCR amplification products were separated and detected using the ABI 3500xL Genetic Analyzer (Thermo Fisher Scientific, Foster City, CA, USA). GeneMapper ID-X software v1.5 (Thermo Fisher Scientific, Foster City, CA, USA) was used to implement the InDel genotyping. The positive and negative controls during the experimental procedures were DNA 9947A as well as 9948, and deionized water, respectively.
The
allele frequencies and forensic parameter values of autosomal
57 InDels containing the polymorphism information content (PIC), match
probability (MP), power of discrimination (PD), probability of exclusion (PE),
observed heterozygosity (Hobs), and expected heterozygosity (Hexp) in Chinese
Yunnan Hani group and reference East Asian populations
were measured by the STRAF online program
(version v1.0.5, Gouy & Zieger, Bern, Switzerland) and visualized by raincloud plots
by R software (version 4.1.2, R Foundation for Statistical Computing,
Vienna, Austria) [20]. The values of cumulative power of
discrimination (CPD) and probability of exclusion (CPE) of the 57 autosomal
InDels in Chinese Yunnan Hani group were performed by the corresponding formula.
The Hardy-Weinberg equilibrium (HWE) tests for the 57 autosomal InDels and
linkage disequilibrium (LD) analyses for pairwise InDels in Chinese Yunnan Hani
group were also conducted by the STRAF online program (version v1.0.5, Gouy &
Zieger, Switzerland) [20]. The pairwise relationship tests
involving full siblings and half siblings were simulated by Familias software
(version 3, Kling & Tillmar & Egeland, Norwegian, Sweden) based on the allele
frequencies of 57 autosomal InDels in Chinese Yunnan Hani group, and the results
of likelihood ratio (LR) distributions were plotted with the density plot
function via R software [21]. Locus by locus analysis
of molecular variance (AMOVA) between Chinese Yunnan Hani group
and 30 reference global populations together with pairwise fixation index
(F
The results of HWE tests and LD analyses of the 57 autosomal InDels in Chinese Yunnan Hani group are presented in Supplementary Tables 2,3, separately. Following the use of the Bonferroni correction, no significant deviation from HWE (p = 0.05/57 = 0.0008771) was observed, and all pairwise InDel loci were in linkage equilibrium status (p = 0.05/1596 = 0.00003133).
The allele frequencies and corresponding forensic parameters of the 57 autosomal InDels in Chinese Yunnan Hani group were recorded in Supplementary Table 2 and depicted by the raincloud chart in Fig. 1A, respectively. Results showed that the minimum insertion allele frequency was observed at the rs72085595 locus (0.2227), while the maximum insertion allele frequency was observed at the rs66595817 locus (0.7820). The values of PIC, MP, PD, PE, Hobs, Hexp in Chinese Yunnan Hani group ranged from 0.2828 (rs66595817) to 0.3750 (rs145191158 and rs145941537), 0.3510 (rs34421865) to 0.4926 (rs66595817), 0.5074 (rs66595817) to 0.6490 (rs34421865), 0.0689 (rs72085595) to 0.2448 (rs67487831), 0.3128 (rs72085595) to 0.5592 (rs67487831), and 0.3418 (rs66595817) to 0.5012 (rs145191158 and rs145941537), respectively. The values of CPD and CPE in Chinese Yunnan Hani group were 0.9999999999999999999999968 and 0.999958, respectively.
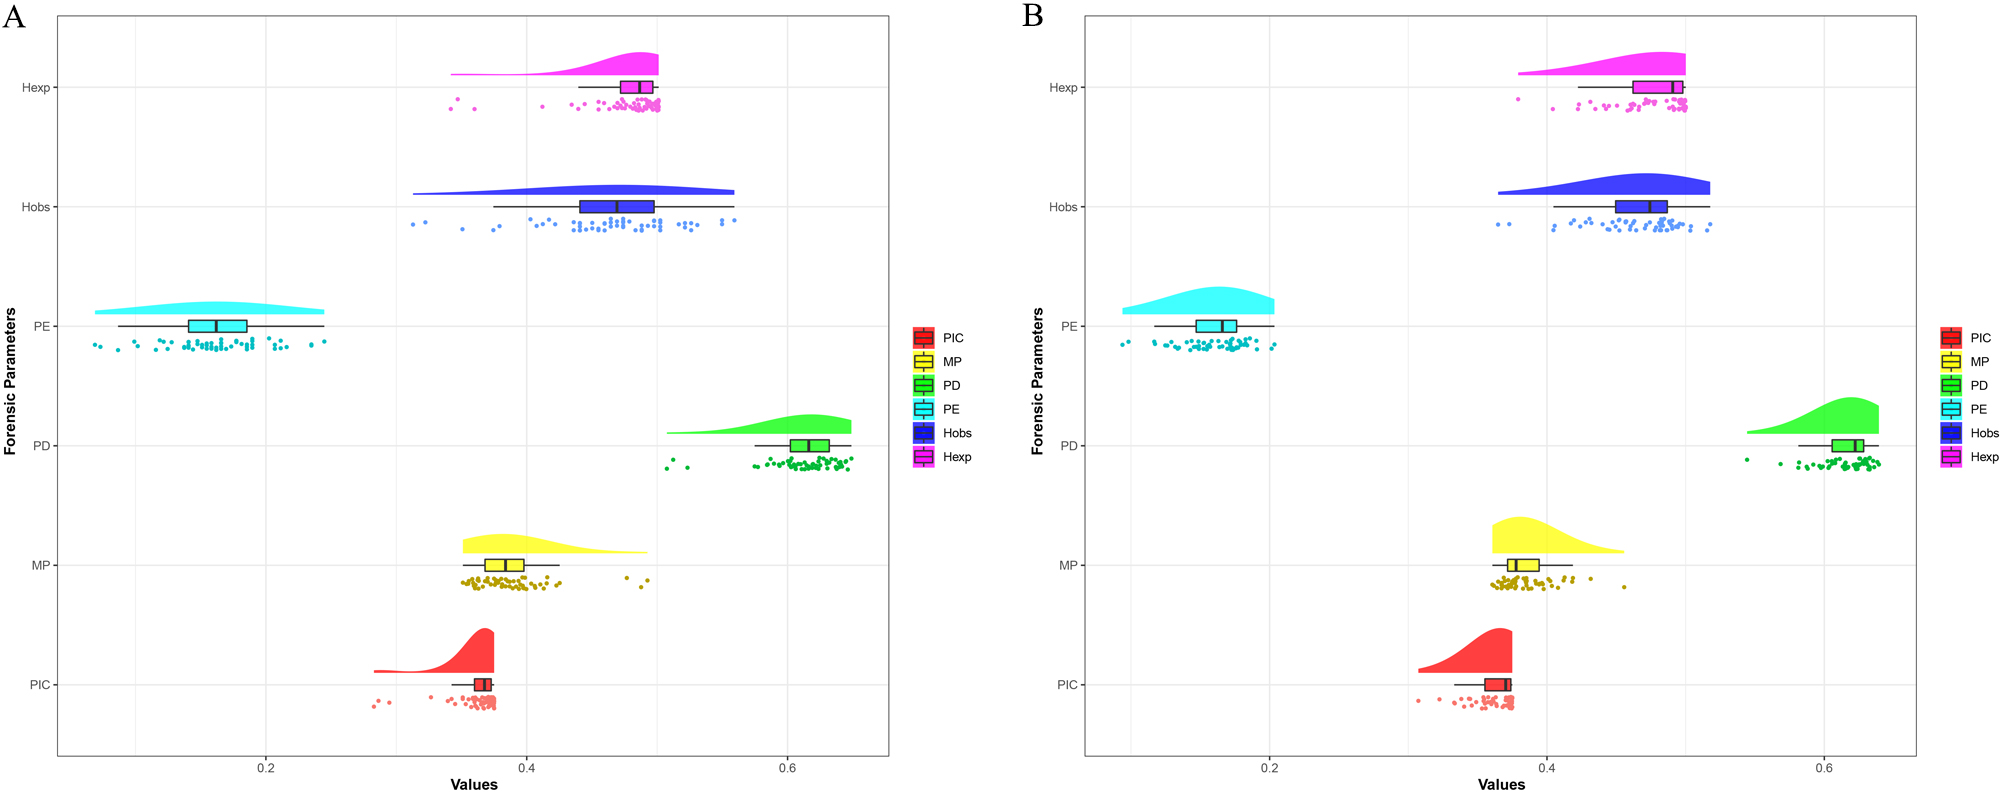 Fig. 1.
The raincloud charts of forensic parameters of 57 autosomal InDels. (A) The raincloud chart of forensic parameters of 57 autosomal InDels in Chinese Yunnan Hani group. (B) The raincloud chart of forensic parameters of 57 autosomal InDels in East Asian populations including Chinese Yunnan Hani group.
The allele frequencies and forensic parameters of the 57 autosomal InDels in East Asian populations including Chinese Yunnan Hani group were also calculated to further assess the forensic efficiency of the novel amplification system in East Asian populations. The results are listed in Supplementary Table 4 and exhibited by another raincloud chart in Fig. 1B, respectively. The minimum insertion allele frequency was at the rs72085595 locus (0.2541), and the maximum insertion allele frequency was at the rs10607699 locus (0.7189). The values of PIC, MP, PD, PE, Hobs, Hexp in Chinese Yunnan Hani group and reference East Asian populations ranged from 0.3073 (rs72085595) to 0.3750 (rs35453727), 0.3606 (rs10590825) to 0.4557 (rs72085595), 0.5443 (rs72085595) to 0.6394 (rs10590825), 0.0939 (rs72085595) to 0.2035 (rs146875868), 0.3647 (rs72085595) to 0.5177 (rs146875868), and 0.3792 (rs72085595) to 0.5001 (rs35453727), respectively.
The pairwise relationship tests involving full siblings and half siblings were simulated based on the allele frequencies of 57 autosomal InDels, and the results are shown in Fig. 2A,B, to further evaluate the statistical potency of the 57 autosomal InDels in analyzing complex cases for kinship testing in Chinese Yunnan Hani group. In the results of simulated full sibling tests in Fig. 2A, a small overlap in the distributions of LR values could be observed between full siblings and unrelated individuals. In the results of simulated half sibling tests in Fig. 2B, the observed overlap was further increased in the distributions of LR values between half siblings and unrelated individuals.
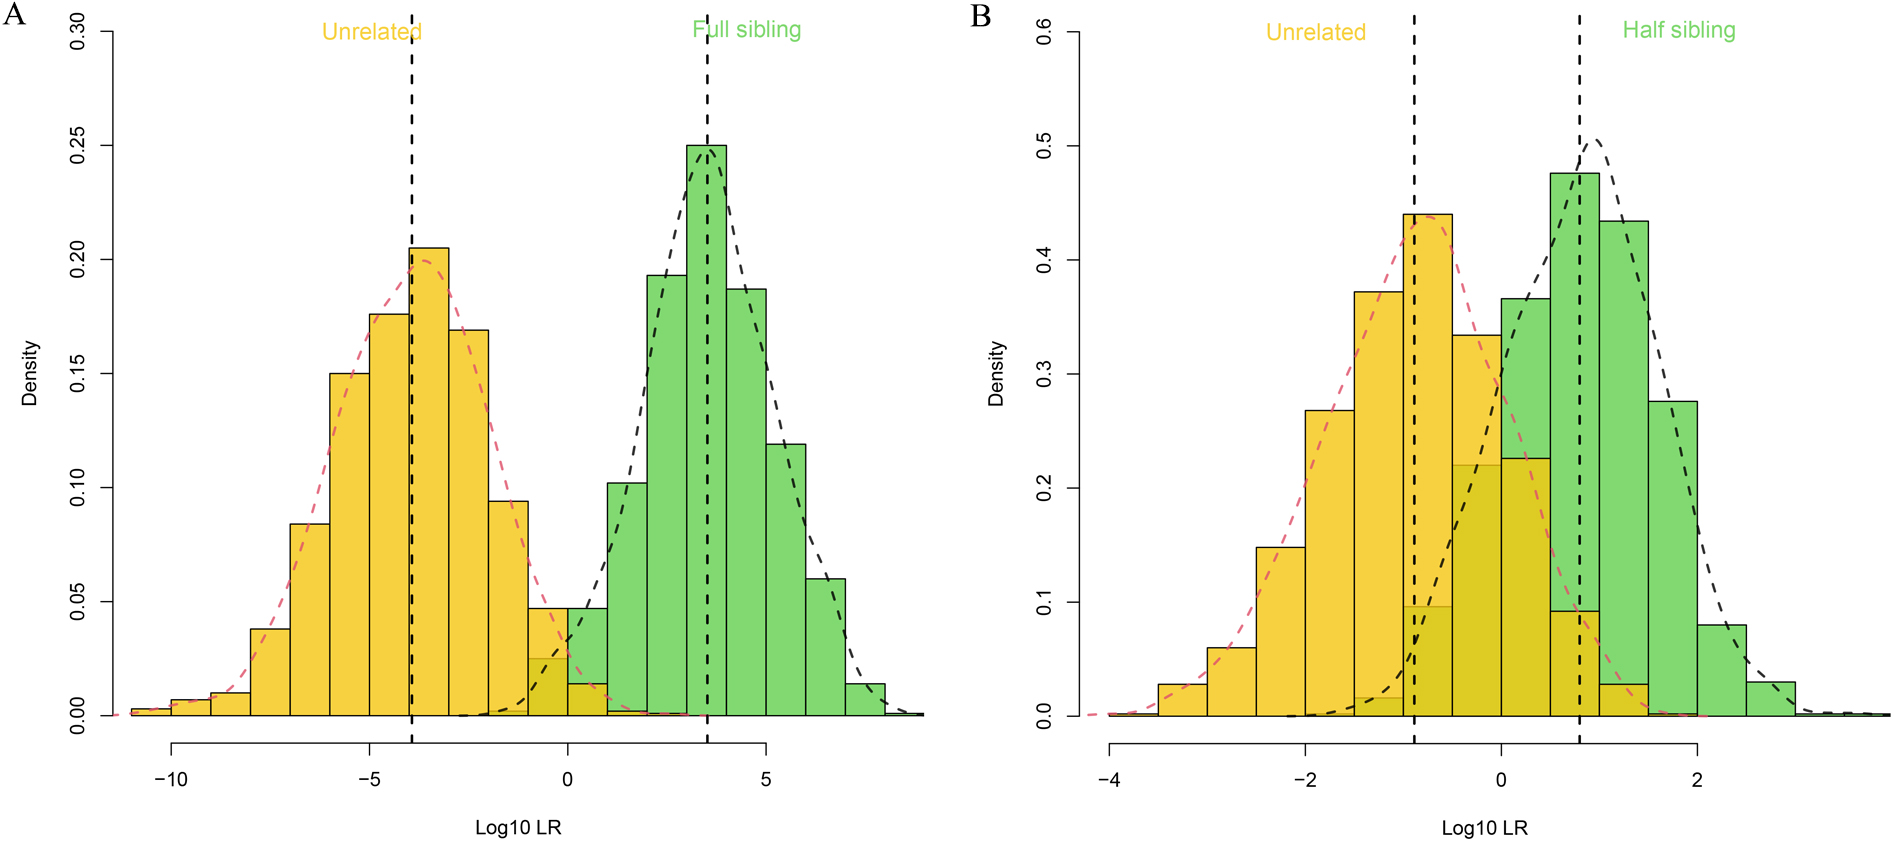 Fig. 2.
The results of simulated full sibling and half sibling tests.
(A) Log
The insertion allele frequencies in view of 57 autosomal InDels in the 31 populations are listed in Supplementary Table 5 and visually demonstrated by a heatmap in Fig. 3. The 57 autosomal InDels showed different insertion allele frequency distributions among the five reference intercontinental populations. For example, the rs3076465, rs71852971, rs3067397, rs72031009, and rs34419736 loci exhibited relatively large insertion allele frequencies in African populations but small insertion allele frequencies in other four intercontinental populations. The rs79225518, rs113011930, rs145010051, rs146875868, and rs77635204 loci embodied relatively high insertion allele frequencies in East Asian populations but low insertion allele frequencies in other four intercontinental populations.
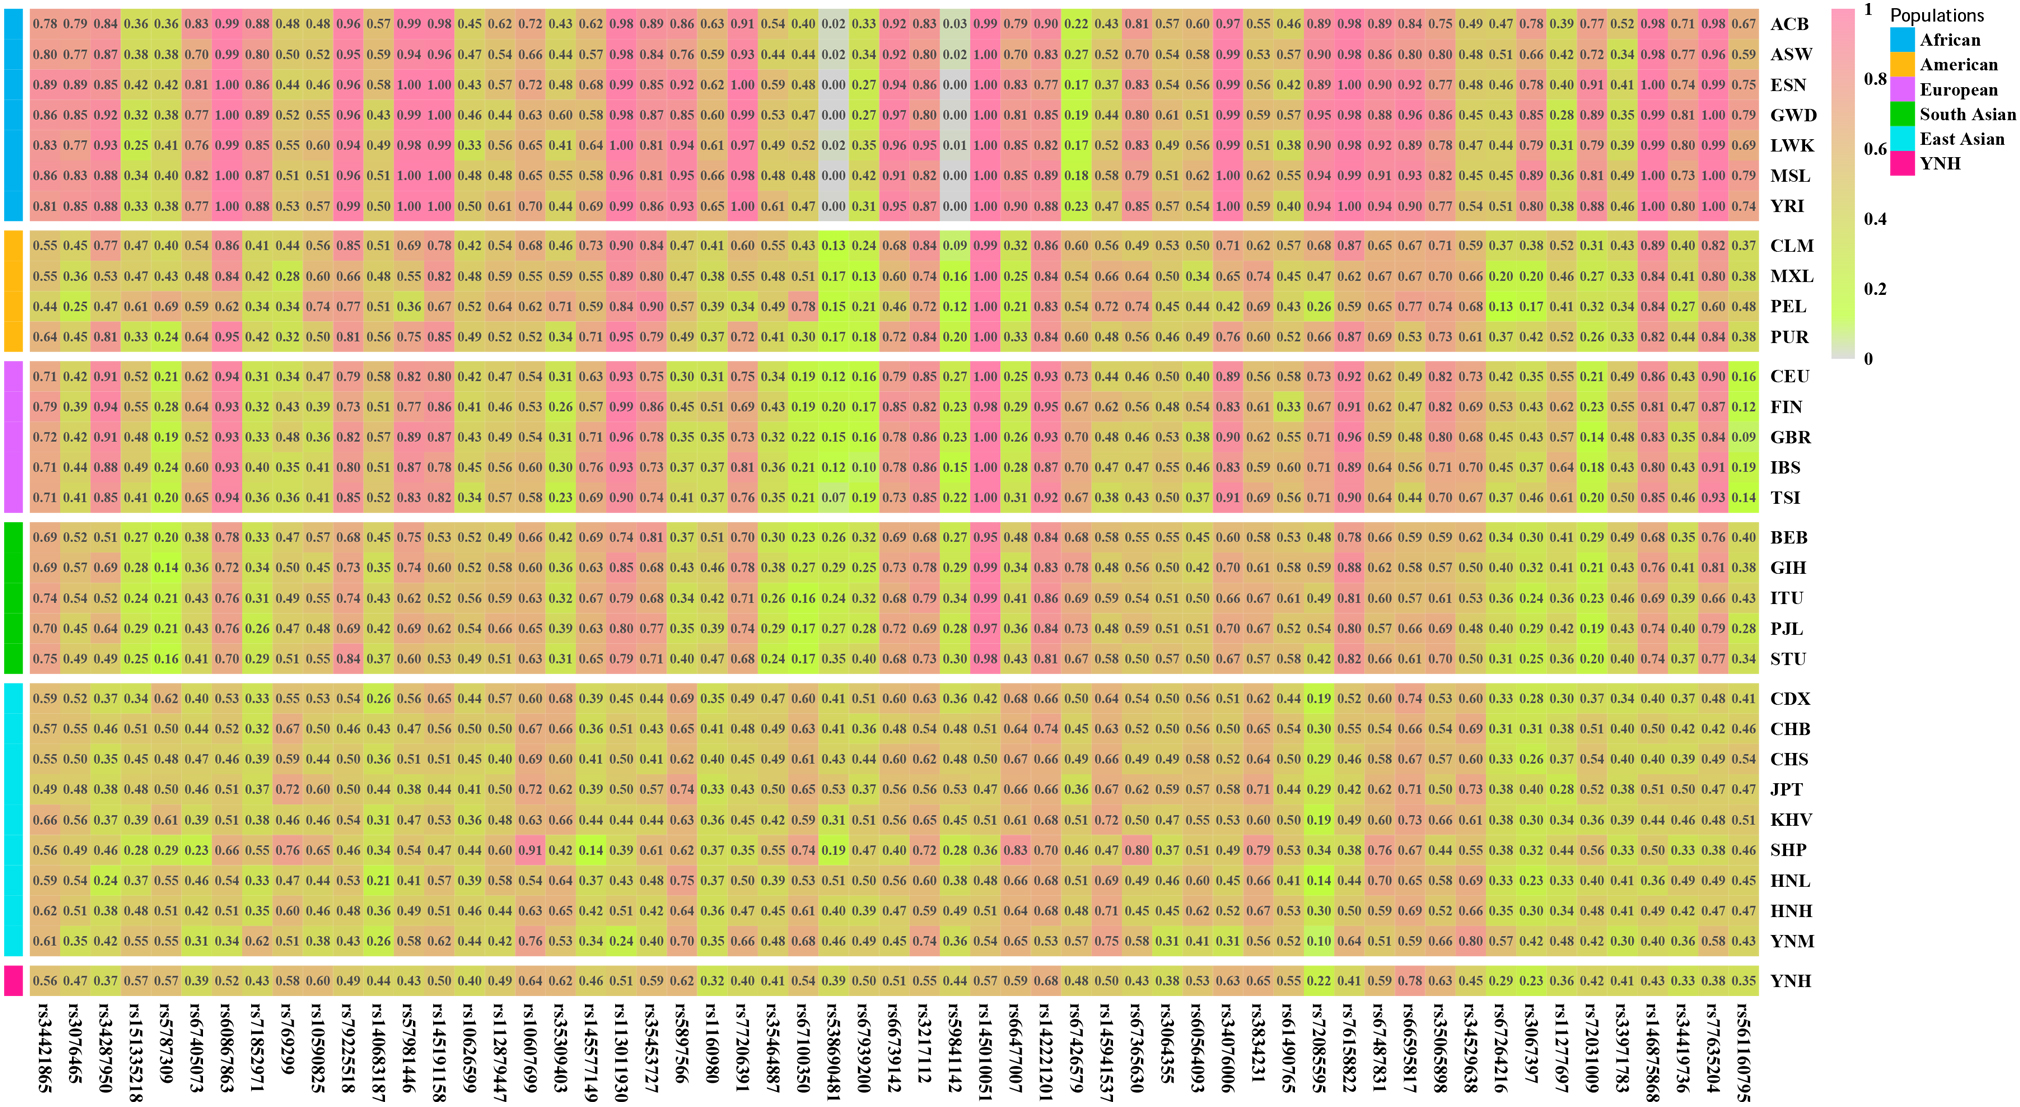 Fig. 3.
The heatmap of insertion allele frequencies of 57 autosomal InDels in Chinese Yunnan Hani group and 30 reference populations. ACB, African Caribbean in Barbados; ASW, African Ancestry in Southwest US; ESN, Esan in Nigeria; GWD, Gambian in Western Division, The Gambia; LWK, Luhya in Webuye, Kenya; MSL, Mende in Sierra Leone; YRI, Yoruba in Ibadan, Nigeria; CLM, Colombian in Medellin, Colombia; MXL, Mexican Ancestry in Los Angeles, California; PEL, Peruvian in Lima, Peru; PUR, Puerto Rican in Puerto Rico; CEU, Utah residents with Northern and Western European ancestry; FIN, Finnish in Finland; GBR, British in England and Scotland; IBS, Iberian populations in Spain; TSI, Toscani in Italy; BEB, Bengali in Bangladesh; GIH, Gujarati Indian in Houston, TX; ITU, Indian Telugu in the UK; PJL, Punjabi in Lahore, Pakistan; STU, Sri Lankan Tamil in the UK; CDX, Chinese Dai in Xishuangbanna, China; CHB, Han Chinese in Bejing, China; CHS, Southern Han Chinese, China; JPT, Japanese in Tokyo, Japan; KHV, Kinh in Ho Chi Minh City, Vietnam; SHP, Dingjie Sherpa, China; HNL, Hainan Li, China; HNH, Hunan Han, China; YNM, Yunnan Miao, China; YNH, Yunnan Hani, China.
Following Bonferroni correction, the significance threshold was changed to 0.0012 (p = 0.05/57 = 0.0008771). The locus-by-locus p values computed using the AMOVA approach are listed in Supplementary Table 6. The Yunnan Hani group showed the minimum amount of significant differences at 2–30 loci with East Asian populations, but the maximum number of significant differences at 32–41 loci with African populations. In addition, the significant differences among Chinese Yunnan Hani group and the remaining populations were observed to be 16–30 loci in four American populations, 36–41 loci with five European populations, and 25–27 loci with five South Asian populations.
The pairwise F
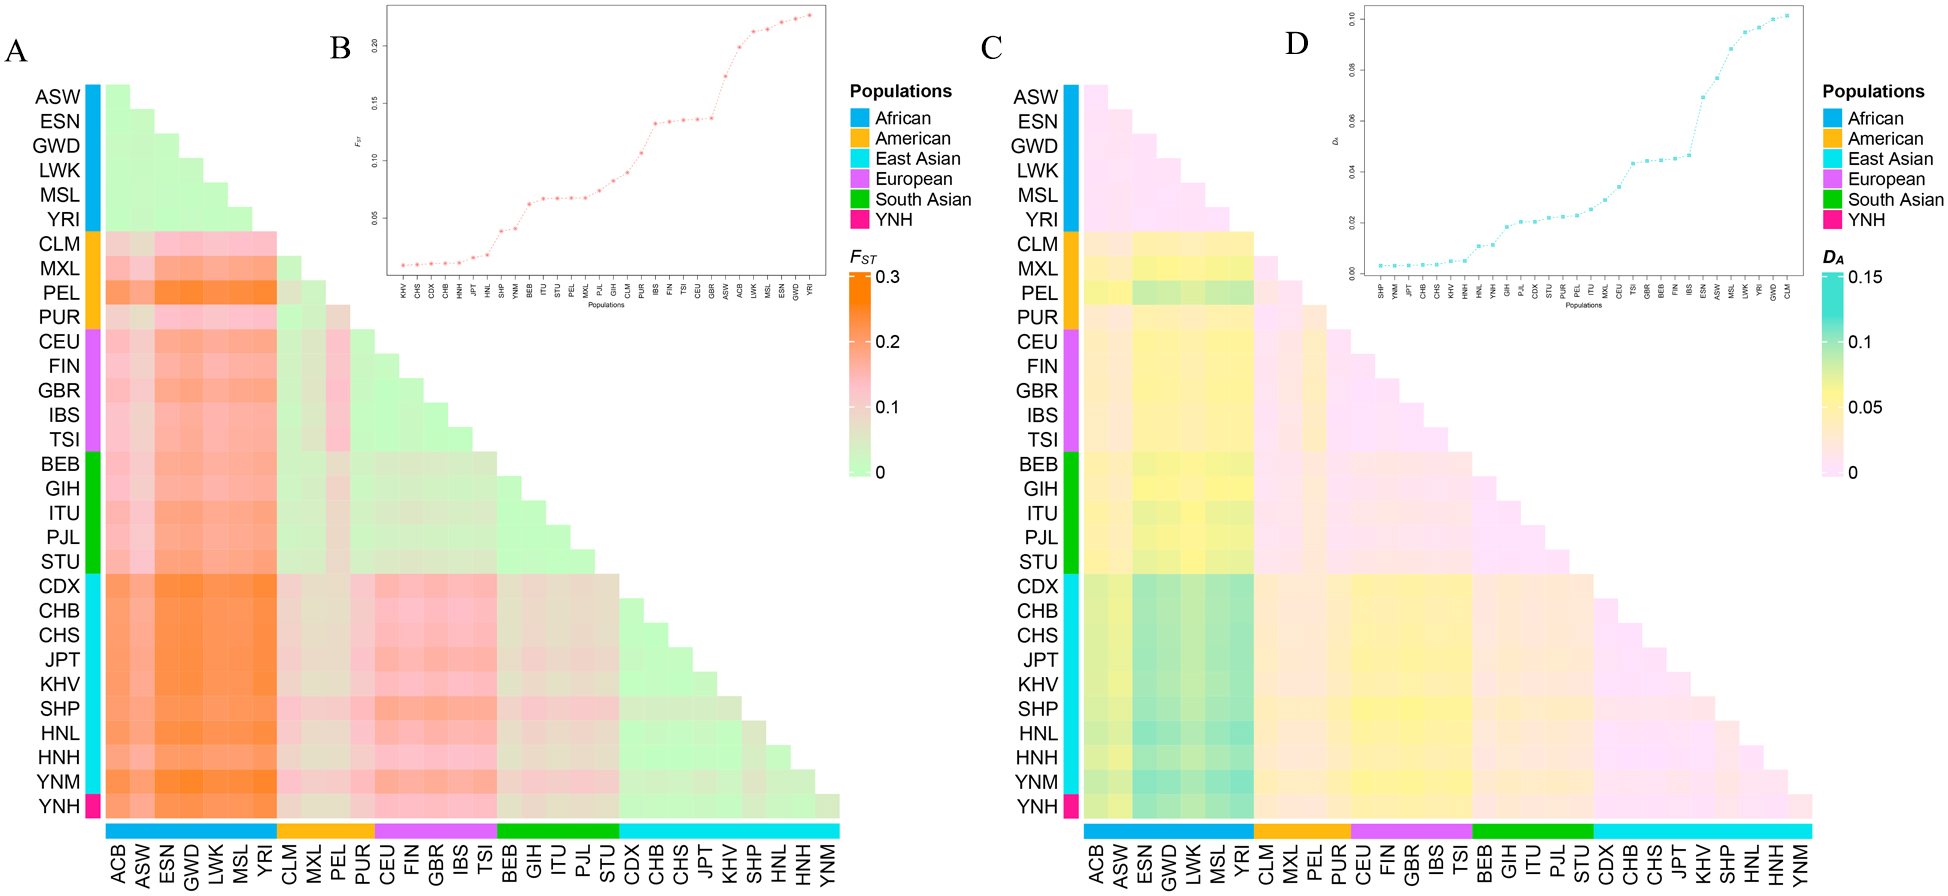 Fig. 4.
The heatmaps and the line graphs of the pairwise
F
The pairwise F
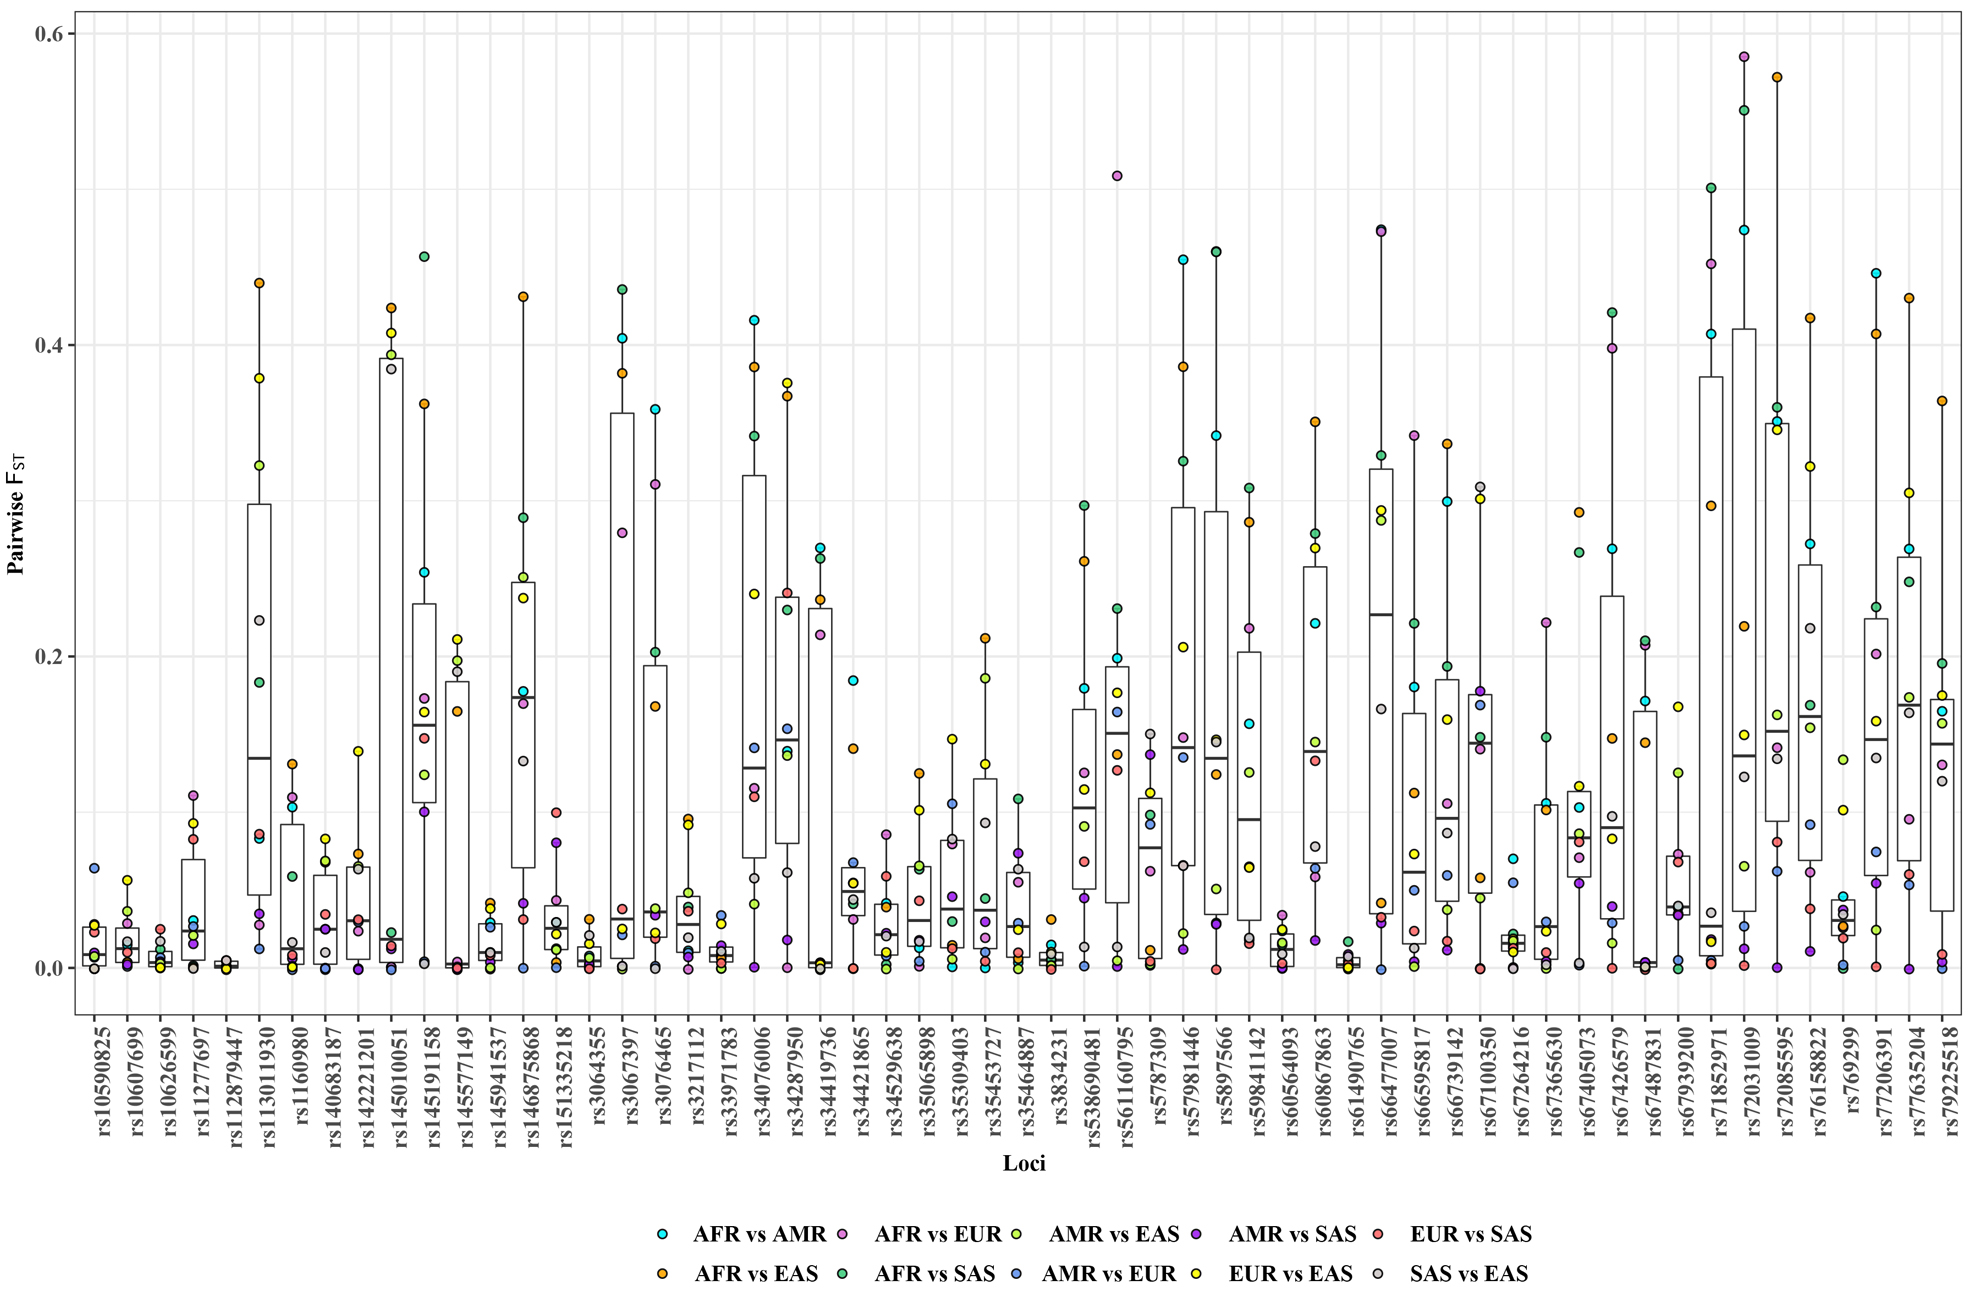 Fig. 5.
The pairwise F
Two phylogenetic trees, one rooted tree in Fig. 6A and one unrooted tree in Fig. 6B, were also used to assess the genetic relationships of the 31 populations. As
depicted in Fig. 6A, the loop phylogenetic tree created using the pairwise
D
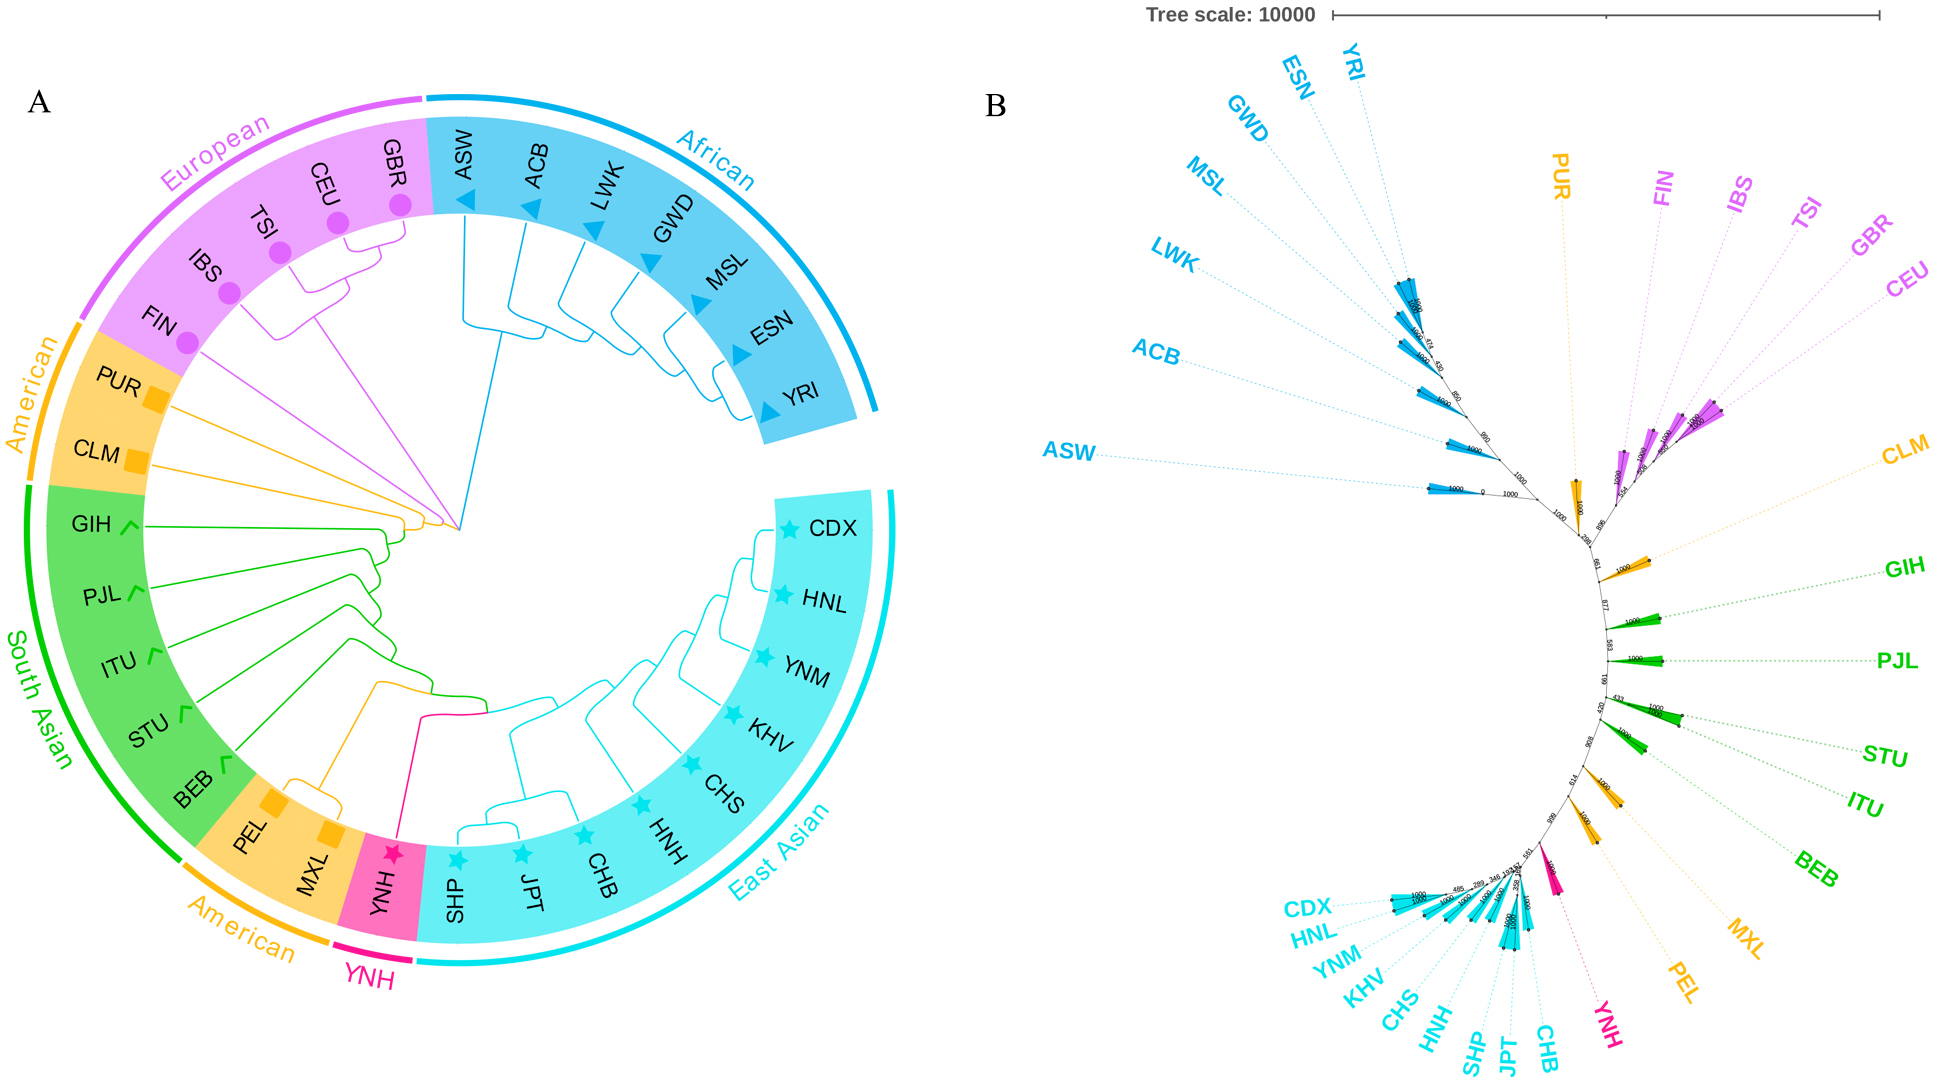 Fig. 6.
The phylogenetic relationship reconstructions among Chinese
Yunnan Hani group and 30 reference populations. (A) The
phylogenetic tree conducted based on the pairwise
D
The PCA and MDS analyses were also employed to further investigate the genetic
relationships among Chinese Yunnan Hani group and 30 worldwide reference
populations, which are exhibited in Fig. 7. The results of genotype-based PCA
plots at the individual level are exhibited in Fig. 7A–D, while the results of
allele frequency-based PCA chart at the population level is presented in Fig. 7E.
The African, reference East Asian, and European populations was in Fig. 7A, while
South Asian populations, American populations, and Chinese Yunnan Hani group are
shown in Fig. 7B–D, respectively. The individuals from African, European and
reference East Asian populations could be clearly distinguished. Most of Chinese
Yunnan Hani individuals overlapped with reference East Asian populations. At the
population level in Fig. 7E, the first two principal components contributed
cumulatively 69.50% of the total variation, with PC1 and PC2 accounting for
46.29%, and 23.21%, respectively. PC1 could categorize African, reference East
Asian populations, and Chinese Yunnan Hani group from the rest of the
populations; PC2 mainly separated African, European populations from other
populations. The cos2 values of 57 autosomal InDels are shown in Fig. 8,
and the rs112879447, rs10626599, rs61490765,
rs151335218, and rs10590825 loci are located in the relatively inner part of the
ring and presented relatively low cos2 values. The result of
the MDS analysis in terms of pairwise F
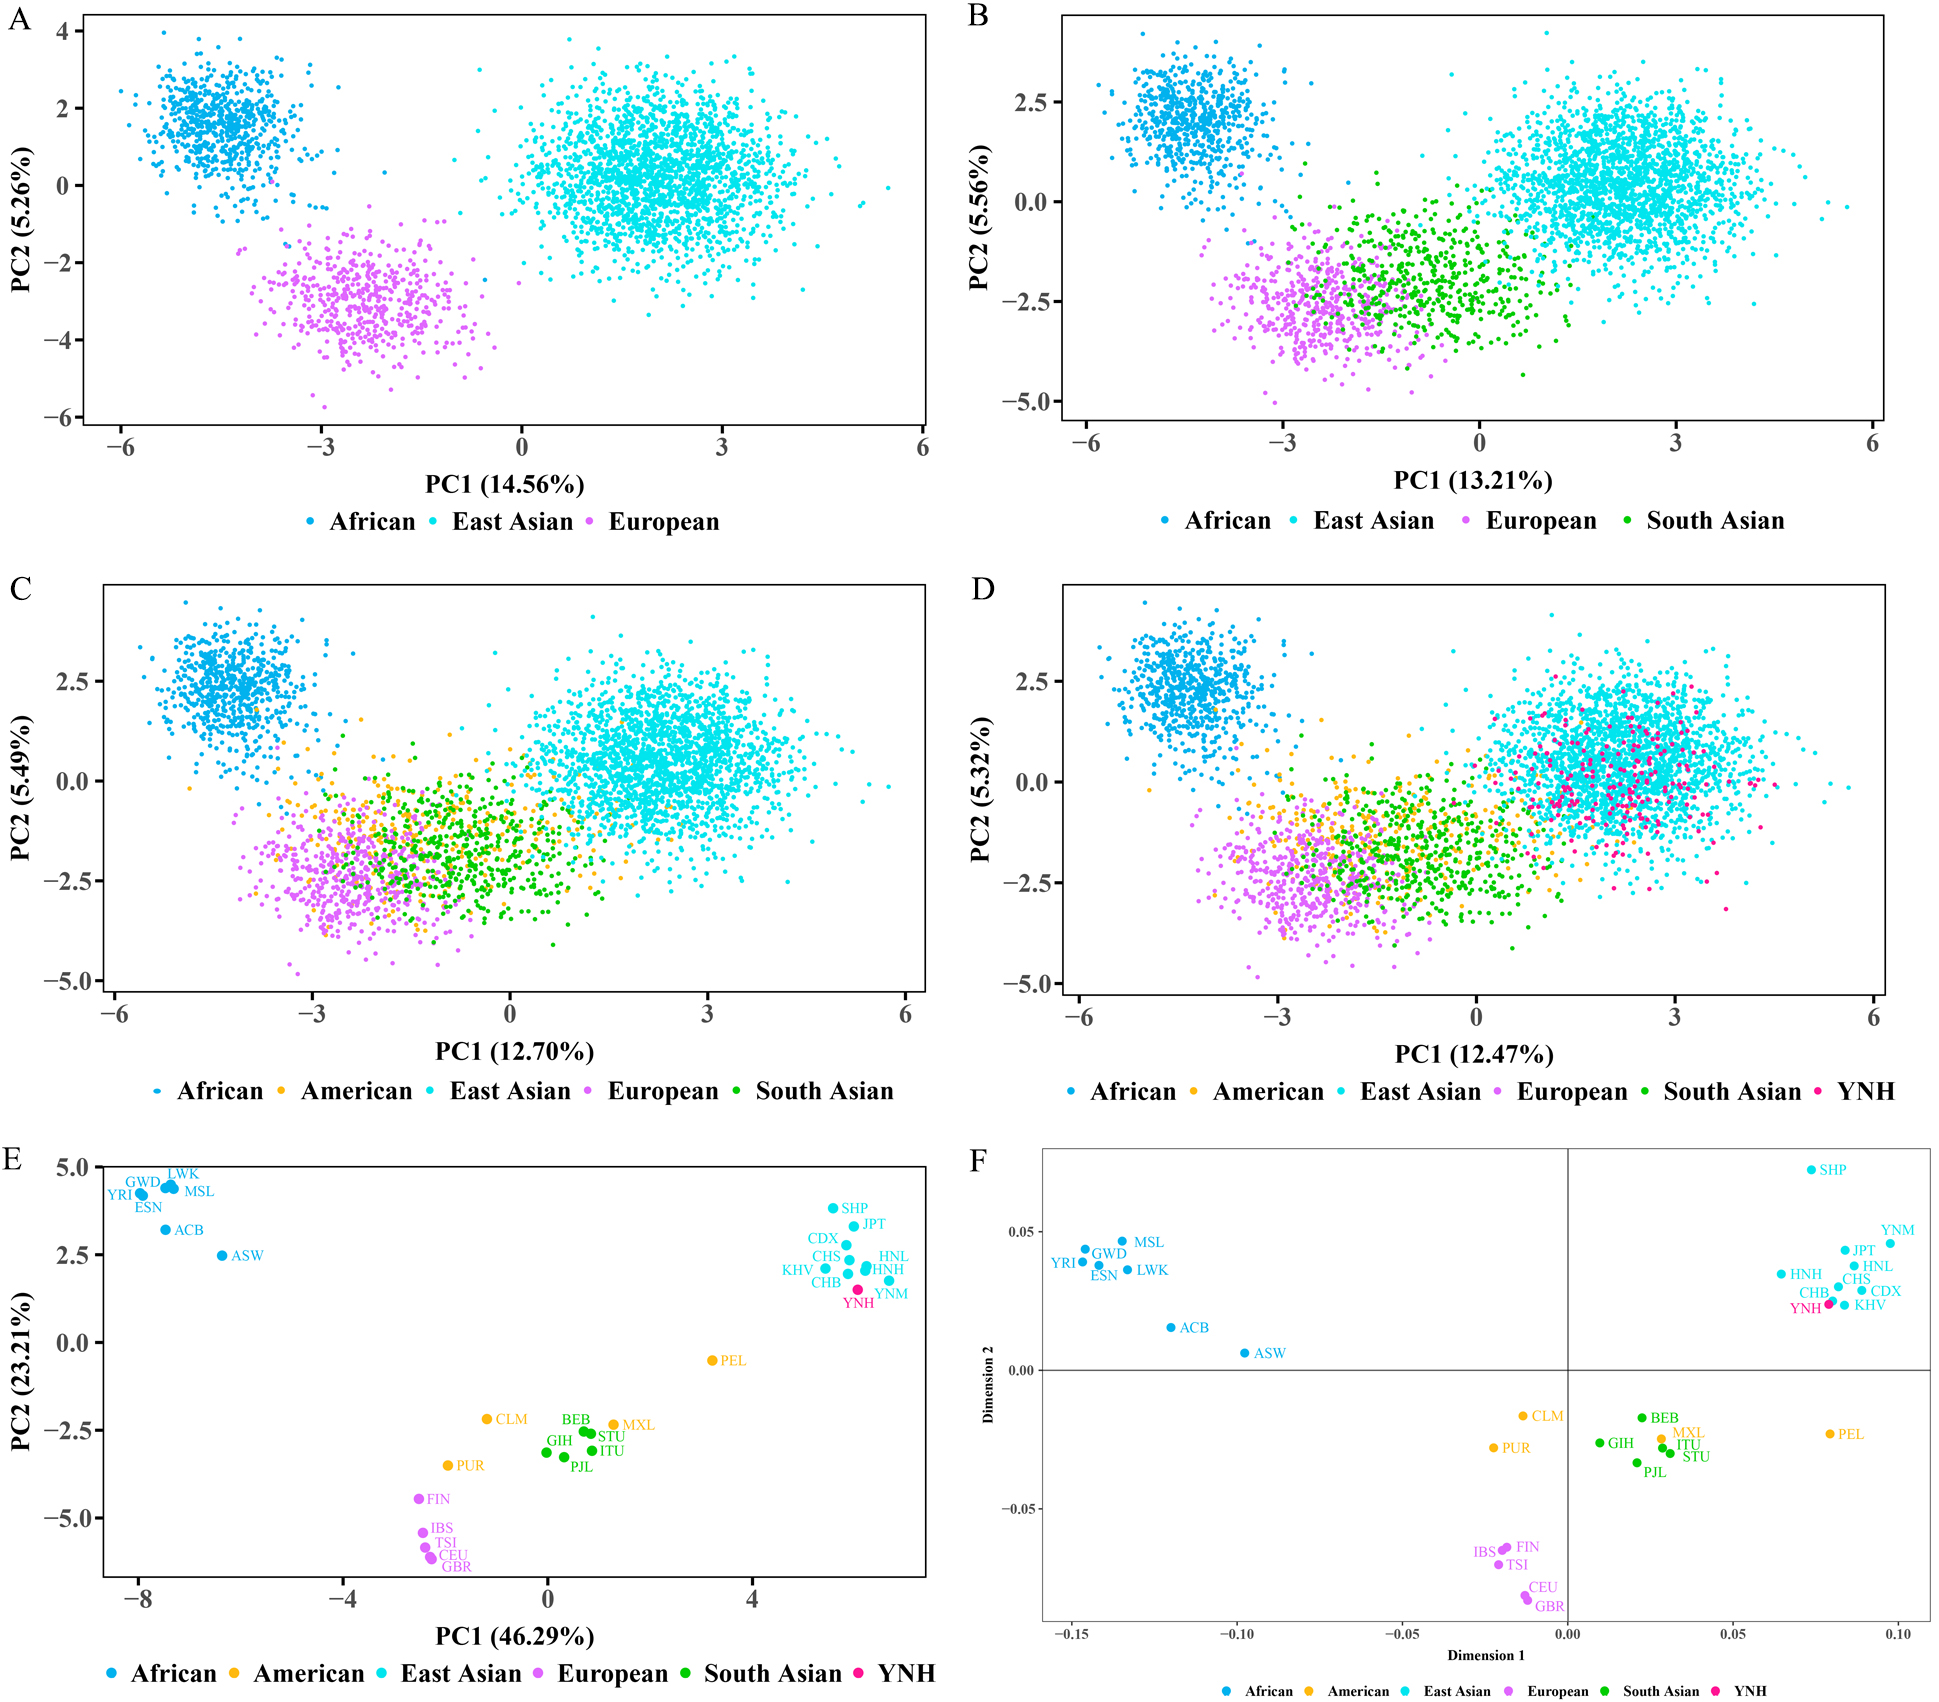 Fig. 7.
The results of PCA and MDS analyses among Chinese Yunnan Hani
group and reference populations. (A) The PCA plot on the
individual level in 21 reference populations from three continents. (B) The PCA
plot on the individual level in 26 reference populations from four continents.
(C) The PCA plot on the individual level in 30 reference populations from five
continents.
(D) The
PCA plot on the individual level among
Chinese Yunnan Hani group and 30 reference populations. (E) The PCA plot on the
population level among Chinese Yunnan Hani group and 30 reference populations.
(F) The MDS analysis plot based on the pairwise F
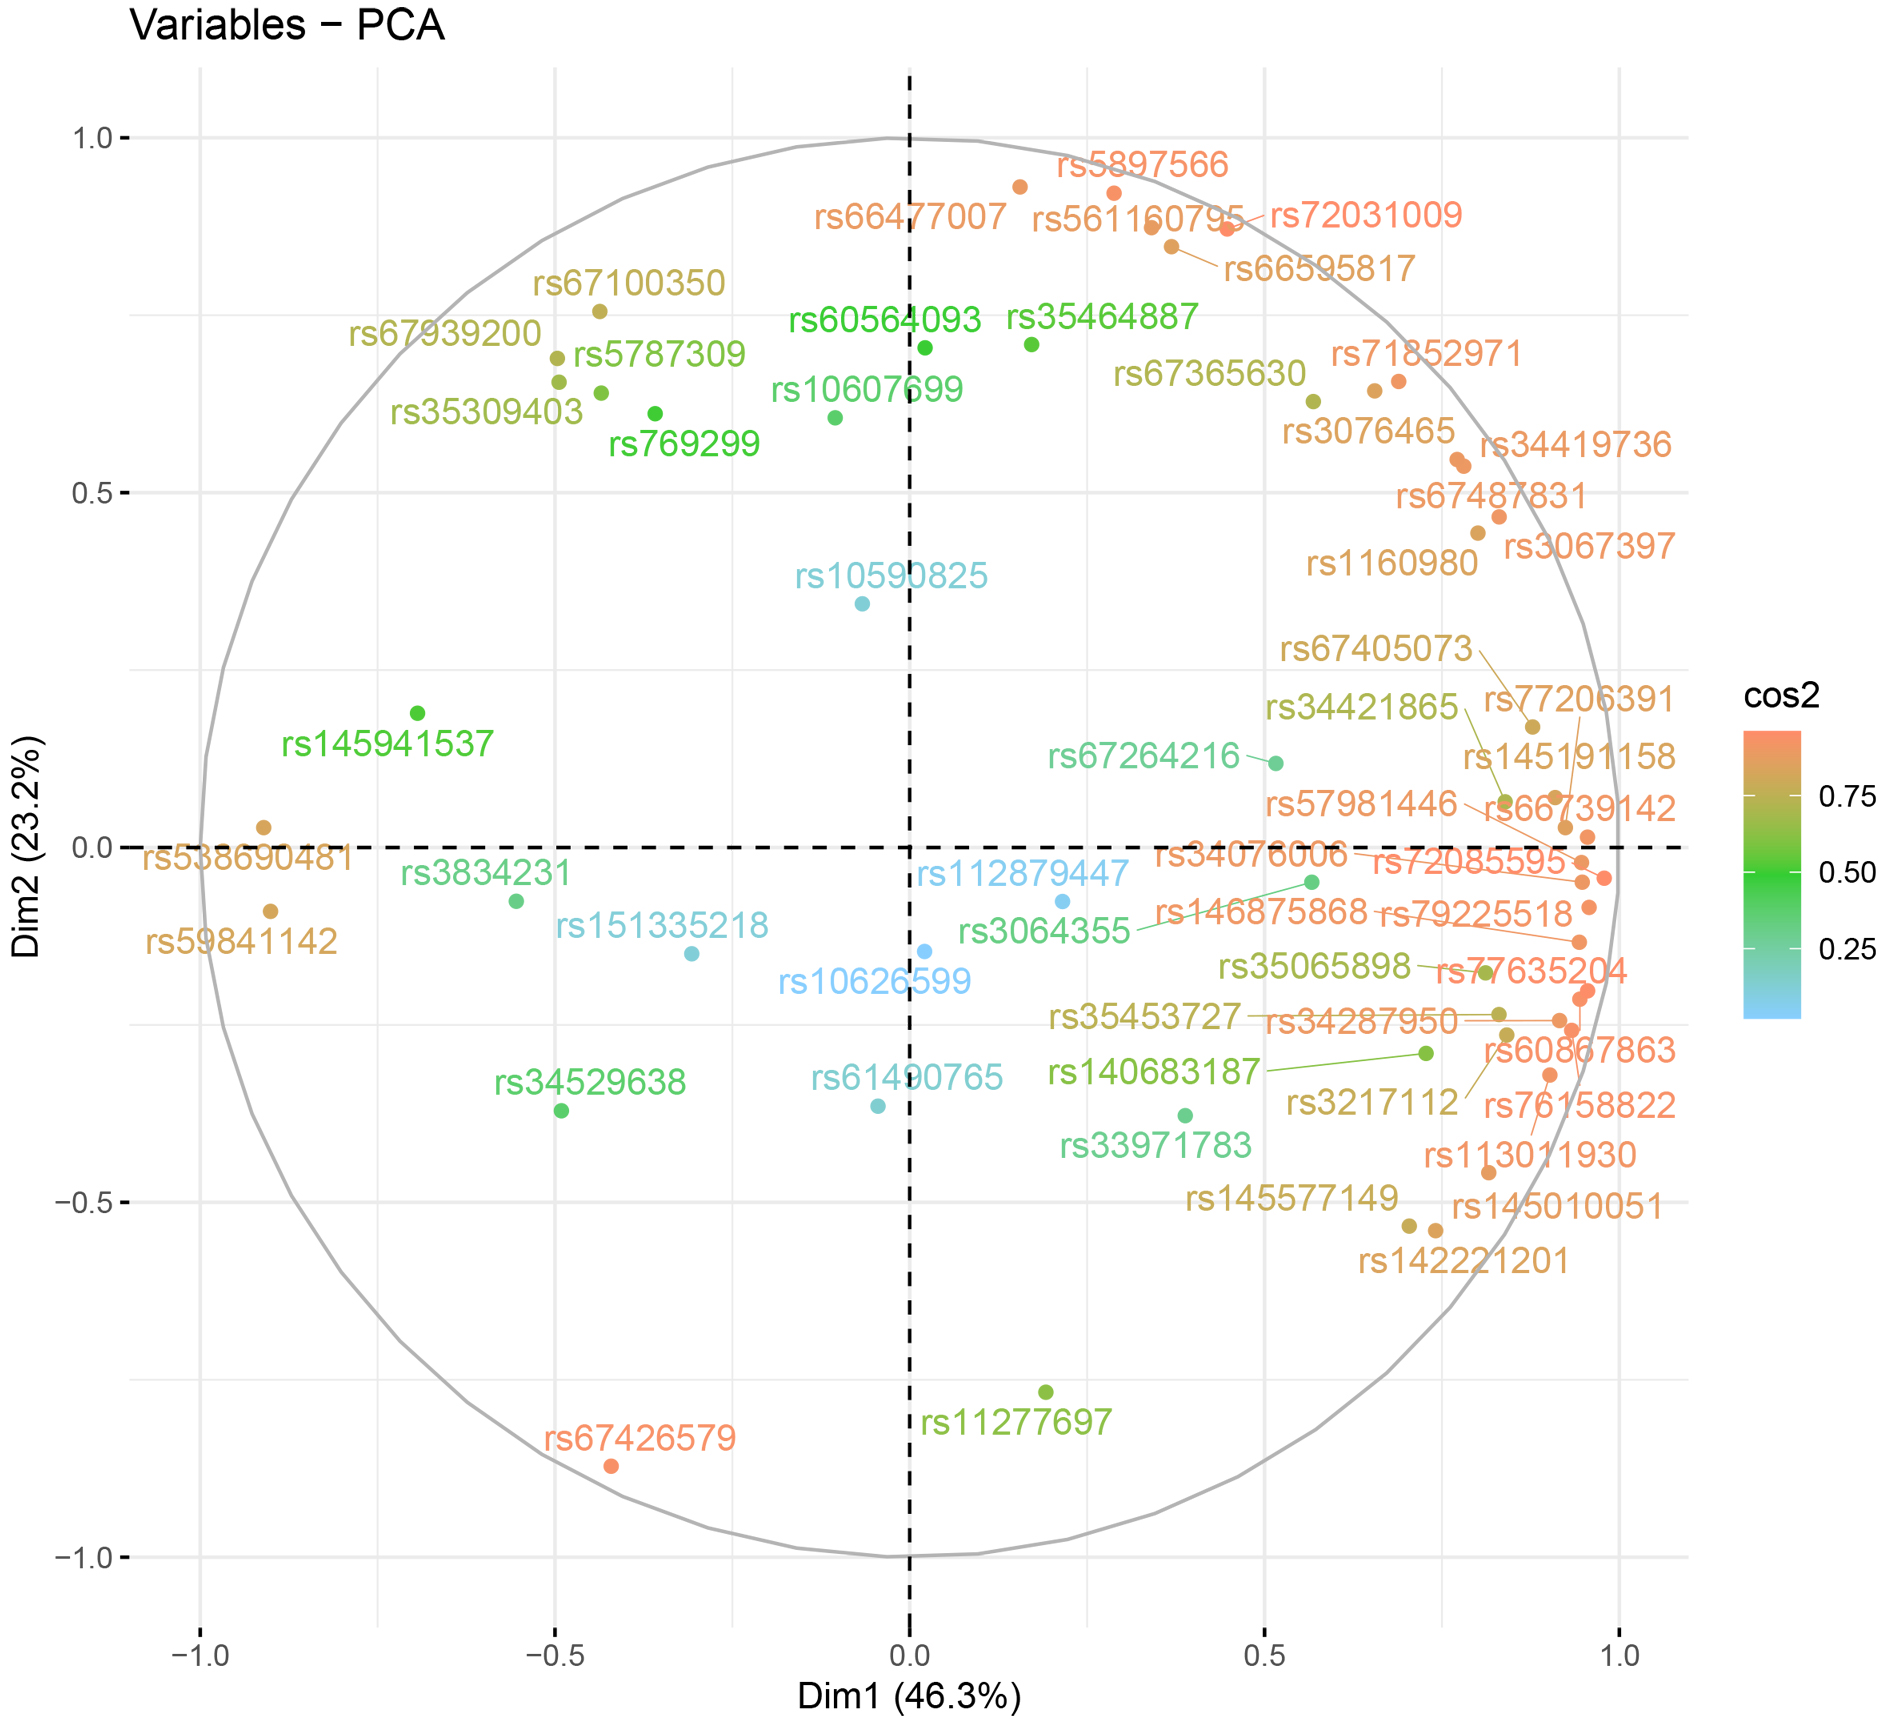 Fig. 8.
The cos2 values on the basis of allelic frequencies of 57 autosomal InDels in Chinese Yunnan Hani group and 30 reference populations.
To further demonstrate the ancestral compositions of Chinese Yunnan Hani group, population genetic structure analyses were also performed, and the results are presented in Fig. 9 and Supplementary Figs. 1,2, respectively. As shown in Supplementary Fig. 1, the Delta K maximize was observed at K = 3, which meant the optimum K value estimated by the Structure Harvester Website was three. Supplementary Fig. 2 showed the locations of the 31 global reference populations on the world map and the structure analysis results (K = 3) at the 31 population level through the pie plots. The estimated ancestral proportions of Chinese Yunnan Hani group and 30 reference populations by assuming three ancestral populations are shown in the boxplot in Fig. 9A. The structure analysis results (K = 3) at 4229 individual levels are exhibited in the circle plot in Fig. 9B and the triangle plot in Fig. 9C, respectively. The dots representing Chinese Yunnan Hani individuals overlapped for the most part with those representing the reference East Asian populations in Fig. 9C. Moreover, the detailed ancestral proportion (K = 3) of Chinese Yunnan Hani group and other 30 reference populations were also presented through the circle chart in Fig. 9D. When K = 3, three ancestry compositions of the African, East Asian, and European clusters were further divided, and the dominant ancestry component in Chinese Yunnan Hani group was East Asian. More specifically, the percentages of African, European, and East Asian ancestry components in Chinese Yunnan Hani group were 0.0146, 0.0455, and 0.9399, respectively. Ancestral compositions of Chinese Yunnan Hani group were always in accord with other East Asian populations, indicating that the genetic architecture between Chinese Yunnan Hani group and East Asian populations was more similar than those of other intercontinental populations.
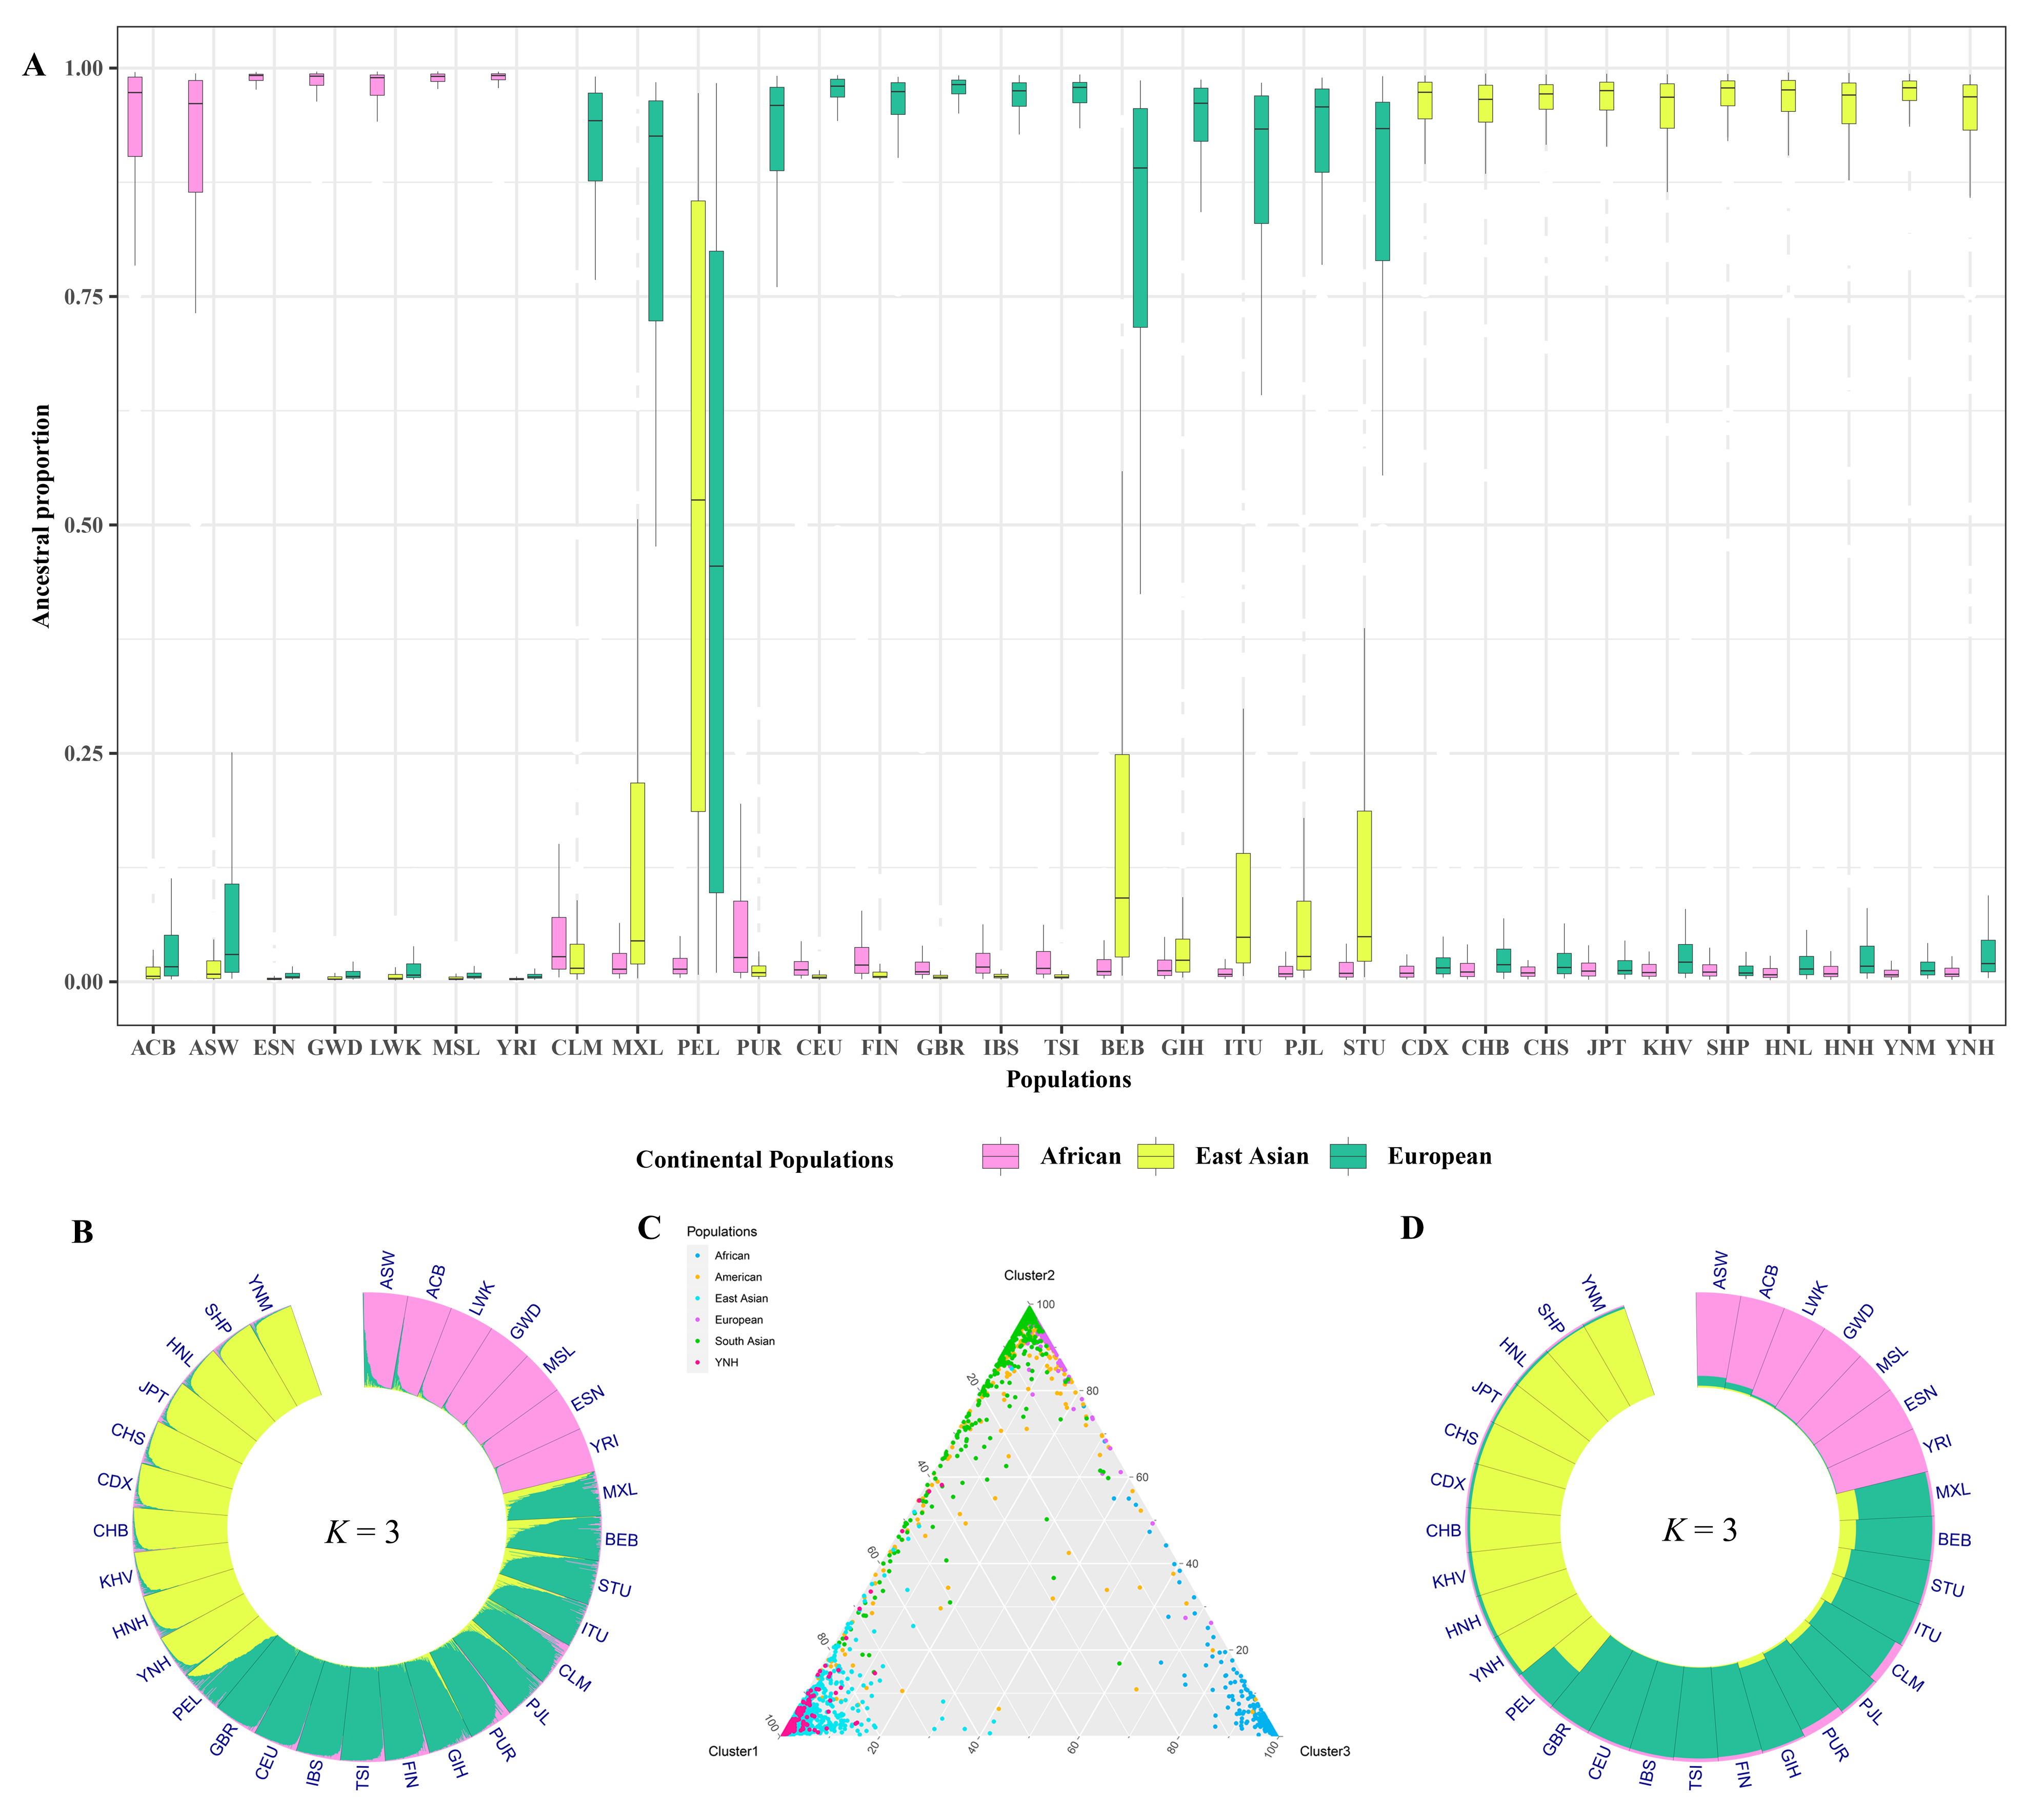 Fig. 9.
The outcomes of population genetic structure analyses between Chinese Yunnan Hani group and 30 reference populations. (A) Estimated ancestry proportions of Chinese Yunnan Hani group and 30 reference populations by assuming three ancestral populations. (B) The population genetic structure analysis results (K = 3) on the individual level among Chinese Yunnan Hani group and 30 reference populations. (C) Clustering analysis results (K = 3) for individual ancestry estimation among Chinese Yunnan Hani group and 30 reference populations. (D) The population genetic structure analysis results (K = 3) on the population level among Chinese Yunnan Hani group and 30 reference populations.
InDels, a new generation of genetic markers, have unique advantages in forensic genetic analysis and population genetics, since they combine the advantages of STRs and SNPs [31]. However, most InDels have some limitations as diallelic genetic markers. First, the genetic information carried by InDels is limited, and more InDel loci need to be combined to achieve the high discrimination efficacy. The combination of a large number of loci in the same multiplex amplification system increases the technical difficulties. Second, the allelic frequencies of InDel loci show the distribution differences in different populations, so more population genetic data are needed to investigate and support the actual application in the practice of forensic DNA identification [32]. Therefore, it is crucial to construct a multiple amplification system containing more and higher genetic polymorphism InDel loci, and also to test their forensic efficacies in different populations.
The formation of the Hani ethnic group has taken place over a long historical period and integrated various cultural factors, making the issue of its ethnic background very complex. The origin of the Hani is not precisely known, but many academics believed that the Hani group, Yi and Lahu ethnic minorities all have common ancestors. And they all descended from the ancient Qiang people, a nomadic clan that once inhabited the Qinghai-Tibetan Plateau and gave rise to numerous ethnic groups across southern and southwestern China (http://www.yunnanadventure.com/minorities/Hani-Ethnic-Minority_11.html). Due to population migrations, the Hani ethnic group comprises many subgroups. Studying Chinese Hani group not only enriches the genetic data of the Hani group and further explores the genetic structure of the Hani group, but also lays the foundation for further forensic applications of InDels.
In this study, we assessed the genetic polymorphisms and forensic application efficiencies of the novel panel containing 57 autosomal InDels in Chinese Yunnan Hani group. No significant HWE deviation was observed at the 57 autosomal InDels, and no linkage disequilibrium was detected in the pairs of 57 autosomal InDels, which indicated that these samples employed in this study were representative in Chinese Yunnan Hani group and offered the foundation for the computations of forensic parameters and analyses of population genetic relationships. In a population, observed heterozygosity refers to the percentage of heterozygotes in all individual genotypes of a genetic marker. The high degree of heterozygosity indicates that the genetic marker is high application value in forensic personal identification. PIC is applied to estimate the extent of polymorphism in a genetic marker. When the PIC value exceeds 0.25, it indicates that valid genetic information can be provided [33, 34]. PD is a metric used to evaluate the degree of effectiveness of a genetic marker in identifying different individuals. PE is an index used to appraise the practical value of a particular genetic marker in parentage identification case. In Chinese Yunnan Hani group, all the 57 autosomal InDels showed heterozygosity values above 0.3, PIC values higher than 0.25, and mean PD and PE values of 0.6118 and 0.1612, respectively. In addition, the CPD and CPE values were 0.9999999999999999999999968 and 0.999958, respectively. Zhang et al. [35] investigated the genetic variations of 20 autosomal STRs in the Hani ethnic group in the Yunnan province of southwestern China, and found that the CPD value was 0.99999999999999999999997491. Cui et al. [18] assessed the genetic polymorphisms of 39 InDels in the Yunnan Hani group, and the acquired CPD value of 37 InDels was 0.9999999999617927. The CPD value obtained in the current study is based on these new 57 autosomal InDels which were higher than those obtained in previous studies based on 20 autosomal STRs and 37 InDels mentioned above. And this demonstrated that this novel panel may be utilized as a prospective tool for personal identification in Chinese Yunnan Hani group. The obtained CPE value was 0.999958, which was larger than the value of 0.96457903 calculated by 37 InDels, illustrating that the new amplification system was also suitable for paternity testing in Chinese Yunnan Hani group [18]. The results of LR distributions in the simulated full sibling and half sibling tests indicated the potential value of this novel multiplex amplification system for forensic complex kinship identification.
We explored the genetic relationships between Chinese Yunnan
Hani group and other 30 worldwide reference populations ground
on the novel 57 autosomal InDels to obtain
a more holistic insight into the genetic makeup of Chinese
Yunnan Hani group. Except for the American populations, the insertion allele frequency distributions for most of the 57 autosomal InDels were similar in the same
intercontinental populations. Previous studies have revealed
that allele frequency distributions of the same
locus often differ significantly across different regions in
various intercontinental populations, and the present
results are consistent with these previous findings [36, 37, 38].
For example, the rs3076465, rs71852971, rs3067397, rs72031009, rs34419736,
rs79225518, rs113011930, rs145010051, rs146875868, and rs77635204 loci showed the
distinct divergences among populations from different continents, indicating that
some loci in this novel system have promising potential as
ancestry informative markers (AIMs) [39]. A typical
statistical metric used to assess genetic differences both within and between
populations is the genetic distance [40]. The results of AMOVA
for single InDel locus, pairwise F
The consequences of phylogenetic relationship reconstruction demonstrated that Chinese Yunnan Hani group clustered with reference populations from East Asia, which was in accordance with the outcomes of PCA and MDS analyses. The population genetic structure analyses indicated that the ratios of ancestral compositions in Chinese Yunnan Hani group were similar to those of the reference populations from East Asia, which were also confirmed with the results of other cluster analyses. Previously, Cui et al. [18] investigated the genetic polymorphisms and probed the genetic background of Chinese Yunnan Hani group based on 38 InDels. The results showed that Chinese Yunnan Hani group had closer genetic relationships and similar population genetic structures with the populations from East Asia, especially with the populations from the south of China [18]. The findings on the genetic relationships of Chinese Yunnan Hani group in the present study are generally consistent with these previous results. In addition, the polymorphic analyses of other diverse genetic markers such as autosomal STRs [35, 41], Y-STRs [42], and X-STRs [43] also confirms the intimate genetic relationships between Chinese Yunnan Hani group and East Asian populations, which further supports the present research findings.
In the present study, we firstly studied the innovative panel including 57 autosomal InDels in Chinese Yunnan Hani group to further assess the forensic efficiency of this amplification system and explore the genetic relationships among Chinese Yunnan Hani group and 30 worldwide reference populations. The results of forensic parameters of 57 autosomal InDels exhibited that this novel panel could be utilized as a powerful tool for personal identification and paternity testing in Chinese Yunnan Hani group. Multiple population genetic analyses showed relatively closer genetic structures between Chinese Yunnan Hani group and the reference East Asian populations. This study will provide a robust foundation for the InDel application in forensic genetics, enrich the informative resources of the existing InDel dataset, and further promote a more comprehensive understanding of the genetic architecture of Chinese Yunnan Hani group.
The datasets used during the current study are available from the corresponding author on reasonable request.
BZ designed the study and performed the research. HX analyzed the data and wrote the manuscript. SN and LH provided help with sample collection. XC, MZ, XY, and YL assisted in analyzing the data. All authors contributed to editorial changes in the manuscript. All authors read and approved the final manuscript.
The present research strictly adhered to the ethical guidelines of the Helsinki Declaration and was approved by the ethics committee of Xi’an Jiaotong University, China (Approval No. 2019-1039).
The authors want to thank the volunteers in this research.
This research was funded by the National Natural Science Foundation of China, grant number 81930055.
The authors declare no conflict of interest.
References
Publisher’s Note: IMR Press stays neutral with regard to jurisdictional claims in published maps and institutional affiliations.