IMR Press / FBL / Volume 27 / Issue 8 / DOI: 10.31083/j.fbl2708242
Open Access Original Research
Antioxidants Rich Herbal Formula Ger-Gen-Chyn-Lian-Tang Protects Lipotoxicity and Ameliorates Inflammation Signaling through Regulation of Mitochondrial Biogenesis and Mitophagy in Nonalcoholic Fatty Liver Disease Mice
Show Less
1 Graduate Institute of Clinical Medical Sciences, College of Medicine, Chang Gung University, 33302 Taoyuan City, Taiwan
2 Graduate Institute of Traditional Chinese Medicine, School of Chinese Medicine, College of Medicine, Chang Gung University, 33302 Taoyuan City, Taiwan
3 Department of Traditional Chinese Medicine, Chang Gung Memorial Hospital, 204 Keelung City, Taiwan
4 Institute of Traditional Medicine, School of Medicine, National Yang Ming Chiao Tung University, 11217 Taipei, Taiwan
5 Brion Research Institute of Taiwan, 23143 Taipei, Taiwan
*Correspondence: joyamen@mail.cgu.edu.tw (Tzung-Yan Lee)
Academic Editor: Salvatore Nesci
Front. Biosci. (Landmark Ed) 2022, 27(8), 242; https://doi.org/10.31083/j.fbl2708242
Submitted: 30 April 2022 | Revised: 29 June 2022 | Accepted: 21 July 2022 | Published: 15 August 2022
(This article belongs to the Special Issue Mitochondrial Biology in Health and Disease)
Copyright: © 2022 The Author(s). Published by IMR Press.
This is an open access article under the CC BY 4.0 license.
Abstract

Background: Non-alcoholic fatty liver disease (NAFLD) has become a prevalent issue and a consequence of metabolic syndrome impact on human health. Both of anti-atherosclerosis and anti-hepatic fibrosis capabilities of herbal medicine Ger-Gen-Chyn-Lian-Tang (GGCLT) has attracted attention, but their molecular regulatory mechanisms in a NAFLD model have not been elucidated. The aim of the present study was to explore the bioactivity of db/db mice following treatment with GGCLT. Methods: NAFLD phenotype of db/db mice were treated with GGCLT and lipogenesis, mitochondria dysfunction, mitophagy, macrophage polarization and adipose tissue browning were then evaluated using qRT-PCR and/or Western blot analysis, immunofluorescence, and immunohistochemistry assays, respectively. Results: GGCLT not only decreased serum levels of TG and free fatty acids, but glucose and insulin tolerance test in db/db mice. In parallel, GGCLT reduced lipogenesis and hypoxia-inflammation cascades in NAFLD progression. GGCLT reduced lipid accumulation and was accompanied by the enhanced mitochondria biogenesis, M2 macrophage, and decreased M1 macrophage. The latter two events contributing to the anti-inflammation are resulting from mitochondria dynamics, and the lipotoxicity lowering effect of GGCLT of NAFLD mice is mediated by promoting mitophagy in Parkin-dependent and -independent pathways, by mitochondrial fusion over fission manner. GGCLT also inactivated lipogenesis and decreased lipid accumulation in epididymal white adipose tissue with a higher M2/M1 macrophage ratio. Conclusions: Besides in the liver, modulating of mitochondrial biogenesis and adipose tissue browning were characterized by increased Tmem26, Tfam, and Prdm16 expression by GGCLT in EWAT also contributes to the beneficial action in NAFLD.

Keywords
NAFLD
Ger-Gen-Chyn-Lian-Tang
lipotoxicity
mitochondria biogenesis
mitophagy
adipose tissue browning
1. Introduction

NAFLD (non-alcoholic fatty liver disease) prevalence is increasing constantly, with an increase in prevalence accompanied by obesity and type 2 diabetes (T2D) [1]. An excess flow of free fatty acids (FFA) arising due to dysfunctional/insulin resistant (IR) adipose tissue causing ectopic fat deposition in liver is closely the NAFLD development [2]. In NAFLD and IR, both of excess lipid droplets and insulin signaling play an important role in adipose tissue dysfunction [3]. The alterations in lipid metabolism are key to the development of NAFLD and its progression. In addition, the condition of high free fatty acids, oxidation stress, inflammatory response, oxidation stress, mitochondrial dysfunction, and macrophage polarization are observed in NAFLD [4].

Hepatic lipotoxicity, due to massive FFAs flux and lipogenesis, has been associated to NAFLD severity and comprises the processes of oxidative stress, autophagy, and inflammation processes [5]. In the liver, induction of CD36 translocation to the plasma membrane of the hepatocyte increases FFA uptake may be a determining factor in NAFLD patients with steatosis [5]. In keeping with these findings, attenuate mitochondrial oxidative stress and thereby protection against lipid-driven hepatotoxicity, therefore mechanisms and treatment strategies by modulating the patho-physiological feature of lipophagy is perhaps to halt NAFLD.

Hepatocytes accumulate excessive FFA due to increased availability of FFA beyond their capacity for oxidation or export by lipoprotein particles in NAFLD [6]. Fatty acids flux was increased in hepatocytes results in enhanced fatty acid import and oxidation of mitochondria in NAFLD. As oxidative stress signaling promotes nuclear factor-κB (NF-κB) and nucleotide-binding oligomerization domain-like receptor, pyrin domain-containing 3 (NLRP3) inflammasomes, it stimulates the production of inflammatory cytokines, such as TNF-α, IL-6 and IL-β1 [7]. In addition, HIF-1α is involved in lipid metabolism through increased lipid droplets accumulation [8], fatty acid and lipid synthesis [8, 9, 10], and fatty acid uptake [10]. Mesarwi and his colleagues have illustrated that HIF-1 signaling worsens the metabolic profile and hastens NAFLD progression and that insulin resistance (IR) may worsen liver fibrosis and the potential effects are plausibly mediated by hepatic inflammatory stress [11].

An interesting mechanism of hepatocyte sensitivity to hypoxic stress and mitochondrial dysfunction is the association NAFLD pathogenesis. In the liver and white adipose tissue (WAT), mitochondria is an energy metabolism center, which is maintained via combination ofmitochondrial respiratory chain (MRC) activity and fatty acid beta-oxidation [12, 13]. The clearance of damaged mitochondria is the responsible of mitophagy that is promote mitochondrial turnover [14, 15]. Mitophagy deregulation is also implicated in fatty liver disease, hepatic fibrosis, and liver cancer [16]. On the other hand, the WAT expansion is associated with body fat accrual leading to obesity. Fat is often noted for its energy-storing function, as in WAT; however, brown and beige adipocytes play a crucial role in whole-body energy homeostasis through futile catabolism of circulating fatty acids [17]. The uncoupling protein (UCP) is especially expressed in brown and beige fat, where it regulates thermogenesis by enabling mitochondria to acquire and oxidize a variety of extracellular metabolites that are associated with a variety of metabolic dysfunctions. Nevertheless, emerging evidence that the factors of biochemical and functional characteristics of thermogenic genes are including Ucp1, Cidea, Pgc1a, Cox7a, Prdm16, Cited1, Cd137, Tmem26 in beige adipocytes [18].

Ger-Gen-Chyn-Lian-Tang (GGCLT) is a standardized traditional Chinese herbal medicine, which is composed of Puerariae radix, Scutellariae radix, Coptidis rhizome, and Glycyrrhizae radix. GGCLT attenuated atherosclerosis in an apolipoprotein E-/- mouse model [19]. Meantime, GGCLT has hepatoprotective effects in thioacetamide-induced liver injury [20] and cholestatic liver fibrosis [21]. This study presents a protective role of GGCLT to the core lipids accumulation involved in NAFLD and illustrates their association with IR, mitochondria dysfunction, mitophagy and inflammatory response for its protection.

2. Materials and Methods
2.1 GGCLT Prepared

GGCLT has the following four botanical components, the following herbs were produced in an 8:3:3:2 weight ratio: (i) Puerariae Radix (roots of Pueraria lobata, Ge Gen, 480 g); (ii) Scutellariae Radix (roots of Scullellaria baicalensis, Huang Qin, 180 g); (iii) Coptidis Rhizoma (rhizomes of Coptis chinensis, Huang Lian, 180 g), and (iv) Glycyrrhizae Radix (roots of Glycyrrhiza uralensis, Gan Cao, 120 g). The 960 g of the herbal components were steeped in 5 liters of dH2O at 80 °C for 2 hours to create the dH2O extracts. Filtered and lyophilized (VirTis Freezemobile, Gardiner, NY, USA) extracts were produced with an estimated yield of 12.5% (120 g). These substances were freeze-dried, and store at –20 °C. Before being used in the in vivo tests, the GGCLT extract was dissolved in dH2O.

2.2 High-Performance Liquid Chromatography (HPLC)

The six main index components of the GGCLT decoction were recognized by HPLC. A Waters HPLC System (Waters Corporation, Milford, Massachusetts, United States) with a 600 quaternary pump, a Sugai U-620 column temperature controller, a 717 plus autosampler, and a 996 photodiode array detector was used to perform the HPLC-UV study. Puerarin, baicalin, berberine, baicalein, glycyrrhizic acid, and wogonin in analytical-grade pure powder forms were used as standards for the HPLC assay. Puerarin, baicalin, baicalein, glycyrrhizic acid, and wogonin were purchased from Merck (Rahway, NJ, USA). Bererine was purchased from Selleckchem (Burlington, MA, USA). The analytical conditions were set as follows: gradient elution by the mixture of mobile phases A (mixture of 20 mM potassium dihydrogen phosphate and 0.0085% phosphoric acid), B (acetonitrile) and C (water) at 0–30 min with a ratio of 90–75% A and 10–25% B; 30–40 min with a ratio of 75–65% A and 25–35% B; 40–55 min with a ratio of 65–0% A, 35–75% B and 0–25% C; 55–60 min with a ratio of 75–10% B and 25–90% C; 60–65 min with a ratio of 0–90% A, 90–10% B and 90–0% C. The flow rate was kept constant at 1.0 mL/min. The column temperature was controlled at 35 °C, the post time was 15 min and the injection volume was 5 μL. Approximately 0.5 g of GGCLT (lyophilized) was weighed and put into 20 mL of 70% methanol solution as extractive solvent, ultrasonically vibrated for 15 min at room temperature, vibrated at 160 rpm for 20 min in a 40 °C water bath, centrifuged at 3000 rpm for 10 min, and the supernatant liquid was injected in HPLC-UV for quantitative analysis. The 200–400 nm UV wavelength was chosen for complete detection. As a guard column, a Lichrospher RP-18 end-capped column (particle size, 5 m; column size, 4.0 mm internal diameter × 10 mm; Merck KGaA, Rahway, NJ, USA) was employed. The analytical column was a Cosmosil 5C18MSII column (particle size, 4.6 mm internal diameter) × 250 mm. Puerarin, baicalin, baicalein, wogonin, berberine, and glycyrrhizic acid are represented by Puerariae Radix, Scutellariae Radix, Coptidis Rhizoma, and Glycyrrhizae Radix, respectively (Fig. 1).

Fig. 1.

Ger-Gen-Chyn-Lian-Tang (GGCLT) chromatogram determined by HPLC-UV. The panel shows the fingerprint of the HPLC fingerprint (detection wavelength 250 nm) (A) and three-dimensional structures of these six main index components (B). Structures of the compounds identified by HPLC-UV (C). Puerarin, baicalin, berberine, baicalein, glycyrrhizic acid, and wogonin, the six main index components of GGCLT.

2.3 Identification of the Active Compounds of GGCLT and Screening the Targets of Fatty Liver

The Traditional Chinese Medicine Integrative Database (TCMID) were used to screen the active compounds of GGCLT for herbal molecular mechanism analysis. Besides, literature analysis was performed to supplement the potential active ingredients and their pharmacological interactions. The fatty liver related genes were screened by Public Health Genomics and Precision Health Knowledge Base (v7.7). The intersection genes between targets of the active compounds of GGCLT and fatty liver related genes were overlapped by Venny 2.1.0.

2.4 Construction of the PPI Network Analysis

The protein-protein interaction (PPI) network was constructed by Cytoscape 3.9.1 (Institute of Systems Biology, Seattle, Washington, USA). Network Analyzer was used for network diagrams. Construction of PPI network and screening of core targets fatty liver-related target proteins were analyzed by online STRING11.5 database to construct the PPI network. Protein type was set as “Homo sapiens” with the minimum interaction threshold of 0.4.

2.5 Gene Ontology (GO) and Kyoto Encyclopedia of Genes and Genomes (KEGG) Pathway Analysis

The Traditional Chinese Medicine Integrative Database (TCMID, Bioinformatics & Drug Design group in Department of Pharmacy National University, Singapore) was used to screen the GO function and KEGG pathway analysis that were performed to determine the function of candidate genes in the drug-compound-disease-target gene network. GO term, including biological process (BP), molecular functions (MF), cellular components (CC) and KEGG pathway with p < 0.05 were considered as statistically significant.

2.6 Animal Experiments

The National Laboratory Animal Center (Taiwan) provided the C57BL/6J and BKS.Cg-m +/+ Leprdb/JNarl (db/db) mice utilized in this investigation. The animal experiments were performed in accordance with the Chang Gung University Institutional Animal Care and Use Committee (CGU107-265). The mice were then matched into 4 groups (n = 5/group). (1) normal mice, (2) db/db mice; (3) db/db mice + GGCLT 50 mg/kg (oral, daily for 28 consecutive days); (4) db/db mice + GGCLT 150 mg/kg (oral, daily for 28 consecutive days). The raw components of Puerariae Radix (Pueraria lobata roots, Ge Gen), Scutellariae Radix (Scullellaria baicalensis roots, Huang Qin), Coptidis Rhizoma (Coptis chinensis rhizomes, Huang Lian), and Glycyrrhizae Radix (Glycyrrhiza uralensis roots, Gan Cao) were combined to create the powdere [20, 21]. The dried compound was subsequently dissolved in dH2O before use. After 28 days, animals were terminated by gradual fill isoflurane asphyxiation.

2.7 Glucose Tolerance Test (GTT)

After a 6-hour fasting, a glucose load (1 g/kg of body weight) was administered by gavage or by intraperitoneal (i.p.) injection. Blood samples were collected from the tail at 0 (baseline), 15, 30, 60, 90 and 120 minutes after the glucose loads. Blood glucose levels were measured with a Blood Glucose Monitoring System (OneTouch® Ultra, Lifescan, Johnson & Johnson, USA). AUCs of glucose levels calculated according to Trapezoid rules with those from GTT.

2.8 Insulin Tolerance Test (ITT)

After a 6-hour fasting, an insulin load (0.75 U/kg of body weight; Lilly, USA) was administered by gavage or by intraperitoneal (i.p.) injection. Blood samples were collected from the tail at 0 (baseline), 15, 30, 60, 90 and 120 minutes after the insulin loads. AUCs of glucose levels calculated according to Trapezoid rules with those from ITT. Plasma insulin levels were determined by ELISA kit.

2.9 HOMA-IR

The levels of fasting insulin and fasting glucose are used to compute the homeostatic model assessment of insulin resistance (HOMA-IR). Scores were calculated with the following equation: [fasting glucose (mmol/L) × fasting insulin (mIU/mL)] / 22.5 [22].

2.10 Plasma AST and ALT Analysis

Prior to biochemical examination, plasma was collected by centrifugation and kept at –20 °C. The Randox ATL and AST test was used to assess the plasma concentrations of alanine aminotransferase (ALT) and aspartate aminotransferase (AST) (Randox, Kearneysville, WV, USA).

2.11 Plasma TG and FFA Analysis

Using the Randox triglycerides test and the NEFA Assay, the concentrations of plasma triglycerides (TG) and free fatty acids (FFA) were both directly assessed (Randox, Kearneysville, WV, USA).

2.12 Histological and Immunohistochemistry Evaluation

Liver and EWAT were embedded in paraffin after being fixed overnight in 10% Neutral buffered formalin. Then, xylene was used to deparaffinize portions that were five micrometers thick, and a graded ethanol series was used to dehydrate them. Hematoxylin (2 g/L) was used to stain the tissue slices for 15 minutes, and eosin (0.1 percent in 0.0003 percent acetic acid) was used for 10 minutes at room temperature. Masson stain used by Trichrome Stain (Masson) Kit (abcam, Cambridge, USA). For immunohistochemistry, endogenous peroxidase activity was quenched with 3% H2O2 in water for 10 min. Non-specific staining was minimized with 5% normal goat serum for 50 min. Next, sections were subject to antigen retrieval, as needed, and incubated with primary and second antibodies for 2 hours at room temperature. The antibodies used in this study are shown in Table 1. Images were obtained using Olympus IX71 microscope.

Table 1.Antibodies used for immunohistochemistry and western blot analysis.
Antibodies Identifier Source Dilution
β-actin MAB1501 Millipore, Burlington, MA, USA WB 1:1000
CCR7 ab32527 abcam, Cambridge, UK IHC 1:100; WB 1:500
CD11b ab133357 abcam, Cambridge, UK IHC 1:100; WB 1:500
CD11c ab52632, ab11029 abcam, Cambridge, UK IHC 1:100; WB 1:500
CD163 ab182422 abcam, Cambridge, UK IHC 1:100; WB 1:500
CD206 ab64693 abcam, Cambridge, UK IHC 1:100; WB 1:500
CD36 SC-70644 Santa Cruz Biotechnology, TX, USA IHC 1:100; WB 1:500
DRP1 sc-271583 Santa Cruz Biotechnology, TX, USA WB 1:500
DRP1 (Tyr504) PA5-105983 Thermo Fisher Scientific, MA, USA IHC 1:100; WB 1:500
F4/80 CI:A3-1 Thermo Fisher Scientific, MA, USA IHC 1:100; WB 1:500
HIF1 ab179483 abcam, Cambridge, UK IHC 1:100; WB 1:500
Histone SC-56616 Santa Cruz Biotechnology, TX, USA WB 1:500
LC3B GTX127375 GeneTex, CA, USA IHC 1:100; WB 1:500
MCP-1 ab7202 abcam, Cambridge, UK IHC 1:100; WB 1:500
Mitofusin 1 ab126575 abcam, Cambridge, UK IHC 1:100; WB 1:500
MMP9 AB19016 Millipore, Burlington, MA, USA IHC 1:100; WB 1:500
Parkin GTX39745 GeneTex, CA, USA IHC 1:100; WB 1:500
PGC1α ab54481 abcam, Cambridge, UK IHC 1:100; WB 1:500
SIRT1 ab110304 abcam, Cambridge, UK IHC 1:100; WB 1:500
SQSTM/p62 GTX100685 GeneTex, CA, USA WB 1:500
SQSTM/p62 (Ser403) GTX128171 GeneTex, CA, USA IHC 1:100; WB 1:500
SREBP-1 SC-366 Santa Cruz Biotechnology, TX, USA IHC 1:100; WB 1:500
Tmem26 PA5-23477 Thermo Fisher Scientific, Waltham, MA, USA IHC 1:100; WB 1:500
UCP1 ab10983 abcam, Cambridge, UK IHC 1:100; WB 1:500
VEGF ab69479 abcam, Cambridge, UK IHC 1:100; WB 1:500
Goat anti-mouse IgG Ap124P MilliporeSigma, USA WB 1:5000
Goat anti-rabbit IgG 111-065-003 Jackson ImmunoResearch Laboratories, PA, USA WB 1:5000
Goat anti-rat IgG 112-065-003 Jackson ImmunoResearch Laboratories, PA, USA WB 1:5000
2.13 Protein Isolation and Western Blot Analysis

Tissues were homogenized in T-PER™ Tissue Protein Extraction Reagent (0.30 mg tissue/200 μL; Thermo Fisher Scientific, MA, USA), NE-PER nuclear and Cytoplasmic Extraction Reagents (Thermo Fisher Scientific, MA, USA), or Mitochondria Isolation Kit (Thermo Fisher Scientific, MA, USA) containing proteinase inhibitors (1 μL/mL; Sigma-Aldrich; Merck KGaA, Rahway, NJ, USA). The proteinase inhibitors inhibit serine, cysteine, and acid proteases and aminopeptidases. The soluble proteins were quantified with the Bio-Rad Rapid Coomassie kit (Bio-Rad Laboratories, Hercules, California, USA), and then protein (60–80 μg/lane) was run on a 10% SDS-PAGE gel and subsequently transferred to a PVDF membrane (GE Healthcare, Chicago, Illinois, USA). Blocking was performed using Pierce™ Fast Blocking Buffer (Thermo Fisher Scientific, MA,USA), 1X TBS with 0.1% Tween-20 at room temperature for 1 h. For immunoblotting, membranes were incubated with diluted primary antibody in Pierce™ Fast Blocking Buffer at 4 °C with gentle shaking overnight. Following primary incubation, the secondary antibody was incubated at room temperature for 1 hour with gentle shaking in PierceTM Fast Blocking Buffer. The protein expression was detected using an enhanced chemiluminescence kit and quantified using ImageJ 1.53 software (National Institutes of Health, Maryland, USA). The primary and secondary antibodies used in this study are shown in Table 1. Restore™ PLUS Western Blot Stripping Buffer (Thermo Fisher Scientific, MA, USA) was used for detection of proteins with comparable MW to β-actin protein (i.e., CCR7, p-p62, and p62). After washing the blot to remove the chemiluminescent substrate, incubate it in Restore Western Blot Stripping Buffer for 5 to 15 minutes at room temperature (or at 37 °C for high affinity antibodies).

2.14 RNA Isolation and Quantitative Real-Time PCR

Total RNA was extracted from 0.2 g liver and EWAT tissues using 1 mL of TRIzol (Thermo Fisher Scientific, MA, USA). The cDNA was reverse transcribed from RNA using a High-Capacity cDNA Reverse Transcription Kit (Thermo Fisher Scientific, MA,USA) according to the manufacturer’s instructions. The cDNA samples were amplified by qRT-PCR using SYBR Green I (Roche, Switzerland). For qPCR, the following thermocycling conditions were applied: Initial denaturation at 95 °C for 5 min, followed by 35 cycles of denaturation at 94 °C for 30 sec, annealing at 55 °C for 30 sec, and elongation at 72 °C for 0.5 min, before holding at 4 °C. By utilizing the 2-ΔΔCt approach to normalize each Ct result to either gene expression, relative mRNA expression levels were calculated. Table 2 (Ref. [3, 23, 24, 25, 26, 27, 28, 29, 30, 31, 32, 33, 34, 35, 36, 37, 38]) displays the primer sequences applied in this research.

Table 2.Oligonucleotide sequences for qRT-PCR.
Gene Forward (5′→3′) Reverse (5′→3′) Accession No. Reference
Srebp1 actgtcttggttgttgatgagctggagcat atcggcgcggaagctgtcggggtagcgtc NM_011480 [23]
Fas tgtcattggcctcctcaaaaagggcgtcca tcaccactgtgggctctgcagagaagcgag NM_007988.3 [23]
Scd1 ccggagaccccttagatcga tagcctgtaaaagatttctgcaaacc NM_009127.4 [23]
Acc1 cccgccagcttaaggaca tggatgggatgtgggca NM_133360.3 [24]
Cd36 gcaaaacgactgcaggtcaac tggtcccagtctcatttagcca NM_001159558.1 [23]
Fatp gcttcaacagccgtatcctc tcttcttgttggtggcactg NM_011977.4 [23]
Cpt-1 ggacagagactgtgcgttcct gcgatatccaacagtgcttga NM_013495.2 [23]
Cpt-2 caactcgtatacccaaacccagtc gttcccatcttgatcgaggacatc NM_009949.2 [25]
Tnfα ttgacctcagcgctgagttg cctgtagcccacgtcgtagc NM_013693 [23]
Ifnγ cctcaaacttggcaatactc agcaacaacataagcgtcat NM_008337.4 [23]
Mcp1 aggtccctgtcatgcttctg tctggacccattccttcttg NM_011333.3 [23]
Il-1β aacctgctggtgtgtgacgttc cagcacgaggcttttttgttgt NM_008361.4 [3]
Nlrp3 agccttccaggatcctcttc cttgggcagcagtttctttc NM_145827.4 [26]
Aim2 ataggaggaacaacaacat gccatcttctgctacata NM_001013779.2 [27]
Asc gaagctgctgacagtgcaac tgtgagctccaagccatacg NM_023258.4 [28]
Caspase1 agatggcacatttccaggac gatcctccagcagcaacttc NM_009807.2 [26]
Sirt1 gcaacagcatcttgcctgat gtgctactggtctcactt NM_019812.3 [29]
Pgc1α gactcagtgtcaccaccgaaa tgaacgagagcgcatcctt NM_008904.2 [23]
Ucp1 cctgcctctctcggaaacaa tgtaggctgcccaatgaaca NM_009463.3 [23]
20kDa/Complex I ccagctgcgcagagttcatc gagagagcttggggaccacg NM_029272.4 [30]
Ip/Complex II tctaccgctgccacaccatc aagccaatgctcgcttctcc NM_023374.4 [30]
Core II/Complex III ccattggaaatgcagaggca ggctggtgacttcctttggc NM_025899.2 [30]
Cox2/Complex IV tcaaaagaagtgctggaaaaggtt tctacctgagtgtctttgactgtg NM_011198.4 [31]
F1α/Complex V atctatgcgggtgtacgggg agggactggtgctggctgat NM_007505.2 [30]
Pink gagcagactcccagttctcg gtcccactccacaaggatgt NM_026880.2 [32]
Ndp52 aaggactggattggcatcttta aggtcagcgtacttgtctttc NM_001271018.1 [33]
Ambra1 gggatgttgtgcctttgca cctggtgtgggaagagagaaga NM_172669.3 [34]
Phb2 cttggttccagtaccccattatc cgagacaacactcgcaggg NM_007531.2 [35]
Bnip3 cagcatgaatctggacgaag atcttcctcagacagagtgc NM_009760.4 [35]
Nix gagccggatactgtcgtcct caatatagatgccgagcccca NM_009761.3 [36]
Fundc1 tgtgatatccagcggcttcg gccggctgttccttactttg NM_028058.4 [37]
Bcl2 aaaccctgtgctgctatc ctgtgttcttcatcgttacttc NM_009741.5 [37]
Tfam ggaatgtggagcgtgctaaaa tgctggaaaaacacttcggaata NM_009360.4 [3]
Cd137 cgtgcagaactcctgtgataac gtccacctatgctggagaagg NM_011612.2 [3]
Tmem26 accctgtcatcccacagag tgtttggtggagtcctaaggtc NM_177794.3 [3]
Prdm16 cagcacggtgaagccattc gcgtgcatccgcttgtg NM_001291029.1 [3]
Cox7a1 cagcgtcatggtcagtctgt agaaaaccgtgtggcagaga NM_009944.3 [3]
Cox8b gaaccatgaagccaacgact gcgaagttcacagtggttcc NM_007751.3 [3]
Zic1 ctgttgtgggagacacgatg cctcttctcagggctcacag NM_009573.4 [3]
Lxh8 acacgagctgctacattaagga cccagtcagtcgagtggatg NM_010713.2 [3]
Gadph ccaatgtgtccgtcgtggatct gttgaagtcgcaggagacaacc NM_001289726.1 [38]
2.15 Mitochondrial Enzyme Activity

Crude mitochondrial fraction was extracted from liver and EWAT using Mitochondria Isolation Kit (Thermo Fisher Scientific, MA, USA) for Tissue followed by manufacturer’s instructions. With the assistance of the Bio-Rad Rapid Coomassie kit, the proteins were measured. For measurement of mitochondrial Complex I, III, and IV activity in liver and EWAT, using Mitochondrial Complex activity Assay Kit, respectively. For measurement of Citrate synthase activity and MDA using Colorimetric Assay kit followed by manufacturer’s instructions.

2.16 Analysis of Biochemical Parameters

Examinations of serum TNF alpha, MCP-1 and IL-1β were performed using mouse uncoated ELISA Kit mouse uncoated ELISA kit (Thermo Fisher Scientific, MA, USA).

2.17 Statistical Analysis

All data are expressed as means ± SEM. Statistical analysis was performed with SPSS 21.0 software ((International Business Machines Corporation, Armonk, NY, USA). The experiments were repeated for three times. All data were analyzed using a one-way ANOVA followed by a Bonferroni’s post hoc test. p values less than 0.05 was considered to indicate a statistically significant difference.

3. Results
3.1 The Composition of GGCLT

A typical GGCLT HPLC-UV chromatography fingerprint profile was obtained and six major constituents were identified (Fig. 1). The well-separated peaks with retention times of 65 min and perentage of compound in GGCLT (lyophilizate, %) were identified as follows: (1) Puerarin (15.07 min, 28.90%); (2) Baicalin (33.55 min, 11.67%); (3) Berberine (40.15 min, 7.77); (4) Baicalein (49.81 min, 0.54%); (5) Glycyrrhizic acid (50.42 min, 1.22); (6) Wogonin (54.35 min, 0.28%) (Table 3). Puerarin is the bioactive ingredient of Puerariae Radix; baicalin, baicalein, wogonin are the bioactive ingredient of Scutellariae Radix; berberine is the bioactive ingredient of Coptidis Rhizoma; and glycyrrhizic acid is the bioactive ingredient of Glycyrrhizae Radix. Based on the results, Puerarin was found to be the most abundant compound of GGCLT (lyophilizate), followed by baicalin, berberine, glycyrrhizic acid, baicalein, and wogonin. In addition, the 3D-HPLC fingerprint and the structure of compounds are shown (Fig. 1).

Table 3.Percentage of puerarin, baicalin, berberine, baicalein, glycyrrhizic acid, and wogonin.
No. Compound Retention time (min) Percentage of compound in GGCLT (lyophilizate, %) Weight of compound in GGCLT (lyophilizate, mg/g)
1 Puerarin 15.07 28.90 289.0
2 Baicalin 33.55 11.67 116.7
3 Berberine 40.15 7.77 77.7
4 Baicalein 49.81 0.54 5.4
5 Glycyrrhizic acid 50.42 1.22 12.2
6 Wogonin 54.35 0.28 2.8
3.2 GGCLT Target Prediction and Construction of the PPI Network

A total of 26 genes overlapped between 512 target genes of the active compounds of GGCLT and 163 fatty liver related genes (Fig. 2A). Then, a PPI network was constructed based on 26 overlapped genes between target proteins and fatty liver relate genes (Fig. 2B). We found the network contained 26 nodes with interaction score >0.4, which represented the overlapped genes between target proteins of the active compounds of GGCLT and fatty liver related genes and their interaction relationship (Fig. 2C). In GO function and KEGG pathway enrichment analysis, we found that the top-regulated overlapped genes mainly enrich in response to regulation of lipid metabolism, such as long-chain fatty acid metabolic process, lipid metabolic process, and fatty acid metabolic process (Fig. 2C). KEGG pathway mainly enriched in such as insulin resistance, steroid hormone biosynthesis, Metabolic pathways, and adipocytokine signaling pathway (Fig. 2D).

Fig. 2.

GGCLT target prediction, creation of the PPI network, and analysis of enriched GO and KEGG pathways. Venn plot of the overlapped genes between targets of the active compounds of GGCLT and fatty liver related genes (A). The hub genes in the protein-protein interaction (PPI) network (B). PPI network of the 26 overlapped genes between target proteins of the active compounds of GGCLT and fatty liver related genes. Data show the top 5 remarkably enriched items in the cell component (CC), biological process (BP), molecular function (MF) (C). Data show the top 22 remarkably enriched items in the KEGG pathways (D).

3.3 GGCLT Prevents Insulin Resistance and Attenuated Hepatic Lipogenesis

When compared to normal mice, db/db animals had a higher body weight and liver weight/body weight ratio (Fig. 3A,B). GGCLT 150 mg/kg dramatically lowered body weight and the liver/body weight ratio in db/db mice (Fig. 3A,B). In addition, plasma ALT and AST were significantly decreased in db/db mice treated GGCLT compared with db/db mice (Fig. 3C,D). After 28 days GGCLT treatment, the glucose and GTT/ITT, fasting glucose, fasting insulin, and HOMA-IR were decreased compared with db/db mice (Fig. 3E–K), suggesting that GGCLT improved whole-body insulin sensitivity. GGCLT significant reduced plasma TG and FFA level compared with db/db mice (Fig. 3J,K), as well as reduced liver steatosis and fibrosis (Fig. 3L). As shown in Fig. 3L–O, the SREBP-1c and downstream target genes, Fas, Scd1 and Acc1 mRNA expression were significantly increased as well as fatty acid transporters (Cd36, Fatp, Cpt1 and Cpt2) were significantly increased in the liver of db/db mice (Fig. 3L–O). Moreover, GGCLT significantly reduced hepatic lipogenesis therefore decreased fatty acid uptake in NAFLD model.

Fig. 3.

GGCLT prevents NAFLD development in db/db mice. Body weight (g) (A). Liver weight/ body weight (%) (B). Plasma ALT (U/L) (C). Plasma AST (U/L) (D). Glucose tolerance test (E). Insulin tolerance test (F). Fasting glucose (mmol/L) (G). Fasting insulin (mIU/mL) (H). HOMA-IR (I). Plasma TG (mg/dL) (J). Plasma FFA (mmol/L) (K). Representative HE, Masson, SREBP-1c and CD36 staining of liver (L). Red arrow highlights the positive staining. Scale bar: 50 μm. Quantification of SREBP-1c and CD36 protein levels by Western blot of liver (M). Right graphs indicate quantification relative to Histone or β-actin. Quantification of Srebp-1, Fas, Scd1, Acc1, Cd36, Fatp, Cpt1 and Cpt2 by qRT-PCR (N,O). qRT-PCR indicates quantification relative to Gapdh. For each animal group, n = 5. All values represent the mean ± SEM. *p < 0.05; normal vs. db/db. #p < 0.05; db/db vs. db/db + GGCLT 50 mg/kg. ##p < 0.05; db/db vs. db/db + GGCLT 150 mg/kg.

3.4 GGCLT Altered Inflammation and Reduced Hepatic Macrophage Polarization in Liver

The serum and hepatic TNF-α, MCP1, and IL-1β content of db/db mice group were significantly higher than those of the normal control group (Fig. 4A,B). Tnfα, interferon gamma (Ifnγ), Mcp1, and IL-1β mRNA expression were significantly increased in liver of db/db mice compared with normal mice (Fig. 4C). The inflammasome factors, NACHT, LRR and PYD domains-containing protein 3 (Nlrp3), absent in melanoma 2 (Aim2), apoptosis-associated speck-like protein containing a caspase recruitment domain (Asc), and Caspase 1 mRNA expression were also higher in db/db mice compared with normal mice. GGCLT significantly decreased the levels of TNF-α, MCP1, and IL-1β in serum and liver tissue as well as reduced pro-inflammation cytokines and NLRP3 inflammasome in db/db mice (Fig. 4A–D). We next confirmed that GGCLT attenuated angiogenesis markers, hypoxia-inducible factor 1α (HIF1α), vascular endothelial growth factor (VEGF), matrix metallopeptidase 9 (MMP9), and monocyte Chemoattractant Protein-1 (MCP-1) protein levels were increased in db/db mice, and GGCLT treatment significantly decreased angiogenesis markers (Fig. 4E,F).

Fig. 4.

GGCLT reduced hepatic inflammation and M1 polarization in db/db mice. Serum concentration of TNFα, MCP1, and Il-1β (A). Liver concentration of TNFα, MCP1, and Il-1β (B). Quantification of Tnfα, Ifnγ, Mcp1, Il-1β, Nlrp3, Aim2, Asc and Caspase1 by qRT-PCR. qRT-PCR indicates quantification relative to Gapdh (C,D). Representative HIF1α, VEGF, MMP9 and MCP-1 staining of liver (E). Red arrow highlights the positive staining. Scale bar: 50 μm. Quantification of HIF1α, VEGF and MCP1 protein levels by Western blot of liver. Right graphs indicate quantification relative to Histone or β-actin (F). Representative F4/80, CD11b, CD11c, CCR7 and CD163 staining of liver (G). Red arrow highlights the positive staining. Scale bar: 50 μm. Quantification of CD11b, CD11c, CCR7 and CD163 protein levels by Western blot of liver (H). Right graphs indicate quantification relative to β-actin. Ratio of CD11c/CD206 and CCR7/CD163 in liver. For each animal group, n = 5. All values represent the mean ± SEM. *p < 0.05; normal vs. db/db. #p < 0.05; db/db vs. db/db + GGCLT 50 mg/kg. ##p < 0.05; db/db vs. db/db + GGCLT 150 mg/kg.

F4/80-positive macrophage infiltration in the db/db mce was considerably enhanced in the liver, which corresponded to the level of serum inflammatory cytokine expression. Macrophage infiltration in the group administered GGCLT 150 mg/kg was significantly lower than that in the db/db mice (Fig. 4G,H). Next, we examined whether macrophagy polarization is involved in NAFLD in db/db mice by assesing M1/M2 marker expression. Immunohistochemistry analysis showed a significant reduction in F4/80, CD11b, CD11c, CCR7 and increase in CD163, CD206 protein level in db/db mice treated with GGCLT 150 mg/kg compared to db/db mice (Fig. 4G,H).

3.5 GGCLT Improved Hepatic Mitochondrial Biogenesis

The SIRT1, PGC1α, and UCP1 protein levels and mRNA expression in liver of db/db mice were significantly lower than normal mice, but GGCLT 150 mg/kg treatment improved the reduced markers in db/db mice (Fig. 5A–C). Also, the mitochondrial complex I (20kDa), II (Ip), III (Core II), IV (Cox2), and V (F1α) in liver were determined. GGCLT enhanced the mitochondrial complexes mRNA expression compared to db/db mice (Fig. 5D) and decreased enzymes activity including NADH: coenzyme Q oxidoreductase (mitochondrial complex I), coenzyme Q-cytochrome c reductase (mitochondrial complex III), cytochrome c oxidase (mitochondrial complex IV) and, citrate synthase were observed in liver of db/db mice compared with normal mice as shown in Fig. 5E–H. Malondialdehyde (MDA) levels were found to be much higher in db/db mice compared to normal mice, and high dosage GGCLT significantly decreased MDA levels in db/db mice (Fig. 5I).

Fig. 5.

GGCLT improved hepatic mitochondrial biogenesis in db/db mice. Representative SIRT1, PGC1α, and UCP1 staining of liver (A). Red arrow highlights the positive staining. Scale bar: 50 μm. Quantification of SIRT1, PGC1α, and UCP1 protein levels by Western blot of liver (B). Right graphs indicate quantification relative to Histone or β-actin. Quantification of Sirt1, Pgc1α, Ucp1, 20kDa/Complex I, Ip/Complex II, Core II/Complex III, Cox2/Complex IV and F1α/Complex V by qRT-PCR (C,D). qRT-PCR indicates quantification relative to Gapdh. Mitochondrial complex I, III, and IV activity (percent of control) (E-G). Mitochondrial citrate synthase activity (H). Malondialdehyde (MDA) levels in liver (nM/mg protein) (I). For each animal group, n = 5. All values represent the mean ± SEM. *p < 0.05; normal vs. db/db. #p < 0.05; db/db vs. db/db + GGCLT 50 mg/kg. ##p < 0.05; db/db vs. db/db + GGCLT 150 mg/kg.

3.6 GGCLT Enhanced Hepatic Mitophagy

Compared to normal mice, the protein expression levels of Parkin, LC3B, phospho (p)-p62, and mitofusin-1 (MNF1) in the liver of db/db mice were decreased but phospho-dynamin-related protein (p-Drp1) expression was increased (Fig. 6A,B). The GGCLT administration for 28 days, the opposite expression patterns were observed (Fig. 6A,B). Moreover, GGCLT effectively enhanced the expression of Parkin-dependent/independent mitophagy pathway, including Pink, calcium binding and coiled-coil domain 2 (Ndp52/Calcoco2), prohibitin 2 (Phb2), autophagy and beclin 1 regulator 1 (Ambra1), B-cell lymphoma 2 (Bcl2), BCL2 interacting protein 3 (Bnip3), FUN14 domain containing 1 (Fundc1) compared to db/db mice (Fig. 6C,D).

Fig. 6.

GGCLT enhanced hepatic mitophagy in db/db mice. Representative Parkin, LC3B, p-p62, MNF1, and p-DRP1 staining of liver. Red arrow highlights the positive staining (A). Scale bar: 50 μm. Quantification of Parkin, LC3B, p-p62, p62, MNF1, p-DRP1, and DRP1 protein levels by Western blot of liver (B). Right graphs indicate quantification relative to β-actin. Ration of p-p62/p62 and p-DRP1/DRP1 in live. Quantification of Pink, Ndp52, Ambra1, Phb2, Bnip3, Nix, Fundc1 and Bcl2 by qRT-PCR. qRT-PCR indicates quantification relative to Gapdh (C,D). For each animal group, n = 5. All values represent the mean ± SEM. *p < 0.05; normal vs. db/db. #p < 0.05; db/db vs. db/db + GGCLT 50 mg/kg. ##p < 0.05; db/db vs. db/db + GGCLT 150 mg/kg. MNF1, mitofusin-1; Drp1, dynamin-related protein; Ndp52/Calcoco2, calcium binding and coiled-coil domain 2; Phb2, prohibitin 2; Ambra1, autophagy and beclin 1 regulator 1; Bcl2, B-cell lymphoma 2; Bnip3, BCL2 interacting protein 3; Fundc1, FUN14 domain containing 1.

3.7 GGCLT Attenuated Lipogenesis in EWAT

The shape of EWAT and adipocyte diameter size were large in db/db compared with normal mice (Fig. 7A,B), and GGCLT 150 mg/kg significant reduced EWAT size and adipocyte diameter size. GGCLT resulted in dramatically reduced the SREBP-1c and target genes, Fas, SCD1, Scd1, as well as fatty acid transporters (Cd36, Fatp, Cpt1 and Cpt2) mRNA expression in EWAT of db/db mice (Fig. 7C–F). Moreover, GGCLT significantly reduced hepatic lipogenesis and fatty acid transporters, suggesting that GGCLT regulated lipid homeostasis in db/db mice.

Fig. 7.

GGCLT attenuated lipogenesis in EWAT of db/db mice. Representative pictures of EWAT in mice (A). Adipocyte diameter (μm) (B). Representative HE, Masson, SREBP-1c and CD36 staining of EWAT (C). Red arrow highlights the positive staining. Scale bar: 50 μm. Quantification of SREBP-1c and CD36 protein levels by Western blot of EWAT (D). Right graphs indicate quantification relative to Histone or β-actin. Quantification of Srebp-1, Fas, Scd-1, Acc1, Cd36, Fatp, Cpt-1 and Cpt-2 by qRT-PCR (E,F). qRT-PCR indicates quantification relative to Gapdh. For each animal group, n = 5. All values represent the mean ± SEM. *p < 0.05; normal vs. db/db. #p < 0.05; db/db vs. db/db + GGCLT 50 mg/kg. ##p < 0.05; db/db vs. db/db + GGCLT 150 mg/kg. Srebp-1, sterol regulatory element-binding protein 1; Fas, fatty acid synthase; Scd-1, stearoyl-CoA desaturase-1; Acc1, acetyl-CoA carboxylase; Fatp, fatty acid transport protein; Cd36, cluster of differentiation 36; Cpt1, carnitine palmitoyltransferase 1; EWAT, epididymis white adipose tissue.

3.8 GGCLT Reduced Inflammation and Altered Macrophage Polarization in EWAT

db/db mice had higher Tnfα, Ifnγ, Mcp1, IL-1β, Nlrp3, Aim2, Asc, and Caspase 1 mRNA expression in EWAT, after GGCLT treatment 28 days, the proinflammatory cytokines and NLRP3 inflammasome were significantly reduced compared with db/db mice (Fig. 8A,B). HIF1α, VEGF, MMP9, and MCP1 protein levels were increased in db/db mice, and GGCLT 150 mg/kg treatment significantly decreased angiogenesis markers in EWAT compared to db/db mice (Fig. 8C,D).

Fig. 8.

GGCLT reduced inflammation and M1 polarization in EWAT of db/db mice. Quantification of Tnfα, Ifnγ, Mcp1, Il-1β, Nlrp3, Aim2, Asc and Caspase1 by qRT-PCR (A,B). Representative HIF1α, VEGF, MMP9 and MCP-1 staining of EWAT (C). Red arrow highlights the positive staining. Scale bar: 50 μm. Quantification of HIF1α, VEGF and MCP-1 protein levels by Western blot of EWA (D). Right graphs indicate quantification relative to Histone or β-actin. qRT-PCR indicates quantification relative to Gapdh. Representative F4/80, CD11b, CD11c, CCR7 and CD163 staining of EWAT (E). Red arrow highlights the positive staining. Scale bar: 50 μm. Quantification of CD11b, CD11c, CCR7 and CD163 protein levels by Western blot of EWAT (F). Right graphs indicate quantification relative to β-actin. Ratio of CD11c/CD206 and CCR7/CD163 in EWAT. For each animal group, n = 5. All values represent the mean ± SEM. *p < 0.05; normal vs. db/db. #p < 0.05; db/db vs. db/db + GGCLT 50 mg/kg. ##p < 0.05; db/db vs. db/db + GGCLT 150 mg/kg. EWAT: epididymis white adipose tissue.

The EWAT dramatically boosted F4/80-positive macrophage infiltration in the db/db mce. Macrophage infiltration was considerably lower in the GGCLT group than in the db/db mice (Fig. 8E). Macrophages were increased in EWAT of db/db mice were due to an increase in CD11b, CD11c, and CCR7 compared with normal mice. GGCLT reduced macrophage infiltration (F4/80, CD11b) and M1 macrophage markers (CD11c, CCR7) in EWAT of db/db mice (Fig. 8E,F). On the contrary, GGCLT 150 mg/kg enhanced M2 macrophage markers (CD163, CD206) protein levels in EWAT of db/db mice (Fig. 8E,F).

3.9 GGCLT Enhanced Mitochondrial Biogenesis and Browning in EWAT

Consistent with the histological features, GGCLT enhance mitochondria biogenesis and thermogenesis markers, SIRT1, PGC-1
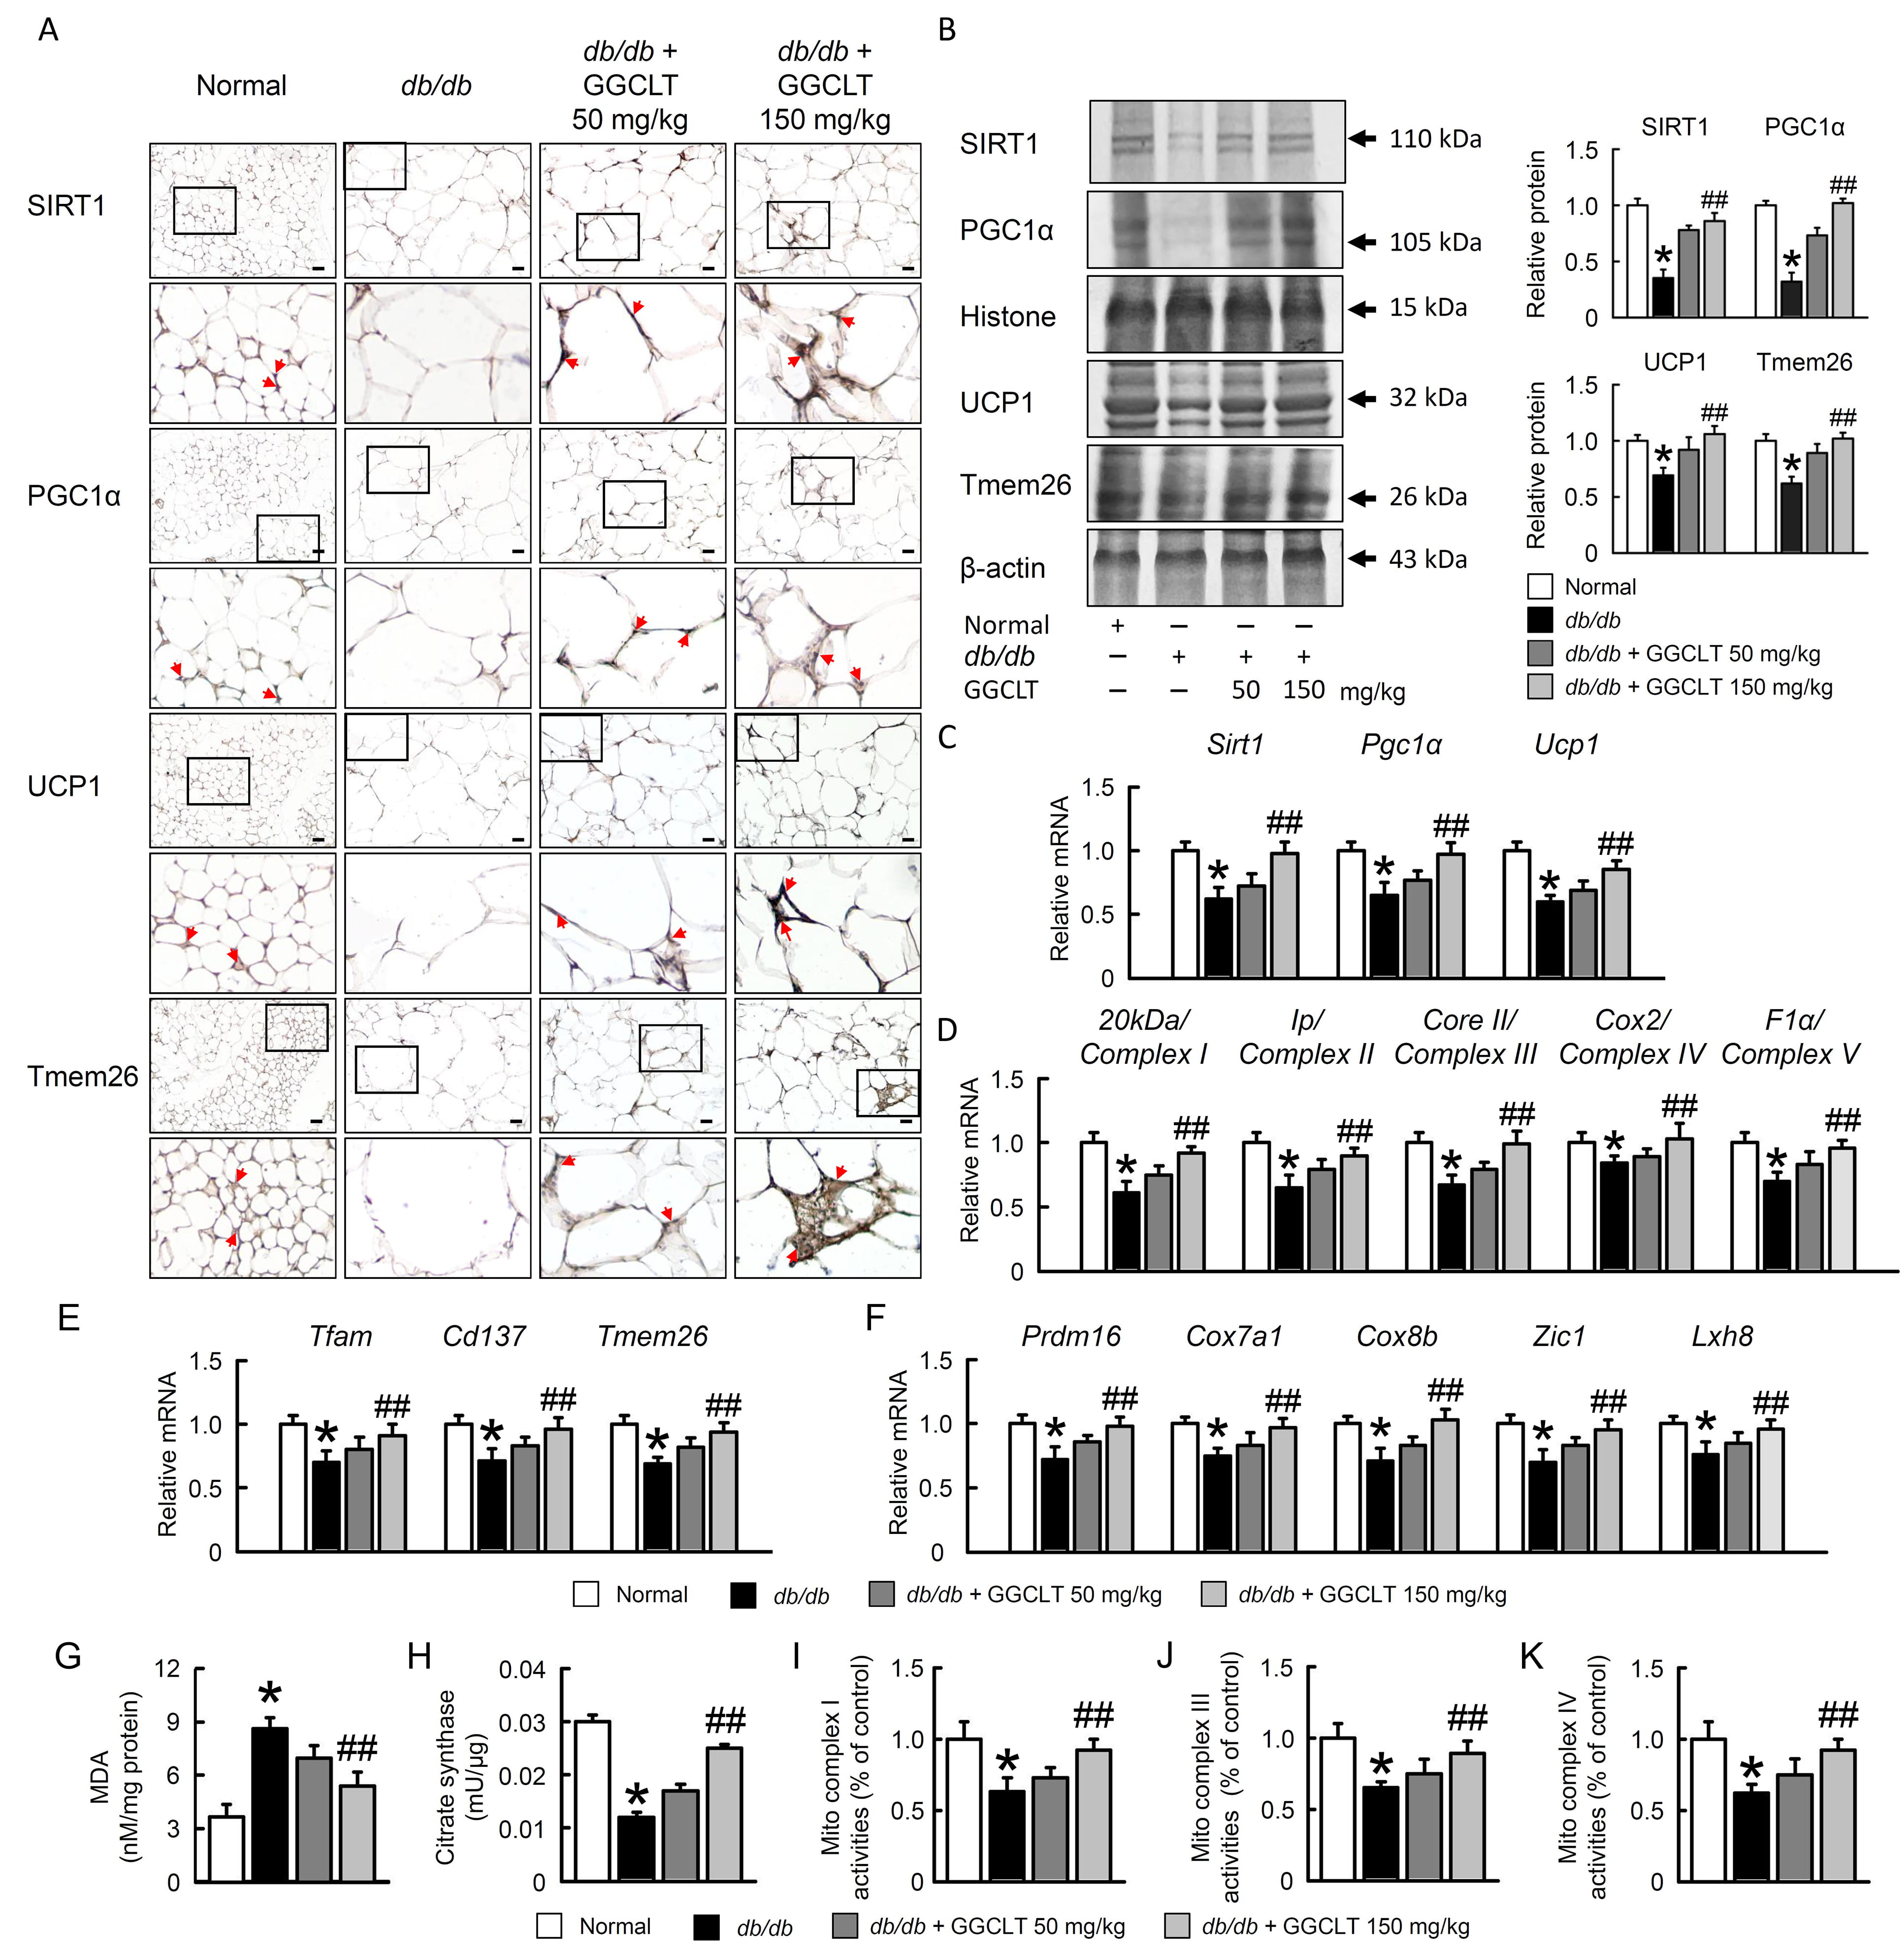
α, UCP1, and transmembrane protein 26 (Tmem26) protein levels in EWAT of db/db mice as compared to db/db mice (Fig. 9A–C). GGCLT 150 mg/kg enhanced the mitochondrial complexes mRNA expression compared to db/db mice (Fig. 9D). Thermogenic genes, mitochondrial transcription factor A (Tfam), Cd137, Tmem26, PR domain containing 16 (Prdm16), cytochrome c oxidase polypeptide 7A1 (Cox7a1), Cox8b, Zinc finger protein 1 (Zic1), and Lxh8 mRNA expression were increased in db/db mice treatment GGCLT (Fig. 9E,F). Decreased enzymes activity including NADH: coenzyme Q oxidoreductase (mitochondrial complex I), coenzyme Q - cytochrome c reductase (mitochondrial complex III), cytochrome c oxidase (mitochondrial complex IV) and, citrate synthase were observed in EWAT of db/db mice compared with normal mice (Fig. 9G–J). MDA levels determined in the EWAT tissue were found to be significantly lower in db/db mice that treat with GGCLT (Fig. 9K).

Fig. 9.

GGCLT improved mitochondrial biogenesis in EWAT of db/db mice. Representative SIRT1, PGC1α, and UCP1 staining of EWAT (A). Red arrow highlights the positive staining. Scale bar: 50 μm. Quantification of SIRT1, PGC1α, and UCP1 protein levels by Western blot of EWAT (B). Right graphs indicate quantification relative to Histone or β-actin. Quantification of Sirt1, Pgc1α, Ucp1, 20kDa/Complex I, Ip/Complex II, Core II/Complex III, Cox2/Complex IV and F1α/Complex V by qRT-PCR (C–F). qRT-PCR indicates quantification relative to Gapdh. Mitochondrial complex I, III, and IV activity (percent of control) (G–I). Mitochondrial citrate synthase activity (J). Malondialdehyde (MDA) levels in EWAT (nM/mg protein) (K). For each animal group, n = 5. All values represent the mean ± SEM. *p < 0.05; normal vs. db/db. #p < 0.05; db/db vs. db/db + GGCLT 50 mg/kg. ##p < 0.05; db/db vs. db/db + GGCLT 150 mg/kg.

4. Discussion

NAFLD remains a health concern due to its noticeable complexities in disease progression and complications. For the management of NAFLD, it is imperative to use the best available treatment. The traditional Chinese herbal formula (i.e., GGCLT) contains several plants, some of which contain more than one phytochemical component, and as a result, several plants work in conjunction symbiotically with each other in order to maximize the therapeutic benefits. The beneficial effects of GGCLT on the various medicinal purposes may be due to its wide spectrum of pharmacological properties such as vasodilation, cardioprotection, neuroprotection, antioxidant, anticancer, antiinflammation, alleviating pain, and attenuating insulin resistance [19, 20].

Anti-diabetic property of puerarin enhanced the performance of mitochondria in muscle and promoted the oxidation of fatty acids, which thus prevented the accumulation of intramyocellular lipids in diabetic rats [39]. Glycyrrhizin (GL) significantly attenuated serum bile acid accumulation partially by restoring inflammation-mediated hepatic farnesoid X receptor inhibition in choline-deficient diet (MCD) induced nonalcoholic steatohepatitis (NASH) mice [40]. The preclinical evidence suggested that berberine might be an effective and promising drug for treating NAFLD/NASH [41]. Berberine can significantly improve blood lipids and liver function in patients with NAFLD and has good advantage in reducing blood glucose in patients with NAFLD [42]. Wogonine improves hyperglycemia and dyslipidemia by activation of PPARα in db/db mice [43]. Anti-inflammatory effects of baicalin, baicalein, and wogonin on lipopolysaccharide (LPS)-mediated vascular inflammatory responses [44]. Baicalin and baicalein are the main components of Scutellaria baicalensis. The therapeutic effects and mechanism of baicalin, baicalein, and their combination may be useful on ulcerative colitis rat [45]. These GGCLT properties should be used to specifically target NAFLD and may be useful as new alternatives or supplements for the development of clinical drugs. NAFLD is closely associated with lipotoxicity and has become one of the most studied mechanisms in the pathogenesis of NAFLD.

In this condition, circulating free fatty acid (FFA) levels are elevated despite the increased concentration of insulin due to tissue resistance to its action [46]. In addition, FFA is among most common molecules suspected for lipotoxicity. Hepatic FAs derive from the adipose tissue lipolysis and are synthesized in the liver, or are released from lysosomes after autophagy. Consequently, surplus FFA that are not incorporated in more complex forms are lipotoxic to hepatocytes, they result in endoplasma reticular stress, mitochondrial dysfunction and oxidative stress, followed by the formation of reactive oxygen species (ROS). These processes activate the proinflammatory and profibrotic pathways, causing the disease to progress to NASH [4, 47]. In this study, lipotoxicity, inflammation, and IR are a contributing factor in the NAFLD suite. GGCLT mitigated inflammation and RI induced by lipotoxicity, which decreased lipolysis of adipocytes and improved lipotoxicity. In addition, GGCLT with each condition improve each other and shows a downward trend in the development of NAFLD in the presence of lipotoxicity, IR and inflammation form a vicious cycle.

Hepatic CD36 overexpression corresponds to a marked increase in uptake of hepatic FFAs and a decrease in β-oxidation and autophagy, thus contributing to hepatosteatosis. Conversely, the downward regulation of hepatic CD36 decreases the absorption of FFAs and increases β-oxidation and autophagy protection against hepatosteatosis [5]. GGCLT reversed of NAFLD was followed by a significant reduction in CD36 levels in hepatic and adipose tissues in mice. On the other hand, CD36 expression is also modulated by hypoxia-inducible factors (HIFs) [48]. In particular, GGCLT decreased the expression of CD36 and reduced the signaling of hypoxia in liver and fat tissue, thus contributing to the protective effect of NAFLD. The fact of our study was the rise of CD36 in the membrane when persistent with lipotoxicity, suggesting that the chronic hypoxia-mitochondria dysfunction-inflammation cascade of NAFLD mice may explain the CD36 translocation contribute to hepatic steatosis. This study found that GGCLT improved metabolic parameters in obese fat tissue in spite of the lack of significant differences in food and daily energy intakes among treatment groups. As a result, in adipose tissues, adipocyte hypertrophy promotes the expression of hypoxia-inducible factor-1 (HIF-1), the balance of which is essential for the maintenance of a healthy energy homeostasis [49]. As a result, hypoxia signaling is necessary for its pro-lipogenic actions throughout obese adipose tissue, while HIF-1 regulates the polarization of M1 and M2 macrophages. These cause the release of inflammatory signaling factors and the recruitment of more immune cells into adipose tissue, which disrupts the signaling of intracellular insulin [50, 51]. Recent evidence suggests that the expression of UCP1, UCP2, and PGC-1 in ectopic mitochondria, combined with a gene expression profile of brown adipocytes (BA), induces WAT to take on the characteristics of BA tissue (BAT) [52]. The present study investigated the mechanism of GGCLT intervention on the signaling between lipogenesis, inflammatory response, and mitochondria biogenesis in NAFLD mice. These findings provide evidence that GGCLT benefited above signaling pathways, which are involved in meeting the energetic needs of tissues and improving mitochondrial dysfunction under hypoxia stress conditions.

Adipocytes hypertrophy and hyperplasia in obesity, allowing these cells to compartmentalize triglycerides. Furthermore, insulin resistant adipocytes produce an excess of free fatty acids, which may cause liver inflammation [53]. In the current model, the improved metabolic profile of GGCLT was associated with a lower influx in macrophage depolarization. The development of inflammation in the liver and EWAT in db/db mice was preceded by macrophage activation and proinflammatory gene expression. GGCLT treatment significantly reduced M1/M2 levels of macrophage and inflammation-associated genes in both liver and adipose tissue in this study. In our study, we found that EWAT inflammation is important in the development of insulin resistance and NAFLD in db/db mice. In this study, the gene expression analysis of EWAT revealed that genes related to adipose browning and macrophage depolarization were up-regulated, and mitochondria biogenesis correlated with hepatic contents. These findings suggest that GGCLT may have an anti-inflammatory effect on peripheral white adipose tissue browning and may also play an important role in the pathogenesis of NAFLD.

Previous research has shown that GGCLT reduces lipid accumulation through primary hepatocytes, implying that activation of AMPK and PPAR in hepatocytes, causing a reduction in lipid formation, contributes to GGCLT’s beneficial action in ApoE-/- atherosclerosis mice [19]. Our results showed that GGCLT inhibit of CPT-1, 2 leads to decreased lipogenesis from NAFLD both in liver and adipose tissue. Thus, we propose that GGCLT inactivation of lipogenesis leads to an auto-diminishing returns loop for lipid accumulation in the liver or adipose tissue, offering an alternative advantageous mechanism in NAFLD. Furthermore, we discovered that GGCLT can activate mitochondrial biogenesis proteins (SIRT1, PGC1α), which is implicated in its anti-lipogenic action. Because individual fatty acids influenced lipid and carbohydrate metabolism, the profile of fatty acids reaching the liver may be important modulators of hepatic energy metabolism. It could be speculated, however, that GGCLT may directly action on mitochondrial oxidation, and subsequently lower rates of lipogenesis when lipotoxicity involving in NAFLD procession. However, how the inhibition of β-oxidation decreases lipogenesis is not known.

WAT browning was linked to a decline in parkin-mediated mitophagy, and parkin expression inhibited WAT browning [54]. One of the underlying causes of NAFLD is mitochondrial dysfunction caused by a failure of the quality control processes [55]. Extreme mitochondrial fission is a precursor to hepatocyte death that causes mitochondrial dysfunction. Autophagy targets depolarized mitochondria for degradation in response to mitochondrial damage (mitophagy) [56]. One of the underlying reasons of NAFLD is mitochondrial dysfunction caused by a breakdown of quality control procedures. As a result, mitochondria are active organelles that constantly fusion and fission. Abnormal mitochondrial fission is a precursor to hepatocyte apoptosis that causes mitochondrial malfunction.

GGCLT enhances β-oxidation and lowers lipogenesis in response to mitochondrial damage, resulting in low levels of lipid buildup in hepatocytes, which eliminates excess ROS and hepatic injury while also promoting hepatic mitochondria biogenesis and mitophagy. Taken together, the results show that activation of mitochondrial quality control systems re-establishes the mitochondrial activity of GGCLT and improves its therapeutic use and prevention of the development of NAFLD. First, the GGCLT is a phytochemical-rich formula that contains a variety of anti-inflammation and antioxidant compounds. GGCLT is promising for the maintenance of human health, in addition to its diverse bioactive properties in NAFLD animal models. Because of this importance, highly specific analytical methods are required to accurately assess bioactive substances in various matrices derived from GGCLT. Finally, although our results revealed that GGCLT ameliorated the systemic homeostasis and the response to NAFLD challenges to the coordination of liver and adipose tissues. But is the GGCLT mainly acting on liver or adipose tissue? Our current data don’t provide the real target. Further study should help us to clarify adipocyte-hepatocyte crosstalk signaling and provided a unique feature of the GGCLT between the liver and the adipose compartment in NAFLD.

5. Conclusions

Crosstalk between the liver and adipose tissue is a crucial factor in the emergence of NAFLD. Large amounts of physiologically active tissue may be found in adipose tissue, which has a major impact on liver disease. Adipose tissue rather than liver tissue itself may be the best target for treating hepatic illness. In addition, activating mitochondria biogenesis has been demonstrated in our study and the main treatment foundation for NAFLD, diabetes, and obesity is thought to be GGCLT. We established the same mitochondria β-oxidation-dependent anti-lipogenesis activity of GGCLT in both adipose tissue and liver, corroborating our observations on GGCLT. This will eventually become a standard component of the repertoire for treating liver disease. In summary, our research provides a fresh strategy and possible targets for GGCLT’s positive effects on mitophagy and mitochondrial dysfunction in NAFLD. However, additional research is needed to further evaluate the potential benefits of such therapy in human subjects.

Author Contributions

HML, CHW, and TYL designed the research study. HML and CHW performed the research. HML, ZYC, and CHH provided help and advice on validation, formal analysis and investigation. HML, MCL, and CHW analyzed the data. HML, CHW, and TYL wrote the manuscript. All authors contributed to editorial changes in the manuscript. All authors read and approved the final manuscript.

Ethics Approval and Consent to Participate

All of the animal experiments were performed in accordance with the Animal Care and Use Committee of Chang Gung University Institutional Animal Care and Use Committee (CGU107-265).

Acknowledgment

Not applicable.

Funding

This research was funded by grants from the Ministry of Science and Technology, Taipei, Taiwan (MOST 102-2320-B182-015-MY3, 103-2320-B182-002-MY3, and 106-2320-B-182-005-MY3, 109-2320-B-182-023-MY3) and the Chang Gung Memorial Hospital, Linkou, Taiwan (CMRPD1B0261, CMRPD1B0262, CMRPD1D0351, CMRPD1D0352).

Conflict of Interest

The authors declare no conflict of interest.

Publisher’s Note: IMR Press stays neutral with regard to jurisdictional claims in published maps and institutional affiliations.

References
[1]
Younossi ZM, Golabi P, de Avila L, Paik JM, Srishord M, Fukui N, et al. The global epidemiology of NAFLD and NASH in patients with type 2 diabetes: a systematic review and meta-analysis. Journal of Hepatology. 2019; 71: 793–801.
[2]
Cusi K. Role of Insulin Resistance and Lipotoxicity in Non-Alcoholic Steatohepatitis. Clinics in Liver Disease. 2009; 13: 545–563.
[3]
Liu HM, Wang CH, Chang ZY, Huang, TH, Lee TY. Losartan Attenuates Insulin Resistance and Regulates Browning Phenomenon of White Adipose Tissue in ob/ob Mice. Current issues in Molecular Biology. 2021; 43: 1828–1843.
[4]
Buzzetti E, Pinzani M, Tsochatzis EA. The multiple-hit pathogenesis of non-alcoholic fatty liver disease (NAFLD). Metabolism. 2016; 65: 1038–1048.
[5]
Rada P, González-Rodríguez Á, García-Monzón C, Valverde AM. Understanding lipotoxicity in NAFLD pathogenesis: is CD36 a key driver? Cell Death and Disease. 2020; 11: 802.
[6]
Prasun P, Ginevic I, Oishi K. Mitochondrial dysfunction in nonalcoholic fatty liver disease and alcohol related liver disease. Translational Gastroenterology and Hepatology. 2021; 6: 4.
[7]
Mittal M, Siddiqui MR, Tran K, Reddy SP, Malik AB. Reactive Oxygen Species in Inflammation and Tissue Injury. Antioxidants and Redox Signaling. 2014; 20: 1126–1167.
[8]
Mylonis I, Sembongi H, Befani C, Liakos P, Siniossoglou S, Simos G. Hypoxia causes triglyceride accumulation by HIF-1-mediated stimulation of lipin 1 expression. Journal of Cell Science. 2012; 125: 3485–3493.
[9]
Sun R, Denko N. Hypoxic Regulation of Glutamine Metabolism through HIF1 and SIAH2 Supports Lipid Synthesis that is Necessary for Tumor Growth. Cell Metabolism. 2014; 19: 285–292.
[10]
Bensaad K, Favaro E, Lewis C, Peck B, Lord S, Collins J, et al. Fatty Acid Uptake and Lipid Storage Induced by HIF-1α Contribute to Cell Growth and Survival after Hypoxia-Reoxygenation. Cell Reports. 2014; 9: 349–365.
[11]
Mesarwi OA, Moya EA, Zhen X, Gautane M, Zhao H, Wegbrans Giró P, et al. Hepatocyte HIF-1 and Intermittent Hypoxia Independently Impact Liver Fibrosis in Murine Nonalcoholic Fatty Liver Disease. American Journal of Respiratory Cell and Molecular Biology. 2021; 65: 390–402.
[12]
Younossi Z, Tacke F, Arrese M, Chander Sharma B, Mostafa I, Bugianesi E, et al. Global Perspectives on Nonalcoholic Fatty Liver Disease and Nonalcoholic Steatohepatitis. Hepatology. 2019; 69: 2672–2682.
[13]
Jinjuvadia R, Antaki F, Lohia P, Liangpunsakul S. The Association between Nonalcoholic Fatty Liver Disease and Metabolic Abnormalities in the United States Population. Journal of Clinical Gastroenterology. 2017; 51: 160–166.
[14]
Pickles S, Vigié P, Youle RJ. Mitophagy and Quality Control Mechanisms in Mitochondrial Maintenance. Current Biology. 2018; 28: R170–R185.
[15]
Montava-Garriga L, Ganley IG. Outstanding Questions in Mitophagy: what we do and do not Know. Journal of Molecular Biology. 2020; 432: 206–230.
[16]
Ke PY. Mitophagy in the Pathogenesis of Liver Diseases. Cells. 2020; 9: 831.
[17]
Pfeifer A, Hoffmann LS. Brown, Beige, and White: the New Color Code of Fat and its Pharmacological Implications. Annual Review of Pharmacology and Toxicology. 2015; 55: 207–227.
[18]
Ikeda K, Maretich P, Kajimura S. The Common and Distinct Features of Brown and Beige Adipocytes. Trends in Endocrinology and Metabolism. 2018; 29: 191–200.
[19]
Ho F, Liao Y, Yang A, Lee Chao P, Hou Y, Huang C, et al. Anti-atherosclerotic action of Ger-Gen-Chyn-Lian-Tang and AMPK-dependent lipid lowering effect in hepatocytes. Journal of Ethnopharmacology. 2012; 142: 175–187.
[20]
Chang Z, Lee T, Huang T, Wen C, Chien R, Chang H. Hepatoprotective effects of Ger-Gen-Chyn-Lian-Tang in thioacetamide-induced fibrosis in mice. Journal of the Chinese Medical Association. 2014; 77: 360–366.
[21]
Chang ZY, Chen CC, Liu HM, Yeh YC, Lin TY, Lee TY, et al. Positive Effects of Ger-Gen-Chyn-Lian-Tang on Cholestatic Liver Fibrosis in Bile Duct Ligation-Challenged Mice. International Journal of Molecular Sciences. 2019; 20: 4181.
[22]
Liu Y, Zhai M, Guo F, Shi T, Liu J, Wang X, et al. Whole Body Vibration Improves Insulin Resistance in db/db Mice: Amelioration of Lipid Accumulation and Oxidative Stress. Applied Biochemistry and Biotechnology. 2016; 179: 819–829.
[23]
Wang CH, Liu HM, Chang ZY, Huang TH, Lee TY. Losartan Prevents Hepatic Steatosis and Macrophage Polarization by Inhibiting HIF-1α in a Murine Model of NAFLD. International Journal of Molecular Sciences. 2021; 22: 7841.
[24]
Jiang G, Li Z, Liu F, Ellsworth K, Dallas-Yang Q, Wu M, et al. Prevention of obesity in mice by antisense oligonucleotide inhibitors of stearoyl-CoA desaturase–1. Journal of Clinical Investigation. 2005; 115: 1030–1038.
[25]
Pereyra AS, Rajan A, Ferreira CR, Ellis JM. Loss of Muscle Carnitine Palmitoyltransferase 2 Prevents Diet-Induced Obesity and Insulin Resistance despite Long-Chain Acylcarnitine Accumulation. Cell Reports. 2020; 33: 108374.
[26]
Lowe PP, Gyongyosi B, Satishchandran A, Iracheta-Vellve A, Cho Y, Ambade A, et al. Reduced gut microbiome protects from alcohol-induced neuroinflammation and alters intestinal and brain inflammasome expression. Journal of Neuroinflammation. 2018; 15: 298.
[27]
Gustin A, Kirchmeyer M, Koncina E, Felten P, Losciuto S, Heurtaux T, et al. NLRP3 Inflammasome Is Expressed and Functional in Mouse Brain Microglia but Not in Astrocytes. PLoS ONE. 2015; 10: e0130624.
[28]
Xue Y, Zhang S, Zheng C, Li Y, Zhang L, Su Q, et al. Long non‐coding RNA MEG3 inhibits M2 macrophage polarization by activating TRAF6 via microRNA‐223 down‐regulation in viral myocarditis. Journal of Cellular and Molecular Medicine. 2020; 24: 12341–12354.
[29]
Yang H, Liao D, Tong L, Zhong L, Wu K. MiR-373 exacerbates renal injury and fibrosis via NF-κB/MatrixMetalloproteinase-9 signaling by targeting Sirtuin1. Genomics. 2019; 111: 786–792.
[30]
Chen YS, Liu HM, Lee TY. Ursodeoxycholic Acid Regulates Hepatic Energy Homeostasis and White Adipose Tissue Macrophages Polarization in Leptin-Deficiency Obese Mice. Cells. 2019; 8: 253.
[31]
Fu S, Lu W, Yu W, Hu J. Protective effect of Cordyceps sinensis extract on lipopolysaccharide-induced acute lung injury in mice. Bioscience Reports. 2019; 39: BSR20190789.
[32]
Sadovnikova IS, Gureev AP, Ignatyeva DA, Gryaznova MV, Chernyshova EV, Krutskikh EP, et al. Nrf2/ARE Activators Improve Memory in Aged Mice via Maintaining of Mitochondrial Quality Control of Brain and the Modulation of Gut Microbiome. Pharmaceuticals. 2021; 14: 607.
[33]
Park J, Sohn H, Koh YH, Jo C. Curcumin activates Nrf2 through PKCδ-mediated p62 phosphorylation at Ser351. Scientific Reports. 2021; 11: 8430.
[34]
Piekarski A, Khaldi S, Greene E, Lassiter K, Mason JG, Anthony N, et al. Tissue distribution, gender- and genotype-dependent expression of autophagy-related genes in avian species. PLoS ONE. 2014; 9: e112449.
[35]
Kim JJ, Lee YA, Su D, Lee J, Park SJ, Kim B, et al. A Near-Infrared Probe Tracks and Treats Lung Tumor Initiating Cells by Targeting HMOX2. Journal of the American Chemical Society. 2019; 141: 14673–14686.
[36]
Gupta SS, Sharp R, Hofferek C, Kuai L, Dorn GW, Wang J, et al. NIX-Mediated Mitophagy Promotes Effector Memory Formation in Antigen-Specific CD8+ T Cells. Cell Reports. 2019; 29: 1862–1877.e7.
[37]
Cai Y, Yang E, Yao X, Zhang X, Wang Q, Wang Y, et al. FUNDC1-dependent mitophagy induced by tPA protects neurons against cerebral ischemia-reperfusion injury. Redox Biology. 2021; 38: 101792.
[38]
Roselló-Díez A, Madisen L, Bastide S, Zeng H, Joyner AL. Cell-nonautonomous local and systemic responses to cell arrest enable long-bone catch-up growth in developing mice. PLoS Biology. 2018; 16: e2005086.
[39]
Zhou Y, Zhang H, Peng C. Puerarin: a Review of Pharmacological Effects. Phytotherapy Research. 2014; 28: 961–975.
[40]
Yan T, Wang H, Cao L, Wang Q, Takahashi S, Yagai T, et al. Glycyrrhizin Alleviates Nonalcoholic Steatohepatitis via Modulating Bile Acids and Meta-Inflammation. Drug Metabolism and Disposition. 2018; 46: 1310–1319.
[41]
Ren S, Ma X, Wang R, Liu H, Wei Y, Wei S, et al. Preclinical Evidence of Berberine on Non-Alcoholic Fatty Liver Disease: A Systematic Review and Meta-Analysis of Animal Studies. Frontiers in Pharmacology. 2021; 12: 742465.
[42]
Wei X, Wang C, Hao S, Song H, Yang L. The Therapeutic Effect of Berberine in the Treatment of Nonalcoholic Fatty Liver Disease: a Meta-Analysis. Evidence-Based Complementary and Alternative Medicine. 2016; 2016: 3593951.
[43]
Bak E, Kim J, Choi YH, Kim J, Lee D, Woo G, et al. Wogonin ameliorates hyperglycemia and dyslipidemia via PPARα activation in db/db mice. Clinical Nutrition. 2014; 33: 156–163.
[44]
Lee W, Ku S, Bae J. Anti-inflammatory Effects of Baicalin, Baicalein, and Wogonin in Vitro and in Vivo. Inflammation. 2015; 38: 110–125.
[45]
Liang S, Deng X, Lei L, Zheng Y, Ai J, Chen L, et al. The comparative study of the therapeutic effects and mechanism of Baicalin, Baicalein, and their combination on ulcerative colitis rat. Frontiers in Pharmacology. 2019; 10: 1466.
[46]
Bechmann LP, Hannivoort RA, Gerken G, Hotamisligil GS, Trauner M, Canbay A. The interaction of hepatic lipid and glucose metabolism in liver diseases. Journal of Hepatology. 2012; 56: 952–964.
[47]
Mann JP, Feldstein AE, Nobili V. Update on lipid species and paediatric nonalcoholic fatty liver disease. Current Opinion in Clinical Nutrition and Metabolic Care. 2017; 20: 110–116.
[48]
Ortiz-Masià D, Díez I, Calatayud S, Cosín-Roger J, Hinojosa J, Esplugues JV, et al. Induction of CD36 and thrombospondin-1 in macrophages by hypoxia-inducible factor 1 and its relevance in the inflammatory process. PLoS ONE. 2012; 7: e48535.
[49]
Carr RM, Ahima RS. Pathophysiology of lipid droplet proteins in liver diseases. Experimental Cell Research. 2016; 340: 187–192.
[50]
Hotamisligil GS, Shargill NS, Spiegelman BM. Adipose expression of tumor necrosis factor-alpha: direct role in obesity-linked insulin resistance. Science. 1993; 259: 87–91.
[51]
Poulain L, Mathieu H, Thomas A, Borel A, Remy C, Levy P, et al. Intermittent hypoxia-induced insulin resistance is associated with alterations in white fat distribution. Scientific Reports. 2017; 7: 11180.
[52]
Heilbronn L, Campbell L. Adipose Tissue Macrophages, Low Grade Inflammation and Insulin Resistance in Human Obesity. Current Pharmaceutical Design. 2008; 14: 1225–1230.
[53]
Kleiner DE, Brunt EM, Van Natta M, Behling C, Contos MJ, Cummings OW, et al. Design and validation of a histological scoring system for nonalcoholic fatty liver disease. Hepatology. 2005; 41: 1313–1321.
[54]
Taylor D, Gottlieb RA. Parkin-mediated mitophagy is downregulated in browning of white adipose tissue. Obesity. 2017; 25: 704–712.
[55]
Sheldon RD, Meers GM, Morris EM, Linden MA, Cunningham RP, Ibdah JA, et al. ENOS deletion impairs mitochondrial quality control and exacerbates Western diet-induced NASH. American Journal of Physiology-Endocrinology and Metabolism. 2019; 317: E605–E616.
[56]
Li R, Toan S, Zhou H. Role of mitochondrial quality control in the pathogenesis of nonalcoholic fatty liver disease. Aging. 2020; 12: 6467–6485.
Share
Back to top