
Academic Editor: Brenda M. Alexander
Periosteum is essential for bone regeneration and damage repair in mammals. Most species of deer family (Cervidae) develop two kinds of special periosteum, antler periosteum and pedicle periosteum, both supporting the complete regeneration of antler. Antler is the bone organ with the fastest growth rate in mammals. Along with the fast growth of antler, its external tissues such as blood vessels, nerves and the covering skin also grow rapidly. Currently, it is still unclear whether antler periosteum contributes to the fast growth of antler and how. It is also unclear why the regenerative capacity of antler periosteum is weaker than that of pedicle periosteum. In this study, the in vitro culture system for antler periosteal cells (AnPC) was constructed for the first time using the mid-beam antler periostea during antler fast-growth period. According to our results, the cultured AnPC expressed classical MSC markers, consistent with the pedicle periosteal stem cells (PPSC). However, the fluorescence intensities of the MSC markers on AnPC were significantly weaker than those on PPSC. In addition, AnPC showed much lower proliferation rates than PPSC. The proliferation rates of the AnPC also gradually decreased after successive passages, while the proliferation rates of the pedicle periosteal stem cells remained unchanged. These findings may partially explain the weaker regenerative capacity of antler periosteum. Further comparative global gene analysis revealed clearly the different gene expressed patterns between AnPC and PPSC. AnPC may mainly function on promoting angiogenesis, nerve growth and intramembrane bone formation during antler regeneration, whereas PPSC may primarily be involved in androgen signaling receptor pathway and PI3K-Akt signaling pathway and function on maintaining stem cell renewal.
Periosteum is a thin layer of vascularized tissue lining the outer bone surface. It plays an essential role in bone regeneration and damage repair in mammals [1, 2, 3, 4, 5, 6, 7, 8]. Most species from the deer family (Cervidae) possess two special types of periostea—the pedicle periosteum and the antler periosteum, making them unique among mammals in terms of regenerative capacity. The pedicle periosteum and the antler periosteum support the complete regeneration of the antler [9, 10, 11]. The pedicle periostea cover the pedicles, which are two symmetrically permanent bony protuberances on the deer frontal bone (Fig. 1A). Pedicles are the antecedents to the formation of antlers. Most deer species begin to develop pedicles as the fawns approach puberty [12]. When the pedicles reach the species-specific maximum height, the first antlers generate spontaneously from the apices of the pedicles [13]. Then the deer’s antlers enter a testosterone level-dependent regenerative cycle after casting every year [12, 14, 15], and the pedicles increase in diameter and decrease in length gradually to support antler regeneration [16]. It has been well recognized that pedicle periosteum induces antler regeneration. The pedicle periosteum is naturally consumed partly to regenerate new antler every year [12, 14, 17]. In comparison, the antler periostea covering the regenerative antler shaft (Fig. 1A) are not consumed naturally. When an antler is amputated artificially or by accident, the antler periosteum can trigger self-regeneration of the antler under low androgen levels [10]. Previous studies have reported that the regenerative capacity of the antler periosteum is significantly weaker than that of the pedicle periosteum [10, 11, 18]. The size of the antler regenerated from the antler periosteum is significantly smaller than that from the pedicle periosteum [10, 11, 18, 19]. In addition, the antler periosteum gradually loses regenerative capacity through successive epimorphic experiments, whereas the pedicle periosteum still maintains [18, 19].
 Fig. 1.
Tissue extraction and cell culture for sika deer antler
periosteum and pedicle periosteum. (A) The pedicle and the regenerative antler
outgrew from the pedicle. The dotted box denotes the location where the antler
periostea were harvested. (B) The antler periosteal tissues (AnP) harvested for
primary cell culture, denoted by the white dotted box. (C) The pedicle periosteal
tissues (DP and PP) harvested for primary cell culture, denoted by the brown
dotted box. (D) The sub-cultured antler periosteal cells (AnPC) showing monolayer
polygonal and fibroblastic morphology in DMEM/FBS, bar = 200
Bone regeneration mainly relies on the presence and activation of the periosteal stem cells within the periosteum [2, 20, 21]. Previous studies have shown that cultured pedicle periosteal cells express classical mesenchymal stem cell (MSC) markers and maintain multiple differentiation potentials [22, 23, 24], same as the reported adult periosteal stem cells contributing to bone regeneration [2, 21, 25, 26, 27]. In the early stage of antler regeneration, the distal pedicle periostea initially increase in thickness following the cast of the ossified antlers [25, 27] and migrate towards the center of the cast surface to form blastema. The blastema finally forms perichondrium, which covers the antler tip and connects proximally with the antler periosteum as the new antler regenerates [28, 29]. The reserve mesenchyme layer, precartilage layer, transition layer and cartilage layer localize below the perichondrium longitudinally, with immunohistochemically localized MSC markers as well [30]. In comparison, the characteristic of antler periosteum has been rarely reported. The factors leading to the weaker regenerative capacity of the antler periosteum, compared to the pedicle periosteum, are also waiting to be detected [28, 29, 31].
Histologically, deer antlers and pedicles demonstrate similar growth patterns, with elongation via modified endochondral ossification and latitudinal growth via intramembranous ossification [25, 26, 27, 32]. However, the growth rates of the regenerative antlers and the pedicles are strikingly different. The elongation of the regenerative antler follows a typical S-shape growth curve. In the first month to six weeks after regeneration, antler longitudinal growth is relatively slow. Throughout the next 60–80 days there follows a period of rapid exponential growth that slows as autumn approaches. During the fast-growth period, the average growth rate of a sika deer antler can reach up to 1.14 cm/day [17]. For some giant deer species, such as elk (moose), the average growth rate of an antler will elongate by more than 2 cm/day [33]. This rate of bone formation represents the fastest described in the mammalian kingdom [16]. In contrast, pedicles demonstrate relatively constant growth rate. The average growth rate of a pedicle is 0.4 mm/day [26], similar to that of human femur (0.32 mm/day during embryonic development [34] and 0.42 mm/year from three to sixteen years of age [35, 36] on average). Along with the fast growth of the antler, the coordinated regeneration of multiple tissue types such as blood vessels, nerves and the covering skin also grow rapidly. Whether the antler periosteum contributes to the fast growth of antler remains unknown and needs further investigation.
In this study, we conducted the in vitro culture system of the antler periosteum for the first time. In addition, we found the antler periosteal cells (AnPC) expressed weaker MSC markers and decreased proliferation rates than pedicle periosteal stem cells (PPSC), likely leading to the weakened regenerative capacity of the antler periosteum. To further reveal the functions of AnPC in antler regeneration, the transcriptome analysis was conducted to compare the gene expression patterns between AnPC and PPSC. The candidate genes and regulating pathways contributing to fast growth of the antler were predicted and verified through real-time PCR analysis.
The antler periosteal tissues (AnP; Fig. 1A,B) were collected from the mid-beam
of the three commercially harvested 2-branch velvet antlers, taken from three
male sika deer (Cervus nippon, 2–3 years old) during the antler fast-growth
period in July (northern hemisphere). Immediately after sawed, the fresh antlers
were taken back to the lab for sterilization, using 75% ethanol and iodine
solution. The velvet skin was cut to expose the antler periosteum, which was cut
into 0.3 cm
The primary cell cultures for antler periosteum and pedicle periosteum were
conducted according to established protocols [23, 38]. After washing by three
consecutive PBS washes, the periosteum strips were digested in Dulbecco’s
Modified Eagle’s Medium (DMEM, 11965092, Gibco, Grand Island, NY, USA) containing
collagenase D (150 units/mL, 11088858001, Roche, Agawam, MA, USA). After removing
the collagenase, the digested complexes were cultured in DMEM medium containing
10% fetal bovine serum (10099141, Gibco), 100 mg/mL of streptomycin and 100
units/ml of penicillin (03-031-5B, BI) in a humidified atmosphere with 5%
CO
The comparison of cell proliferation rates between AnPC, PPC and DPC was
conducted using Cell Counting Kit-8 (C0037, Beyotime, Shanghai, China), according
to the manufacturer’s instructions. Three biological replicates were performed
for AnPC, DPC and PPC, respectively. The 50 cells from each cell type were seeded
into each well of a 96-well plate with a volume of 100
The sub-cultured AnPC, DPC and PPC in DMEM (11965092, Gibco)/FBS (10099141,
Gibco) were collected using trypsin, when they reached to 80% confluence. The
150 cells were seeded into each well of the 24-well plate and each treatment was
performed in triplicate. Cells were maintained in the serum-free mesenchymal stem
cell (MSC) medium (T310jv, Yuanpei, Shanghai, China) with
1
The sub-cultured AnPC, DPC and PPC were fixed under 4% (wt/vol)
paraformaldehyde fixation for 10 min. For intracellular proteins, cells were
permeabilized for 5 min using PBS with 0.3% Triton X-100 (T8787, Sigma).
Blocking was performed for 30 min using 3% (wt/vol) Bovine Serum Albumin in PBS.
The primary antibodies including rabbit anti-CD73 (1:300; SantaCruz, Santa Cruz,
CA, USA), rabbit anti-CD90 (1:300; Bioss, Beijing, China), rabbit anti-CD105
(1:300; Thermo, Agawam, MA, USA) and rabbit anti-Nestin (1:300; GeneTex, Irvine,
CA, USA) were left overnight at 4
After decanting the culture medium from the T75 flasks and washing by PBS twice,
the AnPC, DPC and PPC of second passages were trypsinized, centrifuged and
re-suspended in PBS at 4
The gene expression patterns of AnPC, DPC, and PPC were compared through PCA
analysis and hierarchical clustering analysis, performed though the MetaboAnalyst
(v. 4.0, Quebec, Quebec, Canada) [43]. The differentially expressed genes (DEGs)
were identified using DESeq2 R package (v2.1.18, Boston, MA, USA) [44] and
visualized in volcano plot using GraphPad Prism 8 (v. 8.2.0). The adjusted
p value
After the cells were briefly washed three times by PBS, the total RNAs of AnPC,
DPC and PPC were isolated and purified using RNeasy mini kit 50
(151043752, Qiagen, Germantown, MD, USA), according to the
manufacturer’s instructions. RNA was quantified by measuring optical absorbance
at 260 nm (Pro2000, Tecan, Switzerland) and a 200 ng was reverse transcribed to
cDNA using PrimeScriptTM RT reagent Kit (RR047A, Takara, Shiga, Japan) and oligo
dT primers following the manufacturer’s instructions. Real-time PCR was performed
using SYBR green I Master mix (4707516001, Roche) on an Applied Biosystems 7300
Real-Time PCR System. GAPDH were used in each reaction as a baseline control. The
fold changes were calculated using the delta-delta CT algorithm, relative to
GAPDH. The one-way ANOVA test was used to calculate the differences among AnPC,
DPC and PPC. Three biological replicates were performed for each gene of interest
and p value
To investigate whether antler periosteal cells (AnPC) demonstrate the same characteristics as the pedicle periosteal stem cells (PPSC), we used the same culture condition for the pedicle stem cells to construct an in vitro culture system for the sika deer AnPC. The antler periosteal tissues (AnP) were first isolated from antler mid-beam periosteum during antler fast-growth period (Fig. 1A,B), and then cultured in the DMEM/FBS medium. The proximal two-thirds of the pedicle periosteum (DP) and the distal third of the pedicle periosteum (PP) were also harvested separately (Fig. 1C) and cultured in the same culture condition as control groups. All the three types of periosteal cells began to migrate out from the attached tissues within 24–48 hours. The sub-cultured antler periosteal cells (AnPC, Fig. 1D) demonstrated the same polygonal fibroblastic morphology as PPSC (DPC, Fig. 1E and PPC, Fig. 1F). From the CCK-8 test results, the second passages of PPC and DPC showed significantly more rapid cell expansion rates than that of AnPC since the third day, while PPC and DPC showed the same proliferation rates (Fig. 1G). Similarly, the fifth passages of PPC and DPC also demonstrated significantly faster cell expansion rates than the fifth passages of AnPC since the second day, while PPC and DPC showed the same proliferation rates (Fig. 1H). There was no change of proliferation rates between the second and the fifth passages of PPC and DPC. However, the proliferation rate significantly declined from the second passages to the fifth passages of AnPC (Fig. 2F). Our results suggested that PPC and DPC proliferated much faster than AnPC. During successive passages, PPC and DPC kept the same proliferation rates, whereas AnPC showed a gradually declined proliferation rate.
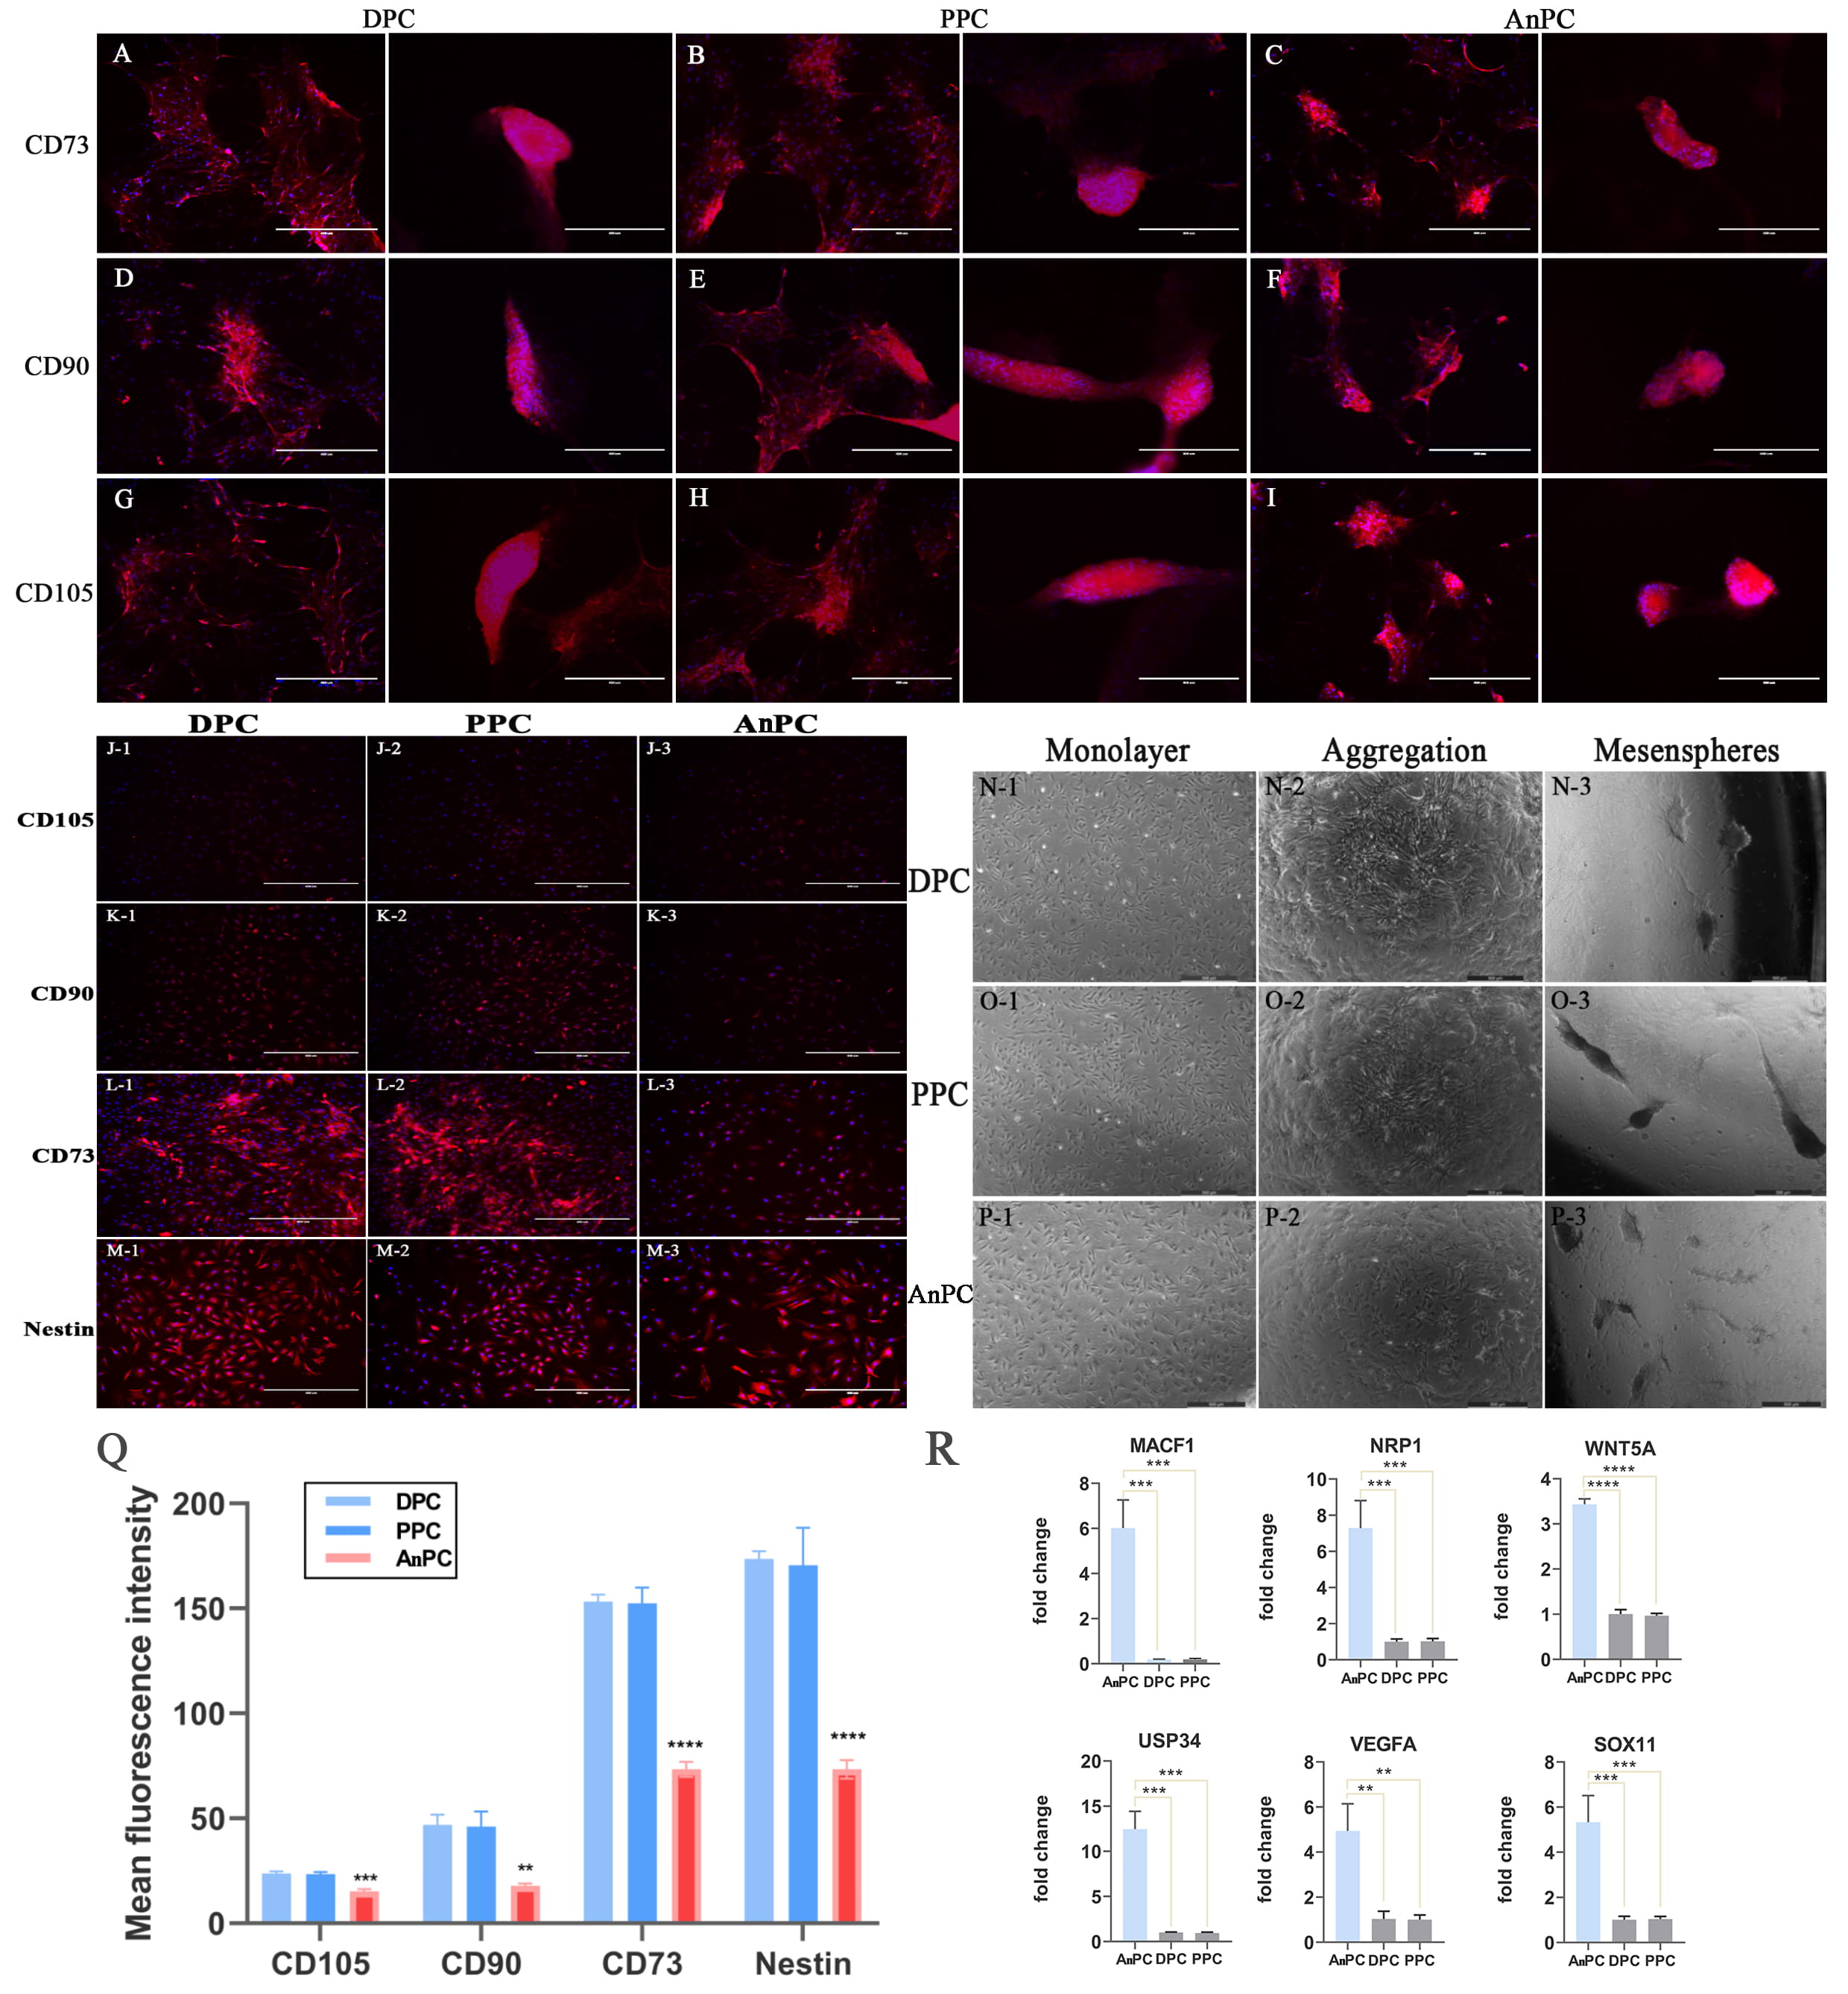 Fig. 2.
Detecting the stem cell characters of AnPC. (A–I) The
expression of CD73, CD90 and CD105 on (A, D, J) DPC, (B, E, H) PPC and (C, F, I)
AnPC when clusters aggregate (left panels) and when mesenspheres form (right
panels), respectively, bar = 400
To evaluate the characteristics of AnPC, the classical mesenchymal stem cell (MSC) markers expressed by cultured PPSC [23] were used in this study. The results showed AnPC were also positive to CD105, CD90, and CD73, consistent with DPC and PPC (Fig. 2J–L). However, compared to the strong expression of the MSC markers on PPSC, the fluorescence intensities of all MSC markers on AnPC were significantly weaker (Fig. 2Q). The percentage of the positive cells of AnPC were also significantly lower than that of DPC or PPC (Supplementary Table 3). Note that there was no significant expression difference of the three markers between DPC and PPC. In addition, we detected all AnPC, DPC and PPC with nestin expression (Fig. 2M1–3) and mesensphere-forming capability (Fig. 2N1–3, O1–3, P1–3), which were typical phenotypes of the neural-crest-derived stem cells [47, 48, 49, 50, 51, 52]. Therefore, the AnPC, PPC and DPC likely shared the same neural crest origin. Interestingly, we also found the fluorescence intensities of all the MSC markers on DPC, PPC and AnPC gradually increased as the mesenspheres clustered from the monolayer cells (Fig. 2A–I). The expressions of CD73, CD90 and CD105 all became strengthened as DPC, PPC, and APC aggregated into clusters (Fig. 2A–I left panels) and reached highest when mesenspheres formed (Fig. 2A–I right panels). Fig. 2N–P show the steps of the DPC, PPC and APC mesensphere formation from the monolayer DPC, PPC and APC when the culture medium was changed from DMEM/FBS to serum-free MSC medium.
To reveal the gene profile of the antler periosteal stem cell lineage to uncover
its function on antler regeneration, comparative transcriptional analysis was
applied to AnPC, DPC and PPC. A total of 404.75 million (60.72 Gb) bases were
first generated on the Illumina HiSeq sequencing platform. After assembling all
samples together and filtering the abundance, 107,389 unigenes were generated.
The total length, average length, N50, and GC content of Unigenes are
146,306,853bp, 1,362bp, 3,362bp and 51.09% respectively. The unigenes were then
aligned with seven functional databases to acquire 50,635 (NR: 47.15%), 101,389
(NT: 94.41%), 43,779 (Swissprot: 40.77%), 37,858 (KOG: 35.25%), 41,439 (KEGG:
38.59%), 14,601 (GO: 13.60%) and 34,581 (InterPro: 32.20%) annotated unigenes.
Finally, the 43,779 unigenes (40.77%) annotated via SwissProt were selected for
the downstream functional analysis in this study (p value
The PCA analysis was performed to obtain the large-scale patterns of gene
expression across AnPC, DPC and PPC, using the 43779 unigenes (Fig. 3A). PC1
explains 89.9 % of the overall variation so that it could represent the overall
trend. On PC1, the distance between AnPC and DPC/ PPC is significantly longer
than that between DPC and PPC, suggesting AnPC separate from DPC and PPC
evidently, while DPC and PPC showed few variations (Fig. 3A). This is consistent
with the results from hierarchical clustering analysis on the same unigenes, with
AnPC showing a distinguished gene expression profile whereas DPC and PPC
clustering together as a composite group
(Fig. 3B). The DEG analysis between DPC and
PPC suggests only 18 DEGs existed between PPC and DPC (Fig. 3D), while 1475 DEGs
existed between DPC and AnPC (Fig. 3E) and 1314 DEGs exited between PPC and AnPC
(Fig. 3F,
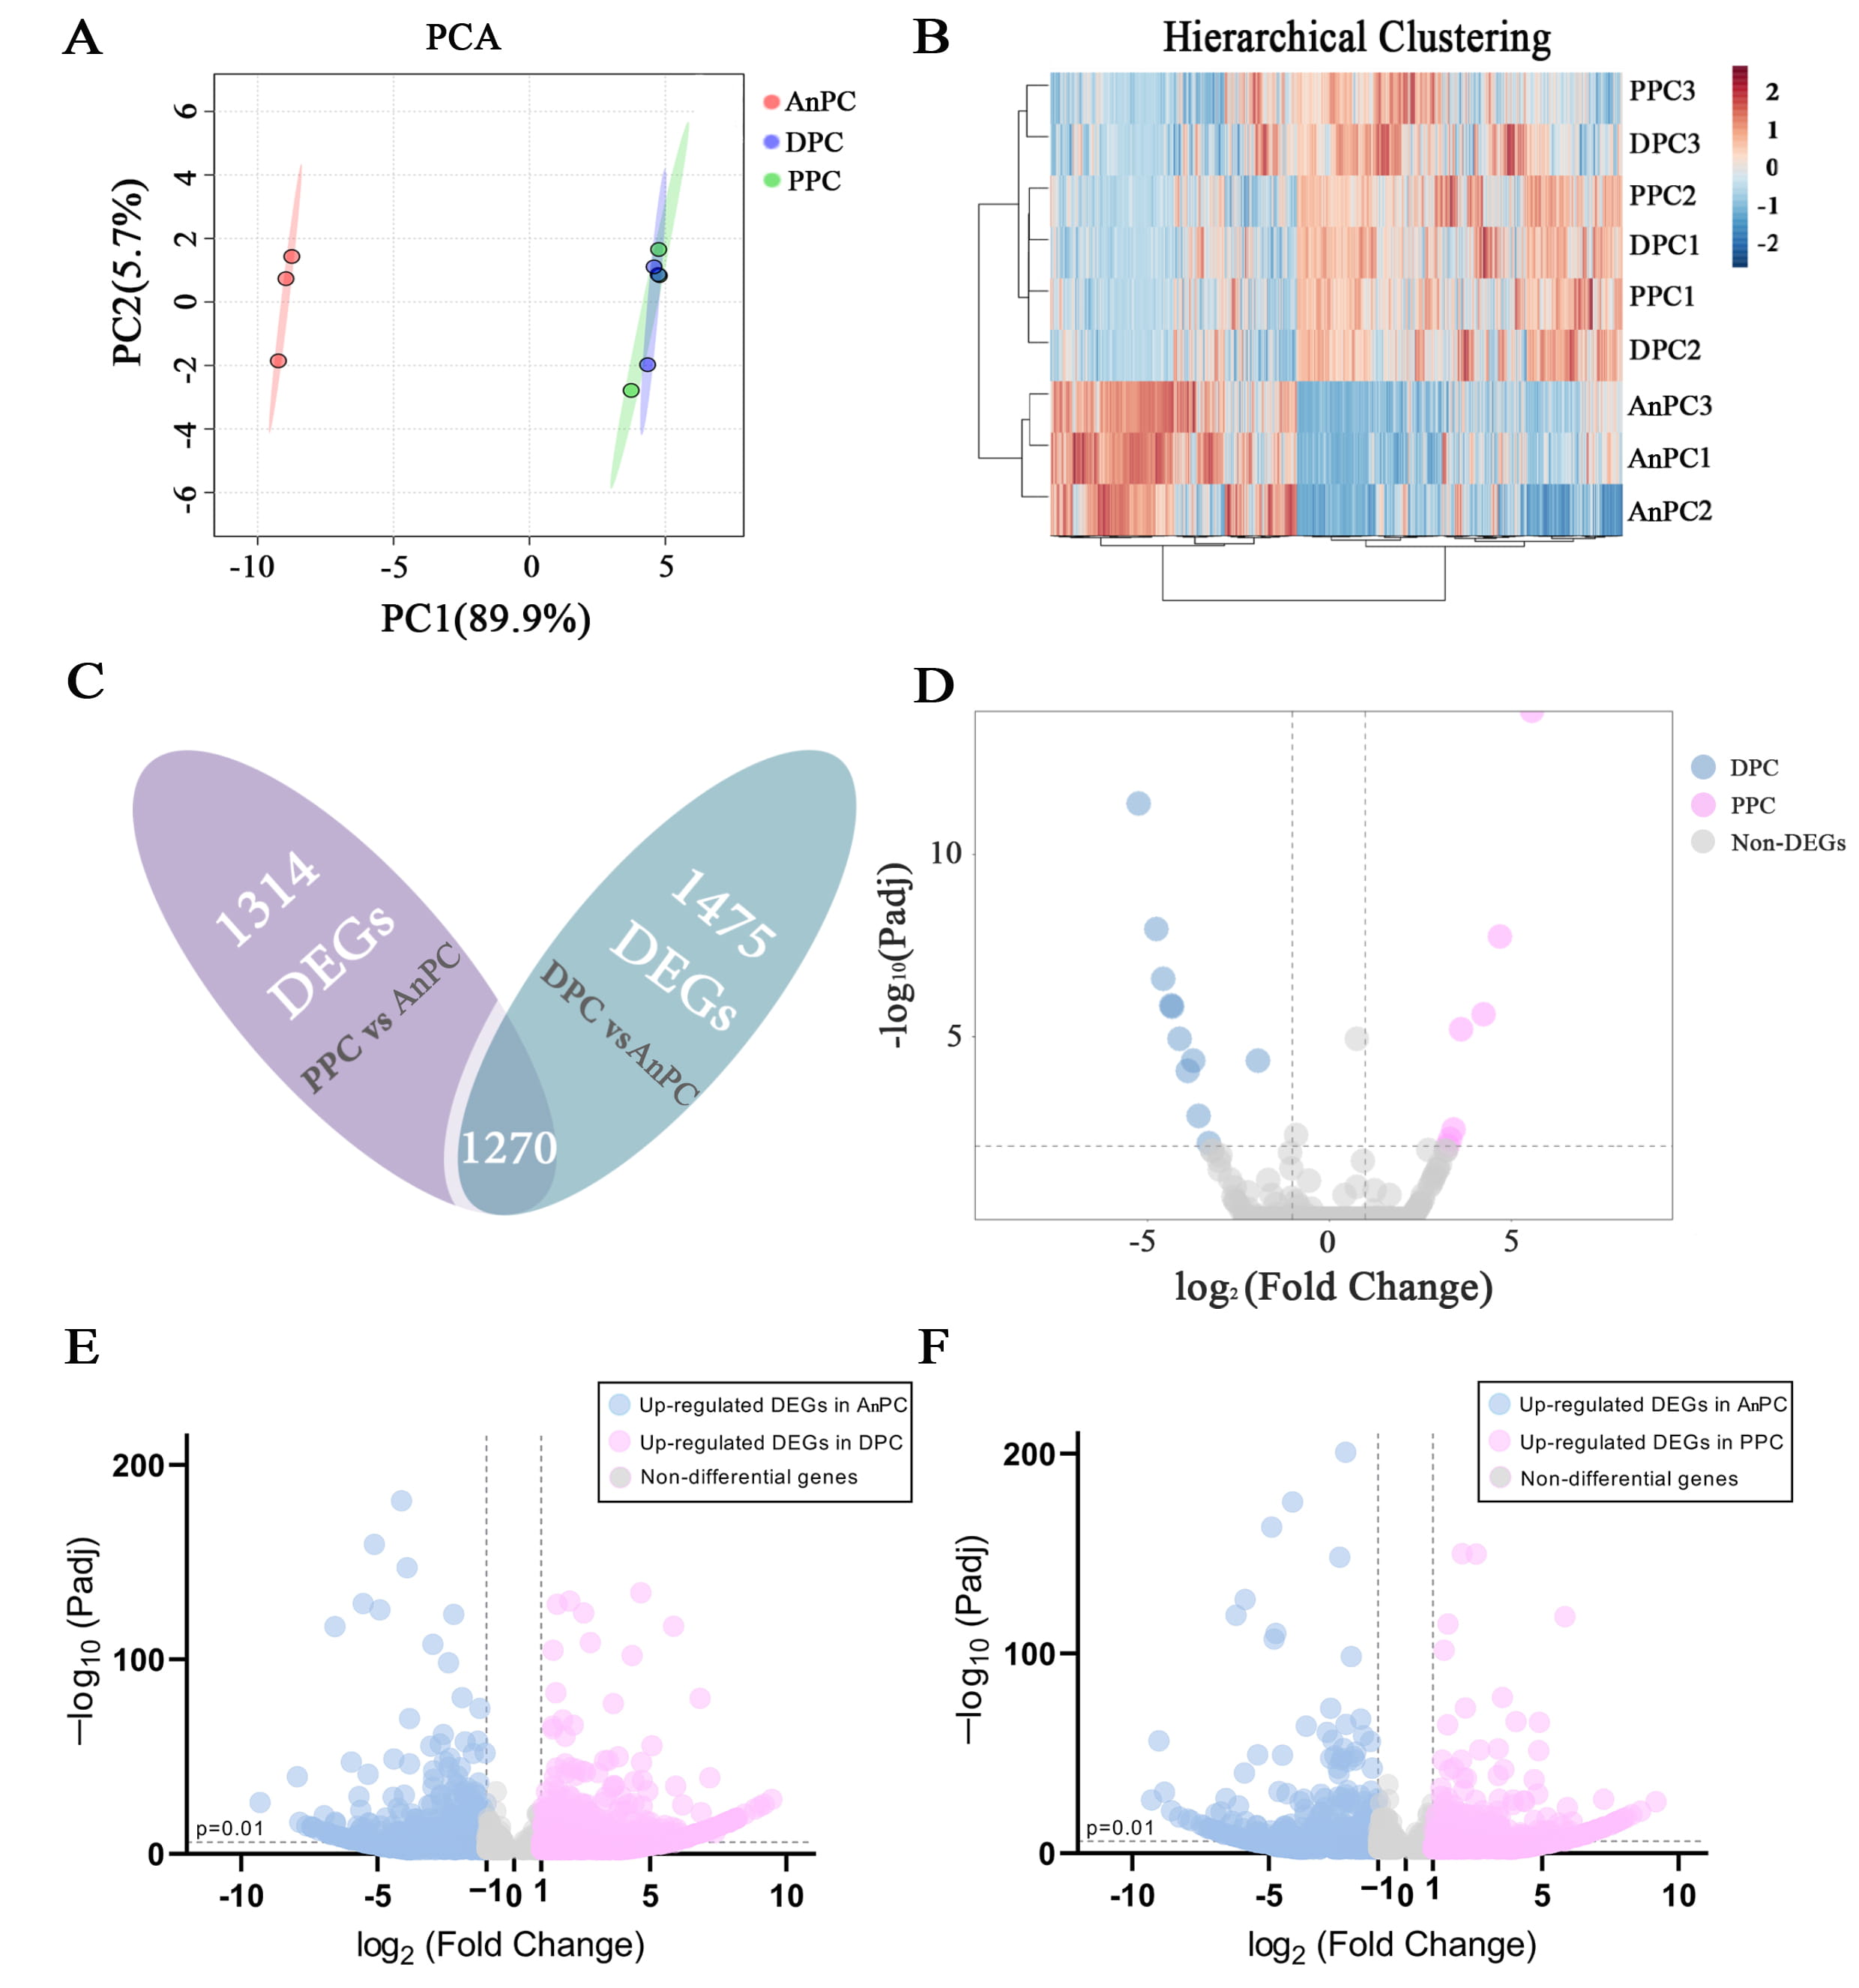 Fig. 3.
A general view of gene expression pattern and DEG analysis on
AnPC, DPC and PPC. (A) The PCA analysis performed on the transcript signatures
of DPC, PPC and AnPC. (B) The hierarchical clustering analysis performed on the
transcript signatures of AnPC, DPC and PPC. (C) Venn analysis performed to
selected the co-expressed DEGs between the AnPC-PPC DEGs and AnPC-DPC DEGs.
(D–F) Volcano plots showing the expression
level of DEGs (D) between DPC and PPC, (E) between APC and DPC, and (F) between
APC and PPC, respectively. X-axis represents the log2foldchange values of the
DEGs. The values
To further analyze the different functions between PPSC and AnPC, we
generated co-expressed 1270 DEGs (Co-PC) from
1475 DPC-AnPC DEGs and 1314 PPC-AnPC DEGs via Venn analysis
(
 Fig. 4.
Gene functional analysis on DEGs between AnPC and Co-PC. (A) GO
analysis in BP performed on the 1270 DEGs between AnPC and
Co-PC. The X-axis denotes the gene counts of the enriched GO
terms. Y-axis represents the important GO terms (p
Different from AnPC, the up-regulated genes of PPSC were mainly enriched in
biological process of GO terms related to intracellular signal transduction, mRNA
splicing via spliceosome, transcription, intracellular protein transport and
androgen receptor signaling pathway, etc. (p
 Fig. 5.
Gene regulating network analysis on the 5036 co-expressed genes between PPC and DPC. The nodes from the network label the biological process of GO terms, which are linked based on a pre-defined kappa score level. The nodes with similar functions are merged into distinguished functional group based on the predefined kappa score threshold (0–1), pained in the same color. The functional groups represented by their most significant term are selected manually and visualized in the network by bigger font. The size of the nodes reflects the enrichment significance of the terms. DPC, the stem cells cultured from proximal two-thirds of the pedicle periostea; PPC, the stem cells cultured from the distal third of periostea.
Six DEGs between AnPC, DPC, and PPC (VEGFA,
NRP1, WNT5A, SOX11, USP34 and MACF1) were selected randomly to validate the
transcriptome analysis result by RT-PCR (Fig. 2R). The results showed that the
gene expression levels of the six genes were all significantly higher in AnPC
than DPC and PPC (p
| Gene ID | Gene name | Gene symbol | Log2foldchange | Log2foldchange |
| AnPC vs DPC | AnPC vs PPC | |||
| CL1721.Contig1_All | Microtubule Actin Crosslinking Factor 1 | MACF1 | 1.67 | 1.79 |
| Unigene50452_All | Neuropilin 1 | NRP1 | 1.57 | 1.52 |
| CL4251.Contig1_All | Wnt Family Member 5A | WNT5A | 5.62 | 6.75 |
| CL140.Contig10_All | Ubiquitin Specific Peptidase 34 | USP34 | 1.63 | 1.66 |
| CL3165.Contig2_All | Vascular Endothelial Growth Factor A | VEGFA | 1.50 | 1.61 |
| Unigene22604_All | SRY-Box Transcription Factor 11 | SOX11 | 4.30 | 4.95 |
Pedicle periosteum and antler periosteum can both support antler regeneration. However, the regenerative capacity of the antler periosteum is much weaker than that of pedicle periosteum [10, 11, 18]. To detect the factors owing to this difference, we constructed the in vitro culture system for sika deer antler periosteum using the same culture condition as that for the pedicle stem cells. The isolated antler periosteal cells (AnPC) demonstrated same mesenchyme stem cell (MSC) markers as the pedicle periosteal stem cells (PPC and DPC). However, the fluorescence degree of the markers and the proliferation rate in AnPC were significantly decreased, compared to those of PPC and DPC. The proliferation rates of AnPC also decreased after successive passages. The overall findings may in part explain the weakened regenerative capacity of antler periosteum during antler regeneration. During the cell culture process, the stemness of AnPC, DPC and PPC were gradually increased as the mesenspheres clustered from the monolayer cells by changing the culture medium from DMEM/FBS medium into serum-free MSC medium. Similar phenomenon was also observed in other MSC derived stem cell lineage, accompanied by the recovered regenerative ability [54]. The serum-free MSC medium has been proved to better preserve the function and multi-potentiality of the MSCs, compared to the medium containing FBS [55]. It would be interesting to compare the regenerative capacities of the monolayer periosteal cells to the periosteal mesenspheres in the future study.
In view of the attenuated regenerative capacity of antler periosteum, we hypothesized that the antler periosteum and the pedicle periosteum maintained distinct functions during antler regeneration. Therefore, comparative transcriptional analysis was conducted on AnPC, PPC and DPC. We found that the up-regulated genes of AnPC mainly related to angiogenesis, neuron differentiation and osteoblastogenesis of MSC in intramembranous ossification, whereas the up-regulated genes of the pedicle periosteal stem cells were enriched in the relevant terms of stem cell renewal. Along with the fast growth of antler, the average growth rates of sika deer antler external tissues including blood vessels and nerves can reach up to 1.14 cm/day during antler fast-growth period [17]. Antlers are richly vascularized during growth. The antler arteries regenerate from the pedicle artery stumps, which originate from the branches of the superficial temporal artery [56]. They elongate within the loose connective tissue between dermis and antler periosteum (vascular layer) and extensively branch in tip area, as the arteries begin to curve around the tip of the antler. The arteries branched proximally into the hyperplastic perichondrium to give rise to the ordered parallel array of venous vessels running distal to proximal into the pre-cartilage layer, cartilage layer and bone as the antler elongates [57]. Blood flows into the antler from the arteries distally to proximally and returns via the venous vessels [56, 57]. The significant vascular extension of antler mainly happens in the antler arteries within vascular layer and in the branching venous vessels within the pre-cartilage layer [57]. Morphologically, the arteries of a growing antler are very close to antler periosteum [58].
On transcriptional level, our study detected AnPC expressed large abundance of
angiogenesis promoting genes, including
VEGFA,
NRP1, FOXC2, TGF-
Growing antlers are profusely innervated by solely sensory fibers regenerating from the pedicle sensory nerve stumps, which are derived from the zygomaticotemporal and supraorbital branches of the trigeminal nerve [81, 82, 83, 84]. The newly regenerative antler nerves also elongate within the vascular layer peripherally, following very closely the distribution of antler arteries [11, 81, 83, 85]. The profuse nerve fibers occur in small bundles, projecting from the vascular layer towards more superficial layers of the velvet skin [27, 83]. In antler tip, the nerve fibers follow the route of the artery branches, abundantly locating at the deep connective tissue above the reserve mesenchyme of the antler [83, 86, 87]. The nerve fibers also distribute in subepidermis, perichondrium, but only sparse fibers are seen in the pre-cartilage layer [86, 87]. The antler nerve consists of both myelinated and nonmyelinated fibers [81, 82, 83], with known function as perceiving the environmental stimulus [83, 86] and determining antler size and shape [11, 81]. Denervation of the antler does not affect their regenerative capacity, but the regenerative antlers are significantly smaller and of changed shape. Previous studies identified some of the axon growth promoters that were secreted by arterial smooth muscle [87], pedicle periosteum [58] and velvet skin [88, 89, 90]. In this study, we found AnPC expressed more neurogenesis promoting genes for the first time, including WNT5A, WNT2, SOX11, MATN2, BBS4 and NTN1, etc. Wnts are a family of secreted, lapidated proteins regulating the self-renewal, maintenance, and differentiation of neural progenitor cells during embryonic and adult development of the nervous system [91, 92, 93, 94]. Regarding the Wnt ligands, WNT5A is one of the critical noncanonical endogenous ligands that promote neuronal differentiation of progenitor cells and the neurogenesis as a niche factor during cerebellum [95], cerebral cortex, midbrain [96, 97, 98] and hippocampus development [95, 99, 100]. WNT2 increases dopaminergic progenitor proliferation and neuron development [101]. It also participates in synapse development [102]. The transcription factor Sox11 is another important factor on nervous system development and regenerative transcriptional control program. Sox11 is particularly expressed at high levels in sensory neurons [103, 104, 105], promoting the neuron survival and neurite outgrowth. In vitro culture, Sox11 is also necessary for survival and axonal growth of adult sensory neurons [104]. In addition, Sox11 contributes to retinal ganglion neuronal survival and axon regeneration [106, 107] and peripheral nerve regeneration [105]. Matrilin 2 (MATN2) encodes the adaptor protein of the extracellular matrix, expressed by pre-myelinating Schwann cells during normal development. MATN2 increase neurite outgrowth of dorsal root ganglia neurons and enhances the migration of dorsal root ganglia derived Schwann cells. When peripheral nerves are injured, MATN2 contributes to axon regeneration through promoting axonal growth and cell migration [108]. BBS4 encodes Bardet-Biedl syndrome protein 4 that mainly localizes in the cilium of oligodendrocytes of central nerve system and neurosensory organs [109]. It functions as maintaining the length and quantity of sensory neuron cilium [110]. Netrin 1 (NTN1) is a secreted molecule of the laminin superfamily [111] that is best known for its role in axon guidance [112] and neuronal survival [113]. In this study, the large amount of up-regulated genes relating to neurogenesis strongly demonstrated the important function of the AnPC on promoting nerve regeneration and fast growth.
In addition, up-regulated genes of AnPC were also enriched in Wnt signaling
pathway. This finding is consistent with a previous study,
showing that the activated
In conclusion, we show cultured antler periosteal cells (AnPC) expressed weaker MSC markers and lower cell proliferative potential than pedicle periosteal stem cells (PPSC). These findings may partly explain the weakened regenerative capacity of the antler periosteum, compared to the pedicle periosteum. From comparing the gene expression profiles of AnPC with those of PPSC, we suggest that the AnPC may function as promoting antler fast growth through contributing to the angiogenesis, neurogenesis and intramembranous ossification. Our study will help better understand the important role of antler periosteum during antler regeneration. The selected genes relating to promoting angiogenesis, neurogenesis and intramembranous ossification may be of essential value on the clinical applications in the future.
HS and GW designed the research study. GW, XL, ZW, YW, QG, WS, and LX performed the research. HS provided help and advice on sample extraction and cell culture. TQ and GW analyzed the data. GW wrote the manuscript. SZ provided manuscript review and editing. All authors contributed to editorial changes in the manuscript. All authors read and approved the final manuscript.
The protocol and procedures employed in this study were ethically reviewed and approved according to the Animal Ethics Committee of the Institute of Special Wild Economic Animals and Plants, Chinese Academy of Agricultural Sciences (Permit Number: CAAS2017046C, approved since 22 March 2017).
We thank C. Li for his supports for this study.
This research was funded by the Jilin Province Science and Technology Development Plan Project, grant number 20190201292JC.
The authors declare no conflict of interest.