


1 Laboratoire de Spectrométrie de Masse BioOrganique, IPHC UMR 7178, Université de Strasbourg, CNRS, 67087 Strasbourg, France
2 Infrastructure Nationale de Protéomique ProFI – FR2048, 67087 Strasbourg, France
3 Strasbourg Drug Discovery and Development Institute (IMS), University of Strasbourg, 67000 Strasbourg, France
4 Institut de Cancérologie Strasbourg Europe, 67000 Strasbourg, France
Academic Editor: Sukmook Lee
Abstract
Background: Native mass spectrometry (nMS) approaches appear attractive to complement bottom-up strategies traditionally used in biopharmaceutical industries thanks to their quite straightforward and rapid workflows, especially through online hyphenation of non-denaturing liquid chromatography (LC) to nMS. The present work provides an overview of the state-of-the-art chromatographic tools available for the detailed characterization of monoclonal antibody (mAb) formats, exemplified on the antibody-drug conjugate (ADC) trastuzumab deruxtecan (T-DXd). Methods: T-DXd was first characterized by conventional reversed phase LC (rpLC) and peptide mapping. Couplings of size exclusion chromatography (SEC), cation exchange chromatography (CEX), and hydrophobic interaction chromatography (HIC) to nMS were used to gain further insights into size, hydrophobic, and charge variants of T-DXd and its parental mAb trastuzumab, at intact and middle-up levels. Results: SEC-nMS first offered a direct snapshot of the homogeneous conjugation of T-DXd, with an average drug-to-antibody ratio (DAR) of 8 in agreement with a conjugation on cysteines after reduction of all interchain disulfide bonds. Moreover, SEC-nMS afforded precise identification and quantification of aggregates and fragments. Middle-up level experiments performed after IdeS digestion confirmed that drug conjugation occurs in the Fab region of the mAb, as seen with rpLC. HIC separated two DAR8 species that could not be differentiated by nMS. Although middle-up HIC-nMS proved to be more informative for oxidized forms, the identification of minor variants was still difficult because of poor MS signal quality, showing how the coupling of HIC to nMS remains challenging. Lastly, middle-up CEX-nMS provided accurate determination and localization of post-translational modifications, with several acidic/basic variants within Fab and Fc regions of T-DXd that were also identified by peptide mapping. Conclusions: This study illustrates the strengths and drawbacks of each LC-nMS coupling. By combining SEC-, HIC-, and CEX-nMS, we were able to achieve a comprehensive characterization of T-DXd without extensive sample preparation prior to MS analysis.
Keywords
- native mass spectrometry (MS)
- liquid chromatography (LC)
- size exclusion chromatography (SEC)
- cation exchange chromatography (CEX)
- hydrophobic interaction chromatography (HIC)
- higher order structures
- biotherapeutics
- antibody-drug conjugate (ADC)
Over the last decade, antibody-drug conjugates (ADC) have evolved into promising and efficient therapeutic agents for targeted chemotherapy in cancers, with 11 and 9 ADCs currently approved by the Food and Drug Administration (FDA) and the European Medicines Agency (EMA), respectively, and more than 80 ADCs in clinical studies [1, 2, 3]. ADCs are generated through the conjugation of monoclonal antibodies (mAbs) targeting specifically the tumor-associated antigens (TAAs) of the tumor cell with highly potent cytotoxic drug payloads. Both elements are covalently bound via a cleavable or non-cleavable chemical linker [4]. While first-generation ADCs suffered from insufficient payload potency, high toxicity, and premature drug release [5], the second-generation ADCs (brentuximab vedotin BV, trastuzumab emtansine T-DM1) were designed with more potent payloads, improved linker stability, and lower levels of unconjugated mAbs [6]. Second-generation ADCs presented increased drug conjugation heterogeneity, with mixture of species ranging from 0 to 8 payload/mAb and average drug-to-antibody ratios (avDAR) of 3–4 through conjugation on primary amines of lysine side-chains (T-DM1) or cysteine thiol groups after reduction of the interchain disulfide bonds (BV) [7, 8]. Hence, a third generation of ADCs that are more homogeneous in drug load polydispersity has been developed, yielding improved pharmacokinetics [1, 2, 9, 10, 11, 12].
Among the recently approved ADCs, trastuzumab deruxtecan (T-DXd) consists of the humanized monoclonal anti-HER2 trastuzumab antibody, a cleavable, peptidyl-based linker stable in plasma (GGFG), and a potent topoisomerase I inhibitor payload (DXd, 1034 Da) [13, 14]. T-DXd is used as monotherapy in third line treatment for patients with unresectable or metastatic HER2-positive breast cancer who have previously failed at least two lines of anti-HER2 therapy (trastuzumab/pertuzumab and T-DM1) [15]. T-DXd is produced using a conventional cysteine (Cys) conjugation strategy using a maleimide precursor drug targeting Cys residues of trastuzumab [13]. Briefly, disulfide bonds in the hinge region of trastuzumab are reduced using tris(2-carboxyethyl)phosphine hydrochloride (TCEP HCl), and the precursor drug linkers are added to the reduced mAb, leading to a DAR 8 with homogeneous conjugation, enabling efficient delivery of the payload to targeted cells [13, 16].
The design of more potent and efficient ADC molecules has fostered analytical
method development for their complete in-depth characterization. Generic
chromatographic, electrophoretic and mass spectrometric methods employed either
alone or in hyphenation are central in R&D process (from hit to lead
optimization) [17, 18, 19]. Particular attention has been paid over the past 10 years
to improve the speed and efficiency of analytical characterization throughout the
development process. With recent implementation of native mass spectrometry (nMS)
in R&D biopharmaceutical environments, an urgent need to have robust,
reproducible, and automated liquid chromatography coupled to nMS (LC-nMS) methods
has emerged [19, 20]. Among those, size exclusion chromatography coupled to nMS
(SEC-nMS) has emerged first as an analytical methodology that is appropriate for
accurately quantifying the drug-to-antibody ratio (DAR) on a wide variety of
interchain Cys-linked ADCs, irrespective of the chemotype [21, 22, 23, 24]. Hydrophobic
interaction chromatography (HIC) is also frequently employed for the
characterization of biopharmaceutical products presenting varying degrees of
hydrophobicity. HIC has become the gold standard technique to determine the avDAR
and drug load distribution (DLD) of Cys-ADCs conjugated to hydrophobic payloads.
Optical detection methods are most commonly used in combination with HIC because
coupling to MS is highly challenging due to high ionic strength (
Here we used T-DXd, a last-generation homogenous Cys-ADC with a high DAR, as a model compound to illustrate the potentials of state-of-the-art LC methods coupled to nMS, with a focus on discussions about the benefits and pitfalls of each analytical workflow.
Trastuzumab and T-DXd samples were provided by the Institut de Cancérologie Strasbourg Europe (Strasbourg, France).
For middle-up level experiments, IdeS digestion was performed by incubating one unit of FabRICATOR enzyme (Genovis, Lund, Sweden) per microgram of mAb or ADC for 60 min at 37 °C.
Detailed protocols for peptide mapping and rpLC-MS are available in SI (Supplementary Text 1 and Supplementary Text 2, respectively).
An Acquity UPLC H-class system (Waters, Wilmslow, UK) composed of a quaternary
solvent manager, a sample manager set at 10 °C, a column oven and a TUV
detector operating at 280 nm and 214 nm was coupled to an Orbitrap Exactive Plus
EMR mass spectrometer (Thermo Fisher Scientific, Bremen, Germany) equipped with
an Ion Max source with a heated electrospray ionization HESI probe. 20 and 10
The online 2D HICxSEC-nMS setup has been extensively described elsewhere [28].
The HIC column was a MAbPac HIC-10, 1000 Å, 5
The Synapt G2 HDMS mass spectrometer (Waters, Manchester, UK) was operated in sensitive mode and positive polarity with a capillary voltage of 3.0 kV. The cone voltage and backing pressure were set to 120 V and 6 mbar, respectively, to preserve noncovalent interactions. Source and desolvation temperature were held to 100 and 450 °C, respectively. Desolvation and cone gas flows were 750 and 60 L/h, respectively. Acquisitions were performed in the m/z range of 1000–10,000 with a 1.5 s scan time. Data were analyzed with MassLynx v4.1.
CEX-nMS analyses use the same LC-MS system as SEC-nMS experiments (Acquity
H-Class coupled to the Orbitrap Exactive Plus EMR). The CEX column was a
YMC-BioPro 5
Intact mass analysis in denaturing conditions—Intact-level analysis
consists of measuring the mass of the full mAb/ADC, generally by classical
denaturing reversed phase LC (rpLC) using C8 or C4 columns, coupled to denaturing
MS. As rpLC-MS is implemented in most labs, it can be routinely performed to
provide accurate intact mass measurements. rpLC-MS is particularly well adapted
for mAbs and highly homogeneous ADC formats, but it might be trickier for
heterogeneous ADC [31], or even ADCs partially or completely constituted of
noncovalent assemblies, such as BV [32] or T-DXd. In absence of interchain
disulfide bonds, the light chain bearing one drug (24,472.8
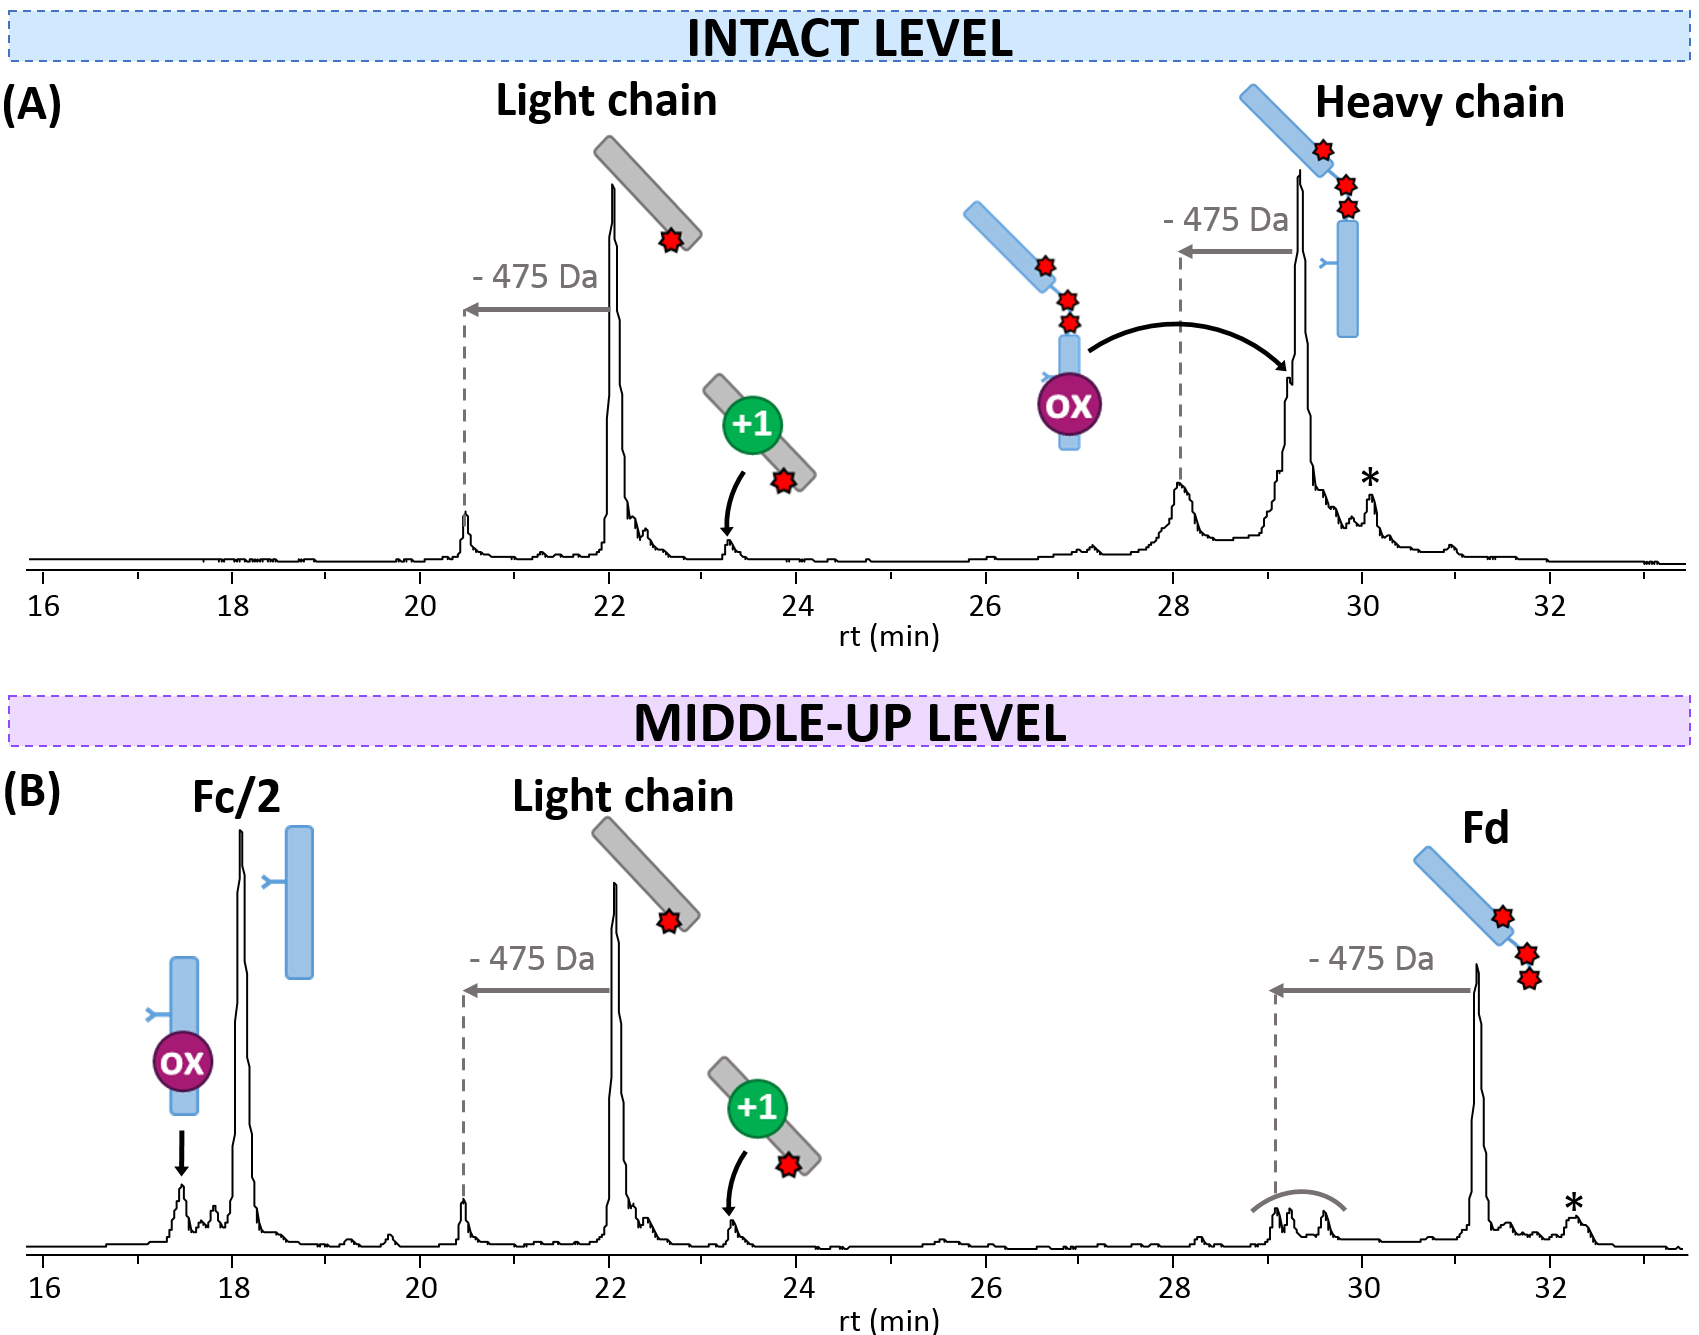 Fig. 1.
rpLC-MS analysis of T-DXd. Chromatograms obtained (A) at the intact level, and (B) at the middle-up level after IdeS digestion. mAb cartoons with colored dots were used to represent the modifications corresponding to each PTM: oxidation (ox, pink) and deamidation (+1 Da species, green). Drugs are represented with red stars. * = loss of 44 Da.
Middle-up level subunit analysis in denaturing conditions—To precise
the localization of drug conjugation and because mass measurements performed by
rpLC-MS are more accurate for lower masses, downsizing of
Bottom-up level peptide mapping analysis—Finally, bottom-up strategies are conventionally used in biopharmaceutical environment to obtain sequence information and localize modification sites [37]. Peptide mapping performed on T-DXd after digestion with two different enzymes (trypsin and pepsin) resulted first in a sequence coverage of 96% for the heavy chain and 100% for the light chain, confirming the primary amino acid sequence. Several post-translational modifications (PTMs) were also detected in both chains (Fig. 2, Table 1). More precisely, the light chain contains two modifications: one methionine oxidation (M4, noted ox), and one deamidation (on residues Q27, N30, Q37, and/or Q38—in particular, N30 is known to be responsible for charge heterogeneity in the parent mAb trastuzumab [38, 39]). The heavy chain comprises five modifications: the formation of pyroglutamate from the N-terminal Glu (E1, called pyroGlu), two methionine oxidations (M83 and M255), an aspartate isomerization (D283, referred to as isoAsp), and the presence of a C-terminal lysine (K450). Of note, no peptide corresponding to the succinimide ring opening (+18 Da on the payload) [40] was detected on the reference compound. Finally, conjugation was confirmed at positions C223, C229, and C232 on the heavy chain, and C214 on the light chain, in agreement with a Cys-conjugation strategy following reduction of interchain disulfide bonds (Fig. 2). Peptides comprising the conjugated Cys residues could be identified with both the intact (1034 Da) and fragmented (–475 Da) payloads, in line with rpLC-MS data.
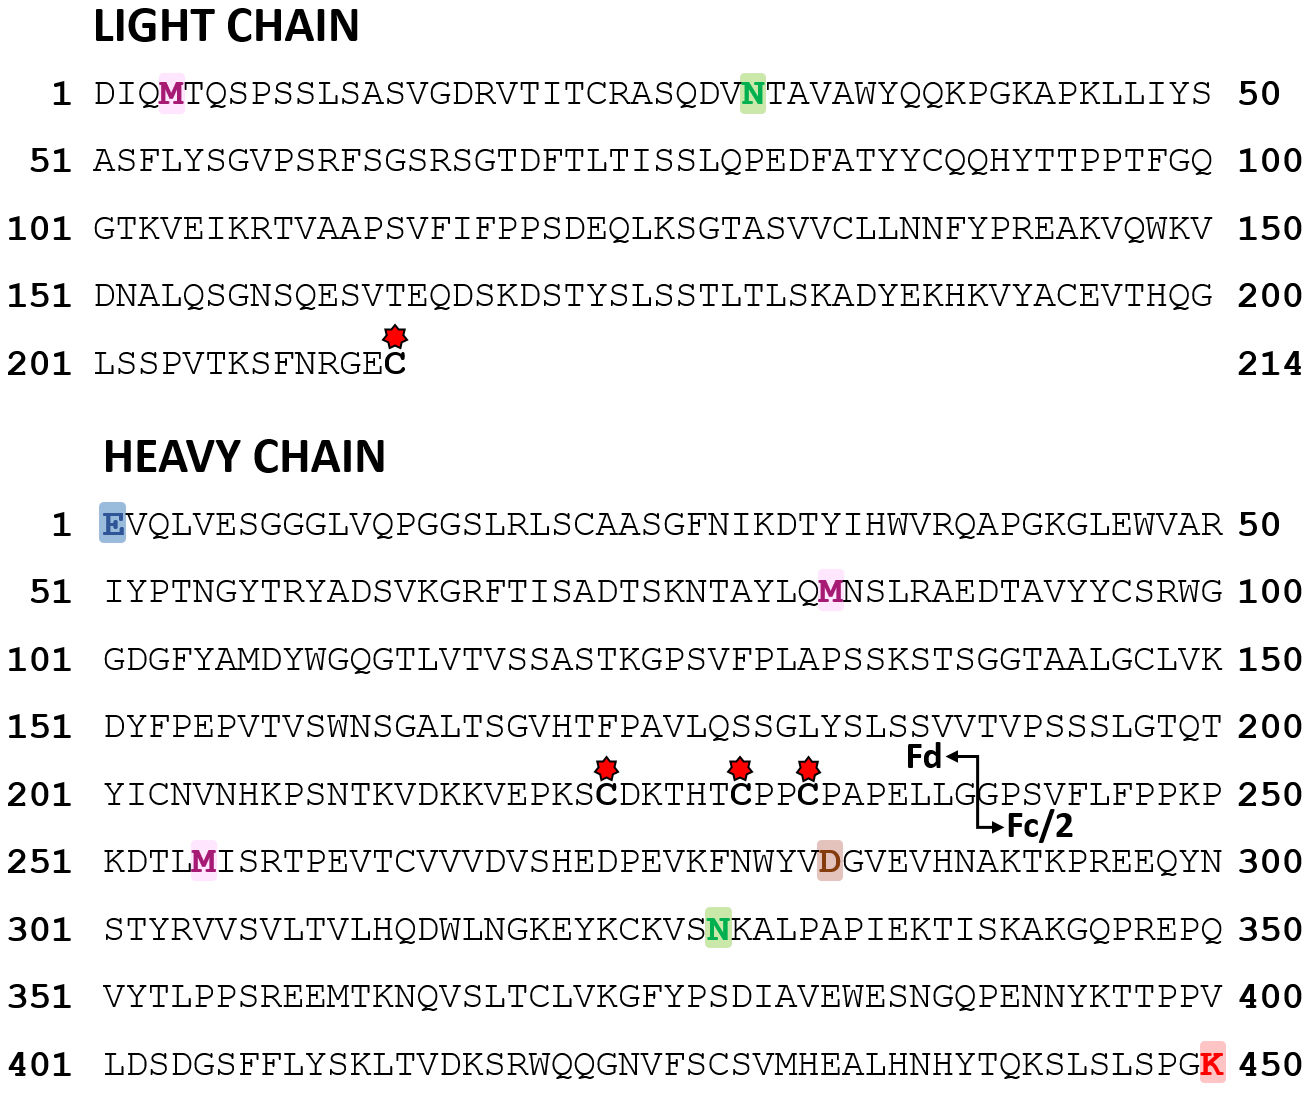 Fig. 2.
Sequence of T-DXd. Modifications identified in peptide mapping are in bold (blue = pyroGlu; pink = oxidation; brown = isoAsp; green = deamidation; red = C-terminal Lys). Drug conjugation sites at cysteine residues are indicated with red stars. The IdeS cleavage is represented by a black arrow.
| Region | Residue | Modification | Peptide | Reference | Stressed |
| Light chain | M4 | Oxidation | DIQMTQSPSSLSASVGDR | 18 |
18 |
| Q27-N30-Q37-Q38 | Deamidation | ASQDVNTAVAWYQQKPGKAPK | 12 |
18 | |
| Fd | E1 | PyroGlu | EVQLVESGGGLVQPGGSLR | 1 |
4 |
| M83 | Oxidation | NTAYLQMNSLR | 9 |
9 | |
| Fc/2 | M255 | Oxidation | DTLMISR | 47 |
49 |
| D283 | isoAsp | FNWYVDGVEVHNAK | 1 |
18 | |
| N328 | Deamidation | VSNKALPAPIEK; VSNKALPAPIEKTISK | ¡1% | 10 | |
| K450 | C-terminal Lys | SLSLSPGK | 23 |
19 | |
| Proportions reported in the two last columns represent the percentage of modified form for each peptide. The color code associated to each PTM is the same for all figures: oxidation = pink; deamidation = green; pyroGlu = blue; isoAsp = brown; C-terminal Lys = red. | |||||
SEC-nMS for size variants analysis—Aggregates (high molecular weight species, HMWS) and fragments (low molecular weight species, LMWS) are critical quality attributes that have to be characterized for ADCs, conventionally by SEC-UV [41]. Data interpretation is thus only based on peak retention times. Recent development of SEC-nMS has paved the way for more accurate, less time-consuming all-in-one HMWS/LMWS assignment along with drug substance characterization [22, 42].
Intact glycosylated T-DXd was thus first analyzed using SEC-nMS. The main peak
corresponds to monomeric T-DXd (peak 2,
| HMWS | Main product | LMWS | ||||
| ① Dimer | ② Monomer | ③Fc-Fab | ④ Fragments | |||
| 312,797 |
G0F-N/G0F | 156,134 |
C223DKT/HTC229 | 106,810 |
Free light chain | 24,473.2 |
| G0F/G0F | 156,339 |
CDK/THTC | 106,924 | |||
| 156,376 |
CD/KTHTC | 107,023 | ||||
| G1F/G0F | 156,501 |
C/DKTHTC | 107,135 |
Dimeric light chain | 48,946.0 | |
| 156,531 |
||||||
| G1F/G1F | 156,664 |
|||||
| Additional species generated upon thermal stress are reported in orange. | ||||||
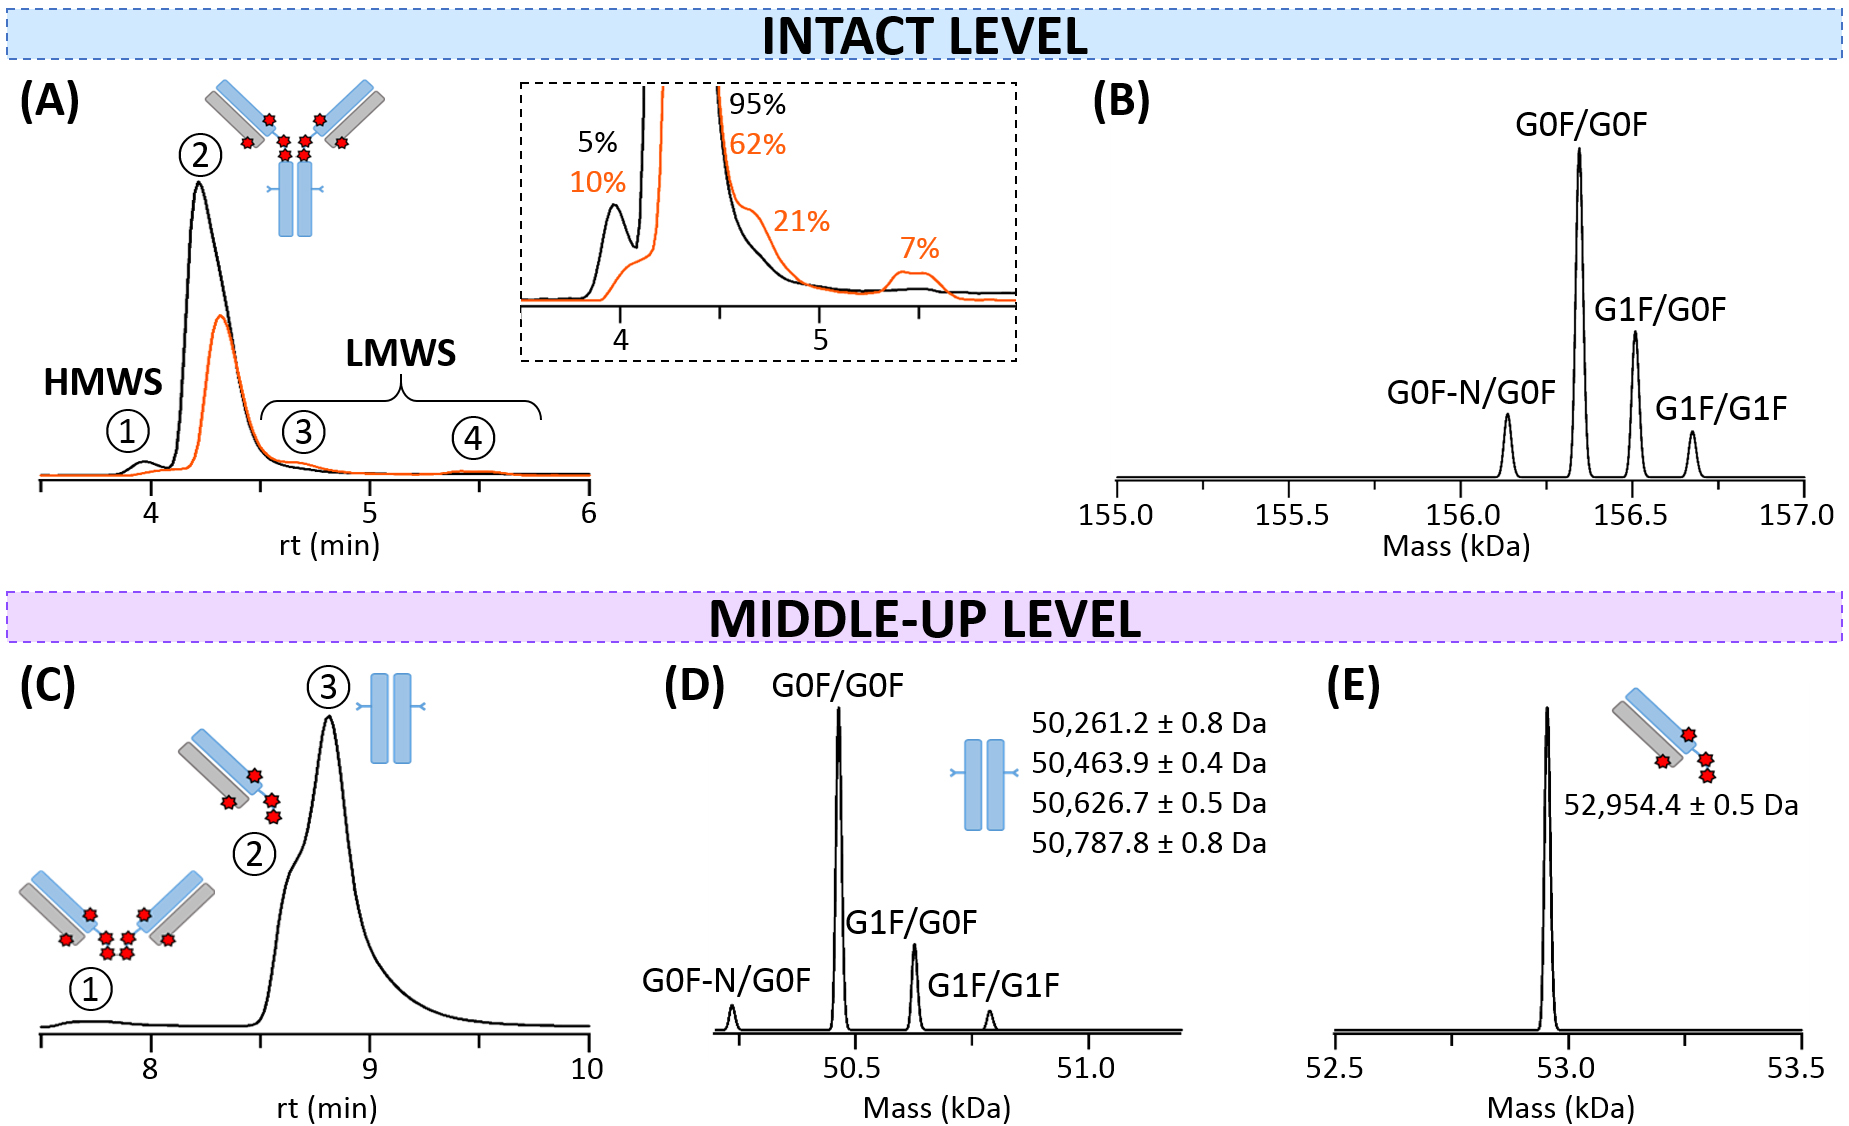 Fig. 3.
SEC-nMS analysis of T-DXd. (A) SEC-UV chromatograms of intact (black) and thermally-stressed (orange) T-DXd. Inset: Focus on minor species and their corresponding relative amounts. (B) Mass deconvolution of the intact monomer (peak 2) for the non-stressed sample. (C) SEC-UV chromatogram of IdeS-digested non-stressed T-DXd. (D) Mass deconvolution of the Fc subunit. (E) Mass deconvolution of the Fab region.
As mass accuracies are superior for lower size analytes, SEC-nMS experiments
were also performed after enzymatic IdeS digestion. Additionally, this approach
enables a more precise overview of the localization of the drugs on the different
parts of the mAb (Fab and Fc). Hence, two major species attributed to Fab and Fc
subunits are partially separated on the SEC column (Fig. 3C). The Fc subdomain
(peak 3) presents a baseline-resolved glycoforms profile without any drug
attached (50,463.9
HICxSEC-nMS for drug conjugation assessment—As HIC is the gold standard for Cys-ADC analysis to assess DLD, we next moved to HIC-nMS analysis of T-DXd using our previously developed bidimensional HICxSEC-nMS methodology [28].
For the naked parent trastuzumab, a unique population corresponding to the
unmodified monomer (148,385
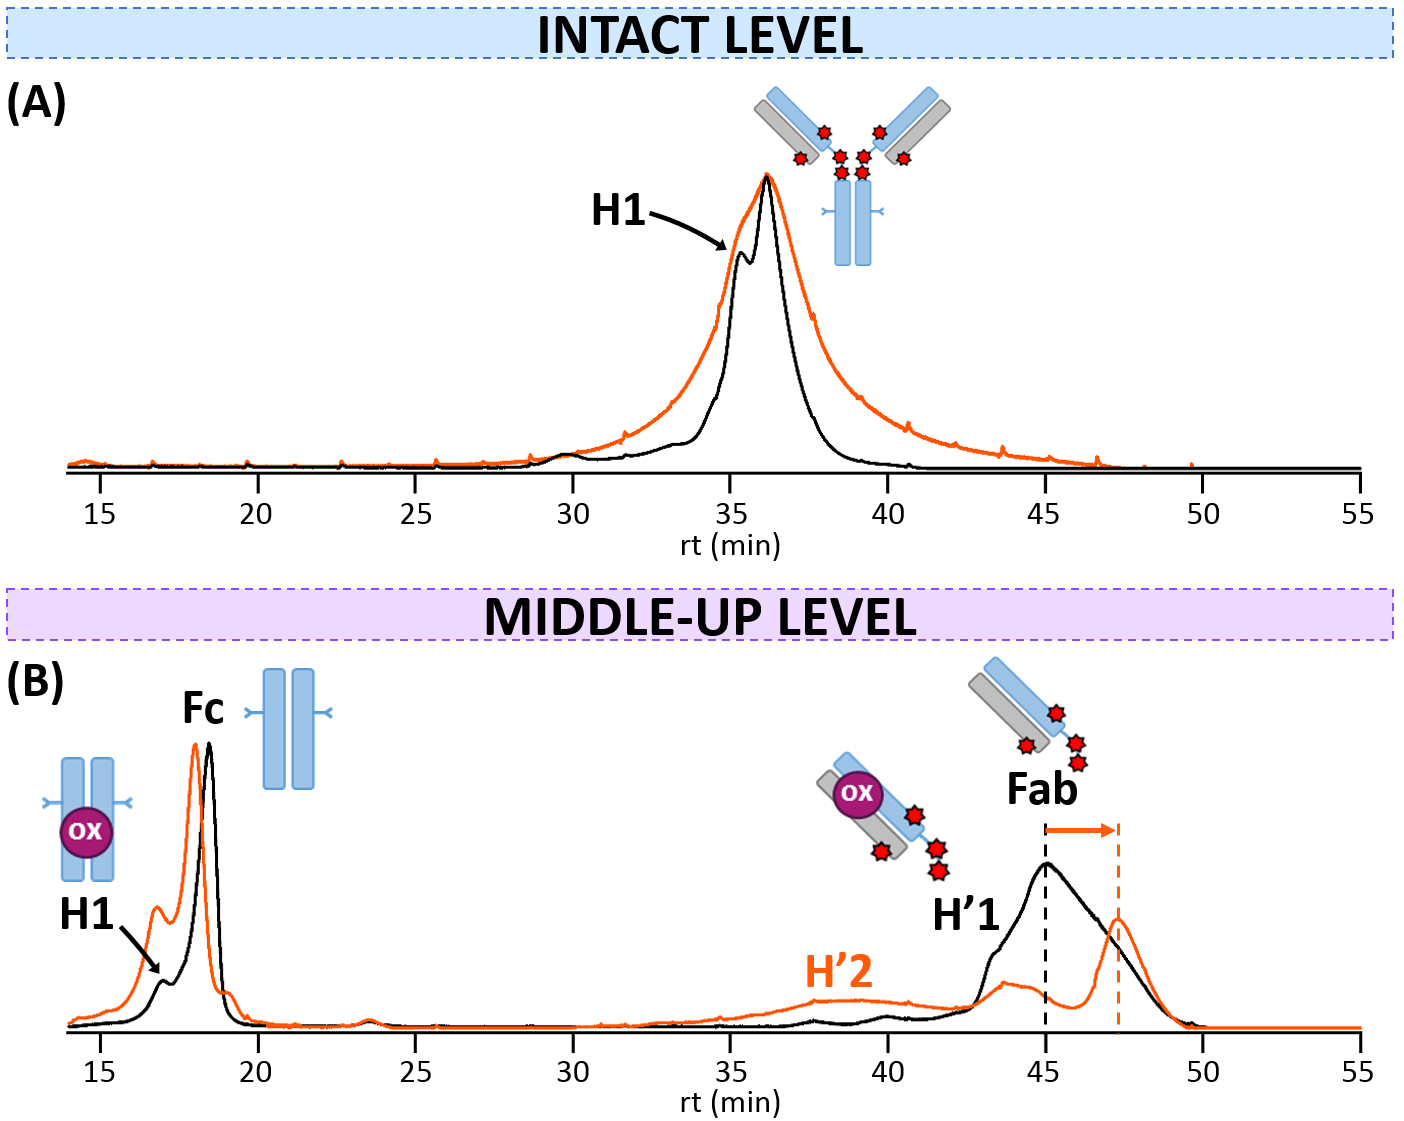 Fig. 4.
HICxSEC-nMS analysis of T-DXd. HIC-UV chromatograms of reference (black) and thermally-stressed (orange) T-DXd obtained (A) at the intact level, or (B) at the middle-up level. mAb cartoons with colored dots were used to represent the modifications corresponding to each charge variant: oxidation (ox, pink).
After IdeS digestion, the HIC profile of T-DXd is more populated compared to the
intact level, as several variants are uncovered for both subunits. The Fc region
elutes first at ~17.9 min (same time as the naked mAb,
Supplementary Fig. 2B), as all hydrophobic drugs retained by the HIC
stationary phase are localized on Fab subunits of T-DXd. Two species are
separated within the Fc region: the major unmodified species (50,466
These results clearly show that the online coupling of HIC separation to nMS remains challenging. For Cys-ADC, it is highly desirable that the separation profile achieved from a HIC-nMS method is comparable to that from more conventional HIC-UV methods, so that valuable information from MS analysis could be directly applied to assist peak assignment and identity elucidation. While our 2D HICxSEC-nMS strategy successfully enabled online coupling of HIC to nMS in an indirect manner but with optimal chromatographic performances, the MS sampling resolution from the HIC separation remains limited by the run time of the second dimension (1.5 min), which happens to be problematic to differentiate species with very close retention times. Additionally, because samples are diluted along elution in the HIC and SEC columns, the intensity of the MS signal may be too low for an accurate determination of variants. Nonetheless, we were able to clearly assign intense hydrophilic oxidized forms, which are particularly amenable to HIC separation as seen with unidimensional HIC-nMS [26].
CEX-nMS for charge variants—We next aimed at analyzing charge variants of T-DXd to provide a more comprehensive analysis of the ADC, with an accurate identification of PTMs. The mAbs generally exhibit a high level of heterogeneity, due to their PTMs and their susceptibility to chemical and physical degradations. Among the chemical degradations, oxidation, deamidation, isomerization, glycation, succinimide ring opening etc., have to be monitored and quantified in the drug substance since those modifications are often related to immunogenic effects, thus impairing patient safety [44].
The first experiments performed on the parental mAb trastuzumab demonstrate the presence of three distinct species (Supplementary Fig. 3A): (i) a major unmodified species, (ii) one acidic variant corresponding to a deamidation, and (iii) a basic variant identified as an isoAsp, in agreement with several already published studies [39, 45, 46, 47]. As T-DXd is derived from a neutral hydrophobic drug (DXd), CEX charge profiles of trastuzumab and T-DXd should be similar under identical experimental conditions. Interestingly, T-DXd presents a different profile characterized by a broad major peak at ~17.9 min (FWHM = 0.45 versus 0.16 min for T-DXd and trastuzumab, respectively) and a poor resolution of separation with substantial fronting (Fig. 5A). This result stems from secondary interactions between the ADC and the stationary phase mainly driven by the hydrophobic interactions with the hydrophobic drugs of T-DXd, thus being detrimental to the quality of the CEX separation [29, 30, 48]. Despite this lack of chromatographic resolution, nMS sensitivity and accuracy enabled the assignment of different species: a major form (M) whose glycoform and drug load profiles are consistent with the one observed in SEC-nMS for T-DXd (see inset in Fig. 5A), two acidic variants comprising one (A1) or two (A2) oxidations, and a basic variant (B1) which may be linked to an isoAsp (Table 3A), all bearing 8 drugs. It is likely that other PTMs are present, but could not be identified due to poorly resolved chromatographic separation. Again, no species with lower DAR values were detected in intact CEX-nMS analysis.
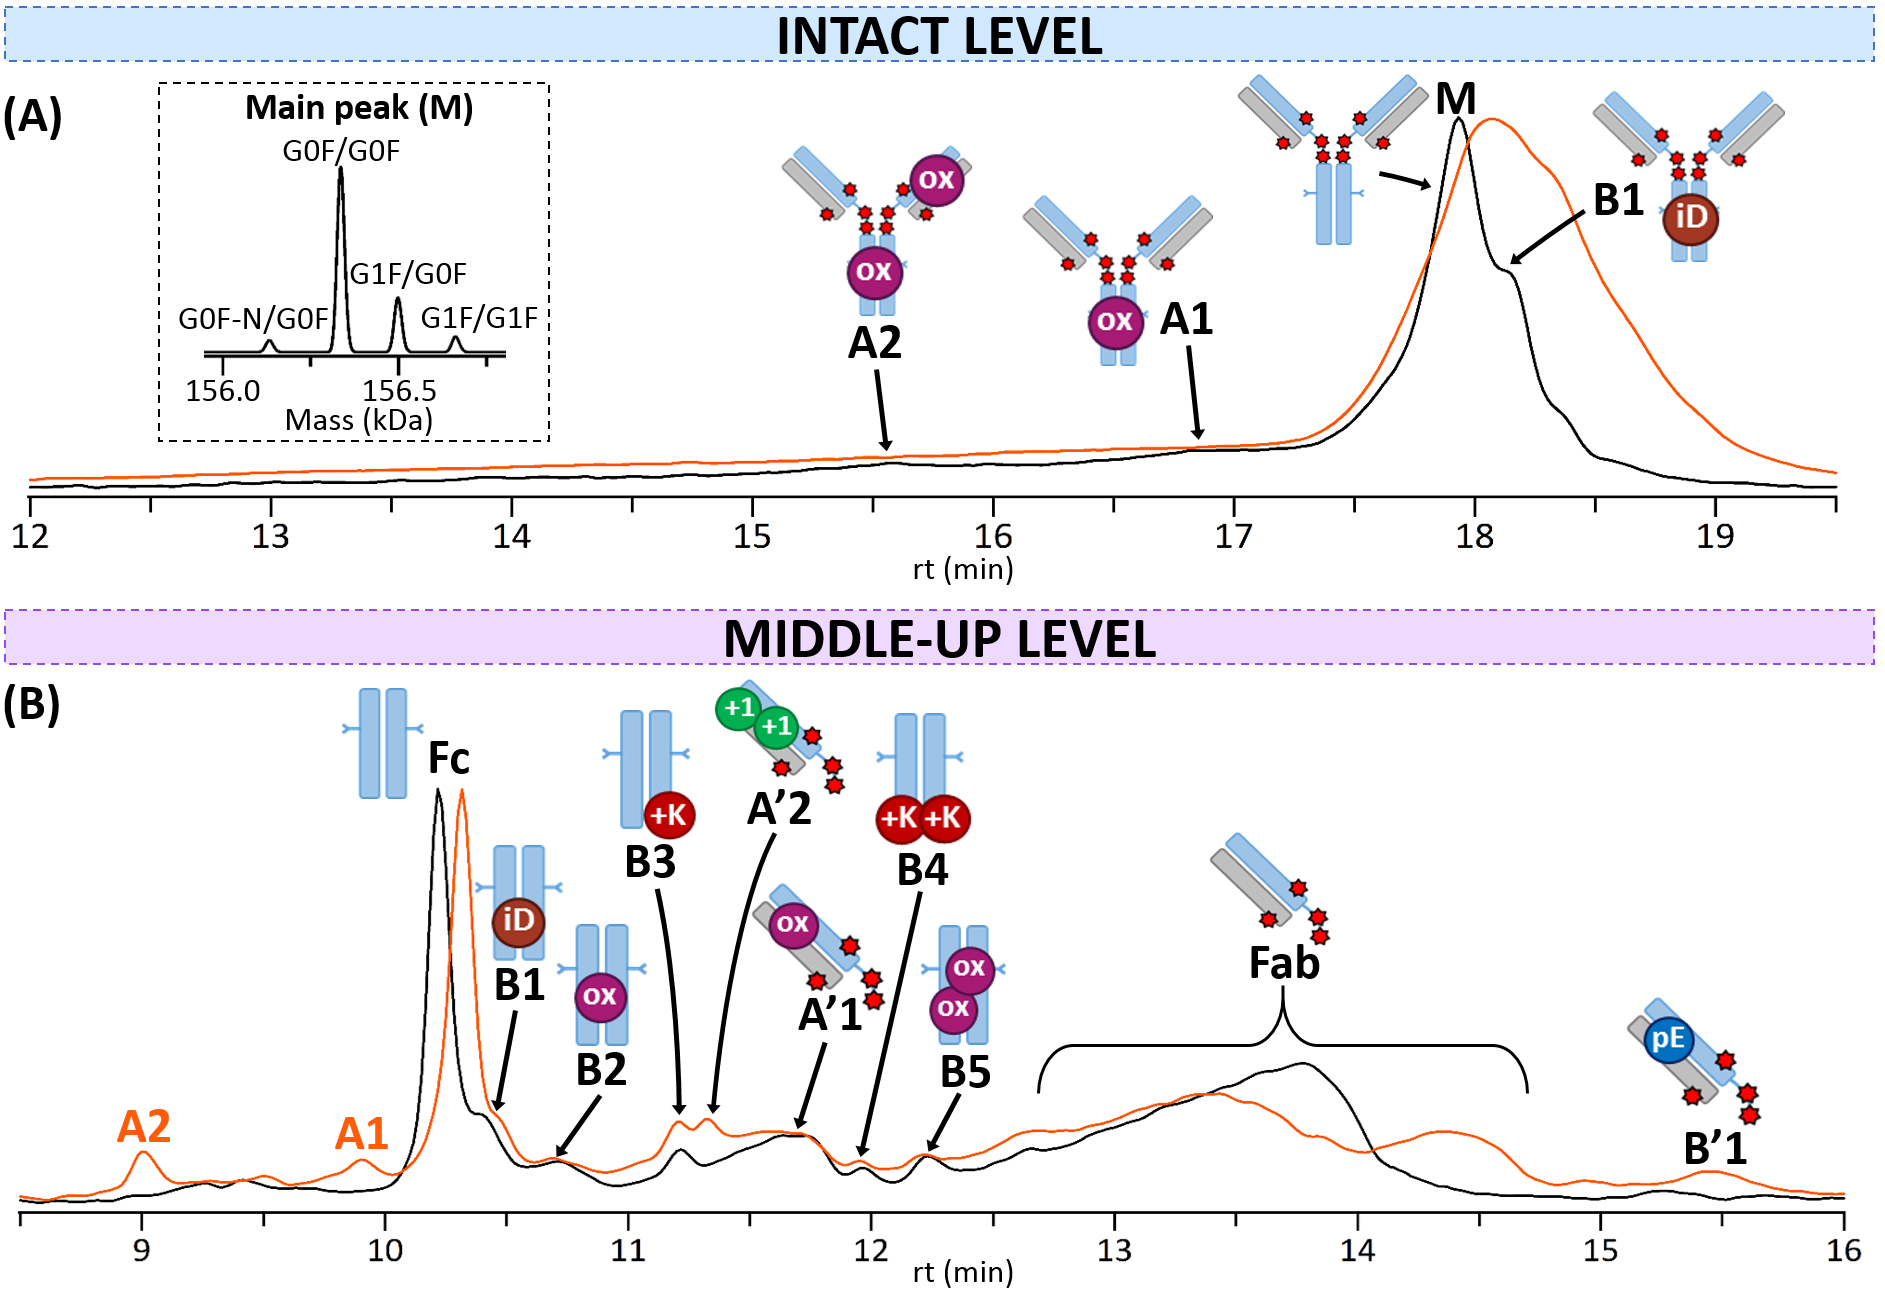 Fig. 5.
CEX-nMS analysis of T-DXd. CEX-UV chromatograms of reference (black) and thermally-stressed (orange) T-DXd obtained (A) at the intact level (inset: focus on MS deconvolution of the main peak M), or (B) at the middle-up level. Acidic variants are indicated with the letter A and basic variants with the letter B. mAb cartoons with colored dots were used to represent the different modifications corresponding to each charge variant: oxidation (ox, pink), isoAsp (iD, brown), C-terminal Lys (+K, red), pyroGlu (pE, blue), deamidation (+1, green).
| (A) INTACT LEVEL | (B) MIDDLE-UP LEVEL | ||||||
| Charge variant | Experimental mass (Da) | Charge variant | Experimental mass (Da) | ||||
| M | G0F-N/G0F | 156,137 |
Fc | G0F-N/G0F | 50,261.2 | ||
| G0F/G0F | 156,339 |
G0F/G0F | 50,463.8 | ||||
| G1F/G0F | 156,499 |
G1F/G0F | 50,625.0 | ||||
| G1F/G1F | 156,661 |
G1F/G1F | 50,787.1 | ||||
| A1 | 1 oxidation | G0F/G0F | 156,353 |
A1 | 1 deamidation | G0F/G0F | 50,465.1 |
| G1F/G0F | 156,515 |
A2 | 2 deamidations | 50,466.3 | |||
| G1F/G1F | 156,678 |
B1 | 1 isoAsp? | 50,464.0 | |||
| A2 | 2 oxidations | G0F/G0F | 156,371 |
B2 | 1 oxidation | 50,480.0 | |
| G1F/G0F | 156,536 |
B3 | +K (C-term) | 50,592.5 | |||
| G1F/G1F | 156,697 |
B4 | +2K (C-term) | 50,720.7 | |||
| B1 | 1 isoAsp? | G0F/G0F | 156,339 |
B5 | 2 oxidations | 50,496.2 | |
| G1F/G0F | 156,500 |
Fab | - | 52,953.6 | |||
| G1F/G1F | 156,660 |
A’1 | 1 oxidation | 52,972.1 | |||
| A’2 | 2 deamidations | 52,955.4 | |||||
| B’1 | 1 pyroGlu | 52,936.0 | |||||
| Additional species generated upon thermal stress are reported in orange. Acidic variants are indicated with the letter A and basic variants with the letter B. For Fc variants, only masses corresponding to the main glycoform (G0F/G0F) are indicated. | |||||||
Overall, both the inherent charge heterogeneity and drug hydrophobicity of the ADC make it challenging to interpret the CEX profile of intact T-DXd, highlighting some limitations of CEX analysis for hydrophobic ADCs. In addition, unambiguous isoAsp (+0 Da) or deamidation (+1 Da) identification is often not achieved at the intact level as mass shifts fall within the margin of measurement error. As a result, PTM assignment strongly relies on associated retention shift (isoAsp = basic variant, deamidation = acidic variant). Thus, middle-up level analyses are generally more adapted for a more precise characterization of charge variants [49, 50].
Analyzing IdeS-digested subunits with CEX-nMS affords clear benefits over
intact-level experiments, providing localization of charge size variants along
with more accurate mass measurements to ease PTM assignment. For trastuzumab, the
middle-up level CEX profile accurately mirrors PTMs observed at the intact level
with a chromatographic resolution comparable to that of intact trastuzumab
(Supplementary Fig. 3B). The deamidations and isoAsp previously
identified at the intact level occur on the F(ab’)
Forced degradation studies are essential for the development of therapeutic proteins to evaluate their stability in different conditions (storage, time, temperature, etc.) [53]. They can also be of interest in analytical method development and validation. In forced degradation conditions, minor species can be either artificially generated or enriched, constituting an interestingly more complex analytical matrix. For therapeutic mAbs, forced degradation studies highlight hot spots or points of fragility of proteins (deamidations, oxidations, aggregation, fragments, etc.) while simultaneously ensuring that the developed analytical methods are able to detect them. We thus thermally stressed T-DXd (15 days at 50 °C) and evaluated our different LC-nMS workflows for the detection of new low amount proteoforms.
Peptide mapping—We first performed classical bottom-up peptide mapping analysis as reference method to precisely identify and quantify PTMs generated in forced degradation conditions. Upon thermal stress, an additional deamidation site is observed within T-DXd, at position N328 on the heavy chain (Fig. 2, Table 1), along with a peptide from the hinge region with succinimide ring opening (222-251 SCDKTHTCPPCPAPELLGGPSVFLFPPKPK). In addition, higher amounts of deamidation on the light chain (+6%), isoAsp (D283 on the heavy chain, +17%) and pyroGlu (E1 on the heavy chain, +3%) were detected (Table 1).
SEC-nMS experiments—SEC-nMS was used first for the identification and
quantification of degradation products. For forced degradation studies, SEC-nMS
experiments are only performed on intact T-DXd, as information on
thermally-generated HMWS and LMWS would be lost upon digestion. Interestingly, a
slight shift in retention time is observed for the monomer (peak 2, 62%), which
might suggest that thermal stress induces a small conformational change of the
ADC. The mass measured for the main monomeric species is strictly identical to
the reference sample (156,339
HICxSEC-nMS experiments—Significant retention time shifts in HIC chromatograms after thermal stress are used as indications to tackle drug deconjugation issues. Forced degradation of T-DXd does not impact the retention
time at the intact level, and mass measurements are still in line with the mAb
bearing 8 drugs (156,504
CEX-nMS experiments—As abovementioned, CEX-nMS experiments are expected to be more informative than HIC for the separation and identification of PTMs. At the intact level, the major peak broadens with a late shift in retention time (peak now centered on ~18.1 min, FWHM = 0.90 min, Fig. 5A). No mass shifts are observed compared to the non-stressed sample, which suggests that the amount of basic variants increases, and/or that a conformational rearrangement happens upon heat exposure, giving access to additional surface charges. The amount of oxidized species does not increase, in line with peptide mapping results. As intact-level CEX analyses of T-DXd are once again not highly conclusive, we moved to middle-level analysis. After IdeS digestion, only few peaks in the CEX chromatographic profile of T-DXd are impacted by high temperatures (Fig. 5B). Among PTMs that are commonly encountered and susceptible to increase upon thermal stress, isoAsp leads to late retention shift, while deamidation induces an early shift in retention time [41]. The Fc region exhibits two newly-generated acidic variants, corresponding to one (A1) and two deamidations (A2, one on each Fc/2) (Table 3B). Based on peptide mapping performed on the stressed sample, the deamidation site is localized at N328. Of note, additional early-eluting species (not shown on the chromatogram) corresponding to free and dimeric light chain were also observed after thermal stress, in agreement with fragments identified with SEC-nMS.
As exemplified by T-DXd, the characterization of biopharmaceuticals is challenging and multiple analytical strategies need to be combined to have a global view of the micro-heterogeneity of mAbs or ADCs. SEC, HIC, and CEX are orthogonal techniques that separate size, hydrophobic, and charge variants, respectively, from the major protein isoform. Advantages and limitations of those techniques are summarized in Table 4.
| Separation based on | Main type of information obtained | LC sensitivity | Ease of coupling to nMS | Advantages | Drawbacks | |
| SEC | Hydrodynamic volume | Size variants | – | ++ | Speed | Sample diluted |
| avDAR | Improved desalting efficiency | Secondary interactions with stationary phase (electrostatic and hydrophobic) | ||||
| DLD | Low injected quantities | |||||
| Amount of unconjugated mAb | Use of volatile aqueous buffers | |||||
| HIC | Hydrophobicity | Hydrophobicity-related PTMs | + | – | Detection of hydrophobic species | High salt concentrations |
| avDAR | Salting out effect | |||||
| Cys-ADC characterization | Separation of DAR species only efficient for ADCs bearing hydrophobic drugs | |||||
| IEX | Net apparent charge | Charge-related PTMs | ++ | + | Highly selective | mAbs/ADCs with high PIs eluted at high salt concentrations |
| May separate conformers if their solvent-accessible charges are different | High-resolution MS recommended for higher confidence in PTM identification | |||||
| pH dependent: Minor changes to mobile phases impact the IEX profile | ||||||
| Secondary interactions with stationary phase (electrostatic and hydrophobic) |
Among these chromatographic methods, SEC is the most straightforward to couple
with nMS. By combining the fast-online desalting and separation capabilities of
SEC with the high mass accuracy of nMS, unambiguous species identification and
drug load quantification can be rapidly achieved without extensive sample
preparation. SEC-nMS provides a direct snapshot of the
heterogeneity/homogeneity of drug conjugation, which makes it particularly
interesting to perform routine analyses on ADCs
to quickly conclude on
conjugation efficiency. For ADCs, performing SEC-nMS at the intact level is
usually enough to provide accurate characterization of the main drug substance
product along with its HMWS and LMWS (including for forced degradation studies),
especially with the recent development of new bioinert SEC columns which afford
better separation and subsequent quantification of all species [43]. Of course,
middle-up level experiments can also be performed to better localize drug
conjugation sites.
We believe that SEC-nMS on intact mAb-based formats is mature
enough to be implemented as first line analysis, providing more information
(HMWS, LMWS, main product) than rpLC-MS within a single analysis in few minutes
(from 5 to 15 min per sample on 3–15 cm SEC columns). New generation of benchtop
ready-to-use LC-MS instrumentations allow automation of all steps of the
analysis, from online sample desalting to nMS analysis, data treatment, and even
reporting. SEC-nMS analysis requires few micrograms of sample to be injected
(limit of detection of 0.1
CEX-nMS is a particularly powerful technique to tackle charge variants, which
ideally complements size variants characterization obtained through SEC-nMS.
Easy-to-use CEX-nMS methods have now been largely described [46]. It is possible
to achieve a straightforward and fast analysis (
Despite the success in SEC- and CEX-nMS couplings, the implementation of a HIC-nMS method remains highly challenging due to the high salt concentration in the mobile phase required for optimal chromatographic separation. As 2D LC setups are required to online-couple HIC to nMS without compromising chromatographic separation, the MS sampling is limited by the run time of the second dimension, thus hampering the differentiation of closely-eluted species separated in the first HIC dimension. Additionally, 2D LC workflows significantly dilute samples along the elution, which can result in low MS intensities that prevent the identification of variants. We thus believe this coupling still requires further method development.
In conclusion, our results clearly highlight the benefits of non-denaturing LC coupled to nMS (especially SEC and CEX) over more conventional rpLC-MS analysis in denaturing conditions for the characterization of Cys-linked ADCs, and more generally for mAb-based products. These methods allow the characterization of the ADC in terms of DLD, avDAR, and the amount of unconjugated mAb (SEC) while providing valuable information about the relative quantification of sequence variants that modify the surface charge (CEX) and/or the apparent hydrophobicity (HIC) of the mAb. Furthermore, aggregation or fragmentation tendencies of these proteins can be also inferred from the combination of SEC with nMS. In spite of the specific limitations associated to each individual technique, the study of T-DXd clearly illustrates the complementarity of these separation methods to provide a complete characterization of the heterogeneous structure of ADCs with high-throughput and avoiding introduction of artifactual modifications that can typically occur when mAb-derived proteins are subjected to enzymatic digestions.
ED, OH-A and SC designed the research study. ED, SE and HD performed the experiments. ED and HD analyzed the data. AD, PC and XP provided samples. ED and SC wrote the manuscript. All authors contributed to editorial changes in the manuscript. All authors read and approved the final manuscript.
Not applicable.
Mass spectrometers were purchased through financial support of GIS IBiSA (Synapt G2 HDMS), Région Grand Est (Orbitrap Exactive Plus EMR), and ProFI (maXis II and Orbitrap Q Exactive Plus). ED acknowledges the French Ministry for Education and Research for funding her PhD. PC, XP, and AD acknowledge the collaboration with Aerocom for this research project.
This study was supported by the CNRS, the University of Strasbourg, the Agence Nationale de la Recherche, and the French Proteomic Infrastructure (ProFI; ANR-10-INBS-08-03), the Interdisciplinary Thematic Institute IMS (Institut du Médicament Strasbourg), as part of the ITI 2021-2028 supported by IdEx Unistra (ANR-10-IDEX-0002), and by SFRI-STRAT’US project (ANR-20-SFRI-0012).
The authors declare no conflict of interest.
Supplementary material associated with this article can be found, in the online version, at https://doi.org/10.31083/j.fbl2710290.
References
Publisher’s Note: IMR Press stays neutral with regard to jurisdictional claims in published maps and institutional affiliations.