
Background: Evidences has showed that procollagen-lysine 2-oxoglutarate 5-dioxygenase 1 (PLOD1) participated in the many cancers’ progression, such as bladder cancer and osteosarcoma. However, its role in gastric cancer (GC) remains elusive. The study, was aimed to investigate the role and of PLOD1 in GC progression and the underlying mechanism. Methods: MTT, Edu and colony formation assays were applied to detect cell viability and clonal expansion ability. TUNEL was used for cell apoptosis detection. Glucose uptake, lactate production, ATP contents, oxygen consumption rate (OCR) and extracellular acidification rate (ECAR) levels were used to reflect aerobic glycolysis level in GC cells. Results: The expression of PLOD1 in GC tissues and cells was higher than that in GES-1 cells. Overexpression of PLOD1 induced a significant enhancement in cell viability and increased glucose uptake, lactate production, ATP contents and ECAR, but decreased cell apoptosis and OCR level in AGS and HGC-27 cells. Knockdown of PLOD1 caused opposite results. In mechanism, the expression of PLOD1 in GC tissues was positively associated with SOX9, HK2 and LDHA levels, and overexpression of PLOD1 increased SOX9, p-Akt/Akt and p-mTOR/mTOR levels. Additionally, overexpression of SOX9 abolished PLOD1 downregulation-mediated inhibition on cell viability and aerobic glycolysis, promotion on cell apoptosis. Moreover, PLOD1 downregulation inhibited tumor formation in vivo. Conclusion: This study showed that PLOD1can promote cell growth and aerobic glycolysis through activating the SOX9/PI3K/Akt/mTOR signaling.
Gastric cancer (GC) has been the fourth most commonly diagnosed malignance and
also the second leading cause of death in cancer patients over the world [1, 2].
Due to the hidden signs, many patients with GC are diagnosed with a metastatic
stage [3]. With the great progress made in treating methods, the 5-year survival
rate of GC patients diagnosed at early stage can reach 90% [4]. However, most GC
cases (
Aerobic glycolysis (also known as “Warburg effect”) is one hallmark of cancer cells, and generally regulated by hexokinase II (HK II), phosphofructokinase-1 (PFK-1), pyruvate dehydrogenase (PDH), pyruvate kinase (PKM) and lactate dehydrogenase (LDHA) [5]. Cancer cells gain energy to meet the metabolic requirements of rapid proliferation of cells through aerobic glycolysis [6]. Furthermore, enhanced glycolysis leads to an acidic microenvironment to make cancer cell easier metastasizing through generating lactic acid [7, 8]. More and more evidence has demonstrated that aerobic glycolysis plays vital roles in GC progression [9, 10]. Targeting cell aerobic glycolysis is a potential method against cancer [11, 12].
It has been suggested that the elevated deposition of collagen plays a vital role in promoting tumor progression through accelerating cancer cell migration and invasion [13, 14, 15]. The PLOD1 gene, located on chromosome 1p36.2–36.3, encodes one enzyme of the procollagen-lysine, 2-oxoglutarate 5-dioxygenase (PLOD) family which takes charge of the hydroxylation of lysine in collagens [16, 17, 18]. The hydroxylysine residues form attachment sites for carbohydrate units following the hydroxylation of lysine in collagens by PLOD1, leading to the enhancement of intermolecular crosslinks stability [19]. These findings suggest that PLOD1 might be involved in carcinogenesis. As expected, studies have shown that PLOD1 is closely involved in cancer progression [20, 21]. For example, PLOD1 was reported to be overexpressed in osteosarcoma and facilitated cancer cell growth and metastasis abilities through decreasing LATS1 phosphorylation and inactivating the Hippo pathway [20]. Regrettably, the role and underlying mechanism of PLOD1 in GC progression still need to be elaborated.
As a member of the SOX families, SRY (Sex determining region Y)-box 9 (SOX9), plays vital roles in regulating stem cell maintenance, neural crest development, sex determination and chondrogenesis [22, 23]. SOX9 has been reported to be upregulated in GC and promotes cancer progression [24]. Furthermore, some evidence have demonstrated that SOX9 is closely related with the pathogenesis of carcinogenesis via activating the PI3K/Akt signaling [25, 26]. Moreover, some work have demonstrated that PLOD1 positively regulates the expression of YAP, which can modulate SOX9 transcription through interacting with TEAD proteins in esophageal cancer cells [20, 27], suggesting that PLOD1 may regulate SOX9 expression and then activate the PI3K/Akt signaling.
The aim of this study is to disclose the role of PLOD1 in the progression of GC, as well as to investigate whether the SOX9/PI3K/Akt signaling is involved.
Twenty-three GC and paracancerous noncancerous tissues were obtained from patients with primary GC who received surgery from January 2011 to January 2014. No patient received radiotherapy and/or chemotherapy before surgery. Experiments using human samples were approved by the Ethics Committee of the The Affiliated People’s Hospital of Ningbo University. Written informed consents were signed by all patients.
Immunohistochemistry (IHC) in GC tissues and the paracancerous normal tissues was carried out according to previous description [28]. In brief, the formalin-fixed, paraffin-embedded GC tissue and para-carcinoma normal tissue sections were cut into 4-
Human GC cell lines SNU-1 and AGS were acquired from the American Type Culture
Collection (Manassas, VA, USA). Human normal stomach epithelial cell line GES-1,
and two GC cell lines MKN-45 and HGC-27 were obtained from Procell (Wuhan,
China). Cells were cultured with RPMI-1640 medium (Thermo Fisher Scientific,
Inc., MA, USA) plus 10% fetal bovine serum (FBS) (Thermo Fisher Scientific), and
kept in a humid cell incubator at 37
Plasmids used to upregulate PLOD1 and SOX9 in GC cells (named as PLOD1 and SOX9,
respectively) were purchased from the GenePharma Ltd. (Shanghai, China), which
were then transfected into cells with Lipofectamine 3000 reagent (Thermo Fisher
Scientific) based on the manufacturer’s instructions. The short hairpin RNAs
(shRNAs) used to downregulate PLOD1 (sh-PLOD1), as well as the negative control
(shNC) were acquired from OriGene Co., LTD (cat no. TL310352V). Cells were
infected with shRNAs and shNC using polybrene (7
Total proteins from tissues and cells were isolated by lysis buffer (Roche,
Shanghai, China) plus protease inhibitor (1%; Solarbio). Protein concentrations
were determined by bicinchoninic acid protein assay kits (Thermo Fisher
Scientific) after centrifugation referring to the specifications. After that, the
protein samples were separated by 10% SDS-polyacrylamide gel electrophoresis,
and then transferred to polyvinylidene difluoride membranes (PVDF; Millipore,
Billerica, MA, USA). Next, the membranes were probed with indicated primary
antibodies overnight at 4
MTT reagent (Sigma-Aldrich) was applied for cell viability detection. In brief,
2
Five hundred GC cells in RPIM-1640 medium containing 10% FBS were placed into
each well of 6-well plates. Following incubation at 37
GC cells (6
The TUNEL assay was carried out with the One Step TUNEL Apoptosis Assay Kit
(Cyanine 3) (Beyotime, Jiangsu, China) to evaluate cell apoptosis in line with
the protocols. In brief, the cells were first fixed in 4% paraformaldehyde for
30 minutes, then were treated with 0.3% Triton X-100 for 5 minutes. Followingly,
cells were probed with TUNEL solution (Beyotime) for 1 hour at 37
After 48 hours of cell transfection, GC and GES-1 cells were collected and stained with Annexin V (FITC) and propidium iodide (PI) reagent (Dojindo Molecular Technologies, Inc.) in line with of the instructions. Then, cell apoptosis was detected on CytoFLEX (Beckman Coulter, Inc.) and analyzed using FlowJo 7.6 software (FlowJo LLC, Ashland, Oregon, USA). The early and late apoptotic cells were separately Annexin V+/PI- and Annexin V+/PI+ cells.
To assess lactate production, GC cells were inoculated at a
density of 3
To assess ATP content, the cells were washed with ice-cold PBS for three times
and then harvested by trypsin digestion, followed by centrifugation (1200 g, 5
minutes). ATP assay buffer (50
Glucose uptake was measured with fluorescent glucose 2-NBDG (Thermo Fisher
Scientific, cat. no.: N13195). GC cells placed into 96-well plates were incubated
with glucose-free medium. The cells were then immersed in
100
ECAR and OCR levels were measured by using a Seahorse XFe96 Extracellular Flux
Analyzer (Seahorse Bioscience, Billerica, MA, USA) with the Seahorse XF
Glycolysis Stress Test kit and Seahorse XF Cell Mito Stress Test kit (Seahorse
Bioscience). In brief, GC cells were placed into Seahorse plates and grown at 37
shNC or sh1-PLOD1 transfected AGS cells (2
Three independent experiments with three replicates except for the animal assay
were performed. Data were presented with mean
First, we compared the expression patterns of PLOD1 in GC cell lines and normal stomach epithelial cell line GES-1 using western blotting. The results revealed that PLOD1 level was significantly increased in GC cells, including SNU-1, MKN-45, AGS and HGC-27, as compared with that in GES-1 cells (Fig. 1A). Then, AGS and HGC-27 with medium expression of PLOD1 among the 4 cell lines were used in the following assays. PLOD1 levels were significantly increased when cells were transfected with PLOD1 vector, while decreased following cell infection with sh1-PLOD1 and sh2-PLOD1 in AGS and HGC-27 cells (Fig. 1B). The sh1-PLOD1 was used in the further experiments as its higher knockdown efficiency than sh2-PLOD1. Cell viability and clonal expansion ability were significantly increased when PLOD1 was overexpressed but decreased with the downregulation of PLOD1, as revealed by the MTT (Fig. 1C) and colony formation assay (Fig. 1D). Besides, overexpression of PLOD1 promoted cell growth and knockdown of PLOD1 inhibited cell growth in AGS and HGC-27 cells (Fig. 1E), as well as in GC SNU-1 cells (Supplementary Fig. 1A) and normal stomach epithelial GES-1 cells (Supplementary Fig. 1C).
Additionally, we explored the effect of PLOD1 on cell apoptosis in GC using TUNEL, flow cytometry and western blotting assays. The TUNEL (Fig. 2A) and/or flow cytometry (Fig. 2B) results showed that PLOD1 overexpression reduced cell apoptosis in AGS and HGC-27 cell lines, while downregulation of PLOD1 resulted in an opposite result in AGS, HGC-27 and MKN-45 cells (Supplementary Fig. 1B). Moreover, PLOD1 increased Bcl-2 expression but decreased Bax and Cleaved caspase-3 expression in AGS and HGC-27 cell lines, and vice versa (Fig. 2C). These results suggested that PLOD1 served as a promoter for cell growth and suppressor for cell apoptosis in GC.
 Fig. 1.
PLOD1 function in GC cell viability. (A) The levels of PLOD1
protein in GES-1, SNU-1, MKN-45, AGS and HGC-27 were measured by western blotting
(n = 3,
 Fig. 2.
PLOD1 inhibited cell apoptosis in GC cells. AGS and HGC-27
cells transfected/infected with control vector, PLOD1, shNC or sh1-PLOD1 were
harvested for the following assays. (A) TUNEL for cell apoptosis test. (B) Flow
cytometry test for cell apoptosis. (C) Western blotting analysis of the protein
levels of Bcl-2, Bax and cleaved caspase-3 (n = 3,
Next, we explored the role of PLOD1 in the process of aerobic glycolysis in GC cells. The glucose uptake (Fig. 3A), lactate content (Fig. 3B), ATP level (Fig. 3C), and ECAR (Fig. 3D) were all increased while OCR was decreased (Fig. 3E) in PLOD1-overexpressed AGS and HGC-27 cells compared to control cells, whereas knockdown of PLOD1 caused opposite results (Fig. 3A–E). In addition, PLOD1 overexpression and downregulation separately increased and decreased the expression of HK2 and LDHA in AGS and HGC-27 cells (Fig. 3F). Moreover, Spearman correlation analysis showed that expression of SOX9 was positively correlated with HK2 and LDHA expression according to the data analysis from TCGA database (Supplementary Fig. 2B,C). These results demonstrated that PLOD1 contributed aerobic glycolysis in GC cells.
 Fig. 3.
The effect of PLOD1 on aerobic glycolysis in GC cells. AGS and
HGC-27 cells transfected/infected with control vector, PLOD1, shNC or sh1-PLOD1
were harvested to detect the levels of (A–C) glucose uptake, lactate production,
and ATP contents using specific kits, and (D,E) ECAR and OCR using a Seahorse
XFe96 Extracellular Flux Analyzer. (F) Western blotting was used to detect the
protein expression levels of HK2 and LDHA (n = 3,
To disclose the mechanism of PLOD1 modulating GC progression, we then explored the relationship between PLOD1 and SOX9/PI3K/Akt signaling in GC. Bioinformatics results from the GEPIA (Gene Expression Profiling Interactive Analysis) database showed that both PLOD1 and SOX9 were upregulated in GC tissues compared to the normal tissues (Fig. 4A), which was verified by the IHC staining (Fig. 4B). The Spearman correlation analysis showed that SOX9 level was positively correlated with PLOD1 level in 23 cases of GC clinical tissues based on TCGA database analysis (Supplementary Fig. 2A) (Fig. 4C). Online Kaplan-Meier Plotter analysis showed that both the high levels of PLOD1 and SOX9 predicted poor prognosis of GC patients (Fig. 4D). Moreover, the GEPIA database analysis demonstrated that high expression of PLOD1 was correlated with lower overall survival rate (Supplementary Fig. 2D).
Next, we explored the effect of PLOD1 on the activation of SOX9/PI3K/Akt/mTOR signaling. Compared with the control group, overexpression of PLOD1 promoted the levels of SOX9, p-Akt/Akt and p-mTOR/mTOR in AGS and HGC-27 cells, and vice versa (Fig. 5A,B). Taken together, the above results revealed that PLOD1 promoted the activation of SOX9/PI3K/Akt/mTOR signaling in GC cells.
 Fig. 4.
PLOD1 level positively correlated with SOX9 level in GC. (A)
GEPIA database analysis of PLOD1 and SOX9 levels in GC cells. (B) IHC staining of
PLOD1 and SOX9 in GC tissues. (C) Spearman correlation analysis of PLOD1 and SOX9
levels in 23 GC tissues. (D) Online Kaplan-Meier Plotter database analysis of the
clinical value of PLOD1 and SOX9 in the overall survival of GC patients
(
 Fig. 5.
PLOD1 activated SOX9/PI3K/Akt/mTOR signaling pathway.
(A) AGS and (B) HGC-27 cells were transfected/infected with control vector,
PLOD1, shNC or sh1-PLOD1 were harvested for analyzing the expression of SOX9,
p-Akt, Akt, p-mTOR and mTOR by western blotting assay (n = 3,
Next, we uncovered the role of SOX9 in PLOD1-involved GC progression. Downregulation of SOX9 inhibited cell viability (Fig. 6A) and cell apoptosis (Fig. 6B,C) compared with PLOD1 singly downregulated AGS cells, but increased levels of glucose uptake (Fig. 6D), lactate content (Fig. 6E), ATP level (Fig. 6F), ECAR (Fig. 6G) except OCR (Fig. 6H). These results illustrated that downregulation of PLOD1 repressed cell growth and aerobic glycolysis through decreasing SOX9 level in GC.
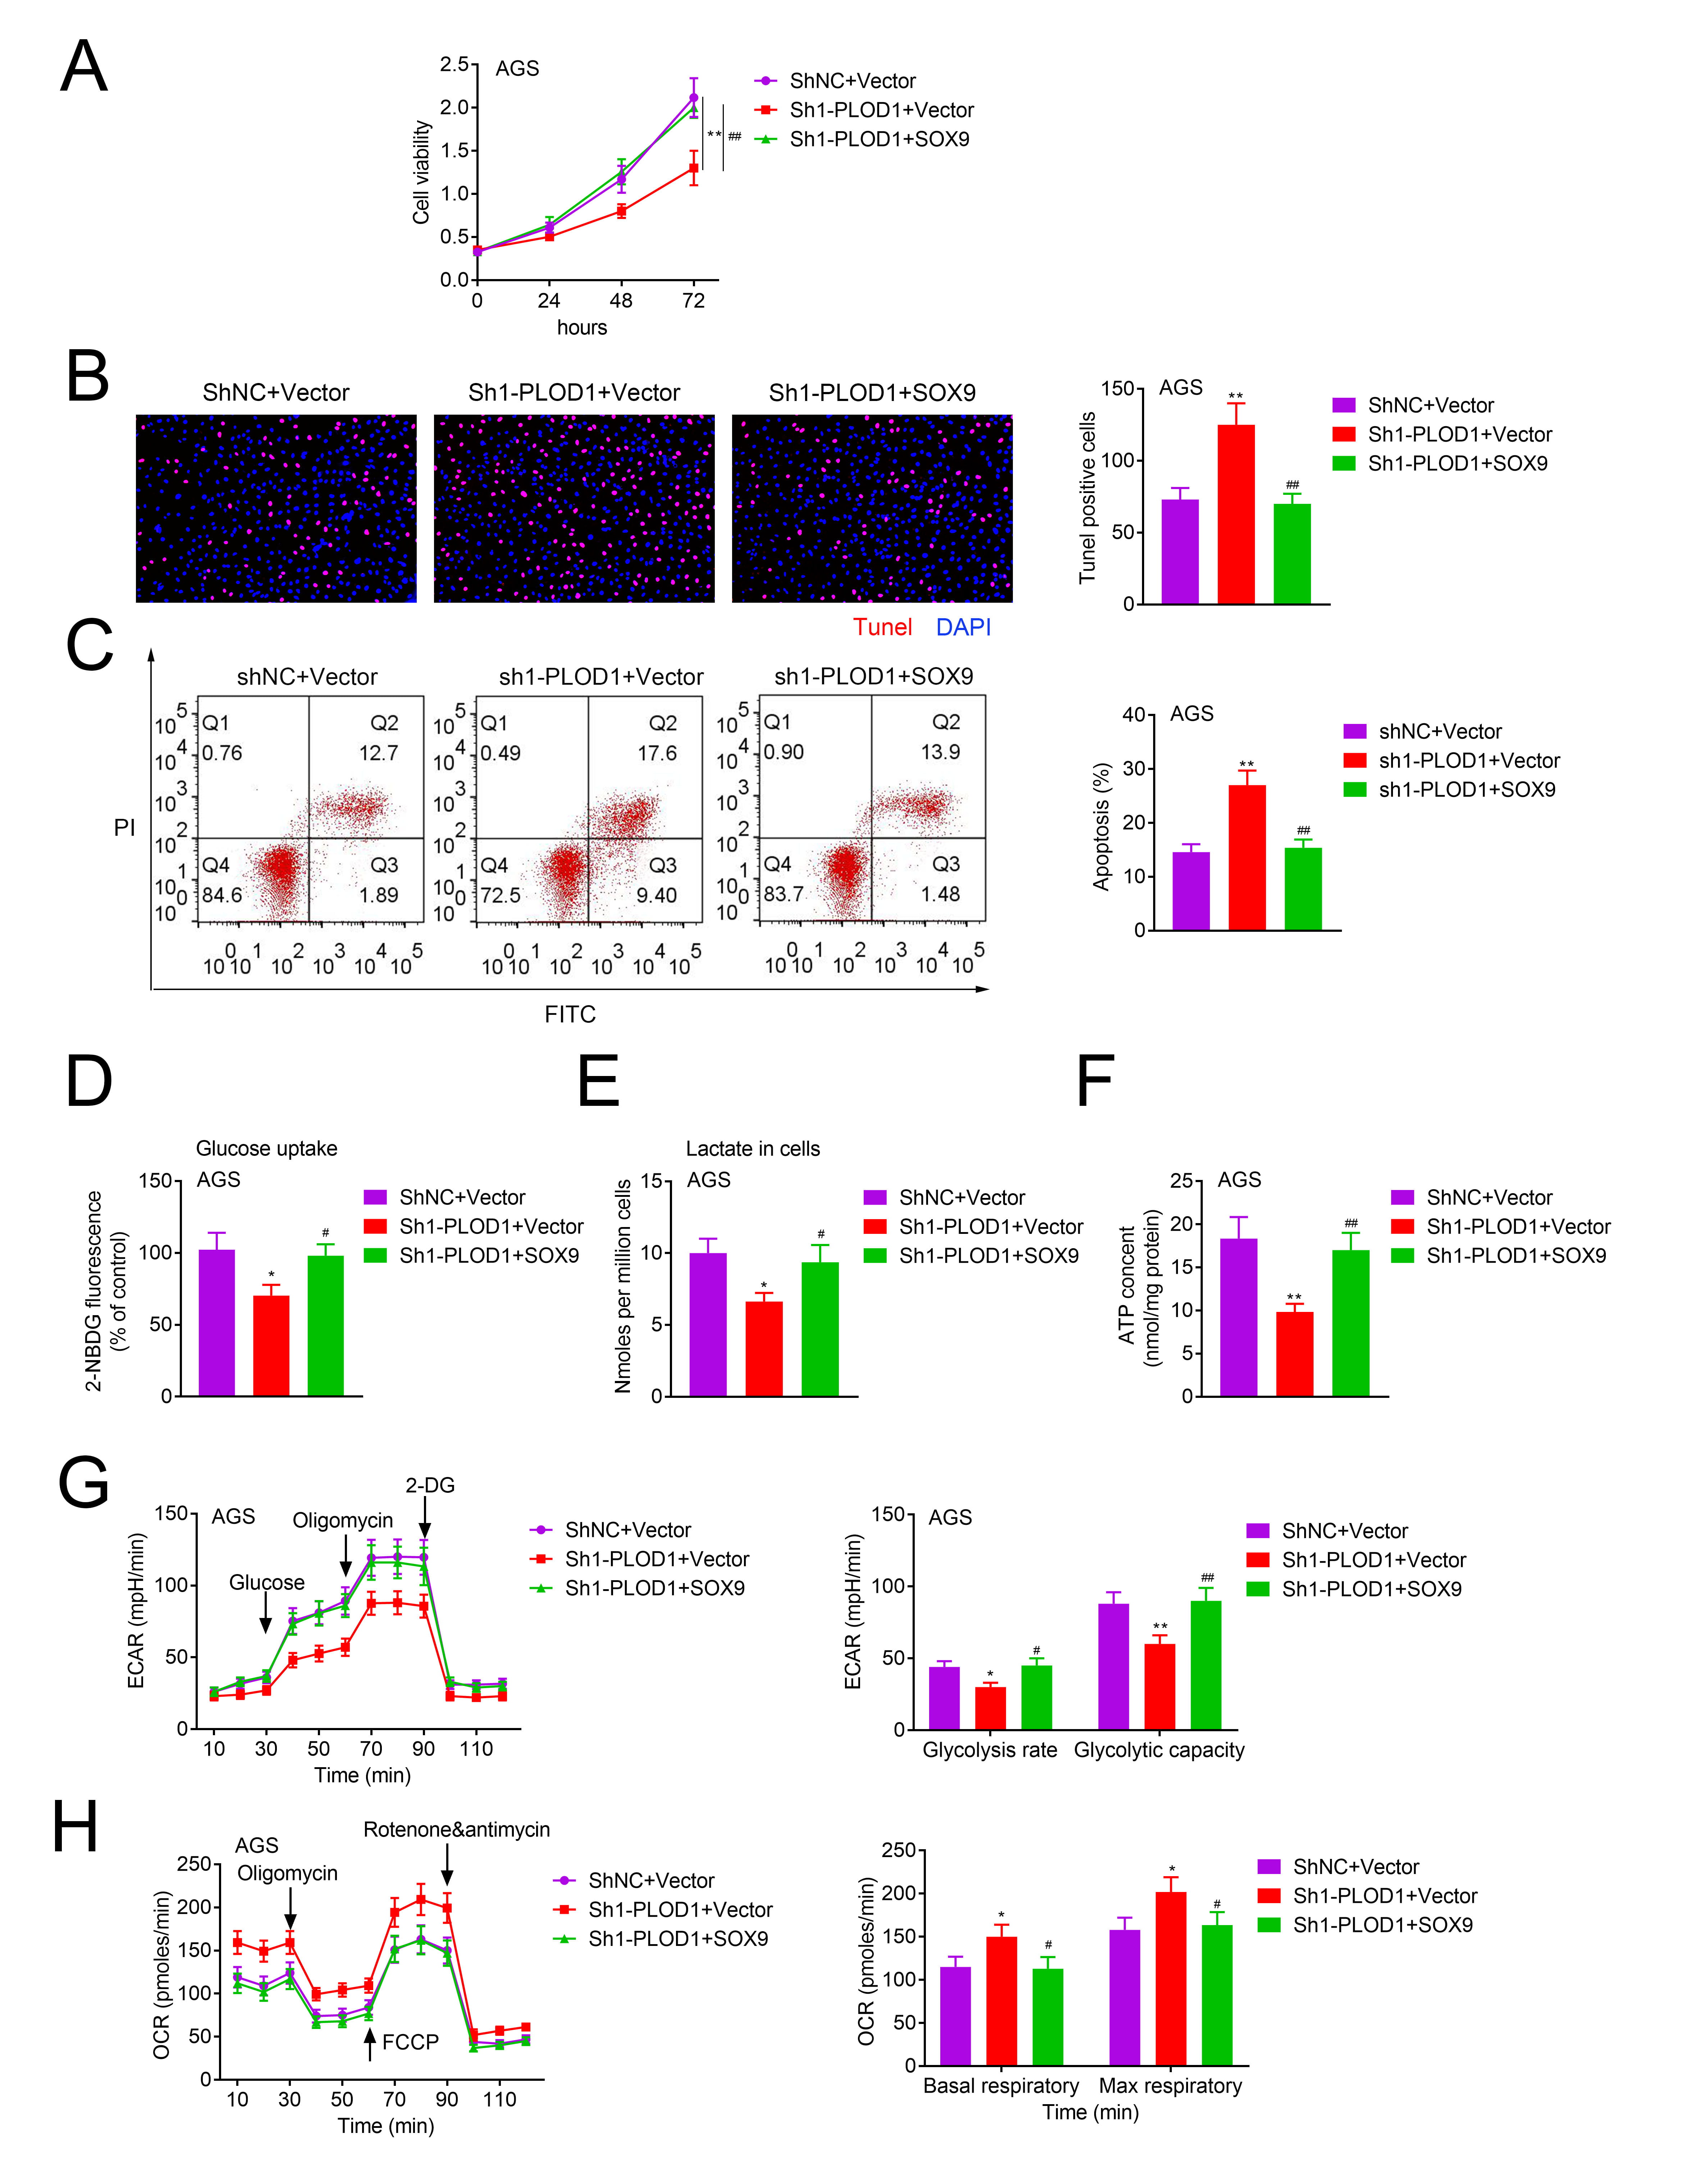 Fig. 6.
The role of PLOD1/SOX9 axis in cell growth, apoptosis and
aerobic glycolysis in GC. AGS cells in shNC + vector, sh1-PLOD1 + vector and
sh1-PLOD1 + SOX9 groups were collected and submitted to the following assays. (A)
MTT for cell growth detection. (B) TUNEL for cell apoptosis test. (C–E) Glucose
production, lactate production, and ATP contents were measured using specific
kits. (F,G) ECAR and OCR were tested by using a Seahorse XFe96 Extracellular Flux
Analyzer (n = 3,
Moreover, we explored PLOD1 function in tumor formation in vivo. The results showed that PLOD1 downregulation inhibited tumor formation leading to decreased tumor volume and weight (Fig. 7A–C). In addition, the expression levels of SOX9, PLOD1 and Ki67 were decreased by PLOD1 downregulation (Fig. 7D). These results indicated that knockdown of PLOD1 inhibits tumor growth in vivo.
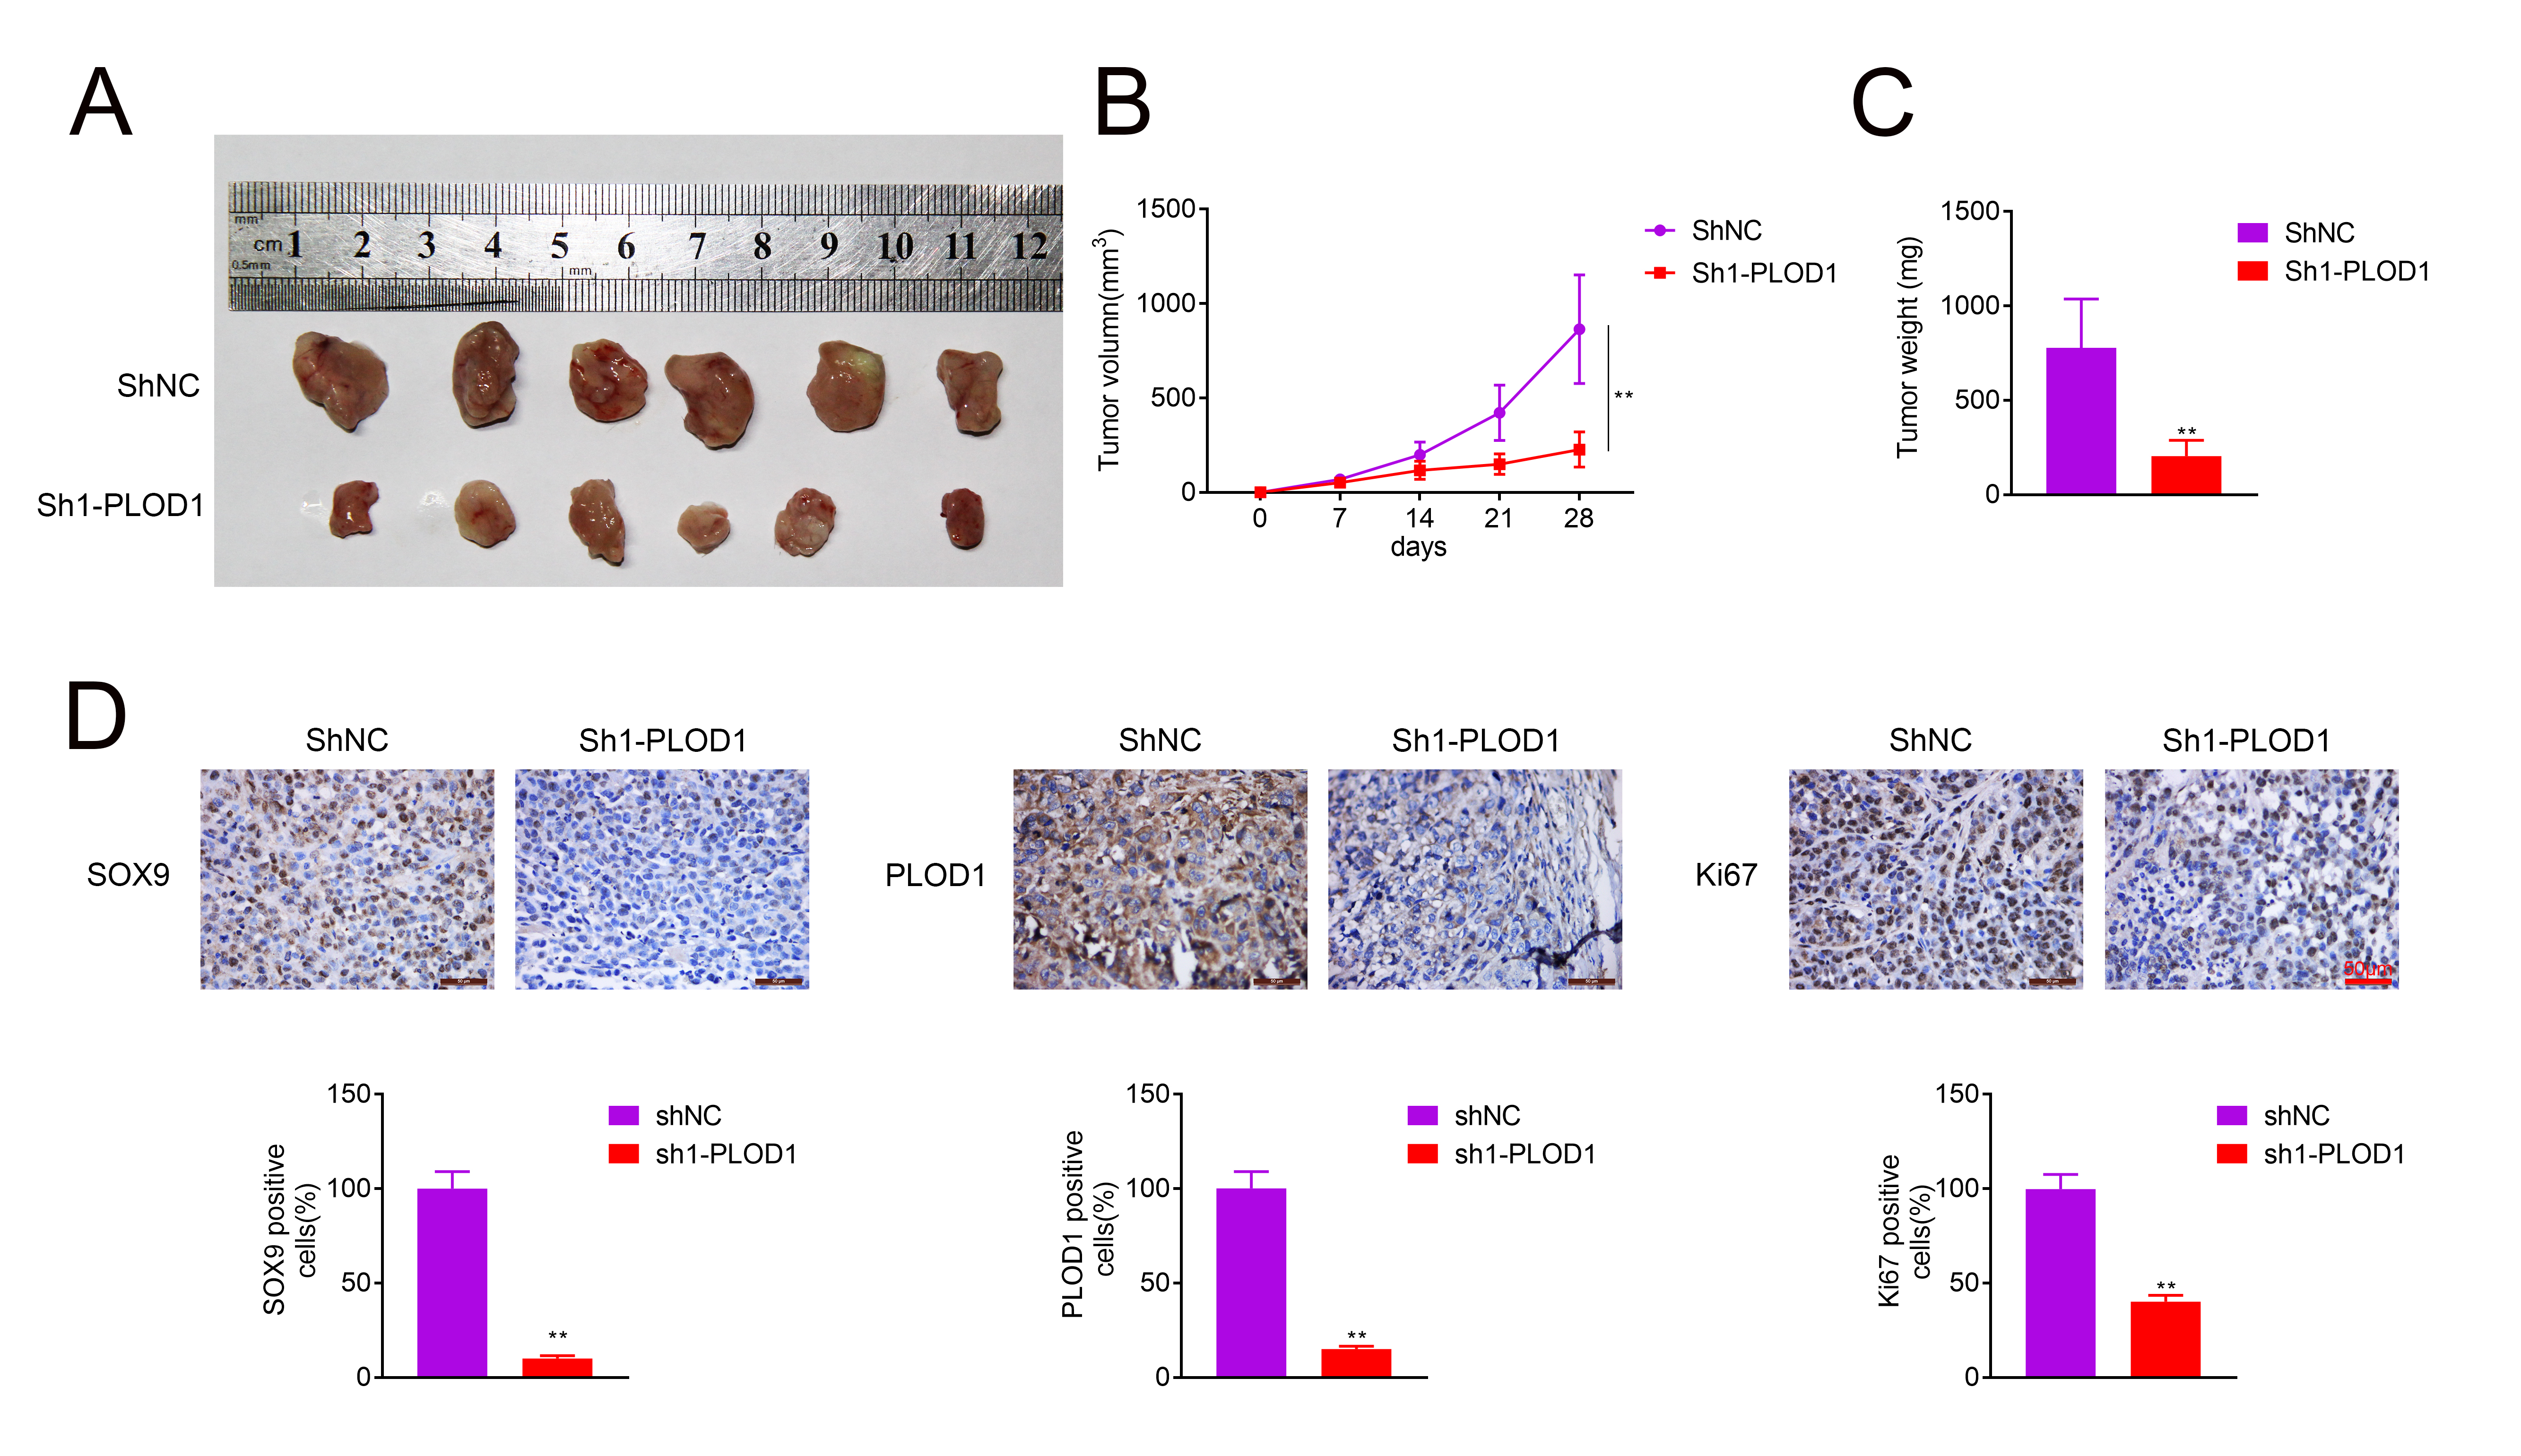 Fig. 7.
Knockdown of PLOD1 repressed tumor growth in vivo. (A)
Tumor morphology in AGS cells formed tumors. (B,C) Tumor volumes and weights. (D)
IHC staining of PLOD1, SOX9 and Ki67 in tumor tissues (n = 6,
Previous study demonstrated that PLOD1 level was elevated in GC tissues and associated with poor prognosis [30]. Herein, we first revealed the role of PLOD1 in the progression of GC. As expected, we found that PLOD1 overexpression significantly promoted GC cell growth and tumorigenesis in vivo and inhibited apoptosis.
Accumulated evidence has demonstrated that PLOD1 was frequently upregulated and functions as an oncogene in various cancers. For instance, PLOD1 level was elevated in bladder cancer, and knockdown of PLOD1 using siRNAs and a specific inhibitor significantly decreased cell aggressiveness, such as promoted cell proliferation, migration, and invasion abilities and inhibited apoptosis in bladder cancer [17]. The expression of both PLOD1 mRNA and protein in clear cell renal cell carcinoma (ccRCC) tissues was significantly higher than that in normal kidney tissues; further studies showed that the increased PLOD1 mRNA level was relate to high pathological grade, advanced tumor stage, shorter progression-free and overall survival rate [31]. PLOD1 expression was increased in osteosarcoma tissues, which was closely linked to distance metastasis and Enneking stage, and worse prognosis; silencing of PLOD1 resulted in obvious inhibitions on cell growth, movement, and invasiveness of MG-63 cells and U-2OS cells [20, 32]. In the current study, we used plasmids and shRNAs to upregulate and downregulate PLOD1 expression in GC cells AGS and HGC-27 with medium expression of PLOD1. To make the result more convincing, we also overexpressed PLOD1 in the lowest expressing SNU-1 cells and normal GES1 cells, and downregulated PLOD1 in MKN-45 cells to explore PLOD1 role in GC progression. The results showed that PLOD1 overexpression significantly enhanced cell growth and inhibited cell apoptosis in vitro in both cancer cells and normal stomach epithelial cell line GES-1, and repressed tumor formation in vivo, indicating PLOD1 served as an oncogene in GC.
It has been well documented that tumor cells can obtain adequate energy through metabolic stress to meet the rapid growth of tumor cells, including GC [33, 34]. Thus, we also explored the role PLOD1 in process of aerobic glycolysis in GC cells through assessing of the function of cells. The results demonstrated that PLOD1 overexpression increased levels of glucose uptake, lactate content, ATP level, ECAR and decreased OCR in GC cells, as well as increased the expression of HK2 and LDHA protein. In addition, PLOD1 expression was positively correlated with HK2 and LDHA expression in GC cases. These results indicated that PLOD1 accelerated aerobic glycolysis in GC. This is the first time to uncover PLOD1’s role in tumor cell metabolism.
In mechanism, we found that PLOD1 level was positively related toSOX9 level in GC tissues, and PLOD1 overexpression increased the expression of SOX9 and p-Akt/Akt and p-mTOR/mTOR. SOX9 is always upregulated in many premalignant tumors and has been widely accepted as a gastrointestinal stem cell marker required for development and lineage commitment [35]. Wu et al. [20] found that PLOD1 positively regulated YAP expression. Moreover, it has been reported that YAP1 directly regulates SOX9 transcription through interaction with TEAD proteins at the SOX9 promoter and induces cancer stem cell (CSC) properties in esophageal cancer cells [27]. Those results suggest that PLOD1 might increase SOX9 expression through upregulating YAP1.
Furthermore, it has been demonstrated that PI3K/Akt/mTOR signaling activated by SOX9 is strongly implicated in GC cell growth and aerobic glycolysis [36]. In the present study, we also explored whether the SOX9/PI3K/Akt/mTOR signaling was involved in PLOD1-meditaed GC progression through rescue experiments. We observed that SOX9 overexpression significantly weakened the effect of PLOD1 downregulation on inhibiting cell growth and facilitating cell apoptosis. The in vivo assay also showed that PLOD1 downregulation inhibited tumor growth in vivo, together with decreased expression of SOX9.
In conclusion, this study demonstrated that PLOD1 served as a promoter for cell growth and aerobic glycolysis through activating the SOX9/PI3K/Akt/mTOR signaling. The PLOD1 might be an effective treatment target for GC.
YZ designed the study, supervised the data collection, YW analyzed the data, interpreted the data, XS prepare the manuscript for publication and reviewed the draft of the manuscript. All authors have read and approved the manuscript.
All procedures performed in studies involving human participants were in accordance with the standards upheld by the Ethics Committee of The Affiliated People’s Hospital of Ningbo University and with those of the 1964 Helsinki Declaration and its later amendments for ethical research involving human subjects (Approval No. 2015-042). All animal experiments were approved by the Ethics Committee of the Affiliated People’s Hospital of Ningbo University for the use of animals and conducted in accordance with the National Institutes of Health Laboratory Animal Care and Use Guidelines (Approval No. 2018-286).
Written informed consent was obtained from a legally authorized representative(s) for anonymized patient information to be published in this article.
Thanks to all the peer reviewers for their opinions and suggestions.
This research received no external funding.
The authors declare no conflict of interests.
All data generated or analyzed during this study are included in this published article.
ECAR, extracellular acidification rate; GC, gastric cancer; HK II, hexokinase II; IHC, immunohistochemistry; LDHA, lactate dehydrogenase; OCR, oxygen consumption rate; PLOD1, Procollagen-lysine, 2-oxoglutarate 5-dioxygenase 1; PDH, pyruvate dehydrogenase; PKM, pyruvate kinase; PFK-1, phosphofructokinase-1; SOX9, SRY (Sex determining region Y)-box 9.