
Red blood cells (RBCs) are exposed to exogenous reactive oxygen species in the circulatory system. To this end, the interactions between the different hemoglobin (Hb) subunits and peroxiredoxin 2, which is a ubiquitous member of the antioxidant enzymes that also controls the cytokine-induced peroxide levels, were assessed. We predicted by the increment of diversity with quadratic discriminant analysis (IDQD) that peroxiredoxin2 (Prx2) could interact with the hemoglobin alpha, beta and gamma subunits but not with the delta subunit. Coimmunoprecipitation (co-IP), electrospray ionization quadrupole time of flight (ESI-Q-TOF) mass spectrometry, Western blotting and X-ray absorption fine structure (XAFS) spectroscopy were performed to verify these predictions. The results showed that Prx2 was a member of the beta-globin immunoprecipitating complex that existed in hemoglobin A, hemolysate-hemoglobin A, hemoglobin A-hemoglobin A2, hemolysate-hemoglobin A-hemoglobin A2 and hemoglobin A2 but not in hemolysate-hemoglobin A2. Adding Prx2 to hemoglobin A altered the second shell of iron embedded in hemoglobin A. Therefore, Prx2 interacts with hemoglobin A (Alpha2Beta2) and hemoglobin F (Alpha2Gamma2) but not with hemoglobin A2 (Alpha2Delta2).
In living cells, biological functions are generally not carried out by individual proteins but by networks of intricate interactions between numerous proteins. Therefore, a deeper knowledge of the functional organization of such networks has crucial significance in understanding the biological activities of proteins (1-3). At present, many experimental techniques have been developed to detect protein-protein interactions (PPIs), such as the yeast two-hybrid-based method, coimmunoprecipitation (co-IP) and far-Western blot analysis (4-6). As most of these experiments are time-consuming and expensive, reliable computational methods need to be developed to predict the PPIs before experimentation. The prediction can improve the experimental efficiency and reduce the upfront costs (7). Several algorithms, such as neural networks (NNs) (8), support vector machines (SVMs) (9) and random forests (RFs) (10), have been reported. Park et al. attempted to identify the interacting partners of a protein by viewing the interactions of evolutionarily related domains that belong to the same structural families of the investigated protein (11). Sprinzak and Margalit put forward another indirect interaction prediction method based on digging out the signature feature related to interactions rather than the domain interaction information from the protein sequences via protein classification (12). The algorithm of the increment of diversity with quadratic discriminant analysis (IDQD), focusing on the recognition of sequence patterns, was proposed by Zhang and Luo in 2003 (13). This algorithm was successfully applied in the recognition of the transcriptional start site (14), intron splice site (13), DNase I hypersensitive site (15), protein classification (16, 17), nucleosome positioning prediction (18-20) and recombination hotspots (21). However, successful cases of protein interaction prediction by IDQD methods have not yet been reported.
Hemoglobin is the ideal protein model for structure and function research. Each hemoglobin molecule contains one pair of alpha globin family chains (including alpha and zeta globin chains) and one pair of beta-globin family chains (including beta, gamma, delta and epsilon globin chains). There are three types of Hb in normal adult RBCs, which are HbA (alpha2beta2, 96%), HbA2 (Alpha2Delta2, 2-3%) and HbF (Alpha2Gamma2, <1%) (22). RBCs are exposed to more oxidative stress than any other cell type due to the abundance of heme iron and oxygen (23). The autoxidation of Hb produces a large number of reactive oxygen species (ROS), which can damage the lipids, proteins and cytoskeleton of the membrane and can decrease the deformability of RBCs if the ROS cannot be cleared in time (24, 25). As a nonnucleated cell, a RBC cannot synthesize proteins by itself; therefore, a series of antioxidant enzymes, such as superoxide dismutase (SOD), catalase, glutathione peroxidase (GSH-Px), and peroxiredoxins (Prxs), have evolved to protect RBCs from oxidative damage and maintain their physiological functions during erythropoiesis (26). Peroxiredoxins (Prxs) are a newly discovered antioxidant enzyme family. Prx2 is the main type of Prx and plays an important role in preventing the damage mediated by ROS in RBCs (27-29). Our previous study (30) and a recent report (31) suggested that Prx2 might interact with Hb; however, the mechanism of the interaction between Prx2 and Hb has not been thoroughly elucidated. In this study, the algorithm of IDQD was applied to predict the interaction between different human Hb subunits. Prx2, co-IP and Western blotting were subsequently used to confirm the prediction results, and X-ray absorption fine structure (XAFS) spectroscopy was used to study the interaction mechanism.
Protein sequences were obtained from the following sources: Hemoglobin subunit alpha (Homo sapiens) (NCBI Reference Sequence: NP_000549.1), hemoglobin subunit beta (Homo sapiens) (NCBI Reference Sequence: NP_000509.1), hemoglobin subunit gamma (Homo sapiens) (Swiss-Prot: P68068.2), hemoglobin subunit delta (Homo sapiens) (GenBank: ABK79072.1) and Peroxiredoxin2 (Homo sapiens) (GenBank: AAH00452.1). The original PPI data of humans used in this work was downloaded from the Database of Interacting Proteins (DIP) (http://dip.doe-mbi.ucla.edu/) (32). The corresponding protein sequence information was extracted from the Universal Protein Resource (UniProt) (33). There were 1,962 protein pairs (involving 1,703 proteins) in both the positive and negative sets. The prediction of PPI was based on protein sequences. A descriptor using a conjoint quintuple (5-mer), which regarded any five continuous amino acids as a unit, was first proposed by us (34). The classification of amino acids and IDQD analysis was introduced in our previous work. The sensitivity (Sn), specificity (Sp), false positive rate (FPR), total accuracy (TA), correlation coefficient (CC), receiver operator characteristics (ROC) and the area under ROC curve (auROC) were used to access the accuracy of the PPI predictions. A three-fold cross-check is combined with the above four indicators, as well as the ROC curve and auROC, to evaluate the predictive power of the IDQD algorithm. The specific method is as follows: The data set is randomly divided into 3 parts, each of which contains an equal amount of positive and negative set data. Two of them were used as training sets, and the remaining one was used as a test set. The rotation was carried out three times in turn, and the average of the various indicators was used to evaluate the model performance.
All the experimental protocols of this study were approved by the Ethics Committee of Baotou Medical College. Fresh, normal anti-coagulated blood was collected from volunteers. Before the blood samples were collected, written consent was obtained from all of the volunteers. Then, the RBC suspensions and hemolysates were prepared in accordance with the approved guidelines (35).
A two percent starch-agarose mixed gel (starch: agarose=4:1) was prepared with 1× TEB buffer (pH 8.6) (36). Eight microliters of RBC suspension and hemolysate were loaded into the gel, and electrophoresis was performed at 5 V/cm for approximately 2 hours. After the electrophoresis, the red bands of RBC-HbA (RA), hemolysate-HbA (HA), RBC-HbA-A2 (RA-A2), hemolysate-HbA-A2 (HA-A2), RBC-HbA2 (RA2) and hemolysate-HbA2 (HA2) were cut out separately and frozen at -80°C for at least 30 min. Before use, the gel was taken out and thawed at room temperature. After centrifuging at 10,000 g for 10 min, the supernatants were pipetted into new Eppendorf tubes and concentrated with Sephadex G25.
Seven microliters of PMSF and 20 μL of agarose conjugate hemoglobin Beta (37-8) (Santa Cruz, sc-21757AC) were added into 700 μL of HA and RA samples, respectively. A negative control was prepared by adding 7 μL of PMSF and 20 μL of agarose conjugated mouse IgG into 700 μL HA and RA solutions, respectively. After incubating the samples overnight at 4°C on a flat platform, they were centrifuged at 10,000 g for 1 min at 4°C. Next, the beads were collected, and the supernatants were removed carefully. The beads were washed with 700 μL 1×PBS (pH 7.4) buffer six times and 0.1×PBS (pH 7.4) buffer one time. Forty microliters of 1× loading buffer was added into each sample, which were then heated at 100°C for 5 min. After centrifuging at 10,000 g for 5 min, the supernatant was ready for SDS-PAGE.
The samples of supernatant (20 μL) prepared by the co-IP complex procedure described above were separated by 5-12% SDS-PAGE (36). After electrophoresis, the gel was stained overnight with 0.08% Coomassie Brilliant Blue G250 and was destained in Milli-Q water until the background staining of the gel was low.
The desired gel bands were excised into 1 mm3 pieces and further destained and digested according to a routine protocol (36). The digested peptide samples were extracted with 50-100 mL of 5% trifluoroacetic acid (TFA) solution at 40°C for 1 hour and later extracted with the same volume of 50% CH3CN/2.5% TFA solution at 30°C for 1 hour. Finally, the samples were extracted ultrasonically with 50 mL of CH3CN solution. The extracted solutions were pooled and dried in a SpeedVac vacuum dryer and resuspended in 3-5 mL of 0.1% formic acid for MS analysis.
The peptide mixture was analyzed on a nanoliquid chromatography tandem mass spectrometry (LC-MS/MS) system, which consists of an Ultimate HPLC system (Dionex) and a quadrupole time of flight (Q-TOF) mass spectrometer (micrOTOF-Q II mass spectrometer, Bruker) equipped with a nano-ESI source. The MS/MS data were processed using Data Analysis 4.0 and then searched against the Swissprot protein sequence databases by MASCOT (http://www.matrixscience.com). The TOF mass analyzer of the instrument was calibrated by using 10 mM Na TFA (pos). For the MS/MS ion search, a peptide charge state of +2, +3 or +4 and peptide/fragment mass tolerance of ±0.1 Da was used. Probability-based MASCOT scores were estimated by comparing the search results against the estimated random match population and reported as −10 × log (P), where P is the absolute probability. The significance threshold was set at P < 0.05.
Twenty microliters of HA, RA, HA2 and RA2 were first separated by 5-12% SDS-PAGE, and then the protein was transferred to the PVDF membrane. The PVDF membrane was subsequently blocked in 5% skim milk for 1 hour at room temperature and then incubated with rabbit polyclonal anti-Prx2 antibody (Abcam, ab86295) at a 1:1000 dilution overnight at 4°C. Next, the membranes were hybridized with anti-rabbit IgG-conjugated horseradish peroxidase (Santa Cruz, sc-2004) at a 1:2000 dilution for 1 hour at room temperature. Finally, the protein signals were detected by the Pierce ECL Western Blotting Substrate and visualized by a Tanon 4200 (Tanon Science & Technology Co., Ltd.).
HA samples were collected from the starch-agarose gel by the freeze-thaw method after electrophoresis of the hemolysate (30). Peroxiredoxin 2 was purchased from Abcam (Abcam, ab8). XAFS experiments were carried out at the National Synchrotron Radiation Laboratory (USRL), University of Science and Technology of China. The XAFS data of the iron K-edge was collected at the U-7C end station in transmission mode. The electron energy in the storage ring was 0.8 GeV, and the ring current was approximately 160 mA. Higher harmonics were reduced sufficiently by detuning the double-crystal Si(III) monochromator at the beam line. The raw data were analyzed by using the NSRLXAFS 3.0 program. The basic EXAFS data, χ (k), was fitted to the following equation:
(1)
and
(2)
where k is the photoelectron wavenumber, S0 is the amplitude reduction factor, Nj is the coordination number of the jth shell, Rj is the distance between the coordination atoms and central atoms in the shell, Fj (π,k), λj and фj are the jth atom backscattering factors, Δσj2 is the Debye-Waller factor, and σj3 is the third cumulant (37).
In our approach, the PPI prediction model was constructed based on the training set. Three training sets and three testing sets were prepared by the sampling method described previously (34). Each training set consisted of 2,616 protein pairs, with half of the protein pairs randomly selected from the data of positive PPI pairs and the other half randomly selected from the negative protein pairs. Each testing set was constructed with another 1,308 protein pairs. Thus, three prediction models were generated for the three training sets of data. The best prediction results are listed in Tab 1, and the ROC curves are shown in Figure 1. The performance of the IDQD modules for the prediction of the PPIs in human samples was trained on different types of tests. The values showed that the performance was at the best threshold (ξ0). The ξ0 of the self-consistency test and the 3-fold cross-validation are –0.45 and –0.08, respectively. The PPI prediction results between each two Hb subunits (Alpha, Beta, Gamma, Delta) and between each Hb subunit and Prx2 (P) were analyzed with an IDQD model. As shown in Figure 2, there were interactions between Beta and Beta, Gamma and Gamma, Beta and Alpha, Alpha and Alpha, P and Beta, Gamma and Alpha, P and Gamma, P and P, P and Alpha, Gamma and Beta, and Delta and Alpha subunits; however, there were no interactions between Beta and Delta, Delta and Delta, Delta and Gamma, or Delta and P subunits.
| Tests | Performance Measures | |||
|---|---|---|---|---|
| Sn (percent) | Sp (percent) | TA (percent) | CC | |
| Self-consistency test | 76.04 | 75.74 | 75.89 | 0.52 |
| 3-fold cross-validation | 64.22 | 64.68 | 64.45 | 0.29 |
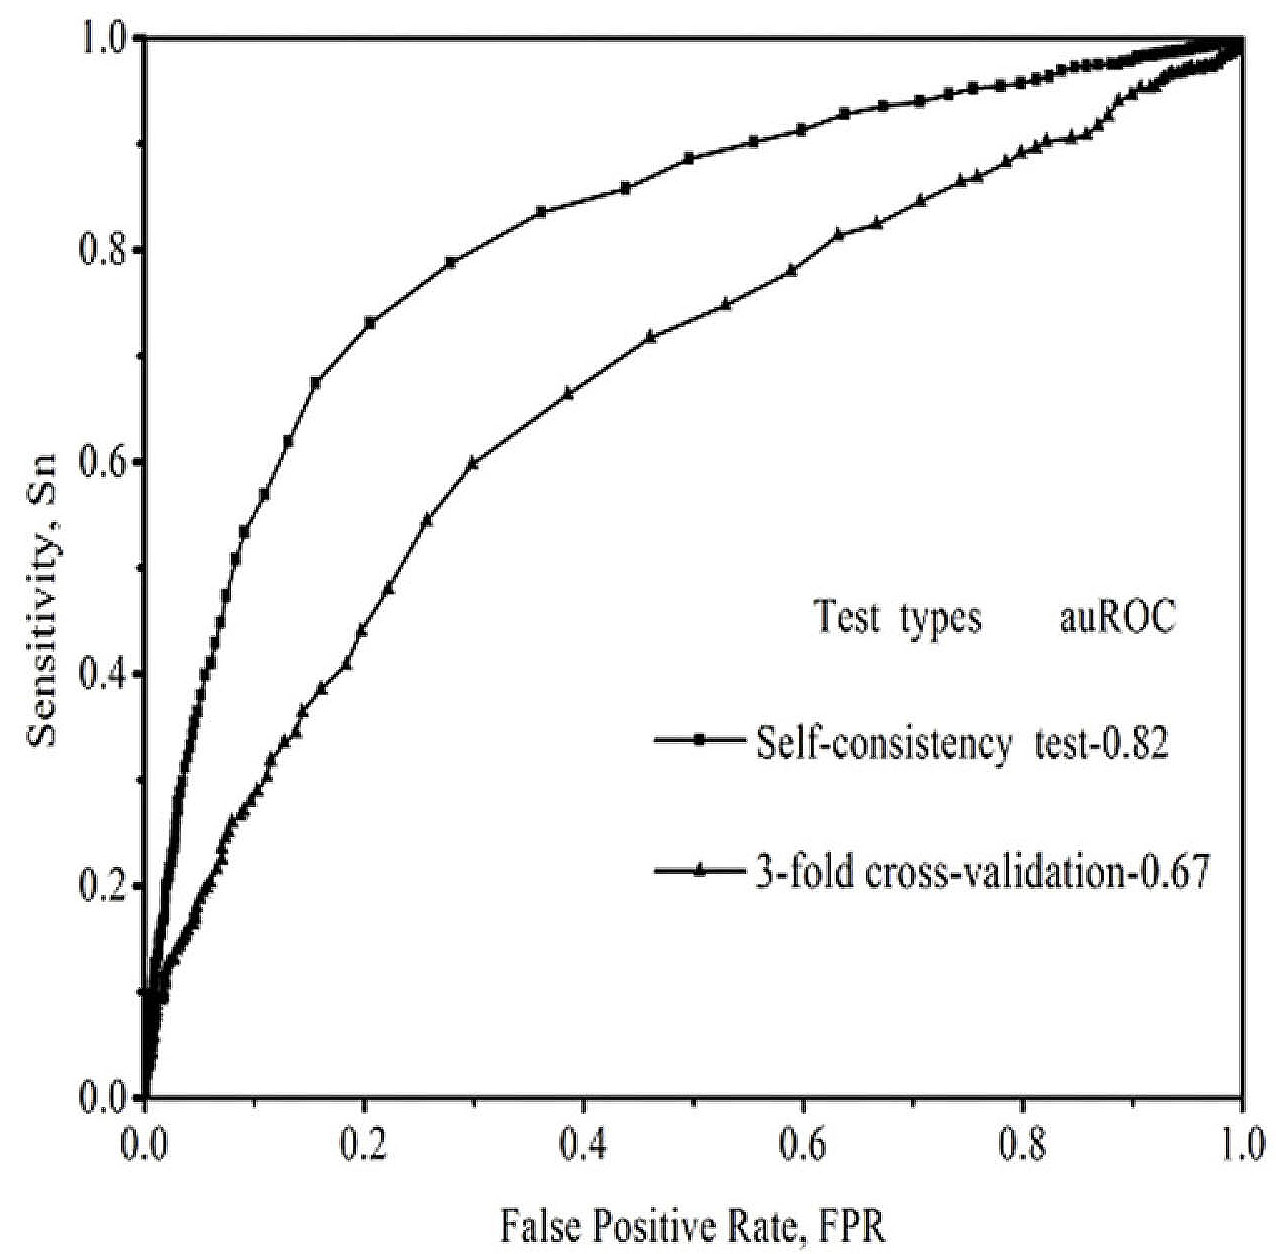 Figure 1.
Evaluation of the performance of IDQD models. ROC curves for IDQD model were plotted for the self-consistency test and the 3-fold cross-validation test. A mean auROC of 0.82 was obtained in the self-consistency test, while a mean auROC of 0.67 was obtained in the 3-fold cross-validation experiment.
 Figure 2.
IDQD prediction results of PPI between Hb subunits (Alpha, Beta, Gamma, Delta) and Prx2 subunit. The scores were calculated by deducting -0.45, which is the threshold value (ξ0), from the performance values between every two subunits. A positive score represents a positive interaction, while a negative score represents a negative interaction.
Hb subunits have been reported to interact with each other (38-47). To assess the predictive accuracy of the IDQD model, the predicted results of the Hb subunits were compared with the reported experimental results (Tab 2). The total predictive accuracy is 80% (the interactions of BetaBeta, GammaGamma, AlphaBeta, AlphaAlpha, AlphaGamma, AlphaDelta, BetaDelta and DeltaGamma are correct, but those of BetaGamma and DeltaDelta are incorrect), and this result demonstrates that the accuracy of the algorithm for the PPI prediction is good. The interactions between the Hb subunits (Alpha, Beta, Gamma, Delta) and Prx2 were then analyzed by this algorithm. The results showed that Prx2 had interactions with the Alpha, Beta and Gamma subunits of Hb but had no interaction with the Delta subunit (Figure 2). These results indicate that Prx2 should interact primarily with HbA, which consists of Alpha and Beta subunits.
| Classification | Predicted interactions | Proven interactions (38-47) |
|---|---|---|
| Positive interactions | BetaBeta, GammaGamma, AlphaBeta, AlphaAlpha, AlphaGamma, BetaGamma, AlphaDelta | BetaBeta, GammaGamma, AlphaBeta, AlphaAlpha, AlphaGamma, AlphaDelta, DeltaDelta |
| Negative interactions | BetaDelta, DeltaDelta, DeltaGamma | BetaDelta, BetaGamma, DeltaGamma |
The interaction between HbA and Prx2 predicted by IDQD was confirmed by co-IP. Co-IP was performed with anti- beta globin antibody to pull down the interacting complex of HbA from HA and RA samples. HA and RA represent the HbA band of the hemolysate and red blood cell samples during starch-agarose mixed gel electrophoresis, respectively (Figure 3). The immunoprecipitating complexes were separated by 5%-12% sodium dodecyl sulfate polyacrylamide gel electrophoresis (SDS-PAGE) (Figure 4). Five protein bands were pulled down by the beta-globin antibody from both the HA and RA samples. These five bands were subsequently cut out, digested, and detected by ESI-Q-TOF. The MS detection results showed that the ~52 kD, ~22 kD and ~16 kD bands were the immunoglobulin heavy chain, Prx2 and beta subunits of hemoglobin, respectively (Tab 3). Thus, Prx2 was confirmed to be a composite component of the beta-globin immunoprecipitating complex. However, the detection results of the ~20 kD and ~30 kD bands were not satisfactory, so they could not be identified in this study.
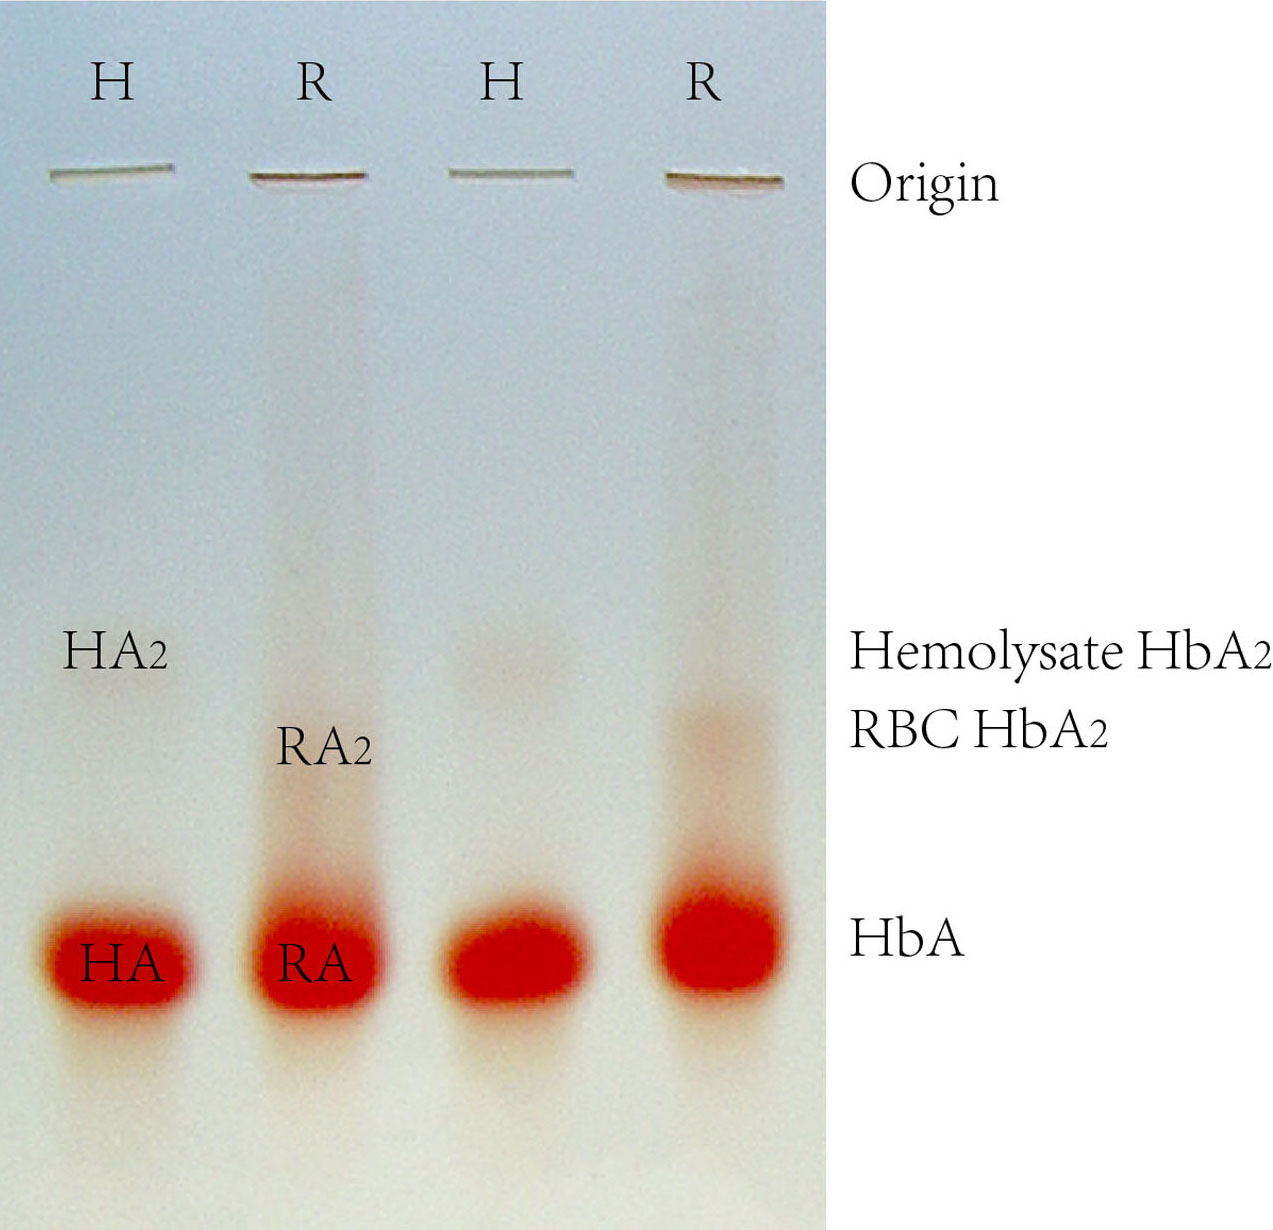 Figure 3.
Starch-agarose mixed gel electrophoresis of human Hb. H represents a hemolysate sample, and R represents a RBC sample. HA represents hemolysate-HbA, RA represents RBC-HbA, HA2 represents hemolysate-HbA2, and RA2 represents RBC-HbA2.
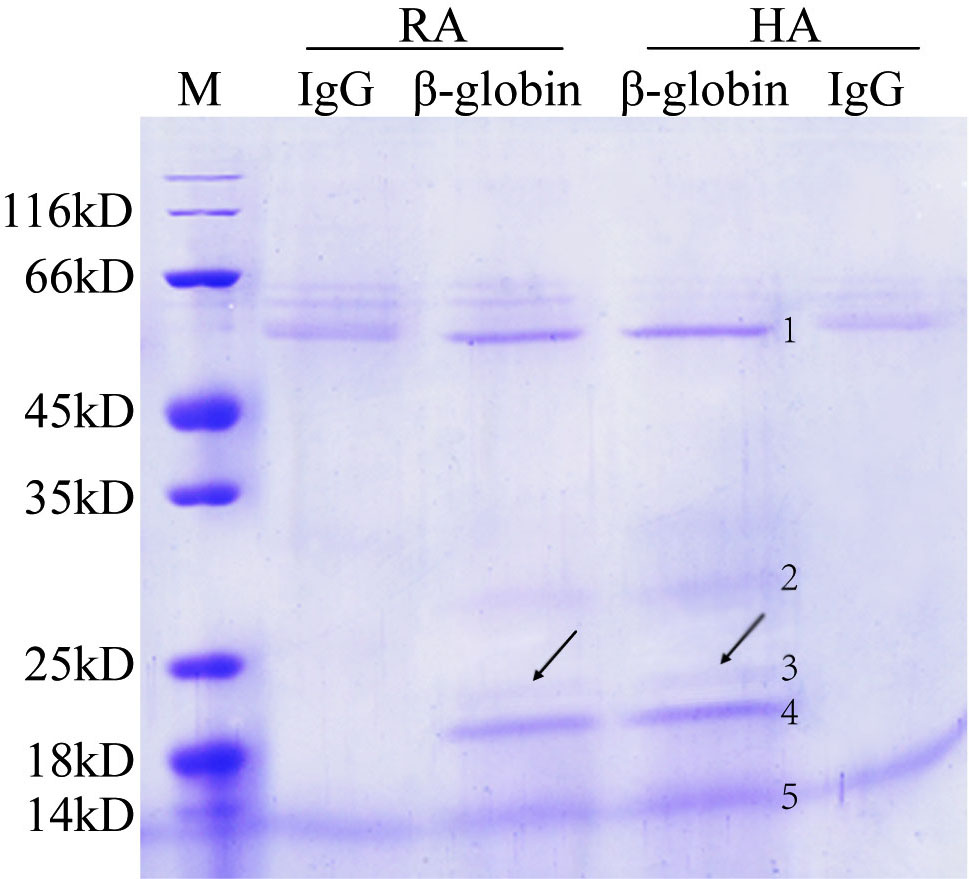 Figure 4.
Separating Beta-globin immunoprecipitating complexes by SDS-PAGE. Negative control was prepared by immunoprecipitating RA and HA samples with mouse IgG; HA and RA represent hemolysate-HbA and RBC-HbA; M represents a protein marker.
| NO. | Name | Mass | Score | Matches | Peptide |
|---|---|---|---|---|---|
| 1 | Immunoglobulin heavy chain | 51254 | 2393 | 52 (39) | |
| 2 | Undetected | - | - | - | - |
| 3 | PRDX2 | 22049 | 1578 | 123 (83) | K.DVLTITLTPK.V |
| K.APQVYTIPPPK.E | |||||
| R.VNSAAFPAPIEK.T | |||||
| R.VNSAAFPAPIEKTISK.T | |||||
| K.APQVYTIPPPKEQMAK.D | |||||
| R.SVSELPIMHQDWLNGK.E | |||||
| K.NTQPIMDTDGSYFVYSK.L | |||||
| R.SVSELPIMHQDWLNGKEFK.C | |||||
| K.TTPPSVYPLAPGSAAQTNSMVTLGCLVK.G | |||||
| K.SNWEAGNTFTCSVLHEGLHNHHTEK.S | |||||
| R.DCGCKPCICTVPEVSSVFIFPPKPK.D | |||||
| 4 | Undetected | - | - | - | - |
| 5 | Hemoglobin subunit beta | 16102 | 3689 | 95 (66) | K.SAVTALWGK.V |
| M.VHLTPEEK.S | |||||
| K.LHVDPENFR.L | |||||
| K.VVAGVANALAHK.Y | |||||
| R.LLVVYPWTQR.F | |||||
| K.VNVDEVGGEALGR.L | |||||
| K.EFTPPVQAAYQK.V | |||||
| K.GTFATLSELHCDK.L | |||||
| K.VLGAFSDGLAHLDNLK.G | |||||
| R.LLGNVLVCVLAHHFGK.E | |||||
| K.KVLGAFSDGLAHLDNLK.G | |||||
| M.VHLTPEEKSAVTALWGK.V | |||||
| R.FFESFGDLSTPDAVMGNPK.V | |||||
| K.SAVTALWGKVNVDEVGGEALGR.L | |||||
| K.GTFATLSELHCDKLHVDPENFR |
To determine whether Prx2 can interact with HbA2, the freeze-thawed protein extracted from the starch-agarose gel of hemolysate-HbA, RBC-HbA, hemolysate-HbA2, RBC-HbA2, hemolysate-HbA-HbA2 and RBC-HbA-HbA2 were immunoblotted with anti-Prx2 and anti-Alpha-globin (internal control) antibodies, respectively. The results showed that Prx2 was present in hemolysate-HbA, RBC-HbA, RBC-HbA2, hemolysate-HbA-HbA2 and RBC-HbA-HbA2 but not in hemolysate-HbA2 (Figure 5).
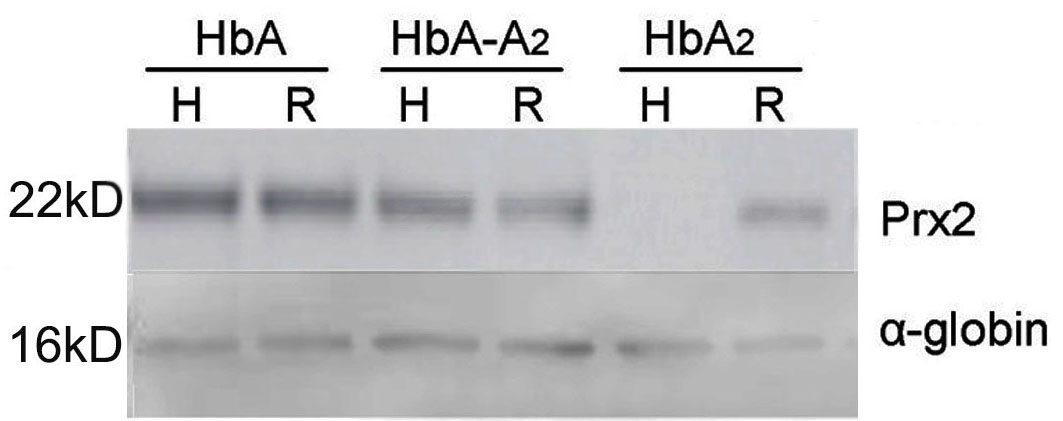 Figure 5.
Detecting Prx2 in different Hb components by Western blot. HbA, HbA2 and HbA-A2 represent the protein samples extracted from the starch-agarose gels of HbA, HbA2 and Hb located between HbA and HbA2; H represents hemolysate; and R represents RBCs.
Figure 6A shows the iron K-edge absorption curve of HbA, while Figure 6B shows the iron K-edge absorption curve of the HbA-Prx2 complex. Both curves show the leading-edge absorption peaks in the X-ray absorption near-edge structure (XANES) spectrum of each sample. The formation of a prepeak feature is due to a 1s→3d transition, which is forbidden in the octahedral coordination but is allowed in coordination geometries (distorted octahedral and tetrahedral), which is lacking a center of inversion (48). Behind the main peak, there is a flattened peak that represents the simple sinusoidal behavior due to the octahedral symmetry of the first coordination sphere (49). Our results showed that heme-Fe had the same local geometry, regardless of whether HbA binds with Prx2. Figures 6C and 6D are the Fe K-edge Fourier transform spectra of HbA and the HbA-Prx2 complex. The results showed that the distance of the first shell (the first shell containing a planar ligand formed by four Fe-N ligands and one axial ligand composed of oxygen and nitrogen (48, 50)) had not been changed. However, after the addition of Prx2, the distance of the second and other extended shells increased significantly.
 Figure 6.
Detecting the change in the iron K-edge of HbA by XAFS. (A) The iron K-edge absorption curve of the HbA group. (B) The iron K-edge absorption curve of the HbA-Prx2 group. (C) The iron K-edge Fourier transform spectra of the HbA group. (D) The iron K-edge Fourier transform spectra of the HbA-Prx2 group.
The functional analysis of proteins is one of the most extensive topics in biology (51), and the biological functions of proteins are mainly dependent on PPIs. However, experimental methods for studying PPIs, such as the yeast two-hybrid method and co-IP, are time-consuming and expensive. In contrast, computational algorithms can provide high-throughput and low-cost methods for PPI prediction. In this study, the IDQD algorithm was successfully used to predict the interactions between different Hb subunits and between Hb subunits and Prx2 through their protein sequences. At present, there are three main types of testing methods for predictive models: the self-consistent test, jack-knife test and k-fold cross-test. Although the results of the self-consistent test and jack-knife test are better than that of the k-fold cross-test, the k-fold cross-test is more realistic and is considered to be a more rigorous and objective test method in statistics. In this study, the sensitivity, specificity and correlation coefficient of the algorithm are 76.04%, 75.74% and 0.52, respectively, which are better than the previously reported domain-based combination information prediction performance results of the support vector machine (SVM) or other algorithms (52). The total prediction accuracy is 80%, which is obtained by predicting the interactions between different Hb subunits. In addition, Prx2 is thought to interact with itself to form polymers, a prediction that has been confirmed by other studies (27, 53).
The predicted results indicated that Prx2 might interact primarily with HbA but not with HbA2, and these predictions were confirmed by co-IP and Western blotting. Co-IP was performed with a beta-globin antibody to pull down the protein complex from the HA and RA samples, and Prx2 and beta-globin were identified by ESI-Q-TOF in both samples. For the other pulldown bands, the ~52 kD band was identified as an immunoglobulin heavy chain from the antibodies used in this experiment and appeared in the IgG co-IP group. The results of the ~20 kD and ~30 kD bands are not satisfactory. Due to the high abundance of immunoglobulins, even after several rounds of detection, we could not find proteins that match their molecular weight. In addition, the ~16 kD band appeared not only in the beta-globin co-IP group but also in the IgG co-IP group and markers. This phenomenon might be caused by the electrophoresis position of bromophenol blue (electrophoretic indicator) very close to beta-globin. The Western blotting result showed that Prx2 existed in hemolysate-HbA, RBC-HbA, RBC-HbA2, hemolysate-HbA-HbA2 and RBC-HbA-HbA2 but not in hemolysate-HbA2. Our previous study demonstrated that RA2 was a complex of HbA and HbA2 (30); therefore, Prx2 existed in RBC HbA2, and it was presumed to bind to HbA. The interaction mechanism between HbA and Prx2 was studied by XAFS, which was a powerful tool for probing local atomic structures of protein in solution (54, 55) that had been used to detect the structural changes of iron in heme. The Fourier transform spectra of HbA showed that the distance of the first shell of iron had not been changed, but the second and other extension shells of iron were increased significantly after adding Prx2. These results indicate that Prx2 affected the second shell and other extended shells but did not affect the first iron shell in hemoglobin (the first shell contains four Fe-Ns in the planar ligand, and the axial ligand contains oxygen and nitrogen) (48, 50)). This finding indicates that Prx2 interacts with HbA by inserting itself into the hydrophobic gap of heme.
Our experimental results also demonstrated that the IDQD prediction algorithm had significant prediction accuracy. In the future, the accuracy and scope of the IDQD algorithm were expected to be further improved, and the method could be developed into a reliable and accurate computer algorithm for protein function research and the discovery of new drug targets.
There are reversible changes of Prx2 between the oxidized (dimer or decamer) and reductive states (monomer) (56). Generally, the reductive state of Prx2 can interact with Hb, and the oxidized state will bind to cell membranes through band3 and other membrane proteins (57). The change in the redox status of Prx2 is significantly correlated with the RBC oxidative stress caused by different types of anemia (58-60), hereditary spherocytosis (61) and blood storage (62-63). Further studies of the interaction between Prx-2 and Hb will provide a new and more effective method for evaluating the oxidative stress level during some systemic diseases, RBC-related diseases and RBC storage.
Qiang Ma, Liang An, Huifang Tian and Jia Liu equally contributed to this paper contribution. This work was supported by grants from the National Natural Science Foundation of China (8160214, 81860029), Natural Science Foundation of Inner Mongolia (2016MS0801), Scientific Research Foundation of Health and Family Planning Committee of Inner Mongolia (201701090), and Natural Science Foundation of Beijing (7143172). We also especially acknowledge the volunteers who donated blood samples for our research.
Abbreviations: Reactive oxygen species (ROS), hemoglobin (Hb), peroxiredoxin2 (Prx2), increment of diversity with quadratic discriminant analysis (IDQD), co-immunoprecipitation (co-IP), electrospray ionization quadrupole-time of flight (ESI-Q-TOF), X-ray absorption fine structure (XAFS), protein-protein interactions (PPIs), support vector machines (SVMs), random forests (RFs), red blood cells (RBCs), reactive oxygen species (ROSs), glutathione peroxidase (GSH-Px), peroxiredoxins (Prxs), X-ray absorption near-edge structure (XANES), sodium dodecyl sulfate polyacrylamide gel electrophoresis (SDS-PAGE), trifluoroacetic acid (TFA).