


Frontiers in Bioscience-Landmark (FBL) is published by IMR Press from Volume 26 Issue 5 (2021). Previous articles were published by another publisher on a subscription basis, and they are hosted by IMR Press on imrpress.com as a courtesy and upon agreement with Frontiers in Bioscience.
 , Ping-Ju Zheng 3, Yi Liu 4, Lei Shang 5
1 Shenzhen Key Laboratory of Viral Oncology, The Clinical Innovation & Research Centre, Shenzhen Hospital, Southern Medical University, Shenzhen, Guangdong Pr. 518100, China
2 Department of Pathology, Shenzhen Hospital, Southern Medical University, Shenzhen, Guangdong Pr. 518100, China
3 Department of Oncology, Shenzhen Hospital, Southern Medical University, Shenzhen, Guangdong Pr. 518100, China
4 Medical College, Xi’an Peihua University, Xi’an, Shaanxi Pr. 710125, China
5 Department of Health Statistics, The Fourth Military Medical University, Xi’an, Shaanxi Pr. 710032, China
Abstract
Although not without controversy, as a general trend, the human sperm count is declining world-wide. One major reason for such a decline is an increase in the human life-span. According to the life history tradeoff theory, fecundity is inversely related to the lifespan; the longer the lifespan, the lower the fecundity. This is essential to the maintainance of diversity and balance of different species. Such a corrleation validated by experimental data that show that the extension of life in Caenorhabditis elegans, Drosophila and Rodents is associated with reduction in fecundity. The demographic data from a public data source, shows that the total fertility rate is positively correlated with the infant death rate, it is inversely correlated with the life expectancy. We postulate that the fall in spermatogenesis might be regulated by the neuroendocrine system that underlie human longevity.
Keywords
- Life history tradeoffs
- Biorelativity
- Sperm count
- Lifespan
- Total fertility rate
Darwinian evolution progresses in only one direction. This begs the question, if everything moves forward, how are species diversity and balance maintained in the biosphere? Therefore, there must be other rules, which help regulate this delicate balance. The fecundity of any organism appears to be influenced by three factors: lifespan, body size, and position on the food chain. Generally speaking: the longer the lifespan, the lower the fecundity; the larger the body size, the lower the fecundity; the higher the position in the food chain, the lower the fecundity (1). Similarly, the life history trade-off theory of ecology deems that there are trade-offs between the genetic traits of organisms (2).
Of the three rules in this restriction dogma, the restriction of lifespan on fecundity is extremely important in the biomedical sciences. The phenomenon of an inverse relationship between lifespan and fecundity was first described in the 1960s (3), and is universal in many species including mammals and birds (4, 5). We designated this phenomenon the “biorelativity” principle (6). Based on this rule, we can conclude that the “Darwinian demon” (7), a hypothetical creature with infinite lifespan and infinite fecundity, is irrational.
We will elaborate upon the influence of the lifespan on fecundity with examples including microorganisms, cells of multicellular organisms, and plants, as well as humans.
If we compare the growth rate of bacteria, we see that the generation time of Esherichia coli is about 18-20 minutes, while the generation time of Mycobaacterium tuberculosis is over 18 hours, and the generation time of Mycobaacterium leprosy is unknown since it has never been successively cultivated in vitro. It is currently unclear why E. coli and most common bacteria rapidly reproduce and why the mycobacteria causing tuberculosis and leprosy reproduce so slowly. However, it is surprisingly simple if we take the lifespan of the different germs into account. Mycobacteria have a long lifespan, possess strong endurance to harsh environments, and thus do not need high fecundity for their existence in the biosphere. Conversely, E. coli and most other bacteria have a short lifespan, so they must have high fecundity for their continued existence. Therefore, short-living unicellular organisms would expand their population much faster than their long-living peers (6, 8).
Yeast is a good model of lifespan and senescence research. It gives rise to progenies by asymmetric division, i.e., sporulation. Yeast has two types of lifespan (9). One is a chronological lifespan, which is the time that individual yeast survives. The other is termed replicative lifespan, which is the number of daughter cells produced by the mother cell (9). By definition we know that the replicative lifespan is an indication of the fecundity of yeast. Sir2, an extensively studied gene, which is involved in the regulation of the lifespan of many classes of organisms, has opposite effects on the chronological and replicative lifespan of the yeast (10).
The restriction of lifespan on the growth rate in unicellular mechanisms is not unique to bacteria. Interestingly, this rule is also applicable to the cultured normal and cancer cells. When the anti-apoptotic protein Bcl-2 is ectopically overexpressed, both the apoptosis and cell growth rate decline (11). Conversely, proteins that promote cell death, such as the cell death receptor CD95 (12) and the apoptosis executor protein caspase-3, all promote cell growth in both in vitro and in vivo experiments (13). Although many researchers assume that cancer cells are “apoptosis resistant” (14), these malignant cells are de facto “short living cells”, as proved by Alexis Carrel 90 years ago (15). We suggest that increased apoptosis and necrosis stimulate the growth and metastasis of cancer, and thus are the root cause of malignancy (16, 17).
Biorelativity also applies to the plant kingdom. If we compare the growth rate of three different kinds of ginseng, we see that the wild ginseng grows at a much slower rate than the Chinese or Korean garden ginseng and American ginseng, which are all farm grown. The simple reason is that the wild ginseng can live up to hundreds of years, while most garden ginseng only live for a few years. Hence, wild ginseng is extremely rare and highly valuable.
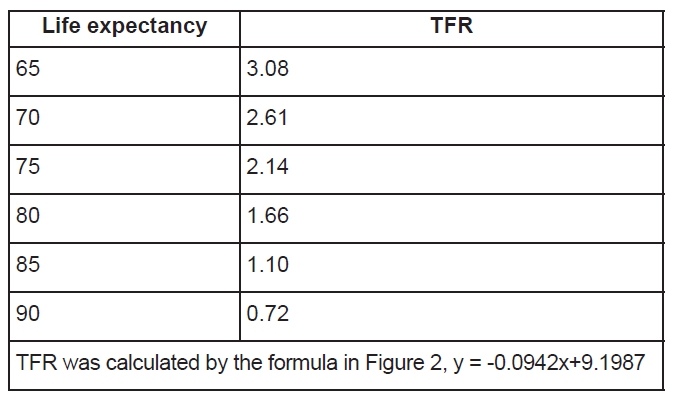
With regard to humans, it is a well-established fact that fertility rates are high in poor countries or regions (Figure 1) (18). However, the fertility rate is not in a linear relationship with GDP per capita, but rather in an antilog relationship. This type of curve means that the fertility rate is not directly related to GDP per se, but rather indirectly related to GDP. In poor countries life expectancy is usually shorter than in developed countries; therefore it is possible that life expectancy may influence the fertility rate. Based on a correlation analysis of demographic data from 222 countries and regions from the CIA World Fact Books(19), the total fertility rate (TFR) which is the average number of times a woman gives birth in her whole life, is negatively correlated with life expectancy (Figure 2). It can be seen that with the extended life expectancy, the TFR declines (Figure 2 and Table 1). The question remaining now is whether the fecundity of human beings also declines with the extension of their life expectancy?
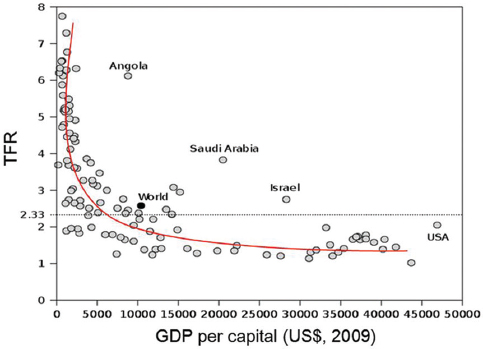 Figure 1
Relationship between gross domestic product (GDP) per capita and total fertility rate (TFR). TFR drops rapidly as the GDP increases until GDP reaches $8 000 per capita. After that point, TFR remains relatively constant, regardless of GDP per capita. Data source: CIA World Fact Book, 2009. Figure was adopted from Wikipedia. http://en.wikipedia.org/wiki/total_fertility_rate.
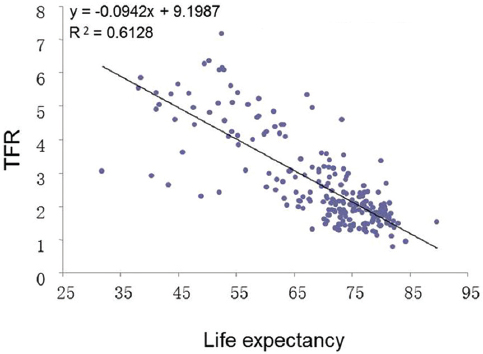 Figure 2
Relationship between life expectancy and total fertility rate (TFR). TFR decreases as as the life expectancy increases. P<0.0001. Original data source: CIA World Fact Book, 2012.
Since Carlsen et al (20) first reported that the human sperm count had declined by 50% in 1992 compared with 50 years prior (20), many research reports have confirmed, that in general, human sperm count is declining (21, 22). These reports covered a wide range of geographical regions including several countries in Europe (23, 24), North Africa (25, 26), North America (21), Oceania (27), and Asian countries such as India(28) and China (29). Yet there are also studies which reported no changes (30, 31), and thus called into question the reliability of those reports supporting a reduced sperm count (30-36). In an organized cohort study of around 5,000 young Danish participants, lasting up to 15 years, there was no evidence of a reduction in sperm count (35). However, the counts averaged just 40-50 million per mL (35).
Now the question is how to reconcile the different findings. As Joefe highlighted, we could not assume that the sperm count reduction was occurring uniformly worldwide (37). It is highly possible that in some places it had occurred earlier and had already stabilized in the tested time period. A meta-analysis showed that from the mid-1940s to 1996, the sperm counts dropped from 170 to 60 million per mL in Europe, but in North America, the sperm counts dropped from 110 to 60 million per mL between the early 1930s and 1996 (21). Therefore, it is not hard to understand that in a 10-year period, some countries/regions may not experience much change, such as Sweden (38) and Korea (31). Furthermore, with regard to young Danish men, the already low sperm count level will probably remain stable for many years.
If we accept human sperm count reduction as a fact, then the important question is what caused this decline in human sperm count? Environmental factors, including air pollution, water pollution, food contamination by pesticides, endocrine disruptors, and transgenic crops, are most commonly cited as being responsible for the decline in sperm count. Other factors such as lifestyle changes have also been suggested as being responsible. Nowadays, we lead a more sedentary lifestyle and are less physically active than before: we watch more television, and spend more time on computers, cellular phones and computer games.
People are well aware about environmental pollution. When asked about what types of harm pollution causes, people will mostly name sperm count reduction and cancer. Although, it is well established that pollution has harmful effects on health, the link between pollution and a reduction in sperm count has not been definitively proven.
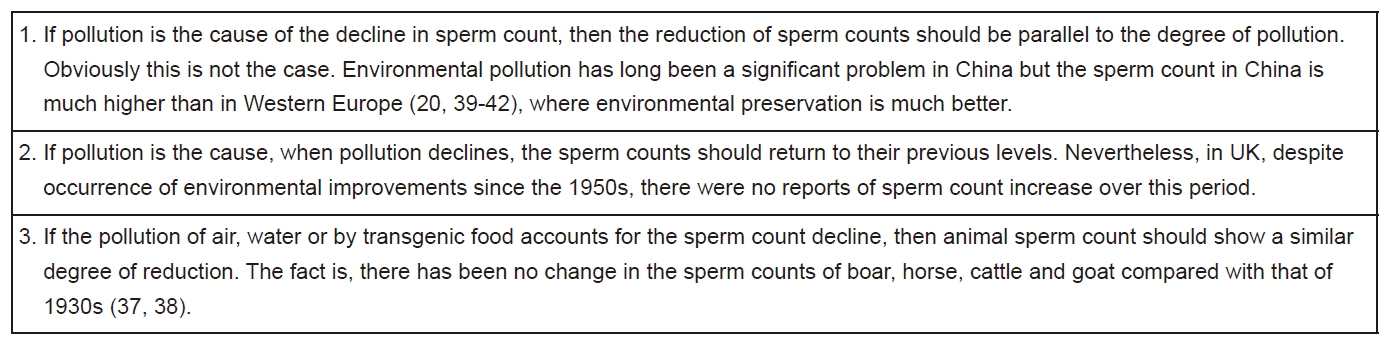
If pollution is the culprit of sperm count reduction, then the scale of the decline should be proportional to the severity of pollution. When the pollution is corrected, the sperm count should recover in due course. However, we observed the most severe sperm count decline in countries with better environmental conservation policies such as in Denmark and France. By comparison, the environment in China and India is much poorer, yet these countries have a higher sperm count than that of Denmark and France. In the years around 2005, the average sperm count in China and India was around 65-70 million per mL (29, 39), while it is 45-50 million per mL in Denmark and France (24, 35).
Taking a historical perspective, we know that in the 1950s, London was badly polluted, but the environment had improved by the 1990s and is much better today. Yet a corresponding increase in the sperm count of British men was not observed.
Some people may argue that it may not be due to general pollution but rather some specific chemical components such as BPA, DBP, and dioxin, the so-called endocrine disruptors. However, all the studies with BPA have failed to prove a link between BPA and sperm count reduction (40). Indeed, there were studies which showed reproductive toxicity to spermatogenesis of some agents which could be found in environmental pollutants (41). But the problem is that animal experiments do not accurately reflect the real world, as the animals in the experiments were exposed to dosages up to several thousand times that found in the real world. Surely we cannot infer the results from such studies and conclude that environmental factors are the major cause of sperm count reduction. In fact, these toxicological studies failed to yield anything useful outside of their tested dosage range.
One logical question is that if the environmental factors contributed to human sperm count reduction, then what about the sperm count in animals? Interestingly, available data from 1936 to the 1990s showed no difference in the sperm counts of bulls, boars, rams, and stallions (42, 43). This data allows us to compare the human sperm count data between 1936 and now. Taken together, this evidence is enough to dismiss environmental pollution as a possible cause for human sperm count reduction, unless proven otherwise.
The facts that negate the notion of environmental pollution as the cause of sperm count decline are summarized in Table 2.
Lifestyle changes, such as less physical exercise, use of computers and cellular phones may also be an alternative explanation for decreased sperm count (44). However, there is no solid evidence for any of these claims, and they remain simply untested hypotheses (45). The existence of such suspects is because we cannot explain the sperm count reduction with environmental pollution, and so far we have not nailed down any specific cause that can reliably explain this issue.
However, the increase in meat consumption might play a causative role in sperm count reduction (46). The reason is as mentioned earlier: the restriction of fecundity by the position in the food chain.
There is a saying that the bigger picture is lost when focusing only on a specific spot. We have been trying to determine a specific agent or a signaling pathway that is responsible for the reduction in sperm count. As yet we have no proof that this specific agent or the signaling pathway really exists.
Therefore, let us take on a holistic perspective. As we discussed earlier, no organism exists with a long lifespan and high fecundity. When the average lifespan is extended, the fecundity must decline. Otherwise, the balance between the species cannot be maintained. We put this relationship into a formula, that is,
X*Y=C
Here variate X stands for lifespan, variate Y stands for fecundity, and C is an elastic constant value. To keep the C relatively stable, when X is increased, Y will come down. When X →∞, then Y → 0.
Laboratory experiments have repeatedly supported this principle. As aforementioned in the cultured cells, when the anti-apoptotic protein Bcl-2 was overexpressed and when apoptosis was inhibited then cell growth was inhibited (11). A similar story is also found with p202, an interferon-induced protein, which is capable of inhibiting both apoptosis and cell growth in fibroblasts and prostate cancer cells (47-50). Conversely, when c-myc, the oncogene that drives mitosis is overexpressed, many cells die (51). Apoptosis promoting proteins usually promote the growth of normal and cancer cells. For example, CD95, Bax, and JNKs all promote cancer cell growth (12, 52, 53). Caspase-3, the final executioner protein in the apoptosis pathway, is also critical for the normal and cancer cell growth (13). Based on this, it is not hard to understand that infant death is a stimulator of the human fertility rate (Figure 3). Actually, if the infant death rate is high, life expectancy will be low because the calculation takes all deaths into account. So when the stimulation from infant death declines, the need and desire of giving birth will be low.
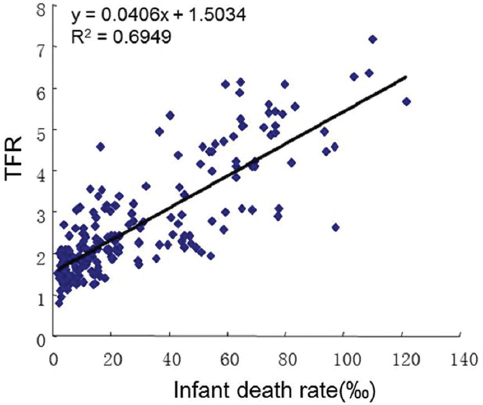 Figure 3
Relationship between infant death rate and total fertility rate (TFR). TFR increases as infant death rate increases, suggesting that child mortality is a strong stimulator of child birth. P<0.0001. Original data source: CIA World Fact Book, 2012.
Experiments in metazoans also showed similar results. In Caenorhabditis elegans, drosophila and rodents, diet restriction extended their lifespan, but also invariably reduced their fecundity. That is well known as a life-for-fecundity tradeoff (3). Conversely, when a genetic locus CG11700 in drosophila was mutated, the fecundity of the male fly was increased but their lifespan shortened (54). The experimental evidence that supports prolonged lifespan as the cause of human sperm count decline is summarized in Table 3.
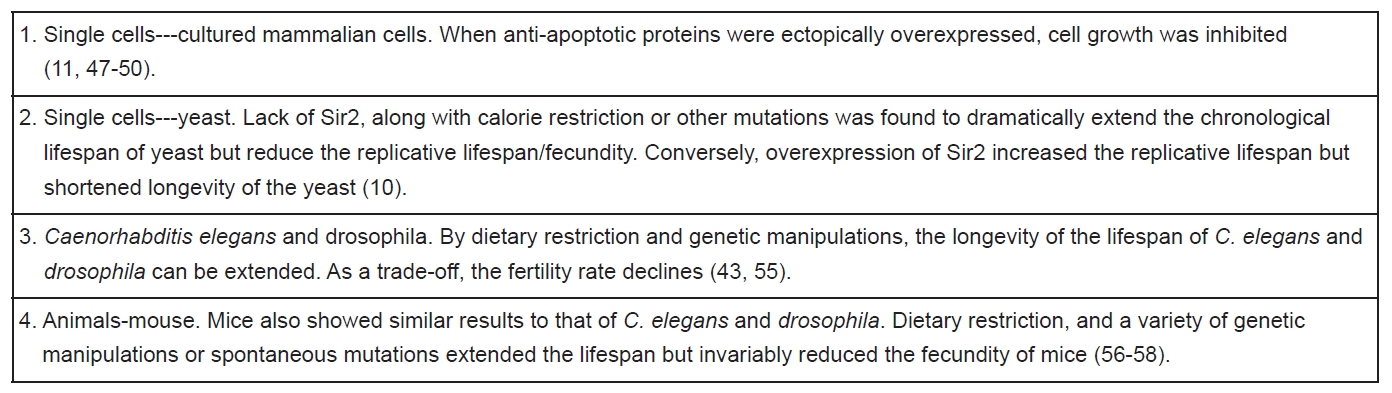
If we put together all the evidence, as summarized in Table 3 and 4, we may well conclude that the increased life expectancy is the most probable cause for the reduction of human sperm count. This explains why the sperm count between the mid-1940s and 1996 in Europe dipped from 170 to 60 million per mL, and from 110 to 60 million per mL in North America between the early 1930s and 1996 (21). The reason for the high sperm count during the mid-1940s in Europe was probably due to stimulation from World War II.
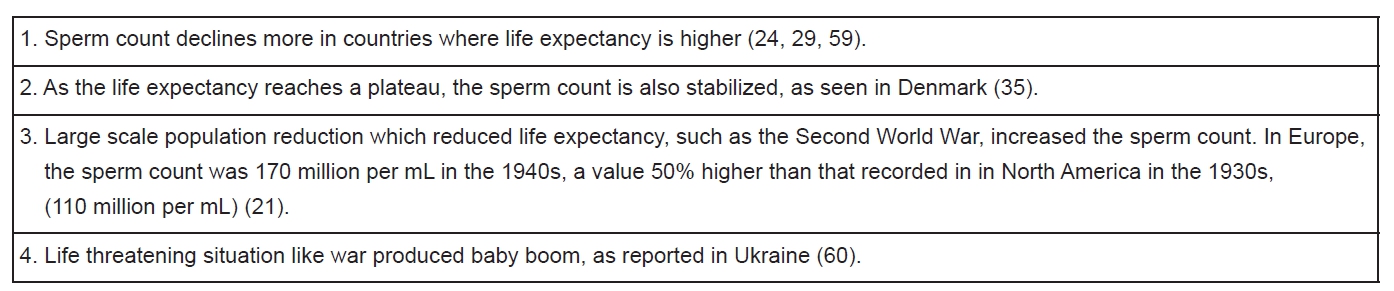
To date, scientists have not elucidated the mechanism of this inverse relationship, even in lower organisms such as drosophila and C. elegans. However, a tentative explanation could be that when the human life expectancy was extended, the need and desire for giving birth was reduced; since spermatogenesis is a neuroendocrine-regulated process, sperm counts fell as life span increased. A more vague explanation from the life history tradeoff theory is that with the extension of the lifespan, there are less energy and efforts allocated to the fecundity (2). Based on our proposed explanation, we predict several consequences. First of all, human sperm count will not be decreasing forever, but rather will reach a stable level as the life expectancy of human beings cannot be extended limitlessly. This has already been proven by some studies such as those in Korea (31) and Sweden (30). If finally life expectancy stabilizes at around 85 years of age, the sperm count could stabilize between 40-50 million per mL, and that will be more than enough to maintain the reproductive ability. Secondly, not all the regions in the world are currrently facing the problem of sperm count reduction. Countries with political instability, war, and other problems which seriously lower the life expectancy and thus have a high TFR are expected to have higher sperm counts than the countries with long life expectancy and lower TFR. Namely, Asian countries such as Iraq, Afghanistan, Yemen and certain countries in central and southern regions of Africa are not expected to have sperm count reduction. Thirdly, regions hit by disasters such as earthquakes may stimulate an increase in birth rate, and thus may experience a rebound in sperm count for a period of time.
Evidence indicates that the reduction of human sperm count does not happen in every corner of the world at the same time and same pace. As long as life expectancy increases, the trend will not stop. Environmental pollution does not have much to do with the sperm count reduction since it does not contribute towards an increase in life expectancy. In fact, Herbert Spencer foretold that the reproductive ability of human beings would decrease with the increase in their competitiveness approximately 150 years ago. However, there is a bottom for the average human sperm count since the life expectancy has its upper limits. Indeed, both the life expectancy and the sperm count have not changed much in developed countries such as Denmark in recent years. As such, it appears that there is little that can be done about the current decline in human sperm count since it is unlikely that we would sacrifice our lifespan.
The authors thank Jiasen Wang of Texas Health Science Center at Houston for helping with language improvement. This study is supported by grants from Shenzhen Science and Technology Innovation Committee (JCYJ20170307143804397), Shenzhen Key Laboratory of Viral Oncology (ZDSYS201707311140430), Sanming Project of Medicine in Shenzhen (NO.SZSM201612023).
Abbreviations: TFR: total fertility rate; GDP: Gross Domestic Product; CIA: Central Intelligent Agent