


 , Ruslan Timofeev 2, Anatoliy Kazak 3,*
 , Yurij Grishin 2, Ludmila Solovyova 2, Marina Rudenko 4
1 School of Health, Medical and Applied Sciences, Central Queensland University, North Rockhampton, QLD 4701, Australia
2 “All-Russian National Research Institute of Viticulture and Winemaking” Magarach “RAS”, 298600 Yalta, Russia
3 Humanitarian Pedagogical Academy, V.I. Vernadsky Crimean Federal University, 295007 Simferopol, Russia
4 Institute of Physics and Technology, V.I. Vernadsky Crimean Federal University, 295007 Simferopol, Russia
Abstract
Background: This study investigated the ultraviolet (UV) absorption spectra of various types and ages of grape wines and the correlation these spectra presented with their phenolic constituents. Firstly, the differences in UV spectra were characterized for different wine samples, depending on their type and age. Methods: The following methods were used in this study: ultraviolet visible spectrophotometry, Folin–Ciocalteu spectrophotometric method, high-performance liquid chromatography. Results: Then, it was demonstrated that for identically aged wines, the 280 nm absorbance is proportional to the concentration of phenolic compounds, as determined by the Folin–Ciocalteu method. Next, an investigation was conducted into the absorption coefficients of different phenolic classes commonly found in grapes and wine. Finally, the range in variation of phenolic compounds in various types of grape wines was established. Conclusions: This work provides a methodological approach to rapidly determine the concentration of phenolic compounds in wines using UV spectroscopy, provided that their age is known. As UV spectrophotometers are available in nearly all laboratories, this may provide a cheaper and faster alternative to current methods, including high-performance liquid chromatography (HPLC).
Keywords
- winemaking
- pomace
- stems
- flavanols
- hydroxycinnamic acids
- hydroxybenzoic acids
- flavonols
- anthocyanins
- spectrophotometry
- high performance liquid chromatography (HPLC)
- absorption spectrum
- control methods
Faced with modern challenges, such as a sedentary lifestyle, increased prevalence of chronic diseases, and environmental pollution, particular attention is currently paid to the role of healthy nutrition aimed at providing the human body with the necessary nutritional components that will also have beneficial effects on its physiological activity. The most commonly consumed foods are deficient in key micronutrients such as vitamins, minerals, organic acids, antioxidants, and phenolic compounds. This can lead to impaired immune function, increased occurrence of chronic diseases, and deterioration in the quality of life. Consequently, there is a growing market demand for “functional foods” that provide health benefits and nutritional value.
Recently, there has been particular interest in polyphenols, a naturally occurring class of bio-antioxidant compounds. These act as inhibitors of free radical processes in the human antioxidant system [1], reducing cellular damage and oxidative stress. For this reason, the intake of phenolic acids has a high potential as a protective factor against cancer and cardiovascular diseases [2]. According to the US Department of Health, the daily intake of antioxidants necessary for the human body should be from 3000 to 5000 units of oxygen radical absorption capacity (ORAC)—a unit for measuring the number of antioxidants expressed in micromoles of Trolox C per unit mass (µTE/100 g) [3].
However, phenolic compounds are not endogenously synthesized in the human body, with plant foods being an almost exclusive source. Within the plant, phenolic compounds perform a similar job—preventing oxidative stress and cellular damage—alongside playing roles in filtering ultraviolet (UV) radiation and acting as internal regulatory/signaling agents. Synthesis of phenolic compounds occurs across different parts of the plant; for example, in grapes, this occurs in the stems [4], skin, and seeds of the fruit [5].
Numerous demographic studies have attempted to establish the daily intake and requirements of phenols and antioxidants in the human diet. These have shown that the average daily intake of phenolic acids in the human diet is around 200 mg/day; however, this does depend on food tastes, preferences, and diet composition [2, 6, 7]. The daily intake of hydroxybenzoic acids from this food for human beings is estimated to be 25–100 mg [8, 9]. Hydroxycinnamic acids are generally ingested daily in high amounts, which vary significantly between individuals; an estimated intake of 153.6 to 231.8 mg/day was determined in a cross-sectional analysis of the UK National Diet and Nutrition Survey Rolling Programme [10]. Another study estimated the average phenolic acid consumption for men and women to be 222 mg per day, dominated by caffeic acid, with a daily intake of 206 mg [11, 12]. Other work in the Netherlands has shown that the average intake of flavonols is 23 mg/day, with the proportion of quercetin being around 11.5 mg/day [13, 14]. Average flavanol intake varies more widely, from 77 to 182 mg/day, and differs by geographic region [15]. According to Dutch researchers, the main bioavailable representative of flavanols is (+)-D-catechin, the mean intake of which was approximately 50 mg/day [16]. The detoxifying properties of flavanols are most pronounced in (+)-D-catechin, which inhibits the DNA damage caused by potential dietary carcinogens, such as heterocyclic amines formed from overcooking meat [17]. There is particular interest in flavonols and flavanols in the viticulture sector, as these beneficial phenolics are found in high concentrations in grapefruit and the resultant wines [18]. For this reason, there is interest in measuring the phenolic content as a quantifiable potential health benefit. Furthermore, phenolic profiles are increasingly being reported as a useful tool for quality control and authentication purposes [19]. Consequently, the viticulture industry would benefit from a rapid, non-destructive, and low-cost technique for measuring the phenolic content and profiles in grape juice and wine products.
Although the accuracy of rapid, non-destructive methods (such as spectroscopy or spectrophotometry) is typically lower than higher-end analytical techniques (such as high-performance liquid chromatography), they may be suitable for operational monitoring of the composition of wines and decision-making to adjust the technological process. This satisfies modern requirements for prompt juice and wine composition analyses at all stages throughout grape processing and wine production. The use of non-destructive methods also means no losses in the final product. In addition, there is increasing demand for integrated systems that can receive data from several different instruments, allowing for multi-parameter control of the production environment based on composition indicators and data processing algorithms [20]. With respect to measuring the phenolic composition in wine and grape products, ultraviolet (UV) spectroscopy would appear to be a suitable, non-destructive, rapid analytical technique. Phenolic compounds show distinct absorptions in the UV range, allowing for some level of identification and measurement via UV spectroscopy [21, 22, 23, 24].
Phenolic compounds identified in grapes and subsequently transferred into wine
are divided into two main classes according to their chemical structure:
flavonoids (diphenylpropanoids) and non-flavonoids (phenylpropanoids). Due to
their ability to enter into chemical oxidation reactions, these compounds affect
the antioxidant properties of wines, their color, and taste [25]. Total phenol
content can be successfully determined using UV–visible spectrophotometry by
applying the Beer–Lambert law due to the dependency of absorbance on
concentration and light path length [26]. Absorbance at 280 nm is
frequently used to determine the total phenol content, as the aromatic rings of
the phenolic compounds absorb UV light at 280 nm, causing a
characteristic sharp absorbance peak at this wavelength [27]. Hydroxycinnamic
acids and their derivatives can also be determined using the
320 nm absorbance [28]. Spectrophotometric detection of
hydroxybenzoic acids is carried out at an absorption maximum of 219–280 nm [29].
Generally, flavonoids are characterized by two absorption maxima [30]. The
presence of substituents influences the shape of the UV absorption spectrum, as
does the presence of an A- or B-type ring [31]. They typically have strong
absorption bands at 320–380 nm (band I) and 240–270 nm (band II). The exact
position and intensity of the absorption maxima depend on further structural
differences. The absorption spectra of coumarins contain two main bands at 278
and 310 nm, and in their hydroxyl derivatives, the main maximum is located above
300 nm [32]. The use of the spectrophotometric method alongside the
Folin–Ciocalteu reagent in determining phenolic substances has some limitations
associated with interference due to sulfur dioxide (SO
The high-performance liquid chromatography (HPLC) method exhibits high sensitivity due to the absence of restrictions on the molecular size of the identified phenolic substances [34]. HPLC coupled with a diode array detector (DAD) has successfully quantified the concentrations of various phenolic substances, with the detector programmed to record at wavelengths of 240 and 450 nm [35].
Thus, this work aimed to analyze the absorption spectra of the main types of white and red dry and fortified wines of various ages in the UV wavelength range to determine patterns in the absorption changes in the UV wavelength range depending on the type and age of the wines and to identify quantitative composition using high-performance liquid chromatography phenolic compounds, identifying the ranges of their changes in the main types of white and red wines.
Spectrophotometric analysis was carried out using the Folin–Ciocalteu reagent
to determine the mass concentration of phenolic substances. The Folin–Ciocalteu
reagent was prepared by dissolving 100 g of sodium tungstate and 25 g of sodium
molybdate in 700 mL of distilled water. Adding 50 mL of phosphoric acid 85%
(
Gallic acid, caffeic acid, malvidin-3-O-glucoside chloride, (+)-D-catechin, quercetin dihydrate, isoquercetin were purchased from Fluka Chemie (GmbH, Buchs, Switzerland), trans-resveratrol, and (–)-epicatechin, syringic acid were used as standard substances in determining the qualitative and quantitative compositions of phenolic compounds by high-performance liquid chromatography acid, p-coumaric acid, kaempferol, and ferulic acid were purchased from Sigma-Aldrich (GmbH, Munich, Germany).
The main types of white and red wines were prepared by complete or partial fermentation of pulp sugars, as well as the use of grape stems and stopping fermentation by alcoholization of various harvest years (1996–2018). A total of 215 samples were used as material in this study. Their production technology and age largely determined the choice of samples for analysis. Notably, the study included both red wines and white wines prepared by alcoholization with ethyl alcohol (fortified wines) and contact of the must with the solid parts of the grape bunch (grape stems and pulp), providing a complete extraction of biologically valuable compounds with a phenolic structure, and as a result, a higher extractivity of wines.
High absorption values of phenolic compounds contained in wines in the UV
wavelength range by light energy determine the effectiveness of
spectrophotometric determination of the concentration of phenolic substances in
wines of various types and ages. Before measuring the absorption rate of wines,
they were diluted 15, 30, and 60 times. Considering that the maximum accuracy of
measurements is achieved with absorption values of 0.3–0.7 units [36] and the
maximum value of the measured absorption value should not exceed 3 units—a
weakening of the radiation intensity by 1000 times, and the concentration of
phenolic substances in wines is the bulk of measurements varying from 200
mg/dm
All phenolic substances contained in wine are oxidized by the Folin–Ciocalteu reagent. This reagent is formed from a mixture of phosphotungstic acid and phosphomolybdic acid, which, after oxidation of the phenols, is reduced to a mixture of blue oxides of tungsten and molybdenum.
The proportionality principle of the mass concentration of phenolic substances to the intensity of the absorption of the prepared reaction mixture, together with the properties of the Folin–Ciocalteu reagent that oxidizes phenolic substances, is the basis for determining the total content of phenolic compounds (TCPCs). The TCPCs were measured using the colorimetric method, as described in [24, 37], with the absorbance measured using a KFK-3M spectrophotometer (GazoAnalit, Smolensk, Russia).
Individual phenolic substances in the studied wine samples were determined by
HPLC using an Agilent Technologies chromatographic system (model 1100) (Agilent
Technologies, Waldbronn, Germany) with a diode array detector. To separate the
substances, a Zorbax SB – C18 chromatographic column with a size of 2.1
Chromatograms were recorded at the following wavelengths:
- 280 nm: gallic acid, (+)-D-catechin, (-)-epicatechin
- 313 nm: derivatives of hydroxycinnamic acids
- 371 nm: quercetin
- 525 nm: anthocyanins
Individual compounds were identified by comparing their spectral characteristics with the spectra described in the literature [38, 39, 40, 41, 42, 43] and by comparing the retention calibration graphs of the dependence of the peak area on the concentration of the substance, constructed from solutions of standard substances. The content of anthocyanins was determined in terms of malvidin-3-O-glucoside chloride, caftaric acid, 2-S glutathionylcaftaric acid; in terms of caffeic acid and coutaric acid; in terms of p-coumaric acid and fertaric acid; in terms of ferulic acid and quercetin-3-O-glucuronide; in terms of isoquercitrin, polymeric, and oligomeric procyanidins; in terms of (+)-D-catechin.
The mass concentrations of phenolic substances determined by HPLC were summed to determine the total concentration of the monomeric forms of the phenolic compounds (TCMFPCs).
Distilled water was used as a reference solution to dilute the wine samples. This was considered appropriate since the pH of the solution in wine samples shows little change with dilution due to the presence of buffer components in wines. All analyses were carried out in triplicate.
The measurement results were processed using standard mathematical statistical methods using the “Data Analysis” package in Microsoft Excel. The reproducibility of measurements was at least 10%, with a confidence level of p = 0.95.
After examining the UV spectral data, it was found that most of the studied wines had a characteristic peak within 265–285 nm (peak I), although its exact position and shape depended on their extractivity and age. The characteristic absorption spectra for the different types of wine included in this study are shown in Fig. 1.
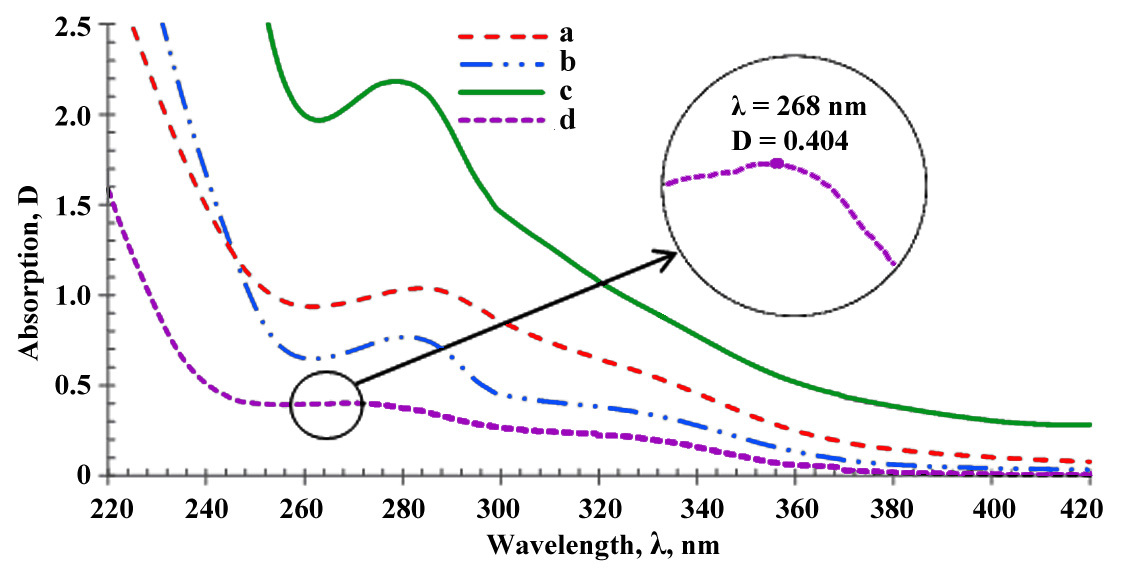 Fig. 1.
Ultraviolet (UV) absorption spectra and maximum UV absorption of different types of wines diluted 15 times in water. (a) Aged, fortified wine; (b) young, fortified wine; (c) young, red, dry wine; (d) white, dry wine. The inset—maximum UV absorption of different types of wines.
The absorption curves analysis (Fig. 1) showed that with an increase in the extractive and age of the wine, the position of the maxima of the absorption peaks in this area shifted towards higher wavelengths, demonstrated in the inset.
Table 1 shows the experimentally determined values of the absorption maximum for wines of various types and ages, along with their 95% confidence intervals.
| Type of wine | Wine age, years | Peak position, nm |
| White, dry wine | 267 | |
| White, dry wine | 269 | |
| Red, dry wine | 277 | |
| Red, dry wine | 2–3 | 280 |
| White, fortifiedwine | 1–2 | 278 |
| White, fortifiedwine | 3–7 | 282 |
| White, fortifiedwine | 285 |
The UV spectra data also demonstrated that as the age of wine increased, the
shape of the peak at ca. 280 nm became less pronounced, while the absorbance in
the wavelength region above 300 nm was increased. When grouped by age, there was
a strong, positive correlation between the absorbance at a wavelength of 280
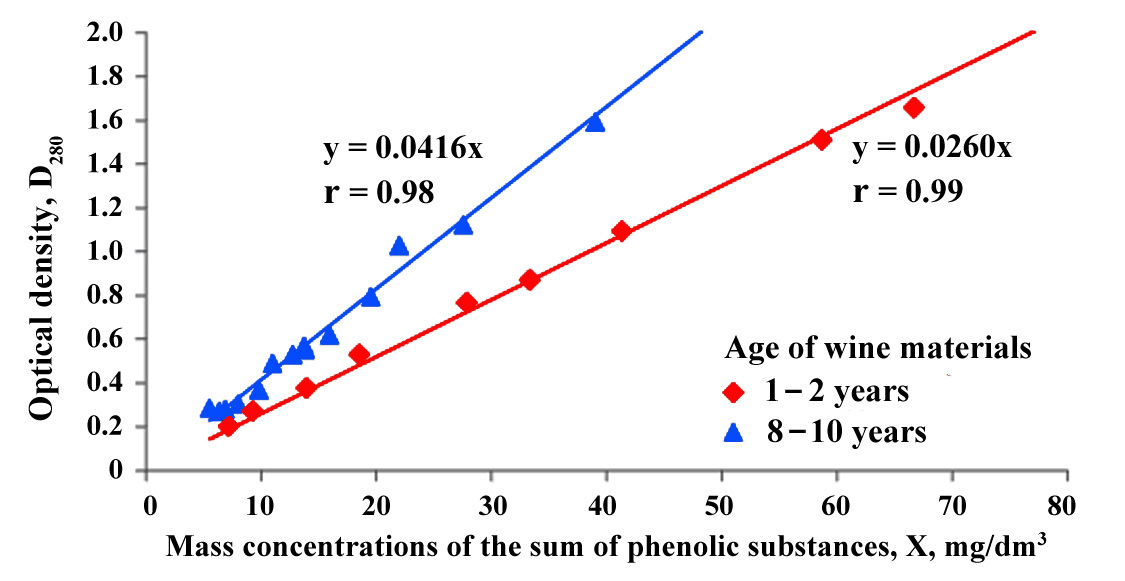 Fig. 2.
Correlation between the absorbance at 280 nm (optical density
D
Even though the peak shape of the maximum absorption of wine with aging becomes less pronounced (Fig. 1), the amount of light energy absorption at a wavelength of 280 nm per unit mass of phenolic substances increases, which can be seen in the greater slope between the phenolic concentration and absorbance (Fig. 2). The correlation coefficient between the absorption value and the total concentration of phenolic substances was 0.98. This can be explained by the different qualitative composition of phenolic substances in young and aged wines and by the fact that, despite the degradation of anthocyanins and a decrease in the total concentration of phenolic substances during aging, grape phenolic compounds and their derivatives remain in the aged wine and show strong absorbance in the 280 nm region.
This observation suggests the use of absorbance at 280 nm as a quality indicator by measuring the concentration of total phenolic compounds in young wine materials and estimating the chemical age of the wine material (based on the slope of the absorbance/concentration curve).
To generate absolute measurements of the light-absorbing ability of phenolic
compounds, it is advisable to introduce the concept of the “absorption
coefficient of phenolic substances of grapes and wine”. In analytical chemistry,
the concept of the molar absorption (extinction) coefficient is usually used,
which is equal to the absorbance of a solution with a concentration of 1 M in a
cell with an optical path length of 1 cm [16]. However, because grape and wine
matrices are not pure solutions and contain mixtures of various phenolic
substances with various degrees of polymerization, it is necessary to use a
different metric. We suggest using the absorbance of a solution at 280 nm and an
optical path length of 1 cm, with the solution containing a concentration of 1
g/dm
The obtained absorbance value should then be multiplied by the wine dilution factor and divided by the concentration of the phenolic substances. Table 2 shows the calculated values of the absorption coefficient of phenolic substances in grapes, obtained based on statistical processing of spectrophotometric data on young wine materials at a 95% confidence level.
| Type of wine | Wine age, years | |
| White, dry wine | 1–2 | 26 |
| Red, dry wine | 1–2 | 23 |
| White, fortified wine | 1–2 | 26 |
| White, fortified wine | 42 |
As mentioned, the physical meaning of this value is the absorbance of a solution
containing 1 g/dm
In this case, based on the above definition, the concentration of phenolic substances in the test sample will be equal to
where D
Next, we considered the possibility of directly measuring the absorbance of wines without their preliminary dilution to create a rapid sensor for calculating the concentration of phenolic substances in grapes and wine based on the absorbance at 275–280 nm. The maximum accuracy of spectrophotometric measurements is achieved at absorbance values between 0.3 and 0.7 units, and the maximum measurable absorbance value should not exceed 3 units. With respect to a 1 cm path length cuvette, this is equivalent to diluting the sample by 15 times.
In the next stage of the study, we investigated the qualitative and quantitative compositions of phenolic substances in the main types of white and red grape wines, from young to aged. The total concentrations of monomeric forms of phenolic substances (measured by HPLC) and the total concentration of phenolic substances (measured using the Folin–Ciocalteu method) in the main types of white grape wines are presented in Table 3, Fig. 3.
| Number of samples | Wine description | Wine age, years | TCMFPC (measured by HPLC), g/dm |
TCPC (measured by Folin–Ciocalteu method), g/dm |
| 19 | White, dry wine | 0.06 |
0.26 | |
| 9 | White, aged dry wine | 1–2 | 0.09 |
0.69 |
| 11 | White, dry wine | 0.05 |
0.34 | |
| 15 | White, dry wine with pomace and stems used | 1–2 | 0.16 |
1.64 |
| 12 | White, medium dry and semi-sweet wines | 0.07 |
0.29 | |
| 15 | White, fortified wine | 1–2 | 0.09 |
0.63 |
| 8 | White, fortified wine | 0.14 |
0.60 | |
| 14 | White, fortified liqueur wines | 1–2 | 0.10 |
0.81 |
| 12 | White, fortified liqueur wines | 0.09 |
0.71 |
TCMFPC, total concentration of monomeric forms of phenolic compound; TCPC, total content of phenolic compound; HPLC, High-performance liquid chromatography.
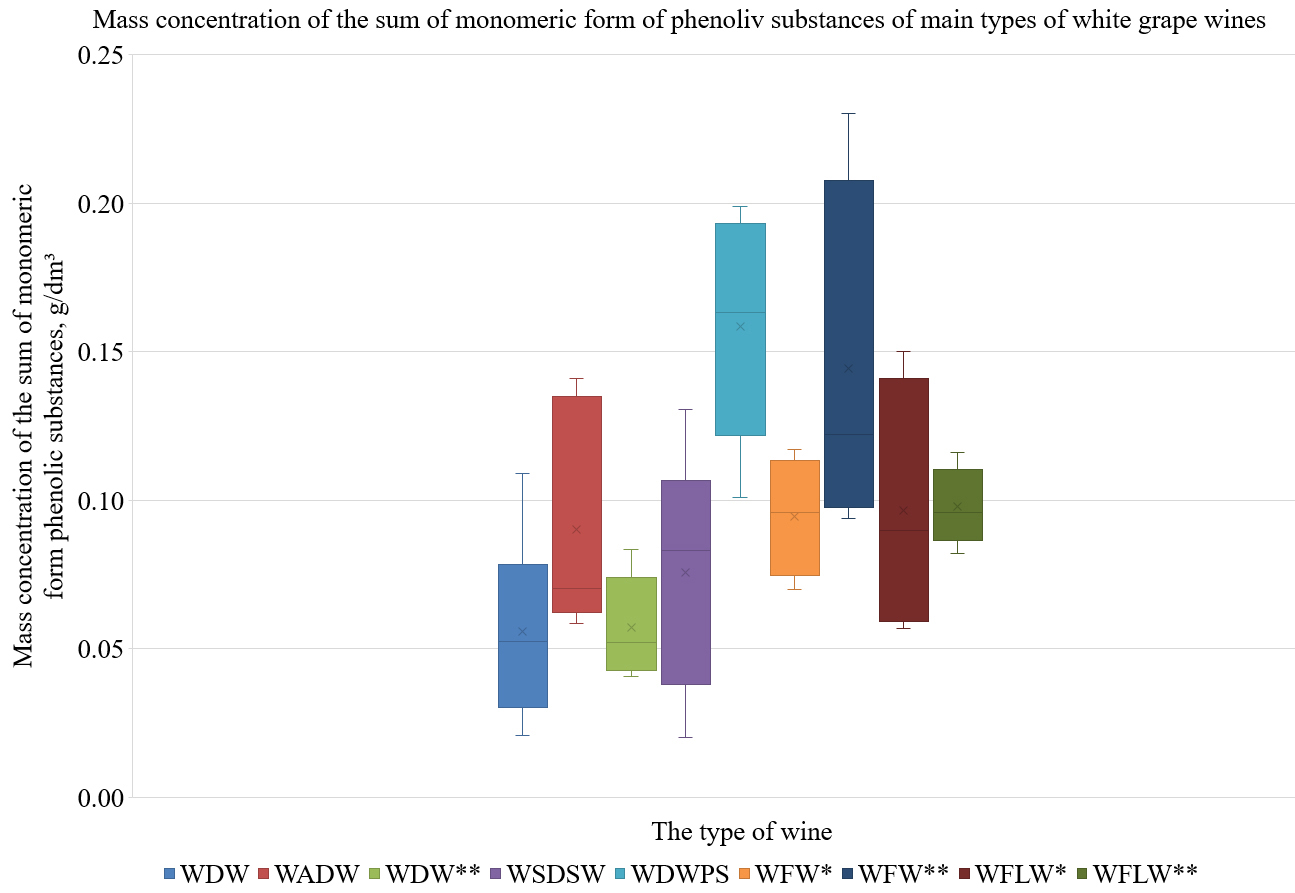 Fig. 3.
The mass concentrations of monomeric forms of phenolic
substances in the main types of white grape wines. WDW*: white dry wine, wine
age
From these results (Table 3, Fig. 3), it can be seen that the average total
phenolic content in the white wines ranged from 0.26 g/dm
| Number of samples | Wine description | Wine age, years | TCMFPC (measured by HPLC), g/dm |
TCPC (measured by Folin–Ciocalteu method), g/dm |
| 18 | Red, dry wine | 0.31 |
2.64 | |
| 14 | Red, aged dry wine | 1–2 | 0.26 |
2.90 |
| 10 | Red, dry wine | 0.24 |
2.84 | |
| 15 | Red, medium dry and semisweet wines | 0.42 |
2.31 | |
| 10 | Red, fortified wine | 1–2 | 0.12 |
2.08 |
| 12 | Red, fortified wine | 0.14 |
1.65 | |
| 11 | Red, fortified liqueur wine | 1–2 | 0.21 |
2.33 |
| 10 | Red, fortified liqueur wine | 0.16 |
1.77 |
For the sum of the monomeric phenolic substances, the lowest content (0.12
g/dm
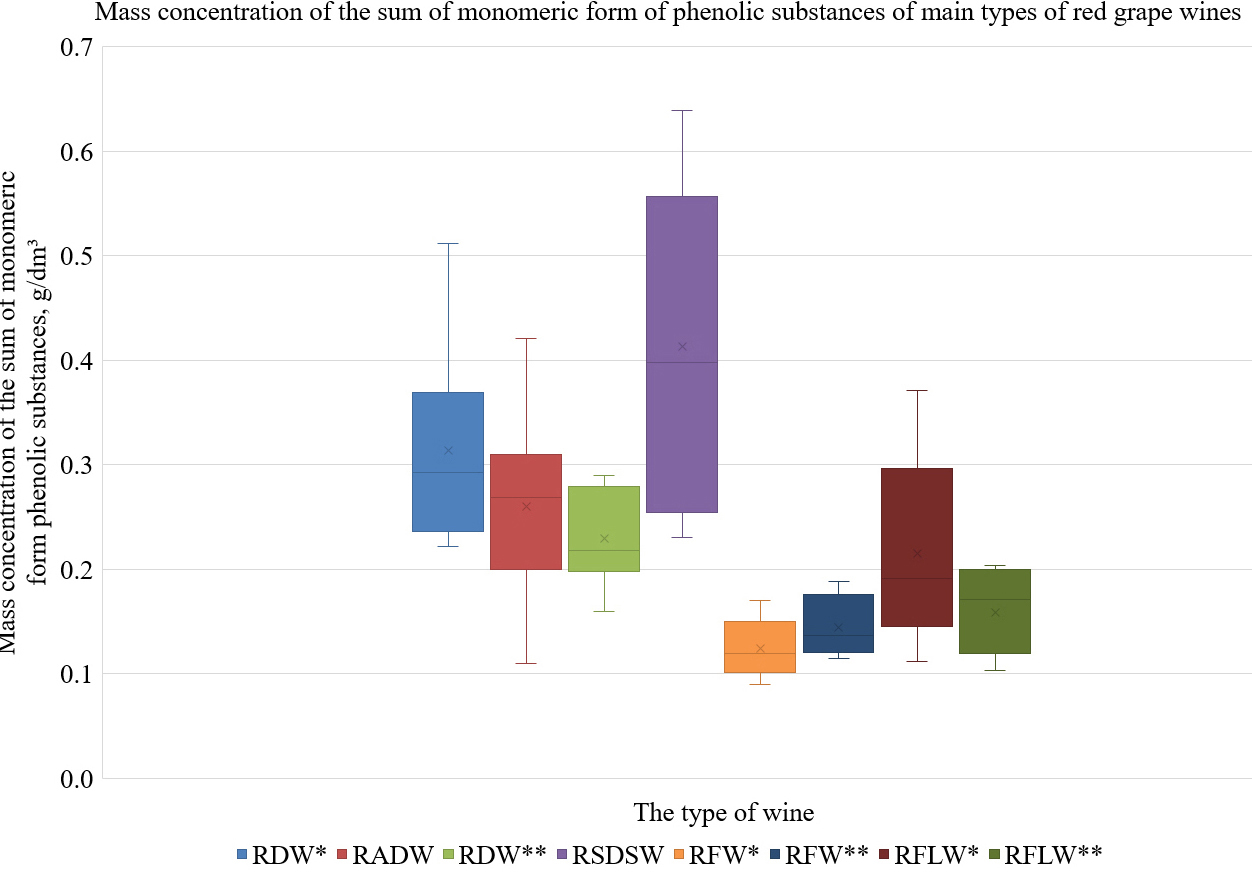 Fig. 4.
The mass concentrations of monomeric forms of phenolic
substances in the main types of red grape wines. RDW*: red dry wine, wine age
Further investigation into the monomeric phenolic constituents in the main types
of white wines revealed the presence of phenolic acids (hydroxybenzoic and
hydroxycinnamic acids), flavanols, and flavonols. The highest concentration of
phenolic acids (118.31 mg/dm
| Number of samples | Wine description | Wine age, years | Hydroxycinnamic acids | Hydroxybenzoicacids | Flavanols | Flavonols |
| 19 | White, dry wine | 37.11 |
3.83 |
14.86 |
||
| 9 | White, aged dry wine | 1–2 | 45.64 |
20.79 |
27.87 |
|
| 11 | White, dry wine | 33.15 |
7.01 |
13.06 |
||
| 15 | White, dry wine pomace and stems used | 1–2 | 62.56 |
55.75 |
36.07 |
2.50 |
| 12 | White, medium dry and semisweet wines | 39.35 |
4.69 |
23.96 |
||
| 15 | White, fortified wine | 1–2 | 31.53 |
20.93 |
24.56 |
4.00 |
| 8 | White, fortified wine | 23.56 |
10.62 |
24.61 |
1.44 | |
| 14 | White, fortified liqueur wines | 1–2 | 48.82 |
12.01 |
12.36 |
4.59 |
| 12 | White, fortified liqueur wines | 20.98 |
9.03 |
21.00 |
1.66 |
The flavanol content varied widely, from 12.36 mg/dm
Flavonols were found in the lowest concentrations of all the monomeric phenolic
substances, with contents ranging from trace amounts to 4.00 mg/dm
The same four classes of monomeric phenolics (hydroxybenzoic acids,
hydroxycinnamic acids, flavanols, flavonols) were also found in red wines and
anthocyanins (Table 6). The highest concentrations of phenolic acids (123.67
mg/dm
| Number of samples | Wine description | Wine age, years | Hydroxycin-namic acids | Hydroxyben-zoic acids | Flavanols | Flavonols | Anthocyanins |
| 18 | Red, dry wine | 68.24 |
9.78 |
71.90 |
23.52 |
184.26 | |
| 14 | Red, aged dry wine | 1–2 | 46.59 |
77.08 |
70.52 |
12.33 |
42.74 |
| 10 | Red, dry wine | 47.88 |
73.22 |
84.97 |
12.89 |
18.87 | |
| 15 | Red, medium dry and semisweet wines | 58.81 |
41.52 |
55.69 |
22.30 |
112.00 | |
| 10 | Red, fortified wine | 1–2 | 45.00 |
33.71 |
28.78 |
15.96 |
78.89 |
| 12 | Red, fortified wine | 42.85 |
32.48 |
25.66 |
5.63 |
2.13 | |
| 11 | Red, fortified liqueur wines | 1–2 | 72.69 |
43.03 |
44.92 |
13.12 |
28.83 |
| 10 | Red, fortified liqueur wines | 26.89 |
32.76 |
21.54 |
1.81 |
6.23 |
The study found that the UV spectra of all studied wine varieties have a
characteristic absorption peak in the wavelength range of 265–285 nm, the shape
of which is determined by the type and age of the wine. A strong correlation was
demonstrated between the absorbance value of wine at 280
The dataset is available from the corresponding author upon request.
Conceptualization, YG and MR; Methodology, RT; Software, AK and MR; Validation, JJ; Formal Analysis, YG, RT, LS; Investigation, YG; Data Curation, LS; Writing – Original Draft Preparation, YG, JJ and RT; Writing – Review and Editing, AK and JJ; Project Administration, AK and MR. All authors have read and agreed to the published version of the manuscript. All authors have participated sufficiently in the work to take public responsibility for appropriate portions of the content and agreed to be accountable for all aspects of the work in ensuring that questions related to its accuracy or integrity. All authors contributed to editorial changes in the manuscript.
Not applicable.
Not applicable.
This research received no external funding.
The authors declare no conflict of interest.
References
Publisher’s Note: IMR Press stays neutral with regard to jurisdictional claims in published maps and institutional affiliations.