


 , Jiajia Chen 1,†, Jianye Bian 1, Fangyuan Chen 1, Qianli Wan 1,*
 , Fang Yuan 1,*
1 Department of Critical Care Medicine, Tongren Hospital Shanghai Jiao Tong University School of Medicine, 200336 Shanghai, China
†These authors contributed equally.
Abstract
Ultrafiltration (UF) is an alternative approach to diuretic therapy for the treatment of acute heart failure (AHF), but its optimal endpoint is unclear. This study explores using non-invasive ultrasonic cardiac output monitor (USCOM) to determine UF endpoints based on hemodynamic changes.
In this single-anonymized, randomized controlled trial, acute decompensated heart failure patients were randomly assigned to UF (U, n = 20) and USCOM+UF (UU, n = 20) groups at a ratio of 1:1. A mixed linear model was utilized to analyze repeated measurement data of hemodynamic indicators (primary endpoint) in the U and UU groups. A 30% or 50% decrease in B-type natriuretic peptide (BNP) concentrations relative to the baseline was established as the criteria for the UF endpoint success. Multivariate logistic regression was used to identify potential indicators within the USCOM that could have influenced the UF endpoint success. Receiver operating characteristic (ROC) curves were used to evaluate the value of the predictive model. Economic benefits, including treatment costs and hospitalization duration, were also assessed.
Change rates in mean arterial pressure, heart rate (HR), urine output, hematocrit, and BNP concentrations were similar between the U and UU groups over 7 days (all p > 0.05). On day 4, significant correlations were found between various USCOM parameters, including inotropy (INO), systemic vascular resistance index (SVRI), systemic vascular resistance, corrected flow time (FTc), velocity time integral, and the BNP of the UF parameters. Multivariate logistic regression revealed that INO and SVRI were correlated with a 30% reduction in BNP on day 4 compared to baseline, while FTc and HR were found to be independently associated with a 50% reduction in BNP on day 4 compared to baseline. The UF endpoint prediction formula for a 30% reduction in BNP was –2.462 + 0.028 × INO – 0.069 × SVRI, with sensitivities, specificities, and accuracies of 70%, 83%, and 75%, respectively. The UF endpoint prediction formula for a 50% reduction of BNP was –2.640 – 0.088 × FTc – 0.036 × HR, with sensitivities, specificities, and accuracies of 83%, 63.0%, and 72.5%, respectively. The addition of the USCOM significantly reduced treatment costs and hospitalization stay lengths.
Observing the USCOM using probability formulas served to determine appropriate UF endpoints during AHF treatments. UF combined with the USCOM can reduce the costs of UF and hospitalization.
NCT06533124, https://clinicaltrials.gov/study/NCT06533124?term=NCT06533124&rank=1.
Keywords
- ultrasonic cardiac output monitor
- acute decompensated heart failure
- brain natriuretic peptide
- ultrafiltration
- echocardiography
Acute heart failure (AHF) is a clinical syndrome caused by acute onset or
exacerbation of left ventricular dysfunction, leading to decreased myocardial
contractility and an increased load on the heart. This syndrome results in an
abrupt decrease in cardiac output (CO) and an increase in pulmonary circulation
pressure and peripheral vascular resistance, leading to acute pulmonary
congestion, pulmonary edema and clinical symptoms that may be accompanied by
inadequate tissue and organ perfusion resulting in cardiogenic shock [1, 2]. The
etiology of AHF is undoubtedly complex, but is believed to be related to
hemodynamic disturbances [3, 4]. A recent report found that the in-hospital
mortality rate of AHF was 3%, and the 3 and 5 year mortality rates were 30% and
60%, respectively [5], indicating poor prognosis and high mortality.
Pharmacological interventions aimed at achieving rapid decongestion and improving
organ perfusion include positive inotropic drugs that increase CO, raising blood
pressure, alleviation of tissue hypoperfusion and maintenance of the functions of
vital organs [6]. Moreover, the use of diuretics for reducing congestion has been
a major treatment mode for AHF patients in clinical practice [7], but about 20%
of patients did not exhibit improved symptoms after treatment with diuretic
drugs, and furthermore diuretic resistance occurred in
Ultrafiltration (UF) is an alternative approach to diuretic therapy for
congestion management, according to the European Society of Cardiology Guidelines
for the diagnosis and treatment of AHF and chronic heart failure [3]. It is
advised for patients with obvious volume overload in order to alleviate
congestive symptoms and fluid weight (Class IIb, Level of Evidence: B). It has
also been found to improve long-term outcomes for patients with acute
decompensated heart failure (ADHF) [10]. The use of UF was shown to have little
effect on all-cause mortality over the longest follow-up periods studied, but UF
reduced all-cause re-hospitalization rates to
The ultrasonic cardiac output monitor (USCOM) 1A system (USCOM Ltd., Sydney, Australia) is a non-invasive Doppler stroke volume (SV) technique derived from echocardiography, that has been validated for a CO of 0.12 L/min to 18.3 L/min [15]. Moreover, it has the advantages of high repeatability, continuous monitoring and cost-effectiveness, and is especially suitable for predicting hemodynamic changes [16]. Furthermore, there are indicators on USCOM that reflect the volume, such as corrected flow time (FTc) and the systemic vascular resistance index (SVRI) [17, 18]. Compared with traditional invasive monitoring methods, such as pulse indicator continuous CO and Swan-Ganz floating catheters, USCOM can also obtain accurate and reliable data, and has been verified for both adult and pediatric patients [19, 20]. USCOM is easy to operate and trainees reached the same level as trainers after 50 operations, with the learning curve for skill acquisition being significantly shorter [21, 22]. USCOM combined with UF is a valuable tool for cardiologists to diagnose and manage the burden of body fluids, where adjusting UF periods according to USCOM data may well reduce the costs of AHF treatments. However, it remains a challenge to integrate optimally USCOM metrics with UF parameters to determine the exact timing of effective and timely monitoring of the UF endpoint.
The detection of B-type natriuretic peptide (BNP) or N-terminal pro-BNP
(NT-proBNP) is recommended for screening, diagnosis and differential diagnosis of
AHF, as well as for the assessment of the severity and prognosis of AHF [23, 24].
The variations of BNP before discharge have been independently associated with an
increased risk of cardiovascular events, re-hospitalization or death after
discharge [25]. At present, the Chinese guideline recommends UF to be applied for
7 consecutive days and BNP concentrations should be reduced by at least 50%
compared to baseline [26]. Studies have shown that 30% and 46% declines in BNP
at discharge are favorable values for the prognosis of heart failure patients
[10, 27]. Other authors proposed a BNP/NT-proBNP reduction
It would be of great clinical interest to have a predictor of when a patient has reached the endpoint of UF via hemodynamic changes. Therefore, the present single-blind, randomized control trial was designed to evaluate the feasibility of USCOM for determining UF endpoints during AHF treatments and to establish whether it is useful in reducing the financial burden on ADHF patients requiring UF. The primary objective of the trial was to evaluate differences in hemodynamics of patients receiving UF alone (U group) or UF + USCOM (UU group). The secondary objective was to construct a prediction model of potential indicators on USCOM (i.e., inotropy (INO), FTc, SVRI) for achieving UF standards based on threshold criteria of a 30% or 50% decrease in BNP concentration relative to baseline.
This study was a single-blind, randomized controlled trial where ADHF patients were randomly assigned to U (n = 20) and UU (n = 20) groups at a ratio of 1:1. UF alone and UF + USCOM treatments from Day 1 to Day 7 were monitored. Repeated measurement data of hemodynamic indicators (primary endpoint) in U and UU groups were collected. A 30% or 50% decrease in BNP concentrations relative to baseline was set as the criteria for achieving UF-endpoint. Detailed information are shown in Supplementary Fig. 1.
This trial was based on the American College of Cardiology, American Heart Association, and Heart Failure Society of America guidelines for the management of AHF [29] and involved 40 patients diagnosed with ADHF from January 2022 to July 2023. Patients were randomly assigned to U (n = 20) and UU (n = 20) groups.
The inclusion criteria were: (1) age
The exclusion criteria were: (1) hematocrit (HCT)
This study employed a randomized and single-blind design, where the randomization approach was “static randomization” and no stratification factors were set. The allocation of study participants was processed through an interactive web response system (IWRS), with a non-stratified permutated block size of 4. Patients were randomly assigned in a 1:1 ratio, with one group receiving UF treatment alone and the other receiving UF treatment plus USCOM monitoring. The statistician responsible for randomization set the randomization parameters in the background of the IWRS in advance. The IWRS generated the random allocation table, and the codes of the treatment regimens were also input into the system background. The study coordinator was responsible for obtaining the random number and corresponding treatment regimen through the IWRS and communicating the assignment information to the relevant investigator, in which, treating clinicians and the enrolled patients were unaware of group assignments.
The operation of USCOM only requires the placement of the probe in the patient’s pulmonary artery or aortic window for monitoring. In pulmonary artery window monitoring, the probe is positioned beside the right sternal border or upper abdomen to assess blood flow in the pulmonary artery, thereby monitoring the pulmonary circulation and right heart function. For aortic window monitoring, the probe is placed at the sternal notch or subclavian fossa (same as the pulmonary artery window), and measurements are taken from the aorta to assess the systemic circulation, primarily monitoring left ventricular output. USCOM is easy to operate and trainees reached the same level as trainers after about 50 operations, with the learning curve for skill acquisition being significantly shorter [21]. In the present trial, all patients in the UU group were monitored by the same skilled operator and three consecutive measurements were made with a deviation of no more than 10% each time, in order to ensure the consistency and reliability of the data.
Patients were assessed at baseline and throughout the period of treatment. The documented variables were medical history, physical examination data, echocardiography, laboratory blood test monitoring (continuous), including the total UF volume, body weight, patient symptoms, body position, transcutaneous oxygen saturation (SpO2), degree of edema, leg circumference, abdominal circumference, input-output balance and other variables for 7 days. Adverse events were assessed and documented by clinicians within 24 h.
The UF treatment period was generally for 3 days. On the 4th Day, the effect of UF was observed, and on the 7th Day, the recovery of diuretic sensitivity evaluated. Thus, measurements for UF parameters were taken on Day 1, Day 2, Day 3, Day 4 and Day 7. In the UU group, the parameters of USCOM were also monitored on Day 1, Day 2, Day 3, Day 4 and Day 7 using a non-invasive USCOM device, which employed transaortic or transpulmonary Doppler flow tracing; the valve area was estimated using the patient’s height, with subsequent calculation of CO.
Baseline data from the patients after enrollment were recorded, including age, gender and height. Test results were collected, including BNP, the blood urea nitrogen to creatinine ratio, creatinine, C-reactive protein, estimated glomerular filtration rate, hemoglobin, jugular venous pressure, left ventricular ejection fraction, neutrophils percentage, procalcitonin and white blood cell counts.
ADHF is a clinical syndrome characterized by newly developed AHF or a worsening of the previously diagnosed chronic heart failure, accompanied by progressive fluid retention, resulting in an abrupt decrease in CO and systemic congestion. In addition, the definitions of comorbidities related to ADHF included atrial fibrillation, cerebral stroke, chronic obstructive pulmonary disease, diabetes mellitus, dilated cardiomyopathy, hypertension, hyperlipidemia, ischemic cardiomyopathy, renal insufficiency and valvular heart disease, in accordance with guidelines and previous literature reviews [26, 30].
The USCOM monitored parameters included the SV index (SVI), SV variation (SVV), CO, cardiac index, systemic vascular resistance (SVR), SVRI and the velocity time integral (VTI). CO refers to the total volume of blood ejected by one side of the heart per minute and is one of the most direct indicators reflecting cardiac function. CO was estimated by heart rate (HR) and the flow calculated from the VTI and the cross-sectional area of the valve orifice. VTI refers to the integral of blood flow velocity over a single ejection time. Cardiac index was calculated by dividing CO by the body surface area. FTc refers to the time required by the heart for systolic ejection, which was calculated using Bazett’s formula [17]. SV was calculated by measuring the Doppler flow in the aortic valve, which refers to the amount of blood ejected into the aorta during each systole. SVV was the percentage change in SV with each systole, that is, the percentage of the difference between the maximum and minimum SV values within a certain period of time compared to the average SV value during that period [31]. SVRI refers to the force exerted by peripheral blood vessels on the circulating blood [32].
The primary endpoint was differences in the hemodynamics of patients in the U
and UU groups during UF, monitored at Day 1, Day 2, Day 3, Day 4 and Day 7. The
secondary endpoints were the identification of one or more indicators on the
USCOM that could predict the endpoint of UF, in which, thresholds of a
30% or 50% reduction in BNP relative to baseline were set as criteria for
reaching the UF endpoint. Additionally, the economic benefits including treatment
costs (such as UF related costs, hospitalization expenses, costs of blood
concentrator, hemodialysis circuit and continuous renal replacement therapy),
hospitalization duration and re-hospitalization rates at
All statistical analyses were conducted using SPSS (version 26.0, IBM Corp.,
Chicago, IL, USA) and p-values
The sample size was not calculated prior to enrollment, but post hoc power
estimates were carried out using G*Power 3.1 software (University of Dusseldorf,
Dusseldorf, Germany). Based on previously published study by Liu et al.
[33] and the primary endpoint of the present trial, the assessment of
hemodynamics differences between the U and UU groups during UF was considered,
with monitoring performed at Day 1, Day 2, Day 3, Day 4 and Day 7. The present
trial particularly focused on the time to achieve UF endpoints during emergency
hospitalization in patients with AHF, analyzing the correlation between
hemodynamic changes in the UU group and the U endpoint markers before and after
achieving U achievement. The assumption was made that the UU group would have a
reduced average length of emergency stay of 8 days compared to conventional
medication, and the U group time by 4.5 days. Under the premise of a one-sided
p
In this trial, the overall population exhibited the following median (interquartile range (IQR)) values: hemoglobin concentrations of
117.0 g/L (110.0, 124.8 g/L), creatinine 128.0 µmoI/L (86.3, 163.7
µmoI/L), an estimated glomerular filtration rate of 48.9 mL/min/1.73
m2 (29.5, 64.4 mL/min/1.73 m2), left ventricular ejection fraction
44.0% (32.9, 56.8%) and a BNP concentration of 2098.8 ng/L (922.0, 3929.0
ng/L). Notably, 95% of patients presented with renal insufficiency, 72.5%
hypertension and 65.0% were diagnosed with diabetes mellitus. Cerebral stroke was
diagnosed in 22.5% of cases, while chronic obstructive pulmonary disease
occurred in 1 case. Additionally, the congestion status of the two groups showed
that the blood urea nitrogen to creatinine ratio was 26.6 in the UU group and
24.6 for the U group. Among 28 patients (70.0%) received positive inotropic
support medication, mainly dopamine (47.5%), followed by a type 3
phosphodiesterase inhibitor (milrinone) (32.5%) in both groups. It is worth
noting that the baseline and clinical characteristics of the two treatment groups
were closely matched (all p
| Total (n = 40) | UU Group (n = 20) | U group (n = 20) | p-value | ||
| Gender, n (%) | |||||
| Male | 21 (52.5) | 13 (65.0) | 8 (40.0) | 0.205 | |
| Female | 19 (47.5) | 7 (35.0) | 12 (60.0) | ||
| Age (years) | 74.5 (65.3, 82.0) | 79.0 (69.5, 83.8) | 72.0 (57.8, 81.5) | 0.093 | |
| Height (cm) | 164.5 (160.0, 171.0) | 164.5 (159.3, 171.5) | 163.5 (160.0, 171.0) | 0.888 | |
| Weight (kg) | 69.0 (60.0, 80.0) | 63.5 (57.8, 75.0) | 71.0 (64.3, 83.8) | 0.157 | |
| BMI (kg/m2) | 24.8 (22.6, 29.0) | 24.4 (21.9, 27.9) | 26.2 (22.8, 30.7) | 0.303 | |
| Hemoglobin (g/L) | 117.0 (110.0, 124.8) | 119.0 (107.3, 128.8) | 116.0 (110.0, 123.0) | 0.369 | |
| Creatinine (µmoI/L) | 128.0 (86.3, 163.7) | 96.1 (85.2, 135.8) | 147.2 (89.0, 176.0) | 0.142 | |
| Estimated glomerular filtration rate (mL/min/1.73 m2) | 48.9 (29.5, 64.4) | 49.8 (41.6, 61.3) | 35.3 (25.7, 70.0) | 0.142 | |
| C-reactive protein (mg/L) | 7.2 (5.8, 10.3) | 7.2 (4.5, 7.5) | 8.2 (6.2, 12.2) | 0.083 | |
| Procalcitonin (ng/mL) | 1.5 (0.2, 2.0) | 1.3 (0.1, 1.8) | 1.5 (0.9, 2.8) | 0.316 | |
| White blood cell count (×109/L) | 5.6 (5.1, 6.4) | 5.5 (5.0, 5.9) | 5.7 (5.2, 6.8) | 0.203 | |
| Neutrophil (%) | 70.6 (68.2, 75.7) | 70.2 (66.4, 75.7) | 71.4 (68.8, 76.7) | 0.208 | |
| Left ventricular ejection fraction (%) | 44.0 (32.9, 56.8) | 46.5 (33.0, 56.8) | 41.7 (32.9, 57.5) | 0.947 | |
| BNP (pg/mL) | 2098.8 (922.0, 3929.0) | 1990.3 (1080.0, 4562.2) | 2098.8 (703.0, 3506.6) | 0.242 | |
| Jugular venous pressure (cmH2O) | 18.0 (16.0, 19.8) | 18.0 (16.0, 19.7) | 18.5 (13.8, 19.8) | 0.902 | |
| Blood urea nitrogen to creatinine ratio | 25.3 (21.6, 29.4) | 26.6 (21.8, 30.4) | 24.6 (21.3, 27.3) | 0.337 | |
| Etiology of ADHF, n (%) | |||||
| Ischemic cardiomyopathy | 21 (52.5) | 10 (50.0) | 11 (55.0) | 0.083 | |
| Dilated cardiomyopathy | 7 (17.5) | 4 (20.0) | 3 (15.0) | 0.316 | |
| Valvular heart disease | 3 (33.3) | 2 (10.0) | 1 (5.0) | 0.203 | |
| Atrial fibrillation | 19 (47.5) | 10 (50.0) | 9 (45.0) | 0.208 | |
| Hypertension | 29 (72.5) | 13 (65.0) | 16 (80.0) | 0.478 | |
| Hyperlipidemia | 10 (25.0) | 4 (20.0) | 6 (30.0) | 0.472 | |
| Chronic obstructive pulmonary disease | 1 (2.5) | 1 (5.0) | 0 (0.0) | 1.000 | |
| Renal insufficiency | 38 (95.0) | 20 (100.0) | 18 (90.0) | 0.490 | |
| Diabetes mellitus | 26 (65.0) | 12 (60.0) | 14 (70.0) | 0.512 | |
| Cerebral stroke | 9 (22.5) | 7 (35.0) | 2 (10.0) | 0.132 | |
| Positive inotropic agents, n (%) | 28 (70.0) | 14 (70.0) | 13 (65) | 1.000 | |
| Dopamine | 19 (47.5) | 10 (50.0) | 9 (45.0) | 1.000 | |
| Type 3 phosphodiesterase inhibitor (milrinone) | 13 (32.5) | 4 (20.0) | 9 (45.0) | 0.176 | |
| Calcium sensitizer (levosimendan) | 7 (17.5) | 4 (20.0) | 3 (15.0) | 1.000 | |
| Epinephrine | 3 (7.5) | 1 (5.0) | 2 (10.0) | 1.000 | |
| Hydroxylamine | 3 (7.5) | 2 (10.0) | 1 (5.0) | 1.000 | |
| Isoproterenol | 2 (5.0) | 1 (5.0) | 1 (5.0) | 1.000 | |
| Digitalis medication | 11 (27.5) | 4 (20.0) | 7 (35.0) | 0.480 | |
Note. Data are presented as medians (Q1, Q3) and n (%).
Abbreviations: ADHF, acute decompensated heart failure; BMI, body mass index; BNP, B-type natriuretic peptide; U group, ultrafiltration group; UU group, ultrafiltration + ultrasonic cardiac output monitor group.
As shown in Fig. 1, there were no statistically significant differences between
the two groups (UU and U) in the change rates of variables such as mean arterial
pressure (MAP), HR, urine output, HCT and BNP at different time points (all
p
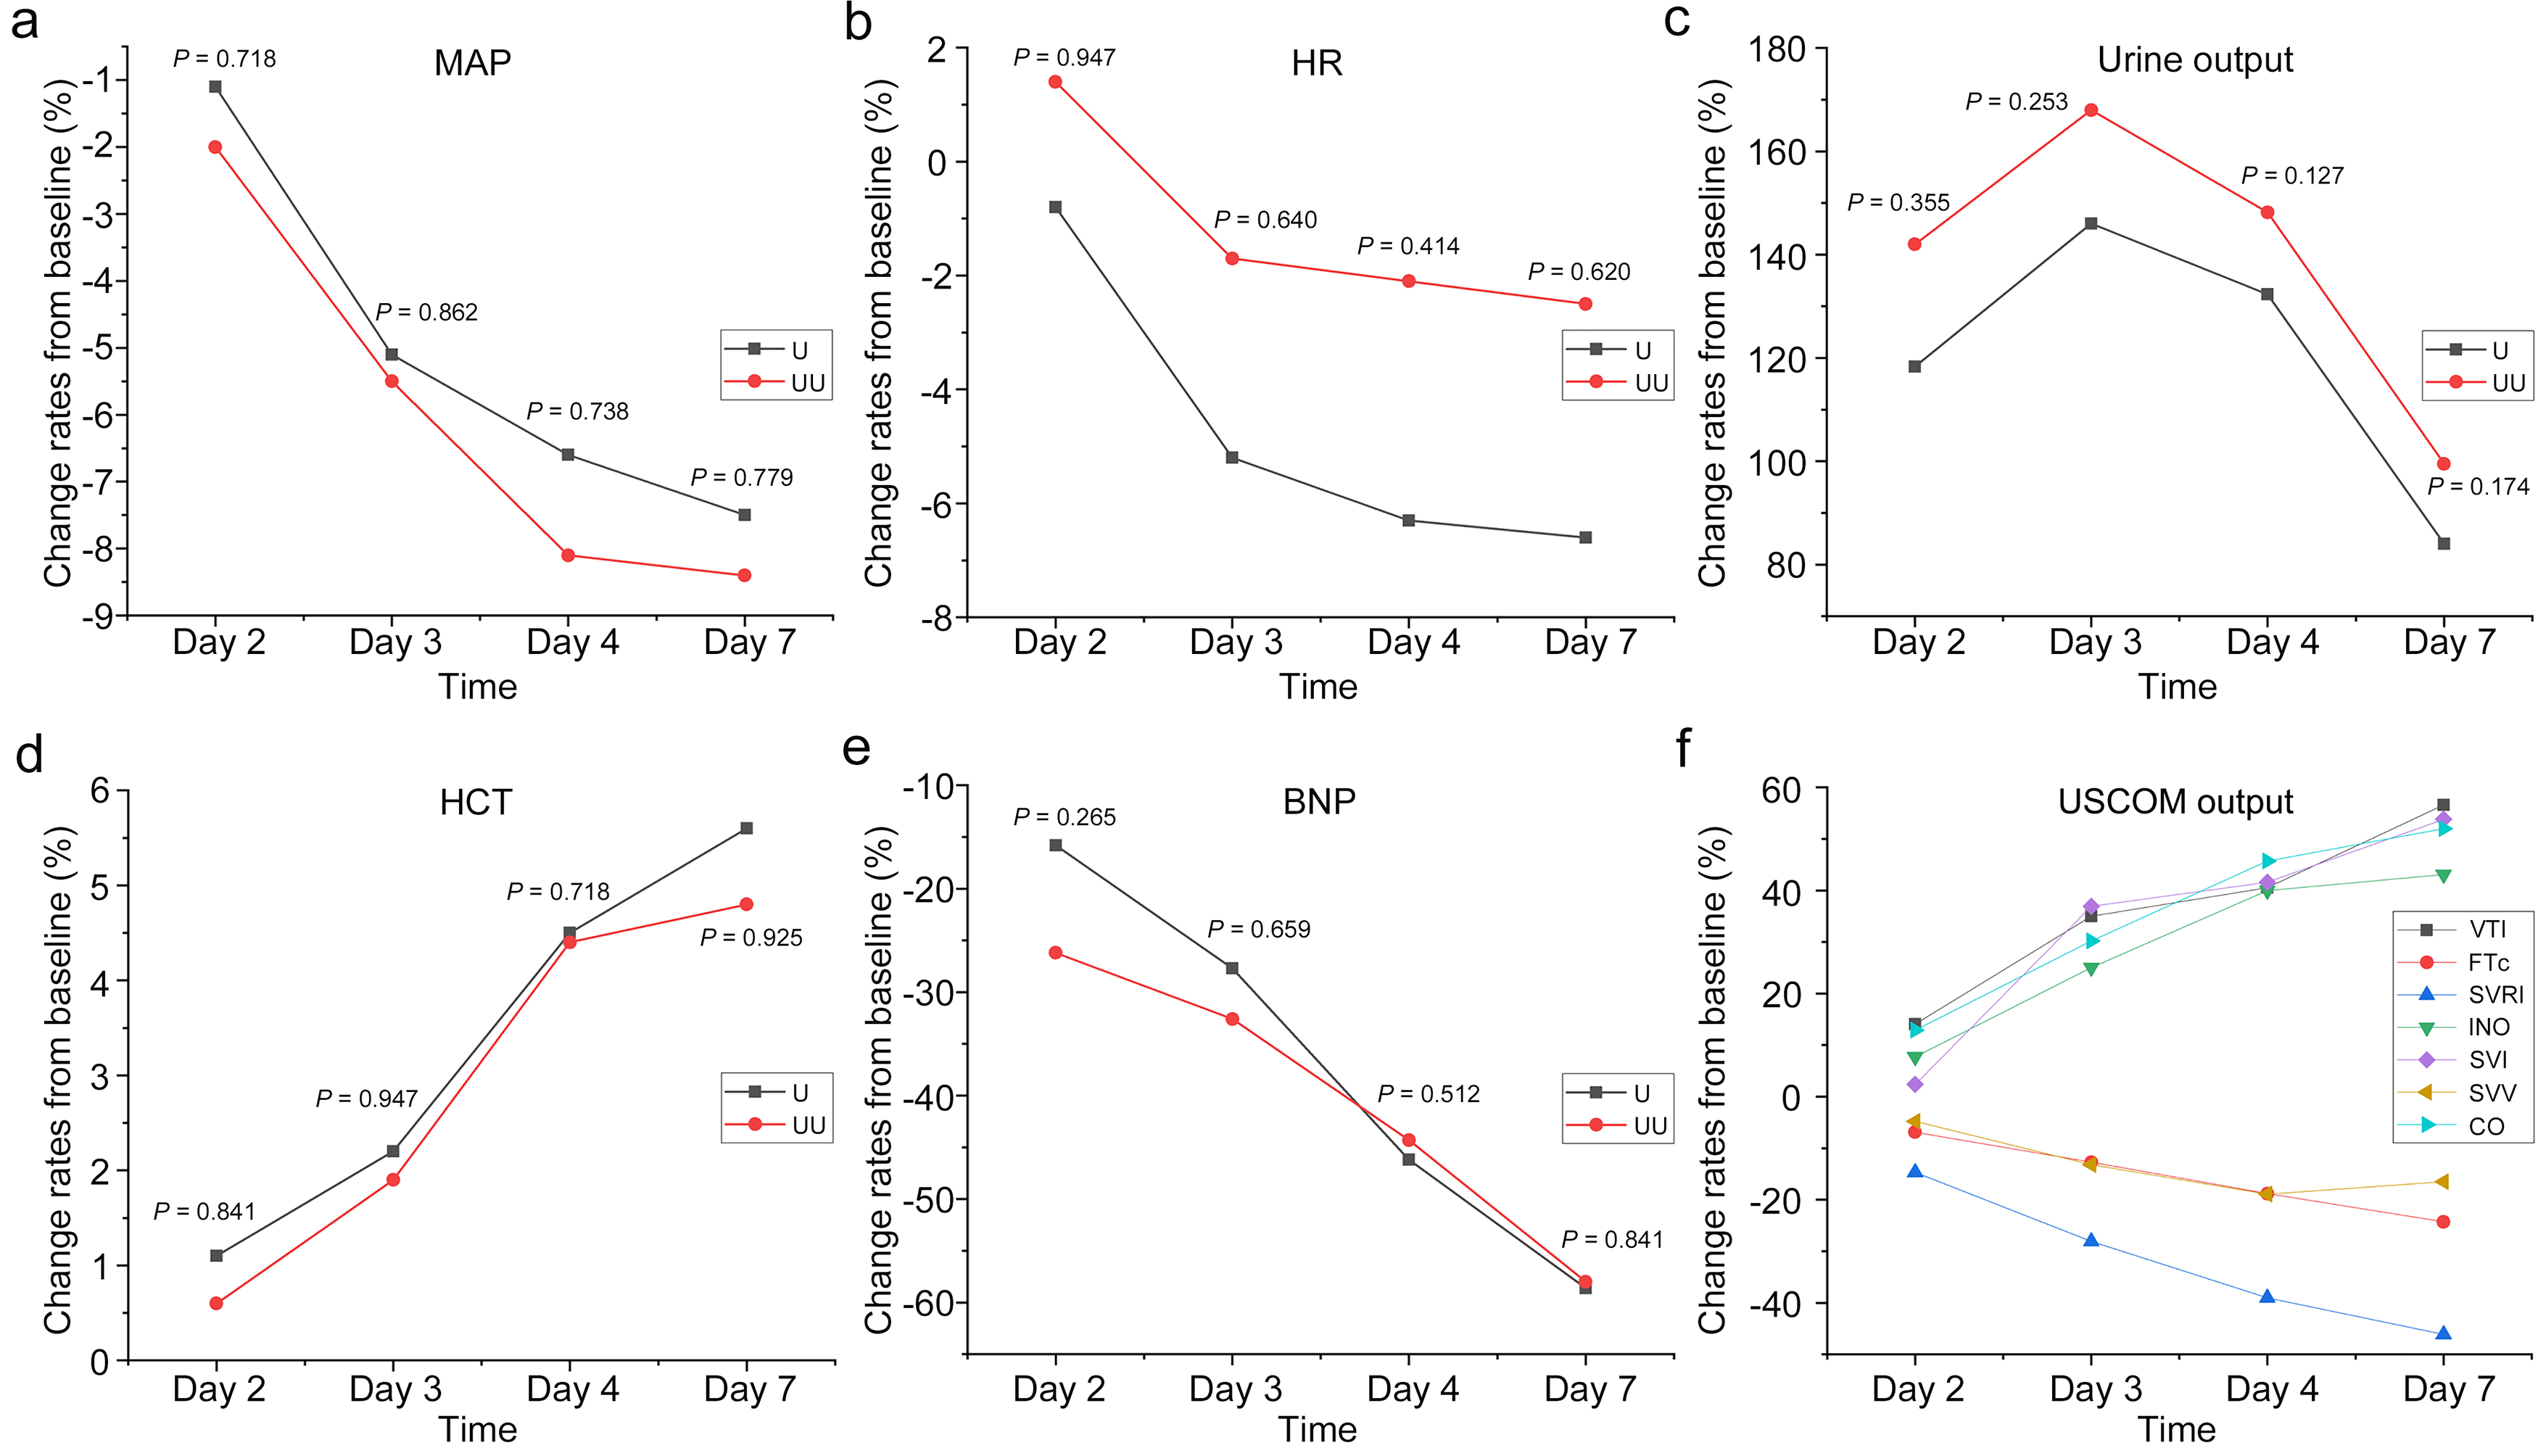 Fig. 1.
The trends of change rates on Day 2, Day 3, Day 4 and Day 7 from baseline in (a) MAP, (b) HR, (c) urine output, (d) HCT and (e) BNP measured by UF parameters in the U and UU groups, and (f) USCOM output in the UU group. BNP, B-type natriuretic peptide; CO, cardiac output; FTc, corrected flow time; HCT, hematocrit; HR, heart rate; INO, inotropy; MAP, mean arterial pressure; SVI, stroke volume index; SVV, stroke volume variation; SVRI, systemic vascular resistance index; VTI, velocity time integral; UF, ultrafiltration; USCOM, ultrasonic cardiac output monitor; U group, ultrafiltration group; UU group, ultrafiltration + ultrasonic cardiac output monitor group.
Similarly, from Table 2, we can more clearly perceive the indicators
related to UF. In both the U and UU groups, diastolic blood pressure, urine
output, HCT and BNP exhibited a linear increase or decrease in the changes from
baseline as UF progressed (p-trend
| Day 1 | p-value | p-value | p-value | ||||||
| (trend for 1–4 days) | (Day 7 vs. Day 4) | (trend) | |||||||
| UF parameters of the U group | SBP (mmHg) | 133.5 (117.3, 154.5) | –1.0 (–11.5, 5.8) | –3.5 (–14.8, 5.0) | 0.0 (–14.8, 7.0) | –6.0 (–15.2, 2.0) | 0.072 | 0.621 | 0.065 |
| DBP (mmHg) | 70.0 (64.0, 81.3) | –2.0 (–8.2, 5.2) | –5.5 (–14.0, 1.5) | –8.0 (–13.2, 0.2) | –8.0 (–16.2, 0.5) | 0.003 | 0.726 | 0.007 | |
| MAP (mmHg) | 94.8 (83.3, 104.5) | –0.5 (–6.1, 3.5) | –5.7 (–14.2, 2.7) | –6.2 (–16.0, 1.0) | –8.3 (–14.0, 0.4) | 0.004 | 0.634 | 0.006 | |
| HR (bpm) | 82.0 (72.0, 91.8) | 3.5 (–6.2, 5.2) | –3.5 (–11.2, 3.8) | –7.0 (–14.2, 2.5) | –8.0 (–15.0, 2.2) | 0.194 | 0.649 | 0.094 | |
| Urine output (mL) | 950.0 (700.0, 1362.5) | 750.0 (562.5, 1195.0) | 1175.0 (637.5, 1625.0) | 850.0 (568.8, 1350.0) | 475.0 (237.5, 925.0) | 0.726 | 0.005 | ||
| SpO2 (%) | 96.0 (95.0, 97.0) | 0.5 (0.0, 1.2) | 0.5 (0.0, 2.0) | 1.0 (0.0, 2.0) | 1.0 (0.0, 2.0) | 0.266 | 0.359 | 0.053 | |
| HCT (%) | 35.0 (33.1, 36.3) | –0.0 (–1.1, 2.0) | 1.0 (–0.5, 2.4) | 2.4 (0.1, 3.4) | 1.2 (0.7, 3.2) | 0.007 | 0.431 | 0.001 | |
| BNP (pg/mL) | 2098.9 (709.7, 3015.8) | –168.4 (–844.8, –29.8) | –570.2 (–1276.9, –129.2) | –1218.1 (–1646.0, –328.7) | –1512.0 (–1891.5, –406.4) | 0.007 | |||
| UF parameters of the UU group | SBP (mmHg) | 128.5 (111.2, 148.0) | –2.0 (–7.0, 2.5) | –8.5 (–17.5, 1.2) | –8.5 (–17.8, –3.8) | –9.5 (–17.0, –2.8) | 0.070 | 0.492 | 0.056 |
| DBP (mmHg) | 66.5 (63.8, 81.0) | 0.0 (–4.2, 2.0) | –3.0 (–9.8, 1.0) | –6.0 (–12.5, –2.0) | –5.5 (–14.2, –2.0) | 0.004 | 0.911 | 0.021 | |
| MAP (mmHg) | 90.2 (81.0, 98.7) | –0.7 (–5.3, 1.7) | –5.2 (–10.2, –0.4) | –6.5 (–12.8, –4.5) | –5.2 (–11.9, –2.3) | 0.004 | 0.720 | 0.011 | |
| HR (bpm) | 84.5 (71.8, 106.2) | 0.5 (–13.0, 13.0) | –2.7 (–9.9, 10.6) | –3.0 (–13.2, 13.5) | –3.0 (–14.5, 9.8) | 0.400 | 0.755 | 0.331 | |
| Urine output (mL) | 895.0 (700.0, 1000.0) | 1205.0 (836.0, 1612.5) | 1375.0 (961.0, 2000.0) | 1139.0 (975.0, 1462.5) | 750.0 (500.0, 987.5) | 0.857 | |||
| SpO2 (%) | 96.0 (95.0, 97.0) | 1.0 (–1.0, 2.2) | 1.0 (0.0, 2.0) | 1.0 (1.0, 2.0) | 1.5 (0.0, 3.0) | 0.237 | 0.644 | 0.104 | |
| HCT (%) | 35.9 (33.6, 38.1) | 0.1 (–0.7, 1.5) | 1.2 (–0.1, 1.9) | 1.9 (0.5, 2.6) | 2.2 (0.1, 3.0) | 0.002 | 0.466 | 0.001 | |
| BNP (pg/mL) | 1647.0 (1047.0, 4041.3) | –314.0 (–794.6, –204.4) | –748.8 (–1221.4, –248.5) | –837.0 (–1691.0, –352.7) | –1036.5 (–1853.2, –502.9) | 0.002 | |||
| USCOM monitoring output of the UU group | SV (mL) | 22.3 (14.1, 33.5) | 0.7 (–3.5, 6.2) | 9.2 (1.5, 14.9) | 8.9 (–0.9, 21.2) | 12.1 (3.6, 21.9) | 0.279 | ||
| SVI (mL/beats) | 12.5 (7.8, 18.8) | 0.4 (–2.0, 3.2) | 4.6 (0.8, 7.3) | 5.1 (–0.5, 11.0) | 7.0 (2.0, 11.7) | 0.250 | |||
| SVV (%) | 58.5 (34.5, 72.5) | –3.5 (–16.5, 16.0) | 0.2 (–28.8, 14.0) | –5.0 (–30.0, 14.2) | –9.5 (–27.8, 16.0) | 0.430 | 0.505 | 0.927 | |
| CO (L/min) | 1.9 (1.6, 2.3) | 0.3 (–0.2, 0.4) | 0.5 (0.3, 1.0) | 0.8 (0.3, 1.1) | 1.2 (0.2, 1.6) | 0.027 | |||
| Cardiac index, (L/min/m2) | 1.1 (0.8, 1.3) | 0.1 (–0.1, 0.2) | 0.3 (0.2, 0.5) | 0.4 (0.2, 0.7) | 0.6 (0.1, 0.8) | 0.020 | |||
| INO (W/m2) | 0.6 (0.4, 0.9) | 0.1 (0.0, 0.2) | 0.1 (0.1, 0.3) | 0.3 (0.2, 0.4) | 0.3 (0.2, 0.4) | 0.009 | |||
| SVRI (mmHg·min/mL) | 8339 (6356, 13,527) | –1116 (–1975.5, –689.5) | –2011.5 (–3870.0, –1565.8) | –3594.5 (–4674.0, –2180.0) | –4080 (–6530.0, –2656.0) | ||||
| SVR (mmHg·min/L) | 4430 (3258, 7862) | –594 (–1130.0, –377.6) | –1106.1 (–2135.3, –863.9) | –1696.4 (–2779.5, –1188.6) | –1925.5 (–3745.3, –1282.1) | ||||
| FTc (ms) | 427 (388, 464) | –25 (–39.5, –8.5) | –46.5 (–65.2, –33.5) | –70.5 (–115.0, –54.8) | –103.5 (–144.2, –84.2) | ||||
| VTI (cm) | 8.1 (6.4, 9.4) | 0.9 (0.4, 1.8) | 2.6 (1.1, 4.1) | 3.1 (1.8, 5.7) | 5.3 (2.8, 7.1) | ||||
Note. Data are presented as median (Q1, Q3) unless otherwise indicated.
Abbreviations: BNP, B-type natriuretic peptide; CO, cardiac output; DBP, diastolic blood pressure; FTc, corrected flow time; HCT, hematocrit; HR, heart rate; INO, inotropy; MAP, mean arterial pressure; SBP, systolic blood pressure; SpO2, oxygen saturation; SV, stroke volume; SVI, stroke volume index; SVR, systemic vascular resistance; SVRI, systemic vascular resistance index; SVV, stroke volume variation; UF, ultrafiltration; USCOM, ultrasonic cardiac output monitor; U group, ultrafiltration group; UU group, ultrafiltration + ultrasonic cardiac output monitor group; VTI, velocity time integral.
We conducted an analysis using Supplementary Table 1, and the results
showed that change rates in SV and SVI in the USCOM were negatively correlated
with change rates in MAP (r = –0.329, p = 0.003), and positively
correlated with change rates of HR (r = 0.673, p
Before performing the multivariate regression analysis, we selected variables
based not only on their statistical significance in univariate analysis
(p
| Univariate analysis | Multivariate analysis | Hosmer-Lemeshow test | ||||||
| Substandard (BNP) | Standard (BNP) | p-value | Substandard (BNP) | Standard (BNP) | OR (95% CI) | p-value | ||
| Age (years) | 79.0 (72.0, 84.0) | 78.0 (68.8, 83.0) | 0.247 | 79.0 (72.0, 84.0) | 78.0 (68.8, 83.0) | 0.549 | ||
| SVI (mL/beats) | 22.5 (–6.6, 47.8) | 43.9 (1.3, 89.7) | 0.033 | 22.5 (–6.6, 47.8) | 43.9 (1.3, 89.7) | 0.162 | ||
| SVV (%) | –1.3 (–29.9, 37.6) | –17.4 (–40.9, 39.5) | 0.358 | –1.3 (–29.9, 37.6) | –17.4 (–40.9, 39.5) | 0.933 | ||
| Cardiac output (L/min) | 19.8 (5.8, 47.9) | 34.1 (9.2, 73.6) | 0.145 | 19.8 (5.8, 47.9) | 34.1 (9.2, 73.6) | 0.574 | ||
| INO (W/m2) | 13.5 (4.2, 30.5) | 39.5 (26.7, 63.9) | 13.5 (4.2, 30.5) | 39.5 (26.7, 63.9) | 1.028 (1.005–1.051) | 0.015 | 0.814 | |
| Cardiac index (L/min/m2) | 19.8 (5.8, 47.9) | 34.1 (9.2, 73.6) | 0.145 | 19.8 (5.8, 47.9) | 34.1 (9.2, 73.6) | 0.574 | ||
| SVRI (mmHg·min/mL) | –21.0 (–33.8, –14.2) | –38.3 (–48.8, –28.4) | –21.0 (–33.8, –14.2) | –38.3 (–48.8, –28.4) | 0.933 (0.892–0.976) | 0.003 | 0.814 | |
| FTc (ms) | –10.0 (–13.7, –4.3) | –17.7 (–27.0, –9.2) | 0.002 | –10.0 (–13.7, –4.3) | –17.7 (–27.0, –9.2) | 0.230 | ||
| VTI (cm) | 18.1 (8.4, 38.1) | 34.6 (22.4, 67.7) | 0.003 | 18.1 (8.4, 38.1) | 34.6 (22.4, 67.7) | 0.126 | ||
| HR (bpm) | –0.8 (–10.5, 24.6) | –4.6 (–22.8, 14.0) | 0.090 | –0.8 (–10.5, 24.6) | –4.6 (–22.8, 14.0) | 0.116 | ||
| SpO2 (%) | 1.0 (–1.0, 2.1) | 1.0 (0, 2.4) | 0.128 | 1.0 (–1.0, 2.1) | 1.0 (0, 2.4) | 0.109 | ||
| HCT (%) | 2.6 (–1.2, 5.5) | 5.3 (–2.5, 7.9) | 0.291 | 2.6 (–1.2, 5.5) | 5.3 (–2.5, 7.9) | 0.794 | ||
| Urine output (mL) | 133.8 (98.6, 200.0) | 124.9 (89.3, 184.0) | 0.306 | 133.8 (98.6, 200.0) | 124.9 (89.3, 184.0) | 0.735 | ||
| MAP (mmHg) | –4.0 (–10.9, –0.9) | –6.5 (–11.5, –1.7) | 0.390 | –4.0 (–10.9, –0.9) | –6.5 (–11.5, –1.7) | 0.458 | ||
Note. Data represent the change rates, except the age and are expressed as median (Q1, Q3).
Abbreviations: BNP, B-type natriuretic peptide; CI, confidence interval; FTc, corrected flow time; HCT, hematocrit; HR, heart rate; INO, inotropy; MAP, mean arterial pressure; OR, odds ratio; SpO2, oxygen saturation; SVI, stroke volume index; SVRI, systemic vascular resistance index; SVV, stroke volume variation; UF, ultrafiltration; USCOM, ultrasonic cardiac output monitor; VTI, velocity time integral.
Since a 30% or 50% decrease in BNP is the clinical standard for achieving UF, we used these two thresholds as cut-off values to separate the study patients into those who met the standard and those who did not on Day 4 compared to the baseline. Multivariate logistic regression showed that INO (odds ratio (OR) 1.028, 95% confidence interval (CI): 1.005–1.051; p = 0.015) and SVRI (OR 0.933, 95% CI: 0.892–0.976; p = 0.003) on USCOM were found to be factors correlated to a 30% reduction in BNP on Day 4 compared to the baseline (Table 3), while FTc (OR 0.916, 95% CI: 0.865–0.969; p = 0.002) and HR (OR 0.965, 95% CI: 0.939–0.991; p = 0.009) on USCOM were found to be independent factors correlated to a 50% reduction in BNP on Day 4 compared to the baseline (Table 4).
| Univariate analysis | Multivariate analysis | Hosmer-Lemeshow test | ||||||
| Substandard (BNP) | Standard (BNP) | p-value | Substandard (BNP) | Standard (BNP) | OR (95% CI) | p-value | ||
| Age (years) | 79.0 (73.0, 84.0) | 71.0 (63.0, 79.0) | 0.001 | 79.0 (73.0, 84.0) | 71.0 (63.0, 79.0) | 0.065 | ||
| SVI (mL/beats) | 26.3 (–4.2, 56.3) | 52.6 (20.8, 173.5) | 0.021 | 26.3 (–4.2, 56.3) | 52.6 (20.8, 173.5) | 0.564 | ||
| SVV (%) | –3.7 (–34.6, 37.4) | –18.2 (–39.8, 39.4) | 0.617 | –3.7 (–34.6, 37.4) | –18.2 (–39.8, 39.4) | 0.415 | ||
| CO (L/min) | 26.0 (8.6, 56.4) | 31.3 (12.4, 90.5) | 0.395 | 26.0 (8.6, 56.4) | 31.3 (12.4, 90.5) | 0.441 | ||
| INO (W/m2) | 25.0 (7.7, 45.1) | 39.8 (28.4, 92.1) | 0.006 | 25.0 (7.7, 45.1) | 39.8 (28.4, 92.1) | 0.089 | ||
| Cardiac index (L/min/m2) | 26.0 (8.6, 56.4) | 31.3 (12.4, 90.5) | 0.395 | 26.0 (8.6, 56.4) | 31.3 (12.4, 90.5) | 0.441 | ||
| SVRI (mmHg·min/mL) | –29.0 (–38.0, –18.3) | –39.9 (–48.9, –31.6) | 0.006 | –29.0 (–38.0, –18.3) | –39.9 (–48.9, –31.6) | 0.136 | ||
| FTc (ms) | –10.6 (–19.8, –5.5) | –23.3 (–31.3, –13.3) | 0.001 | –10.6 (–19.8, –5.5) | –23.3 (–31.3, –13.3) | 0.916 (0.865–0.969) | 0.002 | 0.655 |
| VTI (cm) | 26.4 (11.8, 46.7) | 55.7 (29.7, 78.9) | 0.002 | 26.4 (11.8, 46.7) | 55.7 (29.7, 78.9) | 0.560 | ||
| HR (bpm) | 2.8 (–11.0, 21.4) | –14.1 (–34.9, 0) | 0.002 | 2.8 (–11.0, 21.4) | –14.1 (–34.9, 0) | 0.965 (0.939–0.991) | 0.009 | 0.655 |
| SpO2 (%) | 1.0 (0, 2.1) | 2.0 (0, 3.2) | 0.522 | 1.0 (0, 2.1) | 2.0 (0, 3.2) | 0.367 | ||
| HCT (%) | 4.3 (–0.5, 6.7) | 1.9 (–4.2, 8.5) | 0.359 | 4.3 (–0.5, 6.7) | 1.9 (–4.2, 8.5) | 0.182 | ||
| Urine output (mL) | 138.5 (101.1, 193.1) | 106.5 (78.6, 134.3) | 0.005 | 138.5 (101.1, 193.1) | 106.5 (78.6, 134.3) | 0.094 | ||
| MAP (mmHg) | –5.2 (–13.1, –0.3) | –6.6 (–10.8, –2.4) | 0.733 | –5.2 (–13.1, –0.3) | –6.6 (–10.8, –2.4) | 0.326 | ||
Note. Data represent the change rates, except the age, and are expressed as median (Q1, Q3).
Abbreviations: BNP, B-type natriuretic peptide; CI, confidence interval; CO, cardiac output; FTc, corrected flow time; HCT, hematocrit; HR, heart rate; INO, inotropy; MAP, mean arterial pressure; OR, odds ratio; SpO2, oxygen saturation; SVI, stroke volume index; SVRI, systemic vascular resistance index; SVV, stroke volume variation; UF, ultrafiltration; USCOM, ultrasonic cardiac output monitor; VTI, velocity time integral.
Additionally, in this trial, using a 30% reduction in BNP as the criterion for UF success, the proportion of patients achieving the standard by Day 7 was 90% in the U group and 100% in the UU group, with a median achievement time of 4.0 days for both groups. The average time to standard achievement was 5.9 days in the UU group and 6.0 days in the U group.
By Day 7, using a 50% reduction in BNP as the criterion for UF success, the proportion of patients achieving the standard was 70% in both the U and UU groups, with a median achievement time of 7 days. The average time to standard achievement was 3.5 days in the UU group and 3.9 days in the U group.
After including variables directly affecting UF standards (all p
After including variables directly affecting UF standards (all p
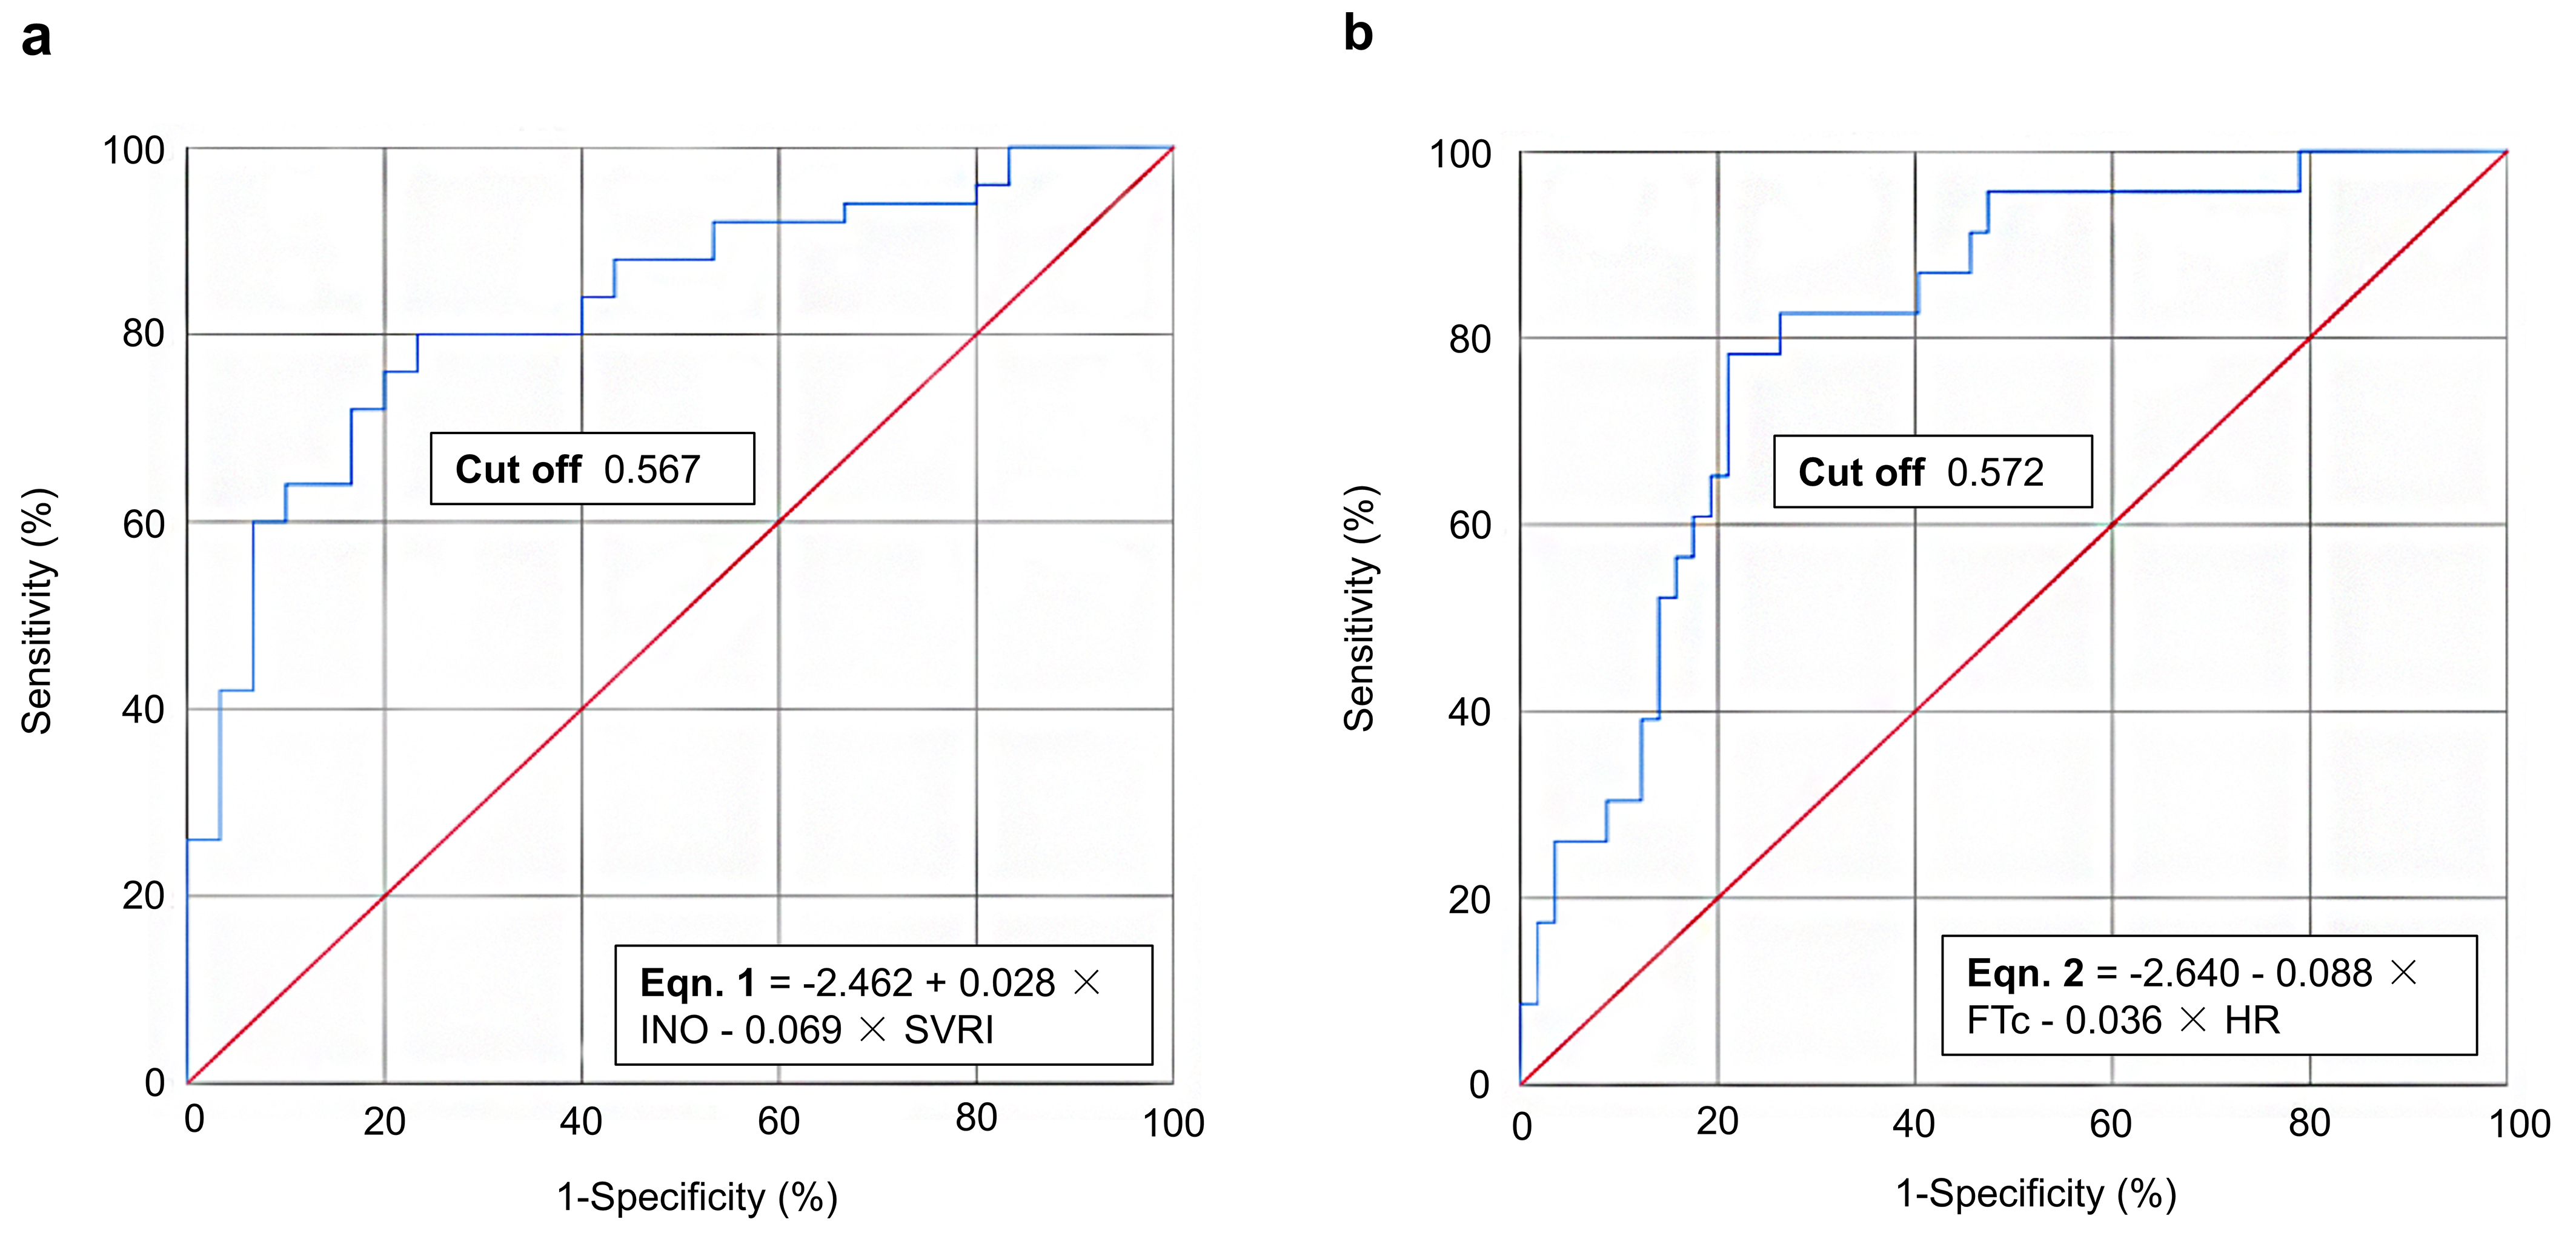 Fig. 2.
ROC curve analysis for achieving UF standards of thresholds of (a) 30% and (b) 50% reduction in BNP concentrations relative to baseline on Day 4. BNP, B-type natriuretic peptide; FTc, corrected flow time; HR, heart rate; INO, inotropy; ROC, receiver operating characteristic; SVRI, systemic vascular resistance index; UF, ultrafiltration.
For the condition of considering a reduction in BNP on Day 4 compared to a
baseline of
No adverse events were reported due to USCOM within 24 h, indicating that USCOM was a safe and non-invasive monitoring device.
The use of USCOM could significantly reduce treatment costs including UF related
costs (1309.9 vs. 955.8 USD, p = 0.030), hospitalization expenses
(5175.5 vs. 3524.6 USD, p = 0.007) and costs of blood concentrator
(504.0 vs. 336.0 USD, p = 0.046) and the hemodialysis circuit (546.0 vs.
364.0 USD, p = 0.046), as well as a shorter mean hospitalization
duration (9.3 vs. 12.8 days, p = 0.015). In addition, there was no
significant difference in re-hospitalization rates associated with heart failure
at
| Total (n = 40) | UU group (n = 20) | U group (n = 20) | p-value | ||
| Treatment costs (USD) | |||||
| UF related costs | 1208.8 (896.1, 1327.0) | 955.8 (862.4, 1277.4) | 1309.9 (919.8, 1331.0) | 0.030 | |
| Hospitalization expenses | 3769.5 (3152.8, 5506.1) | 3524.6 (2923.1, 4245.4) | 5175.5 (3465.1, 7732.1) | 0.007 | |
| Blood concentrator | 420.0 (336.0, 504.0) | 336.0 (336.0, 504.0) | 504.0 (336.0, 504.0) | 0.046 | |
| Hemodialysis circuit | 455.0 (364.0, 546.0) | 364.0 (364.0, 546.0) | 546.0 (364.0, 546.0) | 0.046 | |
| Continuous renal replacement therapy | 235.2 (156.8, 268.8) | 156.8 (156.8, 268.8) | 268.8 (156.8, 268.8) | 0.142 | |
| Hospitalization durations (Days) | 11.0 |
9.3 |
12.8 |
0.015 | |
| Re-hospitalization at 30 days or less, n (%) | 9 (22.5) | 4 (20.0) | 5 (25.0) | 0.705 | |
Note. Data are presented as medians (Q1, Q3) and the mean
Abbreviations: UF, ultrafiltration; USCOM, ultrasonic cardiac output monitor; U group, ultrafiltration group; UU group, ultrafiltration + ultrasonic cardiac output monitor group.
The present study found that change rates in MAP, HR, urine output, HCT and BNP over 7 days were similar between the U and
UU groups. Our study also evaluated whether USCOM could be used to estimate the
endpoints of UF for ADHF patients and provided two UF-endpoint prediction
formulae for evaluating a 30% reduction in BNP: –2.462 + 0.028
The introduction of non-invasive devices for monitoring CO in AHF patients represents a significant advance in that they can reduce the occurrence of complications (e.g., infection, thrombosis) compared with invasive hemodynamic monitoring [34]. The present trial also confirmed that USCOM was a safe non-invasive device, as no adverse events due to USCOM were observed within 24 h. Current non-invasive approaches for determining CO include impedance cardiography and echocardiography, but other techniques are under investigation but are proving to have varying efficacies [35]. Operator dependence was undoubtedly the greatest limitation for the application of echocardiography. That is, the operator required advanced experience and echocardiography training, so that the learning curve was even longer compared to that of other non-invasive hemodynamic monitoring approaches [36]. Impedance cardiography was an operator-independent cost-effective and non-invasive approach, but the measurement accuracy might be limited to pathological states, such as too low or high CO values, valvular regurgitation, intracardiac shunts and the incidence of arrhythmia [37]. The clinical application worth of USCOM remains controversial, with its accuracy and precision being assessed with varied results compared with other non-invasive methods [38, 39]. USCOM was easy to operate so that trainees could reach the same level as the trainers after 50 operations, thus the learning curve for skill acquisition was significantly shorter [21]. Moreover, the addition of USCOM also significantly resulted in treatment cost savings and a reduced hospitalization stay length, which confirmed the cost-effectiveness of USCOM as previously reported [16]. Notably, USCOM was also susceptible to operational influences. Consequently, all patients in the UU group in the present trial were monitored by the same skilled operator and three consecutive measurements were made with a deviation of no more than 10% each time, in order to ensure the consistency and reliability of the data.
In the present trial, there were clear differences in the changes of hemodynamic
parameters during UF, which reached a steady-state level after 4 days. Since BNP
was the standard biomarker, variations of BNP concentrations were associated with
the re-hospitalization and mortality rates [26, 28]. Thus, a decrease in the BNP
concentration on Day 4 relative to baseline was set as the UF-endpoint to
determine its correlation with USCOM parameters. On Day 4, INO and SVRI on USCOM
were found to be significantly correlated to a 30% reduction in BNP relative to
baseline, and the predictive formula for the UF endpoint of a 30% reduction in
BNP was: –2.462 + 0.028
However, the kinetics of BNP release vary between individuals and are influenced by factors such as renal function, medication use and comorbidities [45]. In some cases, despite improvements in hemodynamics, there may be a delayed reduction in BNP concentrations. This delay can be attributed to the time needed for the heart to adjust preload and afterload, as well as the clearance rate of BNP from the circulation [46]. In addition, it has also been reported that BNP cannot be used in isolation to measure congestion; rather, the concentration must be assessed in a proper clinical setting, like most other tests, and a precise cut-off point is not suitable. However, as noted by Mueller et al. [47], adjusting UF rates to patients’ vital signs and renal function has been linked to more effective decongestion and fewer heart failure events. It is well known that fluid overload is the main cause of hospitalization for patients with AHF, and changes in urine output may be explored as a predictor of fluid balance [48]. The present trial findings also indicated that urine output was positively correlated with the change rate of FTc (r = 0.255, p = 0.022) and negatively correlated with the VTI change rate (r = –0.27, p = 0.016). Thus, although in this trial, the rate of BNP reduction was used as a criterion for terminating UF, we need to consider other clinical features and the hemodynamic status of patients when considering BNP concentrations, including changes in fluid balance and signs of congestion, to make wise decisions regarding the termination of UF in clinical practice.
Another concern was the influence of comorbidities to hemodynamic changes during UF [49], since diabetes [50], hypertension [51], chronic kidney disease [52, 53] and cardiovascular diseases [54], both demonstrated to have an impact on fluid balance and vascular tone, are crucial factors in hemodynamics [55]. Patients with pre-existing cardiac conditions may be more susceptible to hemodynamic fluctuations during UF [56], and require careful monitoring and management. In contrast, another study demonstrated that the diverse physical conditions of critically ill patients might exert a rather limited influence on the graphic quality of USCOM [57]. In the present trial, the distribution was balanced between the UU group and the U group of patients with ADHF, so that it could be assumed that the hemodynamic impact was the same for both groups during their respective UF sessions.
This trial had several limitations. The selected ADHF patients were from a single center and were not stratified randomly, which might have led to a potential for bias. Besides the relative low number of samples, the frequent comorbidities might have had some influence on the hemodynamic changes in the graphic quality of USCOM and should be validated in a further large cohort trial. Since the kinetics of BNP release vary between individuals and are influenced by various factors, the usefulness of measurements of BNP concentrations may be limited by the possibility that their production and release may lag behind acute changes in hemodynamic measurements, thus additional potential endpoint criteria (e.g., urine output changes) should be explored in the near future. Further research is needed on the applicability of USCOM for different types of AHF patients (e.g., those with chronic kidney disease) and to validate its economic and clinical value after long-term follow-up data have been analyzed.
USCOM data were correlated significantly with UF outcomes and might serve as measures to determine endpoints for congestion therapy with UF in patients with ADHF. UF combined with USCOM also reduced the financial burdens of treatment and hospitalization for patients. No adverse events were reported due to USCOM within 24 h use, indicating that USCOM was a safe and non-invasive monitoring device.
ADHF, acute decompensated heart failure; AHF, acute heart failure; AUC, area under curve; BNP, B-type natriuretic peptide; CI, confidence interval; CO, cardiac output; FTc, corrected flow time; HCT, hematocrit; HR, heart rate; INO, inotropy; IWRS, interactive web response system; MAP, mean arterial pressure; NT-proBNP, N-terminal pro-B-type natriuretic peptide; OR, odds ratio; ROC, receiver operating characteristic; SpO2, oxygen saturation; SV, stroke volume; SVI, stroke volume index; SVR, systemic vascular resistance; SVRI, systemic vascular resistance index; SVV, stroke volume variation; U, ultrafiltration alone; UF, ultrafiltration; USCOM, ultrasonic cardiac output monitor; UU, ultrafiltration + ultrasonic cardiac output monitor; VTI, velocity time integral.
The datasets used and/or analyzed during the current study are available from the corresponding authors on reasonable request.
YL: Conceptualization, Investigation, Visualization, Writing – original draft. JC: Conceptualization, Formal analysis, Investigation, Visualization, Writing – original draft. JB: Investigation, Visualization, Writing – review and editing. FC: Investigation, Visualization, Writing – review and editing. QW: Conceptualization, Formal analysis, Project administration, Supervision, Visualization, Writing – original draft, Writing – review and editing. FY: Conceptualization, Formal analysis, Project administration, Supervision, Visualization, Writing – original draft, Writing – review and editing. All authors read and approved the final manuscript. All authors have participated sufficiently in the work and agreed to be accountable for all aspects of the work.
The study adhered to the principles of the Declaration of Helsinki and the protocols were approved by the Institutional Review Board of Tongren Hospital Shanghai Jiao Tong University School of Medicine (approval number: 2021-072-01). Written informed consent was obtained from all enrolled patients.
Not applicable.
This research received no external funding.
The authors declare no conflict of interest.
Supplementary material associated with this article can be found, in the online version, at https://doi.org/10.31083/RCM27100.
References
Publisher’s Note: IMR Press stays neutral with regard to jurisdictional claims in published maps and institutional affiliations.