

 , Ziyuan Li 1,†, Jing Gan 3,†, Feng Wei 1, Ping Wu 4, Sheng Liang 1, Yufei Ma 1, Lin Ding 1, Chuantao Zuo 4, Zhenguo Liu 3,*
 , Hui Wang 1,*, Yafu Yin 1,*
1 Department of Nuclear Medicine, Xinhua Hospital, Shanghai Jiao Tong University School of Medicine, 200092 Shanghai, China
2 Department of Radiology, Shandong Cancer Hospital and Institute, Shandong First Medical University and Shandong Academy of Medical Sciences, 250000 Jinan, Shandong, China
3 Department of Neurology, Xinhua Hospital, Shanghai Jiao Tong University School of Medicine, 200092 Shanghai, China
4 PET Center, Hua Shan Hospital, Fudan University, 200040 Shanghai, China
†These authors contributed equally.
Abstract
The aim of this study was to investigate the correlation between dopamine transporter (DAT) positron emission tomography (PET)/computed tomography (CT) and the clinical characteristics and rating scales of Parkinson’s disease (PD) patients. Additionally, we sought to assess the scientific validity and feasibility of integrating 3D-dopaminergic binding parameters into the clinical scoring system for PD.
A total of 75 patients with PD who underwent 11C-methyl-N-2β-methyl ester-3β-(4-fluorophenyl) tropane (11C-CFT) PET/CT from April, 2019 to June, 2021 were retrospectively analyzed. Clinical characteristics, including age, sex, and disease duration, as well as the modified Hoehn-Yahr (H-Y) scale, Unified Parkinson’s Disease Rating Scale (UPDRS) parts II and III (II-III), and Mini-Mental State Examination (MMSE) scores of PD patients during the corresponding time periods were collected. DAT binding parameters and their derived parameters based on plane and 3D images in the neostriatum were analyzed for consistency with plane and 3D parameters, and the correlation between DAT parameters and the clinical features of patients were assessed using SPSS software.
The DAT binding parameters derived from 3D images demonstrated good consistency with the plane parameters (p < 0.05). The asymmetry index (ai) of DAT binding parameters based on 3D and plane images showed good consistency in the anterior putamen (p < 0.05). The plane parameters of the anterior and posterior putamen were statistically correlated with the UPDRS II-III score and H-Y score of PD patients (p < 0.05), whereas those of the caudate nucleus were correlated with UPDRS II and MMSE scores. The 3D parameters in the neostriatum showed good statistical correlation with disease duration, UPDRS II-III score, H-Y score, and H-Y stage of PD patients (p < 0.05), and the ai was significantly correlated with MMSE score (p < 0.05). The 3D parameters in the putamen and posterior putamen exhibited significant statistical correlation with the UPDRS II-III score, H-Y score, and H-Y stage in PD patients (p < 0.05). The ai in the putamen showed statistical correlation with UPDRS III and MMSE scores, and the ai in the posterior putamen showed statistical correlation with UPDRS II score (p < 0.05).
Quantitative parameters based on plane and 3D images of 11C-CFT PET/CT showed good consistency. Moreover, 3D parameters in the neostriatum had a stronger correlation with activities of daily living, UPDRS motor scores, disease severity and duration, and cognition compared with plane parameters in PD patients.
Keywords
- Parkinson’s disease
- 11C-CFT
- PET/CT
- plane parameter
- 3D parameter
Parkinson’s disease (PD) is a degenerative disorder of the central nervous system due to the degeneration of dopaminergic neurons in the substantia nigra and the subsequent dopamine deficiency in the striatum [1]. The prevalence among the elderly is as high as 3.3%. PD is characterized by high prevalence, high disability, progressive aggravation, insidious onset, and poor prognosis. The patients’ survival period is significantly shortened, and they often succumb to various complications such as pneumonia and urinary tract infection [2, 3, 4]. Therefore, timely and accurate diagnosis of PD, along with effective symptomatic treatment, is crucial for improving patients’ quality of life, reducing the occurrence of complications, and effectively prolonging survival. There is no specific diagnostic method for PD. The clinical diagnosis of PD mainly relies on medical history, clinical manifestations and physician expertise. The golden standard for diagnosis is the identification of PD-specific pathological changes (Lewy bodies) in brain tissue sections obtained through pathological biopsy. As known, pathological biopsy is an invasive examination that is challenging due to difficulties in obtaining tissue samples, affected by the location and quantity of the materials, and is often not well tolerated by patients [5, 6]. Thus, there is a critical need for a non-invasive, easy-to-use, objective, sensitive, and specific diagnostic method for PD.
As a molecular probe of positron emission tomography (PET),
11C-methyl-N-2
In this study, we measured and analyzed the 3D parameter, specifically the volume and total binding amount of DAT in the caudate and putamen. We also examined the consistency between 3D and plane parameters and their correlation with disease duration, modified Hoehn and Yahr (H-Y) scale, the unified Parkinson’s disease rating scale (UPDRS) II and III scores, and Mini-Mental State Examination (MMSE) in PD patients.
According to the following inclusion and exclusion criteria, from April 2019 to June 2021, 75 PD patients were retrospectively included in this study, who underwent 11C-CFT PET/CT at the Department of Nuclear Medicine, Xinhua Hospital Affiliated to Shanghai Jiao Tong University School of Medicine. Inclusion criteria: (1) The patients were diagnosed with PD by 2 neurologists according to the “Diagnostic Criteria for Brain Bank of the Parkinson’s Society of London, UK” [15]; (2) The patients’ clinical data and scales were complete, reliable and clear. Exclusion criteria: (1) Non-primary PD; (2) Presence of other brain diseases, such as stroke in the neostriatum, which might affect the uptake of 11C-CFT.
Anti-parkinsonian medications were withdrawn for more than 12 hours before clinical evaluation and imaging acquisition. The clinical assessment for individual patient was conducted using the UPDRS II-III [16], modified H-Y scale and MMSE. All patients were classified into different stages according to the H-Y scale. The study was approved by the Ethics Committee of Xinhua Hospital Affiliated to Shanghai Jiao Tong University School of Medicine. All research was performed in accordance with relevant guidelines/regulations. The study was carried out in accordance with the guidelines of the Declaration of Helsinki. All patients gave written informed consent before 11C-CFT PET/CT scanning.
PET/CT examinations were performed on a Biograph 64 system (Siemens
Healthineers, BIOGRAPHM CT/S, Erlangen, Germany) with a 21.6 cm axial field of view. 11C-CFT
was injected intravenously with a dose of 8–15 mCi, which was produced by chemists from the Nuclear Medicine Department of Shanghai Jiao Tong University School of Medicine using the Sumitomo HM-10 cyclotron and Sumitomo Carbon-11 multifunctional synthesis module (radiochemical purity
All images were analyzed by two experienced nuclear medicine physicians who were blinded to the clinical diagnosis. Plane image-based DAT parameters were obtained through semi-automatic software processing as described previously [17]. In brief, SPM software (version 5, Statistical Parametric Mapping; Wellcome Department of Imaging Neuroscience, Institute of Neurology, London, UK) implemented in Matlab7.4 (Mathworks Inc., Sherborn, MA, USA) and ScanVP software Version 5.9.1 (Centre for Neuroscience, the Feinstein Institute for Medical Research, Manhasset, NY, USA) were used for data processing [18, 19]. All images were spatially normalized into Montreal Neurological Institute (MNI) brain space with 3D transformations. A Gaussian filter of 10 mm full width at half maximum was adopted for smoothing the normalized PET images.
Then, on the mean image summed over central slices [20], the standard ROIs were drawn in the caudate nucleus, anterior and posterior putamen, and occipital cortex (as reference) to calculate the regional DAT bindings, plane parameter, which was named as DAT binding of caudate nucleus (DBC), DAT binding of anterior putamen (DBAP) and DAT binding of posterior putamen (DBPP), respectively. 11C-CFT PET is a crucial tool for DAT imaging, as it specifically binds to the striatum, while the occipital lobe exhibits hardly uptake of this specific imaging agent. Consequently, we used the occipital lobe as the reference region [21]. The following formula was used: (SUVavg of ROI- SUVavg of occipital lobe)/SUVavg of occipital lobe. Furthermore, the DAT binding asymmetry index of the caudate, anterior and posterior putamen (Cai, APai and PPai) were calculated: the difference between the left and right parameters divided by the average of the left and right parameters.
The 3D parameters were directly obtained using TrueD software (VE 13A, Siemens, Erlangen, Germany), without the need for further imaging processing and were easy to execute. In fact, our image sketching process adopted a semi-automated approach. Firstly, manually draw a circular 3D ROI with an appropriate diameter in the corresponding area of the cross-sectional slice of the PET image. The software would provide various semi quantitative indicator values for this area, such as maximum standardized uptake value (SUVmax). Before conducting this study, we performed extensive testing and comparisons on numerous images and determined that when the threshold was set at 40% of SUVmax, the software could automatically and accurately delineate areas with 11C-CFT functionality within the manually defined 3D ROI. We used this threshold to manually delineate the left and right neostriatum (the whole caudate nucleus and putamen), putamen and posterior putamen, respectively. After that, the software would automatically give the volume of DAT in the corresponding region that effectively binded 11C-CFT. These indicators reflected the functional volume of the neostriatum. At the same time, the software would automatically calculate the total binding amount of DAT to 11C-CFT (Total binding amount of DAT in neostriatum (TNDB), Total binding amount of DAT in putamen (TPDB) and Total binding amount of DAT in posterior putamen (TPPDB)) in the above regions. These indicators could better reflect the residual function of the neostriatum, and also relatively balanced the anatomical volume difference of the human brain (Fig. 1). Finally, the asymmetry index (ai) of the regions were calculated according to the formula as mentioned above for plane parameters. For each 3D parameter, the mean value and the lower value of the left and right regions were selected for analysis, respectively, and any value was with statistical significance, the parameter would be considered to be statistically significant.
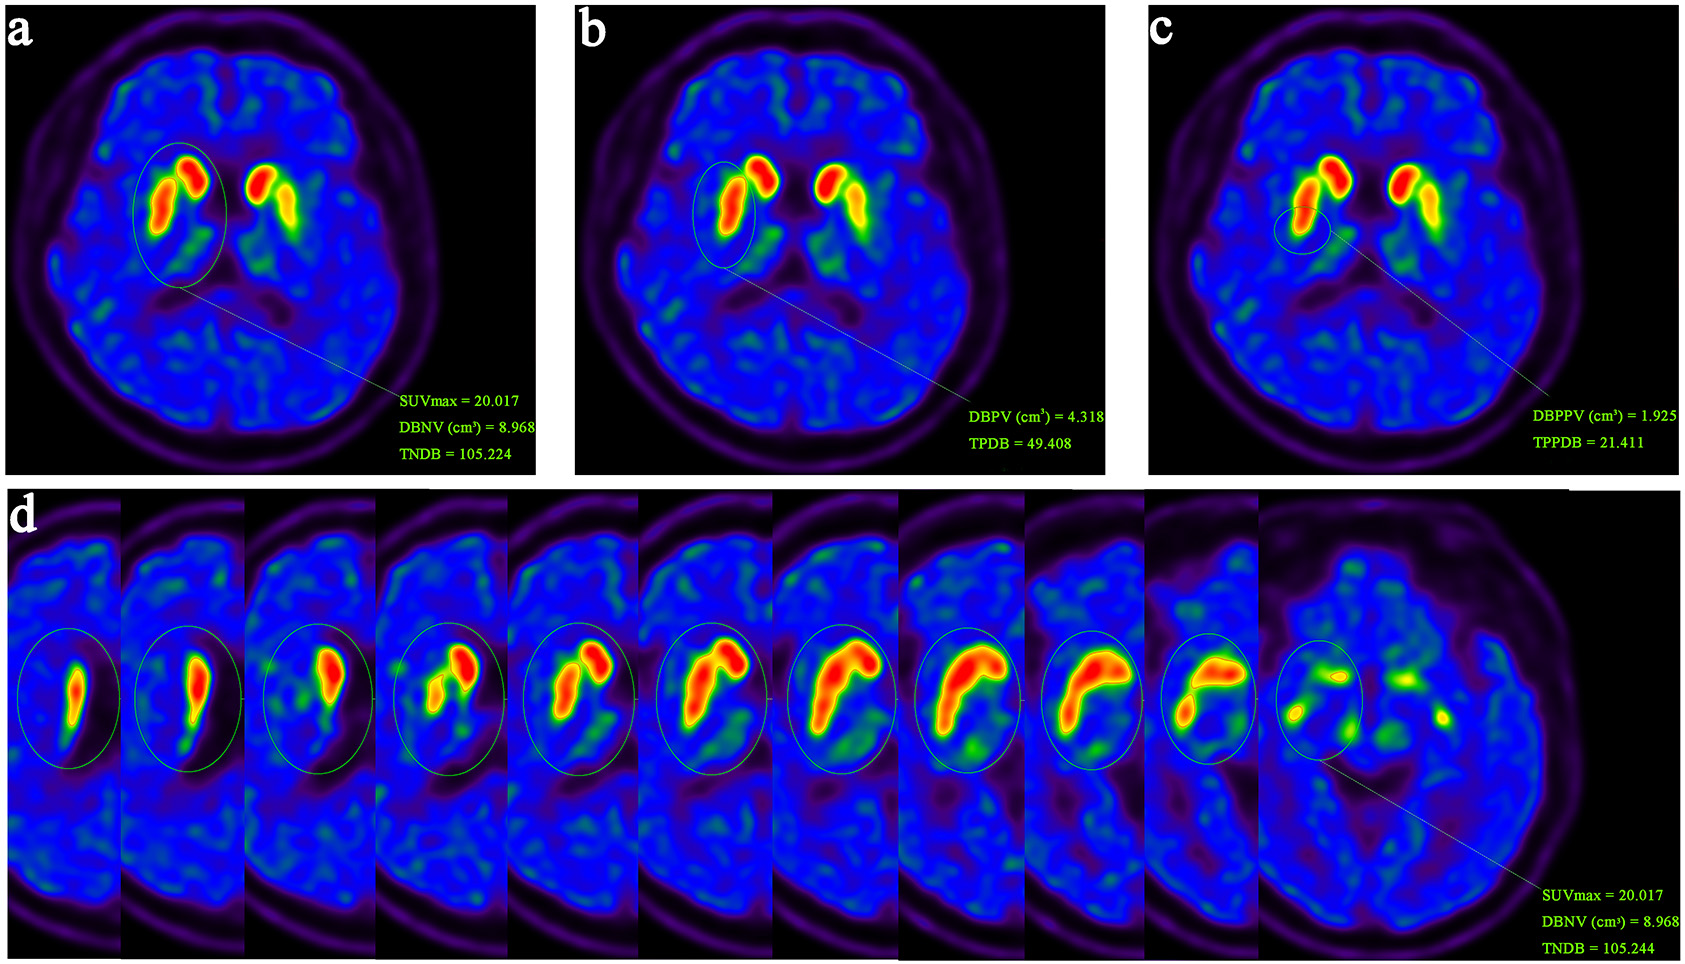 Fig. 1.
An illustration example of delineating 3D parameters. First, draw a 3D-ROI in the neostriatum. Taking 40% of SUVmax in the neostriatum region as the threshold, delineate the ROIs in the left and right neostriatum (a), putamen (b) and posterior putamen (c), respectively, and then the effective binding volume and total binding amount of DAT are obtained. (d) 3D-ROI in the neostriatum with each layer display. ROI, regions of interest; SUVmax, maximum standardized uptake value; DAT, dopamine transporter; DBNV, DAT binding volume of neostriatum; TNDB, Total binding amount of DAT in neostriatum; DBPV, DAT binding volume of putamen; TPDB, Total binding amount of DAT in putamen; DBPPV, DAT binding volume of posterior putamen; TPPDB, Total binding amount of DAT in posterior putamen.
Data were expressed as the mean
The clinical and demographic characteristics of all 75 (40 males, 35
females; 64
| Variable | Value (Mean | |
| Gender | ||
| Male | 40 | |
| Female | 35 | |
| Age (years) | 64 | |
| Course of disease (years) | 3.3 | |
| Modified Hoehn and Yahr score | 2 | |
| Modified H-Y grade | ||
| 1 | 27 | |
| 1.5 | 7 | |
| 2 | 27 | |
| Early course | 61 | |
| 3 | 12 | |
| 4 | 2 | |
| Late course | 14 | |
| UPDRS | ||
| II | 10 | |
| III | 19 | |
| MMSE | 27 | |
PD, Parkinson’s disease; H-Y, Hoehn and Yahr; UPDRS, The unified Parkinson’s disease rating scale; MMSE, Mini-Mental State Examination.
The 3D parameters of DAT PET/CT imaging were mostly consistent with the
plane parameters (Table 2). The binding volume and total binding amount of DAT in
neostriatum and putamen were statistically consistent with DBAP (Bonferroni
Corrected p
| Plane parameters | ||||||||||
| Variable | Value | DBAP | DBPP | APai | PPai | |||||
| p | r2 | p | r2 | p | r2 | p | r2 | |||
| 3D parameters | DBNVlower | 6.075 |
0.026* | 0.286 | 0.096 | 0.229 | – | – | – | – |
| DBNVmean | 6.661 |
0.030* | 0.251 | 0.074 | 0.207 | – | – | – | – | |
| DBNVai | 0.195 |
– | – | – | – | 0.028* | 0.254 | 0.530 | 0.074 | |
| TNDBlower | 45.297 |
0.001* | 0.363 | 0.053 | 0.224 | – | – | – | – | |
| TNDBmean | 49.180 |
0.001* | 0.362 | 0.058 | 0.220 | – | – | – | – | |
| TNDBai | 0.177 |
– | – | – | – | 0.000* | 0.464 | 0.054 | 0.255 | |
| DBPVlower | 0.350 |
0.022* | 0.292 | 0.008* | 0.328 | – | – | – | – | |
| DBPVmean | 2.842 |
0.044* | 0.265 | 0.012* | 0.315 | – | – | – | – | |
| DBPVai | 0.350 |
– | – | – | – | 0.010* | 0.321 | 0.082 | 0.236 | |
| TPDBlower | 16.148 |
0.000* | 0.446 | 0.000* | 0.421 | – | – | – | – | |
| TPDBmean | 19.230 |
0.000* | 0.454 | 0.000* | 0.421 | – | – | – | – | |
| TPDBai | 0.351 |
– | – | – | – | 0.000* | 0.439 | 0.002* | 0.369 | |
| DBPPVlower | 0.740 |
– | – | 0.001* | 0.374 | – | – | – | – | |
| DBPPVmean | 0.926 |
– | – | 0.003* | 0.342 | – | – | – | – | |
| DBPPVai | 0.466 |
– | – | – | – | – | – | 0.316 | 0.117 | |
| TPPDBlower | 4.569 |
– | – | 0.000* | 0.544 | – | – | – | – | |
| TPPDBmean | 5.712 |
– | – | 0.000* | 0.510 | – | – | – | – | |
| TPPDBai | 0.470 |
– | – | – | – | – | – | 0.061 | 0.217 | |
*: statistically significant. p-value corrected by Bonferroni
11C-CFT, 11C-methyl-N-2
DBC was negatively correlated with UPDRS II and positively correlated with MMSE
in statistics (Bonferroni Corrected p
| Variable | Value | Disease duration | UPDRS II | UPDRS III | Modified H-Y score | Modified H-Y course | MMSE | ||||||||
| p | r2 | p | r2 | p | r2 | p | r2 | Early course | Late course | p | p | r2 | |||
| 3D parameters | DBNVlower | 6.075 |
0.072 | 0.062 | 0.000* | 0.167 | 0.012* | 0.117 | 0.028* | 0.099 | 6.510 | 4.488 | 0.005* | 0.096 | 0.039 |
| DBNVmean | 6.661 |
0.024* | 0.098 | 0.004* | 0.160 | 0.016* | 0.109 | 0.016* | 0.111 | 7.102 | 5.070 | 0.005* | 0.266 | 0.017 | |
| DBNVai | 0.195 |
0.462 | 0.007 | 0.138 | 0.031 | 0.094 | 0.038 | 0.516 | 0.006 | 0.178 | 0.254 | 0.170 | 0.001* | 0.134 | |
| TNDBlower | 45.297 |
0.228 | 0.020 | 0.012* | 0.115 | 0.009* | 0.115 | 0.126 | 0.006 | 46.000 | 28.950 | 0.001* | 0.062 | 0.048 | |
| TNDBmean | 49.180 |
0.144 | 0.029 | 0.009* | 0.118 | 0.016* | 0.113 | 0.066 | 0.073 | 50.010 | 32.380 | 0.001* | 0.082 | 0.042 | |
| TNDBai | 0.177 |
0.201 | 0.022 | 0.247 | 0.019 | 0.057 | 0.049 | 0.988 | 0.000 | 0.167 | 0.229 | 0.208 | 0.005* | 0.105 | |
| DBPVlower | 0.350 |
0.062 | 0.047 | 0.006* | 0.131 | 0.012* | 0.111 | 0.024* | 0.096 | 2.638 | 1.501 | 0.007* | 0.228 | 0.020 | |
| DBPVmean | 2.842 |
0.088 | 0.070 | 0.012* | 0.112 | 0.032* | 0.093 | 0.016* | 0.112 | 3.084 | 1.958 | 0.011* | 0.518 | 0.006 | |
| DBPVai | 0.350 |
0.551 | 0.005 | 0.072 | 0.045 | 0.070 | 0.061 | 0.958 | 0.000 | 0.317 | 0.438 | 0.146 | 0.056 | 0.066 | |
| TPDBlower | 16.148 |
0.280 | 0.016 | 0.009* | 0.124 | 0.003* | 0.127 | 0.033* | 0.089 | 18.200 | 8.533 | 0.003* | 0.135 | 0.031 | |
| TPDBmean | 19.230 |
0.153 | 0.028 | 0.006* | 0.128 | 0.006* | 0.123 | 0.009* | 0.121 | 21.370 | 11.170 | 0.003* | 0.169 | 0.027 | |
| TPDBai | 0.351 |
0.397 | 0.010 | 0.138 | 0.031 | 0.042* | 0.056 | 0.576 | 0.004 | 0.324 | 0.429 | 0.196 | 0.099 | 0.038 | |
| DBPPVlower | 0.740 |
0.102 | 0.036 | 0.009* | 0.121 | 0.057 | 0.074 | 0.057 | 0.076 | 0.820 | 0.405 | 0.024* | 0.439 | 0.008 | |
| DBPPVmean | 0.926 |
0.053 | 0.051 | 0.033* | 0.088 | 0.063 | 0.072 | 0.072 | 0.070 | 1.010 | 0.594 | 0.040* | 0.805 | 0.001 | |
| DBPPVai | 0.466 |
0.788 | 0.001 | 0.029* | 0.066 | 0.281 | 0.016 | 0.443 | 0.008 | 0.431 | 0.629 | 0.092 | 0.166 | 0.027 | |
| TPPDBlower | 4.569 |
0.420 | 0.009 | 0.012* | 0.111 | 0.021* | 0.094 | 0.051 | 0.079 | 5.142 | 2.197 | 0.020* | 0.282 | 0.016 | |
| TPPDBmean | 5.712 |
0.265 | 0.017 | 0.033* | 0.008 | 0.021* | 0.097 | 0.042* | 0.083 | 6.344 | 3.188 | 0.024* | 0.417 | 0.009 | |
| TPPDBai | 0.470 |
0.661 | 0.003 | 0.027* | 0.068 | 0.288 | 0.016 | 0.586 | 0.004 | 0.432 | 0.629 | 0.102 | 0.136 | 0.031 | |
| Plane parameters | DBC | 0.995 |
0.662 | 0.003 | 0.018* | 0.095 | 0.087 | 0.040 | 0.201 | 0.023 | 0.999 | 0.850 | 0.236 | 0.014* | 0.099 |
| DBAP | 0.822 |
0.389 | 0.010 | 0.018* | 0.102 | 0.009* | 0.117 | 0.009* | 0.123 | 0.848 | 0.666 | 0.033* | 0.060 | 0.049 | |
| DBPP | 0.471 |
0.226 | 0.020 | 0.144 | 0.055 | 0.057 | 0.074 | 0.009* | 0.118 | 0.478 | 0.400 | 0.215 | 0.323 | 0.117 | |
| Cai | 0.214 |
0.529 | 0.005 | 0.088 | 0.041 | 0.570 | 0.005 | 0.650 | 0.003 | 0.205 | 0.286 | 0.290 | 0.962 | 0.000 | |
| APai | 0.230 |
0.371 | 0.011 | 0.441 | 0.008 | 0.343 | 0.013 | 0.863 | 0.000 | 0.227 | 0.274 | 0.419 | 0.403 | 0.010 | |
| PPai | 0.270 |
0.996 | 0.000 | 0.544 | 0.005 | 0.462 | 0.008 | 0.050 | 0.054 | 0.272 | 0.243 | 0.646 | 0.067 | 0.046 | |
*: statistically significant. p-value corrected by Bonferroni
DBNV, DAT binding volume of neostriatum; ai, asymmetry index; TNDB, Total binding amount of DAT in neostriatum; DBPV, DAT binding volume of putamen; TPDB, Total binding amount of DAT in putamen; DBPPV, DAT binding volume of posterior putamen; TPPDB, Total binding amount of DAT in posterior putamen; DBC, DAT binding of caudate nucleus; DBAP, DAT binding of anterior putamen; DBPP, DAT binding of posterior putamen; UPDRS, The unified Parkinson’s disease rating scale; H-Y, Hoehn and Yahr; MMSE, Mini-Mental State Examination; Cai, asymmetry index of caudate nucleus; r2, Pearson’s correlation coefficient.
The binding volume and total binding amount of DAT in all regions were
negatively correlated with UPDRS II in statistics (Bonferroni
Corrected p
Among various asymmetry indexes, DAT binding volume of posterior
putamen asymmetry index (DBPPVai) and TPPDBai were positively correlated
with UPDRS II (r2DBPPVai = 0.066, r2TPPDBai = 0.068, Table 3), TPDBai was positively correlated with UPDRS III in statistics (r2 =
0.237) (Bonferroni Corrected p
As PD is a degenerative disease due to degeneration of dopaminergic neurons and dopamine deficiency in the striatum [22], DAT imaging is widely used in the diagnosis of PD because it can assess the functional state of dopamine neurons in substantia nigra and striatum [23, 24]. Previous studies have indicated that DAT intake in PD patients gradually declines with the progress of the disease and the severity of clinical symptoms [24, 25, 26]. Using DAT imaging to measure the binding index is a feasible approach to reflect the quantity and distribution of DAT in the striatum.
Although previous studies have given inconsistent results [27, 28, 29, 30], some have shown a correlation between UPDRS motor score and the mean uptake in the neostriatum and putamen, there was no significant difference was observed when compared with caudate uptake alone. Others demonstrated a correlation between both the stage and severity of PD and the caudate-to-putamen ratios. Overall, studies have shown that DAT binding imaging is associated with UPDRS motor score, disease severity [17] and duration [30] in PD patients. These findings imply that DAT imaging with quantitative parameter has a good capacity in monitoring severity and progression of PD.
In this 11C-CFT PET/CT study involving 75 PD patients, we analyzed the correlation between the quantitative parameters of DAT binding and patients’ clinical characteristics, and evaluated the ability of DAT imaging in reflecting the severity and duration of disease, as well as activities of daily living, motor symptoms and cognition. Volume-based 3D PET/CT parameters have been widely used in the diagnosis and prognostic evaluation of tumor lesions, such as the tumor metabolic volume (MTV) and the total amount of glycolysis in the lesion (TLG) in 2′-deoxy-2′-[18F] fluoro-D-glucose ([18F] FDG) PET/CT [12, 13, 14, 31, 32]. Numerous clinical studies have demonstrated that 3D quantitative parameter in PET/CT imaging offer more precise diagnostic efficacy and prognostic evaluation compared to plane parameter like SUV [13, 14]. Therefore, in terms of imaging parameters, we used plane parameters and 3D parameters to explore their correlation with the clinical characteristics of PD, which has been rarely addressed in the previous nervous system imaging research. The results revealed that 3D parameters exhibited good consistency with the plane parameters, and demonstrated a more robust correlation with the clinical characteristics compared to the plane parameters.
There was a significant correlation between 3D parameters in the neostriatum and the duration and severity of disease, activities of daily living, motor symptoms and cognition. Notably, the DAT binding volume of the neostriatum was significantly correlated with the activities of daily living, UPDRS motor score, the severity and duration of disease in PD patients. For example, the longer a patient suffered from PD, the smaller the volume of the neostriatum in his/her brain that could bind with 11C-CFT [33, 34, 35]. And the smaller the volume of the neostriatum that could bind with 11C-CFT, the less uptake of 11C-CFT, indicating poorer motor and cognitive function in the patient [35]. Interestingly, the asymmetry of degeneration in the bilateral striatum of patients also impacts their cognitive function.
All studies about DAT imaging with quantitative analysis (plane parameter) were performed based on some specific software tools, statistical parametric mapping (SPM) combined with ScanVP software [4], Neurostat [24], and so on, since ROI delineated manually was variable and with poor repeatability. Not to mention that not all hospitals have these specific software tools, the use of these software is time-consuming and laborious, making widespread clinical application challenging. In contrast, 3D parameters of PET/CT imaging can be easily conducted without the need of imaging processing and the software is simple and could be obtained easily if a PET/CT system is available in the hospital. In addition, the delineation of 3D parameters has good objectivity and repeatability.
This study also has several limitations. Firstly, we did not include normal controls in the study. Secondly, the age group of patients we included was between 65–83 years old. Physiological aging can also cause the differences in the binding of 11C-CFT in elderly patients, but due to sample size limitations, we did not further stratify patients based on physiological age. Regarding cognition, only MMSE was adopted for the correlation analysis with quantitative parameters of DAT PET/CT in this study, and a more detailed assessment of cognitive function is needed to draw more accurate conclusions. Additionally, more data, especially from multiple centers, are required to validate the results. We hope to address these limitations in future research.
We investigated the correlation between plane and 3D parameters of DAT binding in PET/CT using 11C-CFT, and the relationship between these quantitative parameters of DAT binding and the clinical features of PD. Our findings indicate that 3D parameters in the neostriatum demonstrate a stronger correlation with the activities of daily living, UPDRS motor score, the severity and duration of disease and cognition compared to plane parameters in PD patients. Additionally, 3D parameters of DAT imaging have the characteristics of easy operation and high objectivity. Therefore, we recommend using the DAT binding volume in the neostriatum for routine DAT quantitative analysis in clinical practice.
DAT, Dopamine transporter; PD, Parkinson’s disease; H-Y, Hoehn-Yahr; UPDRS, The unified Parkinson’s disease rating scale; MMSE, Mini-Mental State Examination; ai, Asymmetry index; PET, Positron emission computed tomography; 11C-CFT, 11C-methyl-N-2
The datasets generated during and/or analyzed during the current study are available from the corresponding author on reasonable request.
Concept and design: YY, HW, ZgL. Acquisition, analysis, or interpretation of data: XW, FW, JG, ZyL. Clinical data providing: JG and ZgL; Analyze the plane parameter data in this study: PW and CZ; Produced CFT and provided a description of the radiopharmaceutical in the article: SL, YM and LD. Drafting of the manuscript: XW and YY. Critical revision of the manuscript for important intellectual content: YY, HW. Statistical analysis: XW and FW. All authors contributed to editorial changes in the manuscript. All authors read and approved the final manuscript. All authors have participated sufficiently in the work and agreed to be accountable for all aspects of the work.
The study was approved by the Ethics Committee of Xinhua Hospital Affiliated to Shanghai Jiao Tong University School of Medicine. The ethical approval number is XHEC-C-2015-022-2. The study was performed in accordance with the ethical standards as laid down in the 1964 Declaration of Helsinki and its later amendments or comparable ethical standards. Our study obtained written informed consent from all participants.
We thank all the participants and their families.
This work was supported by the National Nature Science Foundation of China (No. 81974270. No. 82472014) and Shanghai Science and Technology Commission (22Y11904100).
The authors declare no conflict of interest.
References
Publisher’s Note: IMR Press stays neutral with regard to jurisdictional claims in published maps and institutional affiliations.