
- Academic Editor
†These authors contributed equally.
This is an open access article under the CC BY 4.0 license.
Serum chloride levels and the advanced lung cancer inflammation index (ALI) score are independent prognostic factors in patients with heart failure (HF). Nevertheless, the interactive relationship between serum chloride levels and the ALI score in predicting all-cause mortality among individuals with acute decompensated heart failure (ADHF) remains undefined.
The study recruited 1221 patients with ADHF who were hospitalized at the University Affiliated Hospital in China between January 2017 and October 2021. The ALI score was calculated as body mass index × serum albumin level/neutrophil–lymphocyte ratio (NLR), which was used to assess inflammation and nutritional status in ADHF patients.
Following adjustment for confounders including age, sex, New York Heart Association (NYHA) functional classification, left ventricular ejection fraction (LVEF), log-transformed brain natriuretic peptide (lgBNP), and C-reactive protein (CRP) levels, the independent association of ALI score (hazard ratio (HR): 0.984, 95% confidence interval (CI): 0.977–0.990; p < 0.0001) and serum chloride (HR: 0.915, 95% CI: 0.897–0.933; p < 0.0001) with all-cause mortality persisted. Stratified analysis by ALI score and serum chloride subgroups revealed significant differences in cumulative survival, where lower ALI scores and serum chloride concentrations were associated with a higher risk of all-cause mortality (p < 0.0001).
Combining the ALI score with serial serum chloride monitoring adds significant value in predicting all-cause mortality in ADHF patients who may benefit from aggressive chloride correction and anti-inflammatory therapies, potentially modifying the disease trajectory.
Heart failure (HF) is defined as a clinical syndrome with symptoms and/or signs
caused by a structural and/or functional cardiac abnormality that is confirmed by
elevated natriuretic peptide levels and/or objective evidence of pulmonary or
systemic congestion [1]. It is estimated that 64.3 million people worldwide
suffered from HF in 2017 [2]. A survey based on medical insurance data from 0.5
billion Chinese urban workers found that the nationally standardized prevalence
of HF among people aged 25 years and older in China was 1.1%, with an incidence
rate of 275/100,000 person-years. Moreover, the survey estimated that there were
12.05 million existing HF patients and 2.97 million new cases of HF each year. In
China, HF patients face alarmingly high rates of mortality and hospital
readmission, creating a substantial public health burden that strains healthcare
resources and impacts both the quality of life of patients and the national
healthcare system. The growing prevalence of HF, particularly among the aging
population, has made this condition a critical challenge for healthcare
policymakers in China, requiring urgent interventions to improve disease
management, optimize treatment protocols, and enhance post-discharge care
coordination to reduce the socioeconomic impact on families and the healthcare
system [3]. The European Society of Cardiology (ESC) classifies HF into three
distinct subtypes according to left ventricular ejection fraction (LVEF), namely,
HF with reduced ejection fraction (HFrEF, LVEF
Electrolyte derangements are frequently present in patients with HF. Meanwhile, serum chloride has been recognized as a critical anion with significant implications for understanding the pathophysiological mechanisms of HF. Research indicates that serum chloride plays a pivotal role in maintaining the acid–base balance, modulating neurohormonal activation, and influencing diuretic resistance [4, 5, 6, 7]. Notably, studies have demonstrated that low serum chloride levels are independently associated with adverse clinical outcomes, including increased mortality and hospitalization rates, in HF patients. These findings underscore the potential of serum chloride as both a prognostic biomarker and a therapeutic target in HF management. Although chlorine as a therapeutic target seems reasonable in terms of mechanism, key knowledge gaps remain, and further research is needed to elucidate potential mechanisms and explore chlorine-guided treatment strategies [8, 9, 10, 11, 12, 13, 14].
Malnutrition refers to insufficiencies, surpluses, or imbalances in the intake
of energy or nutrients by an individual [15]. Malnutrition is frequently observed
in HF patients due to multiple contributing factors, including anorexia, impaired
intestinal absorption from gut mucosal edema, systemic inflammation, and the
catabolic state induced by HF. These pathological processes collectively drive a
progressive nutritional deficit that further exacerbates disease progression and
worsens clinical outcomes. This underscores the critical need for comprehensive
dietary assessment and targeted interventions in HF management protocols [16].
Serum albumin concentration and body mass index (BMI) values are
well-established, clinically accessible markers of nutritional status that have
demonstrated strong prognostic value in HF populations. These biomarkers may
reflect nutritional depletion and potential disease severity in patients with HF.
Meanwhile, these findings emphasize the importance of incorporating routine
nutritional assessments into a comprehensive HF risk stratification program
[17, 18, 19, 20]. The advanced lung cancer inflammation index (ALI), calculated as BMI
Both serum chloride levels and the ALI score have been established as independent prognostic factors in HF patients; however, their potential interaction and combined predictive value for all-cause mortality risk remain poorly understood. Thus, further investigations are needed to determine whether these markers have additive or synergistic effects in risk stratification, which could enhance prognostic accuracy and guide personalized therapeutic strategies for HF management. Further, this study hypothesized a risk interaction between serum chloride levels and the ALI score, proposing that patients with concurrently lower ALI scores and reduced serum chloride levels would exhibit poorer outcomes. Therefore, this study aimed to investigate the predictive value of combining the ALI score and serum chloride levels for all-cause mortality in HF patients.
This study retrospectively included 1221 acute decompensated heart failure
(ADHF) patients admitted to a university-affiliated hospital in China from
January 2017 to October 2021. All patients met the following criteria: (1)
diagnosed with New York Heart Association (NYHA) classes III–IV for severe HF;
(2) brain natriuretic peptide (BNP) levels
 Fig. 1.
Study flowchart. ADHF, acute decompensated heart failure; NYHA, New York Heart Association; BNP, brain natriuretic peptide.
The characteristic data for the patients included demographic data, clinical
information, medications, and complications at the time of admission. On
admission, blood samples were collected to determine BNP, myoglobin, creatine
kinase-MB (CK-MB), troponin I, and D-dimer levels before any therapeutic measures
were recorded. Following a standardized 10–12-hour fasting period, additional
blood specimens were collected in strict adherence to institutional protocols and
promptly transported to the central laboratory of the University Affiliated
Hospital for analysis using validated methodologies. Laboratory assessments
included a complete blood count (white blood cell count, lymphocyte count, red
blood cell count, hemoglobin), serum electrolytes (chloride, sodium), albumin,
creatinine, uric acid, C-reactive protein (CRP), and lipid profile (total
cholesterol (TC), triglycerides (TGs)). The estimated glomerular filtration rate
(eGFR) was calculated using the modified Modification of Diet in Renal Disease
(MDRD) equation, as follows: eGFR (mL/min/1.73 m2) = 194
NLR was quantified as the quotient of peripheral blood neutrophil counts
(
Normally distributed variables are presented as the mean
The mean age of the study sample was 66.43
The cohort was divided into three groups using the ALI tertile cutoffs: a low
ALI group (Q1,
| ALI (n = 975) | ALI subgroups | p-value | ||||
| Group 1 (n = 325) | Group 2 (n = 325) | Group 3 (n = 325) | ||||
| ALI score | 30.13 |
12.69 |
27.45 |
50.23 |
||
| Clinical demographics | ||||||
| Gender (years) | 66.43 |
70.38 |
65.93 |
62.96 |
||
| Male, n (%) | 593 (60.8) | 210 (64.6) | 194 (59.7) | 189 (58.2) | 0.211 | |
| BMI (kg/m2) | 23.02 |
22.17 |
22.92 |
23.98 |
||
| SBP (mmHg) | 122.20 |
119.61 |
123.73 |
123.26 |
0.042 | |
| DBP (mmHg) | 76.38 |
73.87 |
76.67 |
78.61 |
||
| NYHA class IV, n (%) | 351 (36.0) | 143 (44.0) | 115 (35.4) | 93 (28.6) | ||
| Medical history | ||||||
| Smoking status, n (%) | 322 (33.0) | 103 (31.7) | 100 (30.8) | 119 (36.6) | 0.234 | |
| Drinking status, n (%) | 160 (16.4) | 46 (14.2) | 52 (16.0) | 62 (19.1) | 0.231 | |
| DM, n (%) | 261 (26.8) | 95 (29.2) | 81 (24.9) | 85 (26.2) | 0.442 | |
| Hypertension, n (%) | 531 (54.5) | 179 (55.1) | 178 (54.8) | 174 (53.5) | 0.917 | |
| CHD, n (%) | 478 (49.0) | 188 (57.8) | 147 (45.2) | 143 (44.0) | ||
| AF, n (%) | 332 (34.1) | 114 (35.1) | 104 (32.0) | 114 (35.1) | 0.633 | |
| Grouped according to LVEF | 0.385 | |||||
| HFrEF, n (%) | 439 (45.0) | 132 (40.6) | 155 (47.7) | 152 (46.8) | ||
| HFmrEF, n (%) | 171 (17.5) | 59 (18.2) | 55 (16.9) | 57 (17.5) | ||
| HFpEF, n (%) | 365 (37.4) | 134 (41.2) | 115 (35.4) | 116 (35.7) | ||
| Laboratory data | ||||||
| WBC (109/L) | 6.69 (5.42, 8.52) | 8.14 (6.37, 10.95) | 6.40 (5.33, 7.71) | 6.11 (5.18, 7.38) | ||
| Neutrophils (109/L) | 5.15 |
7.23 |
4.51 |
3.71 |
||
| Lymphocytes (109/L) | 1.51 |
1.06 |
1.47 |
1.99 |
||
| RBCs (1012/L) | 4.56 (4.10, 5.04) | 4.41 (3.95, 4.88) | 4.61 (4.14, 5.06) | 4.69 (4.29, 5.16) | ||
| HB (g/L) | 140 (125, 154) | 137 (120, 151) | 141 (127, 154) | 144 (130, 156) | ||
| PLTs (109/L) | 200.14 |
200.61 |
202.86 |
196.96 |
0.632 | |
| Albumin (g/dL) | 3.67 (3.42, 3.99) | 3.53 (3.25, 3.80) | 3.68 (3.43, 3.96) | 3.84 (3.55, 4.16) | ||
| CRP (mg/L) | 7.20 (3.00, 20.50) | 14.70 (5.37, 33.61) | 6.75 (2.81, 17.57) | 4.50 (2.20, 12.25) | ||
| Fib (g/L) | 3.51 |
3.81 |
3.50 |
3.21 |
||
| lgBNP | 3.17 |
3.22 |
3.16 |
3.12 |
||
| Potassium (mmol/L) | 3.93 |
3.94 |
3.91 |
3.92 |
||
| Sodium (mmol/L) | 141.01 |
139.79 |
141.26 |
141.96 |
||
| Chlorine (mmol/L) | 102.97 |
101.50 |
103.44 |
103.96 |
||
| ALT (IU/L) | 24.90 (16.50, 41.60) | 24.60 (16.20, 42.15) | 22.90 (15.45, 40.10) | 25.40 (17.90, 43.05) | 0.223 | |
| AST (IU/L) | 28.20 (20.00, 42.20) | 30.20 (20.95, 52.70) | 27.00 (20.00, 40.10) | 27.60 (20.25, 39.30) | 0.019 | |
| Cre, (µmol/L) | 102.50 (83.00, 132.00) | 109.20 (85.80, 152.50) | 104.60 (83.05, 129.85) | 94.60 (79.70, 117.40) | ||
| SUA (µmol/L) | 481.00 (380.20, 594.65) | 480.85 (380.58, 602.48) | 497.90 (380.00, 596.60) | 475.70 (378.78, 586.20) | 0.963 | |
| GFR (mL/min) | 44.56 (32.73, 57.22) | 38.80 (27.11, 51.44) | 43.16 (34.15, 56.39) | 38.40 (51.41, 62.81) | ||
| FBG (mmol/L) | 5.96 |
6.23 |
5.95 |
5.69 |
0.092 | |
| TC (mmol/L) | 3.56 (2.94, 4.22) | 3.41 (2.80, 4.13) | 3.65 (3.02, 4.26) | 3.62 (3.08, 4.29) | 0.002 | |
| TG (mmol/L) | 1.10 (0.86, 1.52) | 1.06 (0.85, 1.40) | 1.07 (0.84, 1.45) | 1.20 (0.88, 1.62) | 0.004 | |
| HDL-C (mmol/L) | 0.96 (0.79, 1.17) | 0.94 (0.76, 1.15) | 0.96 (0.80, 1.15) | 0.99 (0.82, 1.19) | 0.064 | |
| LDL-C (mmol/L) | 2.18 (1.66, 2.79) | 2.13 (1.52, 2.79) | 2.22 (1.73, 2.83) | 2.21 (1.69, 2.76) | 0.131 | |
| Echocardiography | ||||||
| HR (beat/minute) | 84.56 |
86.53 |
81.66 |
85.48 |
0.007 | |
| LVEF (%) | 42 (32, 57) | 45 (33, 58) | 41 (31, 58) | 42 (32, 56) | 0.096 | |
| Treatment | ||||||
| CRT, n (%) | 101 (10.4) | 44 (13.5) | 27 (8.3) | 30 (9.2) | 0.065 | |
| Dapagliflozin, n (%) | 211 (21.6) | 66 (20.3) | 71 (21.8) | 74 (22.8) | 0.744 | |
| Beta blockers, n (%) | 644 (66.1) | 200 (61.5) | 216 (66.5) | 228 (70.2) | 0.067 | |
| ACEI/ARB/ARNI, n (%) | 530 (54.4) | 169 (52.0) | 184 (56.6) | 177 (54.5) | 0.497 | |
| Diuretics, n (%) | 850 (87.2) | 290 (89.2) | 273 (84.0) | 287 (88.3) | 0.104 | |
| Spironolactone, n (%) | 815 (83.6) | 278 (85.5) | 268 (82.5) | 269 (82.8) | 0.506 | |
Abbreviations: ALI, advanced lung cancer inflammation index; BMI, body mass index; SBP, systolic blood pressure; DBP, diastolic blood pressure; NYHA class, New York Heart Association cardiac function classification; CHD, coronary heart disease; AF, atrial fibrillation; CRT, cardiac resynchronization therapy; WBC, white blood cell; HB, hemoglobin; PLT, platelet; Cre, Creatinine; SUA, serum uric acid; GFR, glomerular filtration rate; FBG, fasting blood glucose; CRP, C reactive protein; lgBNP, log-transformed brain natriuretic peptide; LVEF, left ventricular ejection fraction; ACEI, angiotensin-converting enzyme inhibitor; ARB, angiotensin II receptor blocker; ARNI, angiotensin receptor neprilysin inhibitor; DM, diabetes mellitus; HFrEF, heart failure with reduced ejection fraction; HFmrEF, heart failure with mildly reduced ejection fraction; HFpEF, heart failure with preserved ejection fraction; RBC, red blood cell; Fib, fibrinogen; ALT, alanine aminotransferase; AST, aspartate transaminase; TC, total cholesterol; TG, triglyceride; HDL-C, high density lipoprotein cholesterol; LDL-C, low density lipoprotein cholesterol; HR, hazard ratio.
Patients were divided into three groups according to the tertiles of the ALI
score. Fig. 2 shows that the cumulative survival rate of patients was lowest in
the lowest ALI quartile group, and the mortality risk decreased gradually among
the three groups (log-rank
 Fig. 2.
Kaplan‒Meier survival curve for all-cause mortality according to
the ALI. Note: Q1: ALI
 Fig. 3.
ROC curves of serum chloride levels and the ALI score. ROC, receiver operating characteristic; AUC, area under the curve.
The univariate and multivariate Cox proportional hazards models indicated a
negative correlation between the admission ALI score and the risk of all-cause
mortality (Table 2). An increase in the ALI score was associated with a 3.8%
lower risk of all-cause mortality (95% CI: 0.955–0.968; p
| Univariable | Multivariable | |||
| HR (95% CI) | p-value | HR (95% CI) | p-value | |
| Age | 1.034 (1.026, 1.042) | 1.024 (1.016, 1.033) | ||
| Male vs. female | 0.986 (0.820, 1.185) | 0.880 | ||
| Coronary heart disease | 0.940 (0.785, 1.124) | 0.497 | ||
| Hypertension | 0.958 (0.800, 1.147) | 0.641 | ||
| Diabetes mellitus | 0.793 (0.653, 0.964) | 0.020 | ||
| AF | 0.879 (0.729, 1.059) | 0.176 | ||
| Smoking status | 0.986 (0.816, 1.193) | 0.888 | ||
| Drinking status | 1.222 (0.950, 1.572) | 0.112 | ||
| NYHA class IV | 2.286 (1.910, 2.736) | 1.506 (1.246, 1.820) | ||
| ALI score | 0.962 (0.955, 0.968) | 0.984 (0.977, 0.990) | ||
| LVEF | 0.995 (0.989, 1.000) | 0.056 | ||
| lgBNP | 5.771 (4.115, 8.095) | 3.490 (2.468, 4.936) | ||
| WBCs | 1.079 (1.054, 1.104) | |||
| RBCs | 0.736 (0.651, 0.832) | |||
| HB | 0.990 (0.986, 0.994) | 0.992 (0.988, 0.996) | ||
| PLTs | 0.998 (0.997, 0.999) | 0.002 | 0.999 (0.997, 1.000) | 0.012 |
| Fib | 1.093 (1.015, 1.177) | 0.019 | ||
| Potassium | 1.175 (1.006, 1.373) | 0.042 | ||
| Chloride | 0.878 (0.861, 0.895) | 0.915 (0.897, 0.933) | ||
| Sodium | 0.905 (0.887, 0.923) | |||
| ALT | 1.003 (1.002, 1.004) | |||
| AST | 1.005 (1.004, 1.006) | 1.005 (1.003, 1.010) | 0.036 | |
| Cre | 1.002 (1.002, 1.003) | |||
| SUA | 1.001 (1.001, 1.002) | |||
| GFR | 0.976 (0.971, 0.981) | |||
| FBG | 1.054 (1.029, 1.080) | |||
| TC | 0.810 (0.737, 0.891) | |||
| TGs | 0.825 (0.707, 0.963) | 0.015 | ||
| HDL-C | 0.628 (0.459, 0.858) | 0.004 | ||
| LDL-C | 0.809 (0.723, 0.904) | |||
| CRP | 1.013 (1.011, 1.015) | 1.008 (1.005, 1.010) | ||
Note: The univariate Cox proportional hazards model was used to screen variables, and then a multivariate Cox proportional hazards model was constructed. HF, heart failure; HR, hazard ratio; CI, confidence interval.
| Variable | Unadjusted | Model 1 | Model 2 | Model 3 | |||||
| HR (95% CI) | p-value | HR (95% CI) | p-value | HR (95% CI) | p-value | HR (95% CI) | p-value | ||
| Continuous variables | |||||||||
| ALI score | 0.962 (0.955, 0.968) | 0.966 (0.959, 0.973) | 0.961 (0.955, 0.968) | 0.979 (0.973, 0.986) | |||||
| Chloride level | 0.878 (0.861, 0.895) | 0.882 (0.866, 0.899) | 0.877 (0.861, 0.894) | 0.909 (0.891, 0.927) | |||||
| Tripartite variable | |||||||||
| Chloride level (Q2) | Reference | Reference | Reference | Reference | |||||
| Chloride level (Q1) | 2.467 (2.043, 2.980) | 2.533 (2.097, 3.060) | 2.469 (2.044, 2.982) | 1.994 (1.643, 2.421) | |||||
| ALI score (Q1) | Reference | Reference | Reference | Reference | |||||
| Q2 | 0.465 (0.377, 0.573) | 0.517 (0.418, 0.640) | 0.464 (0.376, 0.573) | 0.643 (0.516, 0.800) | |||||
| Q3 | 0.328 (0.260, 0.412) | 0.387 (0.306, 0.489) | 0.327 (0.260, 0.411) | 0.507 (0.398, 0.647) | |||||
Adjusted Model 1: adjusted for age; Adjusted Model 2: adjusted for gender; Adjusted Model 3: adjusted for age, gender, coronary heart disease, hypertension, diabetes mellitus, NYHA IV, LVEF, lgBNP, ALI, chloride, and CRP level.
Patients were dichotomized at the median serum chloride concentration, resulting
in two groups: low-chloride and high-chloride. Kaplan–Meier analysis
demonstrated significantly higher all-cause mortality in the hypochloremia group
compared to the normochloremia group (log-rank
 Fig. 4.
Kaplan‒Meier survival curve based on serum chloride for
all-cause mortality. Note: Q1: chloride
Both univariate and multivariate Cox regression confirmed serum chloride levels
as an independent inverse predictor of all-cause mortality (Table 2). An
additional 1 mmol/L of chloride was associated with a 12.2% lower risk of
all-cause mortality (95% CI: 0.861–0.895; p
Pearson’s correlation analysis revealed a positive correlation between the ALI score and serum sodium and chloride levels. However, the ALI score was negatively correlated with age, lgBNP, platelet (PLT), Fib, and potassium levels. The details are shown in Table 4.
| Variable | ALI score | Chloride levels | ||
| r | p value | r | p value | |
| Age | –0.264 | –0.023 | 0.465 | |
| ALI score | 1 | 0.235 | ||
| LVEF | –0.078 | 0.014 | 0.060 | 0.061 |
| lgBNP | –0.163 | –0.134 | ||
| WBCs | –0.358 | –0.173 | ||
| RBCs | 0.196 | –0.071 | ||
| HB | 0.186 | –0.070 | 0.029 | |
| PLTs | –0.032 | 0.318 | –0.010 | 0.754 |
| Fib | –0.226 | –0.094 | 0.003 | |
| Potassium | –0.006 | 0.843 | –0.057 | 0.074 |
| Chloride | 0.235 | 1.000 | ||
| Sodium | 0.217 | 0.577 | ||
| ALT | 0.034 | 0.292 | –0.046 | 0.147 |
| AST | –0.096 | 0.003 | –0.140 | |
| Cre | –0.191 | –0.081 | 0.011 | |
| SUA | –0.010 | 0.757 | –0.102 | 0.002 |
| CRP | –0.345 | –0.279 | ||
Note: The symbol “r” denotes the correlation coefficient. The value ranges of both Pearson correlation coefficient and Spearman correlation coefficient are [–1, 1].
Spearman’s correlation analysis showed that the ALI score was positively correlated with RBC counts, ALT, and HB levels. However, the ALI score was negatively correlated with LVEF, WBC counts, and AST, Cre, SUA, and CRP levels. The details are shown in Table 4.
Pearson’s correlation analysis showed that serum chloride levels were positively correlated with serum sodium levels and the ALI score. However, serum chloride levels were negatively correlated with age, lgBNP, PLT, Fib levels, and potassium levels. The details are presented in Table 4.
The Spearman correlation analysis revealed a positive correlation between serum chloride and LVEF. However, serum chloride levels were negatively correlated with RBC counts, WBC counts, and HB, ALT, AST, Cre, SUA, and CRP levels. The details are shown in Table 4.
After stratifying patients with HF by age (interaction p = 0.716),
gender (interaction p = 0.002), serum chloride levels (interaction
p
| ALI score | ||||
| HR (95% CI) | p-value | p for interaction | ||
| Age | 0.716 | |||
| 0.995 (0.990, 1.000) | 0.044 | |||
| 61–70 yrs | 0.992 (0.988, 0.996) | |||
| 0.996 (0.994, 0.998) | ||||
| Gender | 0.002 | |||
| Male | Reference | |||
| Female | 0.921 (0.845, 1.004) | 0.061 | ||
| BMI | ||||
| 0.986 (0.979, 0.994) | ||||
| 23–24.9 kg/m2 | 0.977 (0.966, 0.989) | |||
| 0.977 (0.968, 0.986) | ||||
| Chloride | ||||
| Q1 | 0.994 (0.992, 0.995) | |||
| Q2 | 0.998 (0.996, 1.000) | 0.044 | ||
Adjusted for coronary heart disease, hypertension, diabetes mellitus, LVEF, lgBNP, and CRP level. yrs, years.
Based on the tertiles of the ALI and the median serum chloride level, patients
were cross-combined into six groups (Table 6). In our Cox proportional hazards
analysis, we established Group 1 (chloride level
| Unadjusted | Adjusted | |||
| HR (95% CI) | p-value | HR (95% CI) | p-value | |
| Chloride level |
Reference | |||
| Chloride level |
0.43 (0.33, 0.55) | 0.56 (0.43, 0.73) | ||
| Chloride level |
0.24 (0.18, 0.33) | 0.38 (0.28, 0.53) | ||
| Chloride level |
0.29 (0.21, 0.39) | 0.36 (0.26, 0.49) | ||
| Chloride level |
0.20 (0.15, 0.26) | 0.31 (0.23, 0.43) | ||
| Chloride level |
0.17 (0.13, 0.26) | 0.29 (0.21, 0.41) | ||
Adjusted for age, gender, coronary heart disease, hypertension, diabetes mellitus, NYHA class IV, LVEF, lgBNP, and CRP level.
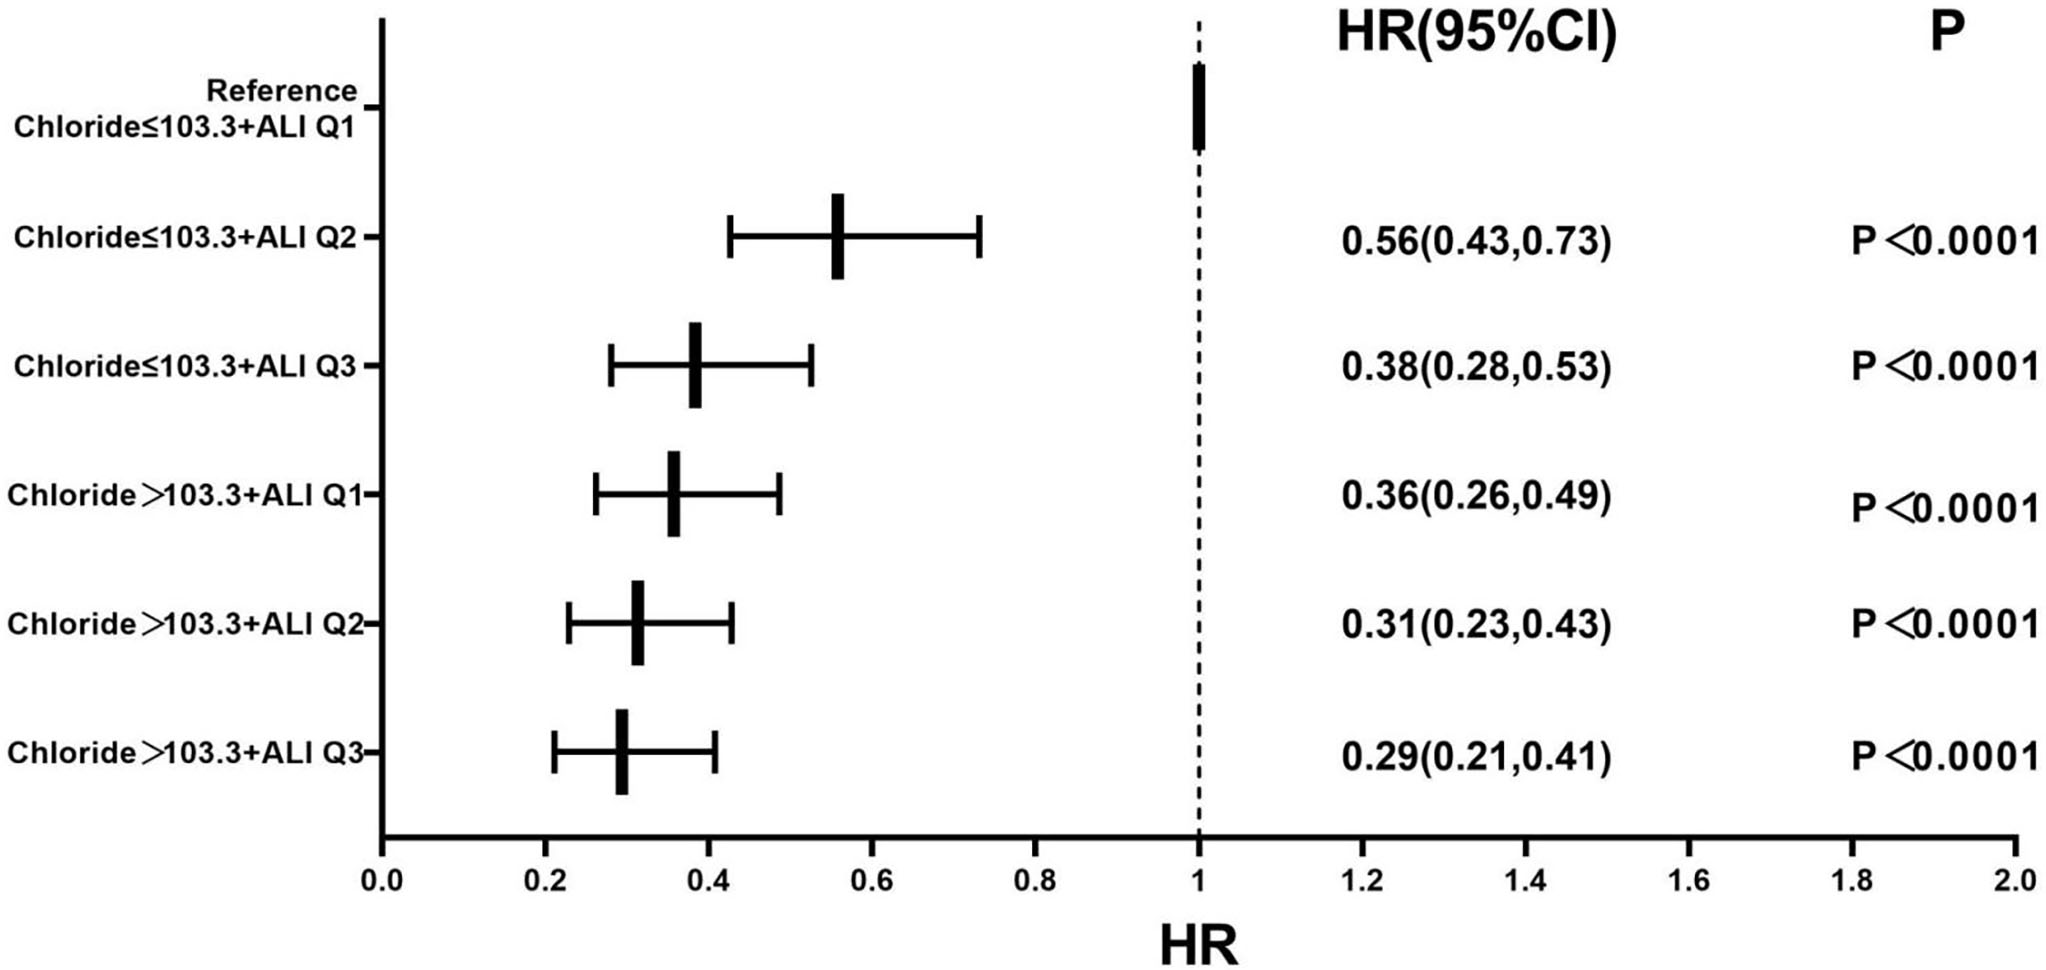 Fig. 5.
Forest plot of the multivariable-adjusted all-cause mortality
rate in the serum chloride, ALI, and combined groups. The multivariate Cox
regression model was adjusted for age, gender, coronary heart disease,
hypertension, diabetes mellitus, NYHA class IV, LVEF, lgBNP, and CRP level. Note:
Q1: ALI
This study evaluated the association between the admission ALI score and prognostic outcomes in patients with ADHF. We found that the risk of all-cause mortality was higher in patients in the lowest ALI quartile group compared to the higher ALI quartile groups and that the combination of the ALI score and serum chloride levels contributed to risk stratification. To our knowledge, this represents the first investigation to integrate the inflammatory–nutritional spectrum captured by the ALI with pathophysiological pathways for chloride in mortality risk stratification for ADHF. This synergistic approach addresses both metabolic derangements and systemic inflammation simultaneously. Our results demonstrate that this novel biomarker combination provides superior risk stratification compared to either marker alone, addressing critical gaps in existing prognostic models.
The ALI is a simple, reproducible, and cost-effective prognostic tool used to evaluate new prognostic indicators for diseases such as cancer. The ALI integrates three commonly measured clinical parameters: NLR, BMI, and serum albumin, all of which are associated with poor prognosis and may reflect malnutrition and inflammation levels in HF patients. Prior studies have established the independent prognostic value of the ALI in HF, including the demonstration by Maeda et al. [23] of its association with mortality and readmission in ADHF and the application by Kurkiewicz et al. [24] for risk stratification in advanced HF.
Patients with HF are frequently malnourished due to gastrointestinal oedema,
anorexia leading to reduced nutrient intake or inadequate absorption,
inflammatory cytokine-induced hypercatabolic syndrome, abnormal liver function
due to hepatic congestion, and insulin resistance [25, 26, 27]. The BMI is a predictor
of poor prognosis in HF patients, and it is easy to measure BMI clinically;
however, it is not an ideal indicator of the nutritional status of patients with
HF since these patients usually suffer from water and sodium retention, which
leads to short-term changes in body weight; therefore, the BMI is unable to
differentiate between weight due to excess fluids and fat. In patients with HF,
low BMI is associated with poor prognosis, a phenomenon known as the “obesity
paradox” [28, 29]. In our study, patients with HF in the low ALI quartile (Group 1:
22.17
This study demonstrated that the combination of the ALI score and serum chloride
levels was valuable for risk stratification in HF patients. Our findings showed
that lower chloride levels upon admission were associated with an elevated
mortality risk and provided substantial insights into the interpretation of
electrolyte disturbance in ADHF. To commence with, our multivariate analyses
revealed that serum chloride levels were independently and inversely correlated
with mortality, even after adjusting for other prognostic determinants. Secondly,
a significant association was observed between serum sodium levels and serum
chloride levels (r = 0.577; p
Therefore, patients with diminished ALI scores and low serum chloride levels are likely to require nutritional supplementation, adjunctive pharmacotherapy, and meticulous follow-up. Electrolyte derangements and malnutrition should be considered as a crucial therapeutic focus in patients with HF. While evaluating the nutritional status of HF patients, emphasis should also be placed on the treatment modalities for those with abnormal serum chloride levels. Pharmacological intervention should be applied to recover digestive and absorptive functions, particularly in patients with gastrointestinal congestion, which may afford an opportunity to ameliorate the prognosis of HF patients and could potentially have a favorable impact on the long-term prognosis.
Firstly, this study was a single-center, retrospective, and observational study. Hence, there may be some unmeasured variables that could potentially impact the interpretation of the research results. Secondly, this study mainly focuses on patients with a NYHA classification III or IV, moderate and severe HF. Therefore, these findings might not be applicable to a cohort with mild or moderate HF symptoms. Thirdly, we only collected data about the ALI score and serum chloride concentrations upon admission. Consequently, we were unable to examine the relationship between the dynamic changes of these two variables and the prognosis. Fourthly, notwithstanding that several covariates were taken into consideration within the regression model, it remains likely that some confounding variables are either unknown or inaccessible. Finally, we used all-cause mortality as an endpoint and did not follow up on other major cardiovascular adverse events. Prospective studies with more detailed cardiovascular endpoints could be designed in the future.
This study suggests that low ALI scores and low serum chloride levels are independent predictors of all-cause mortality in patients with ADHF. It is worth noting that the prognostic evaluation value of the combination of the two factors is significantly better than that of a single biomarker. Thus, the risk stratification of ADHF patients can be optimized by jointly evaluating the ALI and serum chloride levels, which helps to identify high-risk populations that require enhanced anti-inflammatory treatment and metabolic support in the early stages, ultimately improving patient prognosis.
The datasets used and analyzed during the current study are available from the corresponding author on reasonable request.
WYG: investigation, data collection and analysis, writing - original draft, writing - review & editing. FZY and ZJL: data analysis, data curation, investigation. DX, YS, AYX, XNM and YJP: data collection, software, investigation. LXC, WYG and FZY: investigation, writing - review & editing, methodology, project administration. All authors contributed to the editorial changes in the manuscript. All authors read and approved the final manuscript. All authors have participated sufficiently in the work and agreed to be accountable for all aspects of the work.
This is an observational study. The study protocol was approved by the Medical Ethics Committee of the First Affiliated Hospital of Kunming Medical University and was in line with the guidelines of the World Medical Association Declaration of Helsinki. All patients gave written informed consent for their data to be electronically stored and used for research. The ethics number of the study was (2022) Ethics L No.173.
Not applicable.
This study was supported by the Applied Basic Research Program of the Science and Technology Hall of Yunnan Province and Kunming Medical University (Project No.202301AY070001-130), the Yunnan health training project of high level talents (H2019052).
The authors declare no conflict of interest.
Publisher’s Note: IMR Press stays neutral with regard to jurisdictional claims in published maps and institutional affiliations.