


1 Biomedical and Translational Sciences, University of South Dakota, Vermillion, SD 57069, USA
2 Neuroergonomics and Cognitive Engineering Lab, Oklahoma State University, Stillwater, OK 74078, USA
3 Department of Psychology, University of South Dakota, Vermillion, SD 57069, USA
4 Department of Neurology, Ludwig Maximilian University, 81377 Munich, Germany
5 Applied AI Research Lab, Department of Computer Science, The University of South Dakota, Vermillion, SD 57069, USA
6 Department of Neuroscience, Sanford School of Medicine, University of South Dakota, Sioux Falls, SD 57104, USA
Abstract
Freezing of gait (FOG) is a debilitating motor symptom of Parkinson’s disease (PD) that significantly affects patient mobility and quality of life. Identifying reliable biomarkers to distinguish between PD patients with freezing of gait (PDFOG+) and those without FOG (PDFOG–) is essential for early intervention and treatment planning. This study investigates the potential of electroencephalographic (EEG) signals, focusing on well-studied midfrontal beta oscillatory feature, to classify PDFOG+ and PDFOG– using machine learning (ML) and deep learning (DL) approaches.
Resting-state EEG data were collected from the midfrontal ‘Cz’ and nearby channels (Cz-cluster) from 41 PDFOG+ and 41 PDFOG– subjects. A range of ML and DL models, including logistic regression (LR), random forest (RF), extreme gradient boosting (XGBoost), categorical boosting (CatBoost), and long short-term memory (LSTM) models were evaluated using leave-one-subject-out (LOSO), 10-fold, and stratified cross-validation (CV).
Outcomes demonstrate that while LR achieved an area under the receiver-operating characteristic (AUC-ROC) score of 0.63, LSTM outperformed all models, achieving an AUC-ROC of 0.68 and accuracy of 0.63, particularly with the Cz-cluster configuration.
These findings support the potential of midfrontal beta oscillations, particularly in combination with LSTM temporal modeling, a promising EEG-based biomarker for distinguishing PDFOG+ from PDFOG–. This work contributes to the development of more effective diagnostic tools and treatment strategies for PD-related gait impairments.
Keywords
- Parkinson disease
- freezing of gait
- electroencephalography
- beta rhythm
- machine learning
- deep learning
Freezing of gait (FOG) is a debilitating lower-extremity motor symptom of Parkinson’s disease (PD) in which people with PD feel their feet glued to the ground and lose their ability to step forward [1]. FOG in people with PD can be seen at the early stage of the disease and in up to 60% of people with PD in the advanced stages of the disease [2, 3]. It is difficult to investigate FOG in PD patients due to its paroxysmal nature. Normally, FOG episodes can be noticed most often during turning, passing through doorways, and when performing dual tasks with high cognitive load [4]. PD patients exhibit severe gait abnormalities with the progression of disease; and at the advanced stage of the disease, levodopa and deep brain stimulation therapies become less efficient at improving gait dysfunction including FOG [5, 6]. Normally, in the clinical setting, the accuracy of differentiating PD patients with FOG (PDFOG+) from those without FOG (PDFOG–) depends on clinical features such as the presence of FOG events during gait and/or 360° turning characteristics [7, 8]. However, FOG events and turning issues may not be seen in patients at the early stage of the disease or may not be present during the clinical testing day. Also, some limitations can be noted in these studies such as small sample size, analysis of the turning phases, turning in the preferred direction, or using fewer inertial sensors. In addition, these methods may not include some of the variables that can be most sensitive to disease progression. Notably, these studies implemented clinical assessments that require patients to perform gait or turning tasks and may induce freezing episodes with higher probability of falls. Therefore, electrophysiological recordings during the resting state could be a relevant alternative approach to classify PDFOG+. Moreover, it is crucial to improve the diagnosis of PDFOG+ for prognostic and therapeutic management viewpoints with additional simpler methodologies such as electroencephalographic (EEG) recordings along with clinical examinations or assessments.
A previous study has classified people with PD and healthy age-matched controls based on different machine learning (ML) methods [9]. Classification methods using linear features from EEG signals in different frequency bands show up to 82% accuracy [10], however, nonlinear measures from EEG datasets of PD and healthy controls yield up to 95% accuracy [11]. A previous study also reported a linear-predictive-coding EEG algorithm for PD and this method detected PD versus healthy controls in a computationally fast manner with 85% accuracy [9]. While these previous studies have reported classifying people with PD from EEG signal, classification algorithms on EEG signals have not been applied to differentiate PDFOG+ versus PDFOG– extensively. EEG has been shown to be an effective method for understanding the pathophysiological features of PD in clinical settings since it is cost effective, easier to perform, and available in all neurology clinics.
Although FOG is a movement phenomenon, recent studies suggest that resting-state midfrontal beta-band activity reflects disruptions in executive and cognitive-motor integration networks involved in FOG [12, 13]. Resting EEG can therefore serve as a neurophysiological marker to distinguish FOG subtypes even in the absence of overt movement. While wearable inertial measurement units (IMUs) are effective for detecting FOG during gait tasks, our focus was to identify intrinsic neural biomarkers that may predict FOG risk independent of movement. Recent work demonstrated high FOG prediction accuracy using multimodal wearable sensors [14]. Our approach complements this by leveraging EEG to explore underlying neurophysiological contributors to FOG beyond behavioral manifestations. Particularly, EEG provides insights into cortical dynamics, particularly in midfrontal regions, and allows early detection opportunities that behavioral sensors may miss.
Overall, we hypothesize that resting-state EEG could be essential for the reliable classification of PDFOG+ and PDFOG–, and we anticipate that the cortical oscillatory dynamics may offer a novel therapeutic intervention for the prediction and alleviation of severe gait dysfunction in PDFOG+. Interestingly, studies have suggested that PDFOG+ exhibits abnormal beta oscillations in the prefrontal and midfrontal cortical and subcortical regions when performing motor and dual tasks [5, 12, 15, 16]. Thus, the resting-state cortical oscillations in these frequencies may be categorized to advance the classification methods of PDFOG+ from PDFOG–. Therefore, the aim of the current study was to examine key aspects of classification of PDFOG+ from resting-state EEG recordings. Based on our previous reports [12, 13, 15], we tested our hypothesis that midfrontal beta oscillations may be suitable features for ML models.
For this study, we used dataset from 82 subjects with PD (41 PDFOG+ and 41
PDFOG–). Resting-state EEG signals in these subjects has been reported in
previous studies [9, 17]. Dataset can also be found online
http://predict.cs.unm.edu/downloads.php. All procedures were authorized in
accordance with the Helsinki Declaration. Participants were recruited as part of
a broader PD study conducted at the University of Iowa. All participants were
clinically diagnosed with idiopathic PD based on the UK PD Society Brain Bank
criteria and were classified as either PDFOG+ or PDFOG– by movement disorder
specialists using standardized FOG assessment protocols. The selection process
ensured demographic and clinical balance between groups. Exclusion criteria
included the presence of atypical parkinsonism, comorbid neurological or
psychiatric conditions, and poor EEG signal quality. All participants with PD
were tested while ON their usually prescribed dose of anti-parkinsonian
medication, approximately 60 to 90 minutes from the last dose because fall risk
and motor instability are higher in unmedicated PDFOG+ subjects and the ON state
is how people with PD are in daily life [4, 12]. The motor portion of Unified
Parkinson’s Disease Rating Scale (mUPDRS) [18] and the FOG questionnaire were
used to evaluate the disease severity and status of FOG in PD subjects,
respectively [19]. Similar to our earlier research [4, 12, 16], participants who
reported they experienced issues starting, stopping, and turning while walking
and those whose freezing of gait questionnaire (FOGQ) (number 3) score was
| PDFOG– (n = 41) | PDFOG+ (n = 41) | |
| Age (yrs.) | 68 |
69 |
| Disease duration (yrs.) | 4 |
6 |
| LEDD (mg/day) | 722 |
1003 |
| mUPDRS | 10 |
17 |
| FOGQ score | 2 |
11 |
| MoCA | 28 |
24 |
LEDD, Levodopa Equivalent Daily Dose; mUPDRS, Motor part of Unified Parkinson’s Disease Rating Scale; FOGQ, Freezing of Gait Questionnaire; MoCA, Montreal Cognitive Assessment; PDFOG+, PD patients with freezing of gait; PDFOG–, PD patients without FOG.
n.s. = not significant, Chi-square test.
* p
** p
EEG cap (actiCAP, EasyCap, Inc., Herrsching, Germany) with 64-channel was used to collect signals during a resting-state task in which participants sat and stared forward with their eyes open for 120–180 seconds. This data was collected using a 0.1 Hz filter and was sampled at 500 Hz with Pz as the reference electrode. EEG recordings were processed using EEGLAB 2022.1(Swartz Center for Computational Neuroscience, La Jolla, CA, USA) [20]. Due to potential contamination of the data from muscle artifacts, electrodes that are especially susceptible to movement-based and muscle artifacts were removed (TP9, TP10, FT9, FT10, Fp1, and Fp2). Data were re-referenced to the average and epoched into 3-second consecutive epochs across the entire dataset. Bad epochs and artifacts were removed using a combination of the FASTER and ADJUST algorithms, as well as the “pop_rejchan” function in MATLAB R2021a (The MathWorks, Inc., Natick, MA, USA) [21, 22].
EEG recordings of 90 seconds in duration were segmented into 30 non-overlapping epochs, each lasting 3 seconds. For each individual 3-second epoch, power spectral features using fast Fourier transform were extracted separately. These features were not averaged across epochs, allowing the model to utilize the variability present across different segments of the data. This approach preserves the temporal dynamics within the 90-second window and supports robust feature representation for classification tasks.
We focused our analyses on the midfrontal beta band (13–30 Hz). Spectral power values in the beta frequency band were extracted from a midfrontal Cz electrode and cluster of electrodes surrounding midfrontal Cz including Fz, FC1, FCz, FC2, and Cz. These values were then utilized in different ML and deep learning (DL) models.
We used the spectral power of the beta frequency band in thirty 3-seconds
epoched data obtained from signals recorded at electrodes (Cz, and cluster of
electrodes surrounding Cz including Fz, FC1, FCz, FC2, and Cz) of interest as
features. To capture midfrontal beta oscillations with greater reliability, we
focused on the “Cz-cluster”—comprising electrode Cz and its immediate
neighbors (Fz, FC1, FCz, and FC2). Signals from these electrodes were averaged to
form a composite midfrontal channel. This approach was adopted to reduce
channel-specific variability and enhance signal-to-noise ratio, while retaining
spatial specificity to the midfrontal cortical region, which has been previously
associated with cognitive and motor dysfunctions in PD [12, 16]. Thus, for each
condition (PDFOG+ or PDFOG–), there were 2 separate feature sets, Cz and
Cz-cluster, per participant. We scaled the MinMaxScaler function in the Python
sklearn (version 1.2.2, Scikit-learn, Python Software Foundation, Wilmington, DE, USA) preprocessing module to scale the features for each participant’s data,
transforming the beta features to a range between 0 and 1. This ensured that all
features contributed equally to model development, preventing bias towards
features with larger ranges. Thus, for each electrode of interest (Cz or
Cz-cluster) there were 1230 (30 epochs
All data preprocessing and statistical analyses were performed using Python (version 3.7.6, Python Software Foundation, San Francisco, CA, USA), with relevant packages including NumPy 1.18.1 (https://pypi.org/project/numpy/1.18.1/) and SciPy 1.4.1 (https://pypi.org/project/scipy/1.4.1/). Deep learning analyses were conducted using TensorFlow 2.1.0 (https://pypi.org/project/tensorflow/2.1.0/).
Our approach employs ML and DL models to classify PDFOG+ and PDFOG–, with hyperparameter optimization using Grid Search and model evaluation through leave-one-subject-out cross-validation (LOSO-CV), 10-fold-CV and stratified-CV. This methodology consists of several key stages (Fig. 1). We chose logistic regression (LR), Random Forest (RF), extreme gradient boosting (XGBoost), categorical boosting (CatBoost) as ML algorithms and long short term memory (LSTM) as DL algorithm for this study because prior studies have successfully applied them to PD datasets [23, 24, 25, 26, 27, 28, 29, 30]. We employed a parameter grid to fine-tune each model by experimenting with various hyperparameter values.
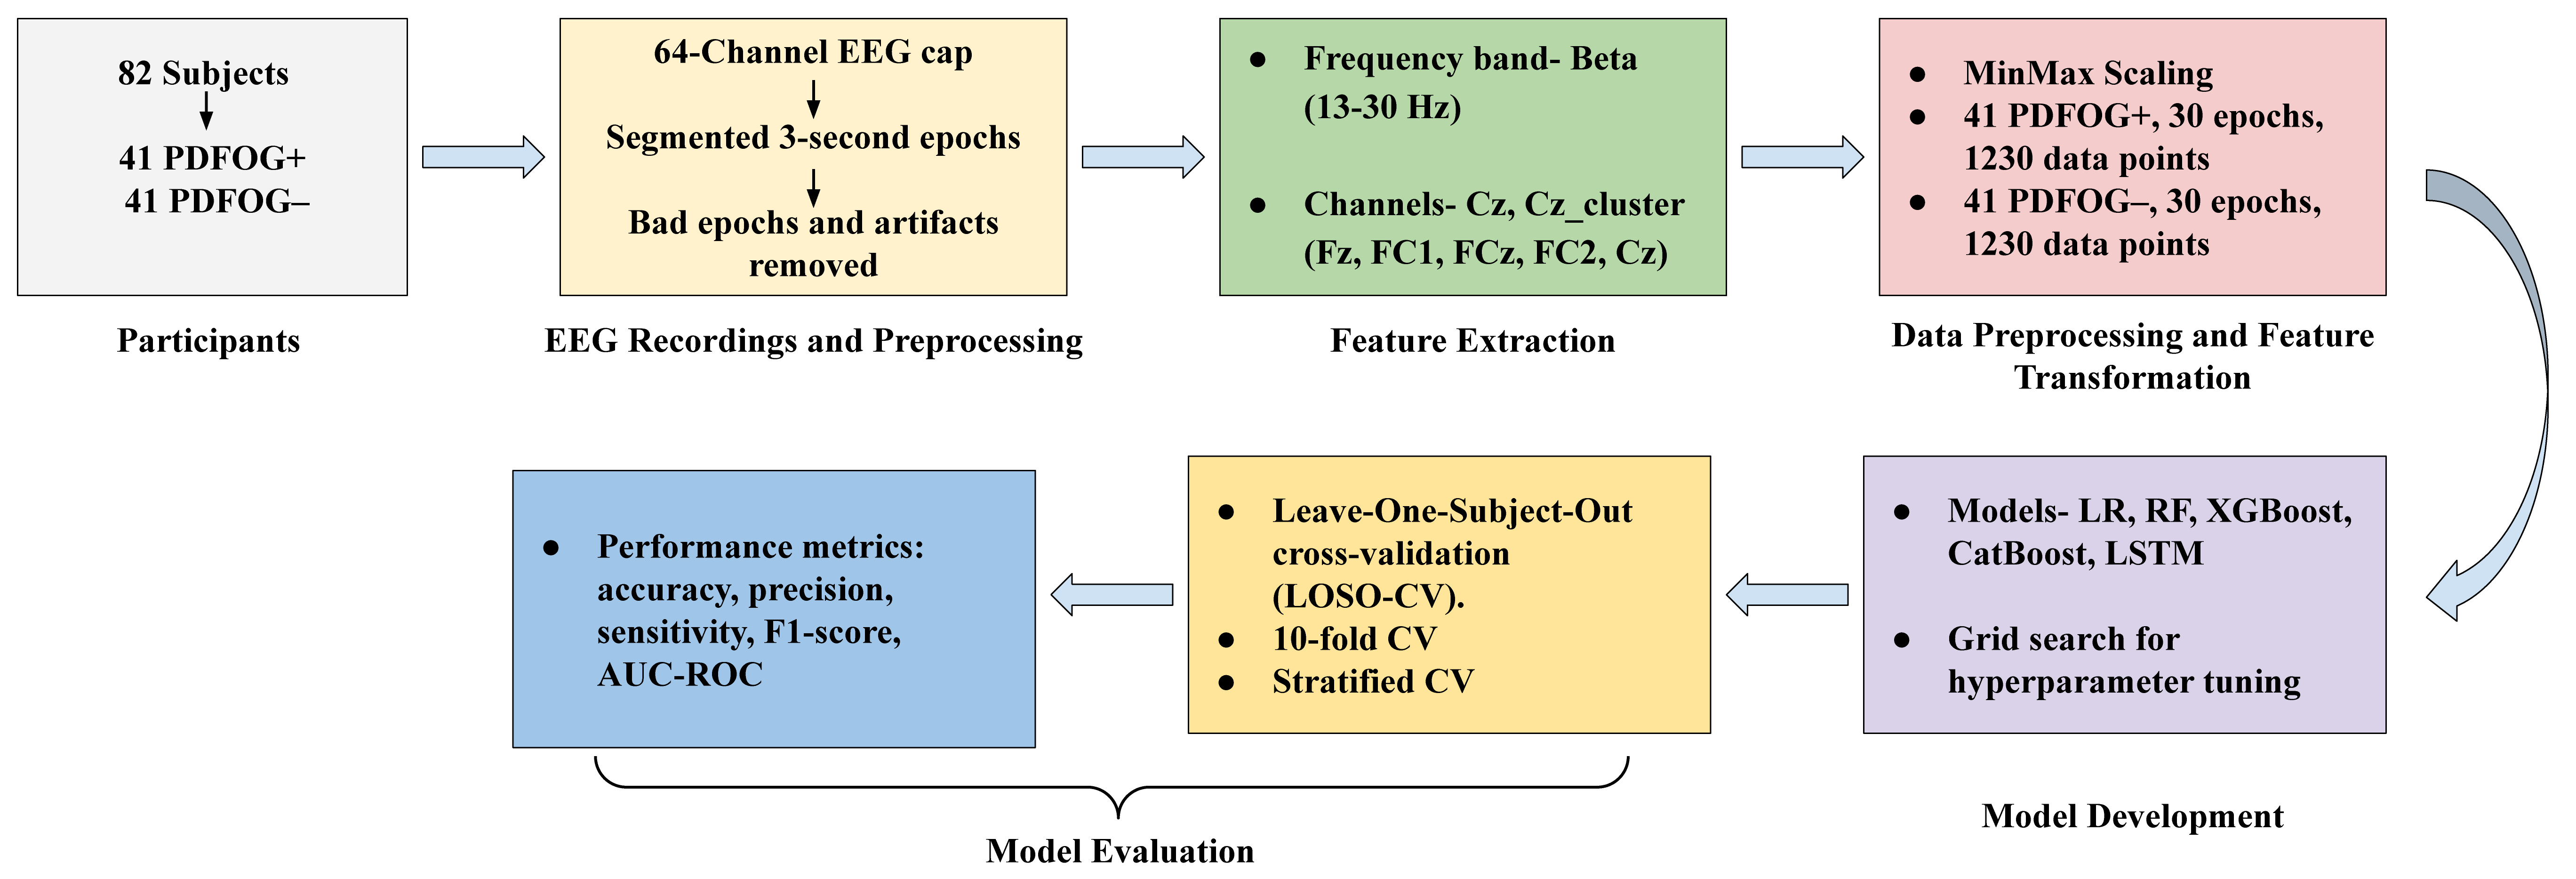 Fig. 1.
Flow diagram of the methodology for classifying PDFOG+ and PDFOG– using EEG data, covering participant enrollment, EEG preprocessing, feature extraction, data transformation, model development, and evaluation. EEG, electroencephalographic; LR, logistic regression; RF, random forest; XGBoost, extreme gradient boosting; CatBoost, categorical boosting; LSTM, long short term memory; AUC-ROC, area under the receiver-operating characteristic; LOSO, leave-one-subject-out; CV, cross-validation.
LR hyperparameters include penalty and solver. The penalty term specifies the type of regularization used, such as L1 (Lasso), L2 (Ridge), or Elastic Net, which determines how the model’s coefficients are penalized. The solver optimizes the LR model by finding the coefficients that minimize the loss function. The liblinear solver, which supports both L1 and L2 regularization and is well-suited for small to medium-sized datasets, has been used in prior study to discriminate cognitive status in PD [31]. In this study, the parameter grid for LR included regularization strength (0.1, 1, 10, 100), penalty (L1, L2, Elastic Net), and solver (liblinear).
Key hyperparameters in an RF model include the number of decision trees (n_estimators), the maximum number of features considered at each split (max_features), the maximum depth of each tree (max_depth), and the criterion used to evaluate the quality of splits. n_estimators sets the number of decision trees in the forest, max_features defines the number of features considered at each split, max_depth controls the maximum depth of each tree, and criterion specifies the function used to assess the quality of a split. In this study, the parameter grid for RF included n_estimators (100, 200, 300), max_features (sqrt, log2), max_depth (None, 4, 6, 8, 10), and criterion (gini, entropy).
XGBoost hyperparameters include maximum depth of trees (max_depth), subsample ratio (subsample), column subsampling (e.g., colsample_bytree), and learning rate (eta). max_depth restricts the maximum depth of each tree, subsample specifies the portion of training data used for each tree, colsample_bytree sets the fraction of features randomly chosen for each tree, and eta regulates the impact of each tree on the final model. In this study, we used a parameter grid that included n_estimators (100, 200, 300), max_depth (3, 4, 5, 6), learning_rate (0.01, 0.1, 0.2), subsample (0.6, 0.8, 1.0) and colsample_bytree (0.6, 0.8, 1.0).
CatBoost is another gradient boosting algorithm that handles categorical features exceptionally well. It is designed to provide high performance with minimal hyperparameter tuning, which is beneficial for complex datasets like EEG signals [26]. CatBoost hyperparameters include the number of boosting iterations (iterations), tree depth (depth), learning rate, and L2 regularization for leaf values (l2_leaf_reg). The iterations parameter determines the number of boosting rounds, where more iterations allow for increased accuracy at the risk of potential overfitting. The depth parameter controls the complexity of individual trees, allowing the model to capture intricate relationships in the data. Learning rate adjusts the contribution of each tree to the final model, balancing the trade-off between convergence speed and stability. Finally, the l2_leaf_reg parameter adds a regularization term to reduce overfitting by penalizing overly complex models. In this study, the parameter grid for CatBoost included iterations (100, 200, 300), depth (3, 4, 5, 6), learning rate (0.01, 0.1, 0.2), and l2_leaf_reg (1, 3, 5, 7, 9).
LSTM networks are a type of recurrent neural network (RNN) specifically designed to model long-term dependencies in sequential data. Given the time-dependent nature of EEG signals, LSTMs are highly suitable for capturing the temporal patterns that may indicate differences between PDFOG+ and PDFOG– in PD. To prepare the EEG data sequences for the LSTM model, for each subject, the beta bands data was organized into a sequence of 30 data points, forming an input suitable for time-series analysis with LSTM. The sequences were then reshaped to meet the LSTM input requirements, structured as (samples, time steps, feature), with each sequence representing a single subject. The target labels (PDFOG+ and PDFOG–) were encoded into binary values (0 and 1) and then one-hot encoded to make them compatible with the LSTM’s output requirements for binary classification. The LSTM model used in this study includes a layer with 32 units and a tanh activation function, which effectively manages the input sequence’s temporal information. This is followed by a dropout layer with a 0.2 dropout rate to mitigate overfitting by randomly deactivating neurons during training. The final dense layer has 1 unit with a sigmoid activation function to perform binary classification into PDFOG+ and PDFOG– (Fig. 2). The parameter grid for LSTM included units (50, 100), dropout rates (0.2, 0.3), batch sizes (16, 32), and epochs (50, 100), enabling optimization through grid search during LOSO-CV, 10-fold-CV and stratified-CV.
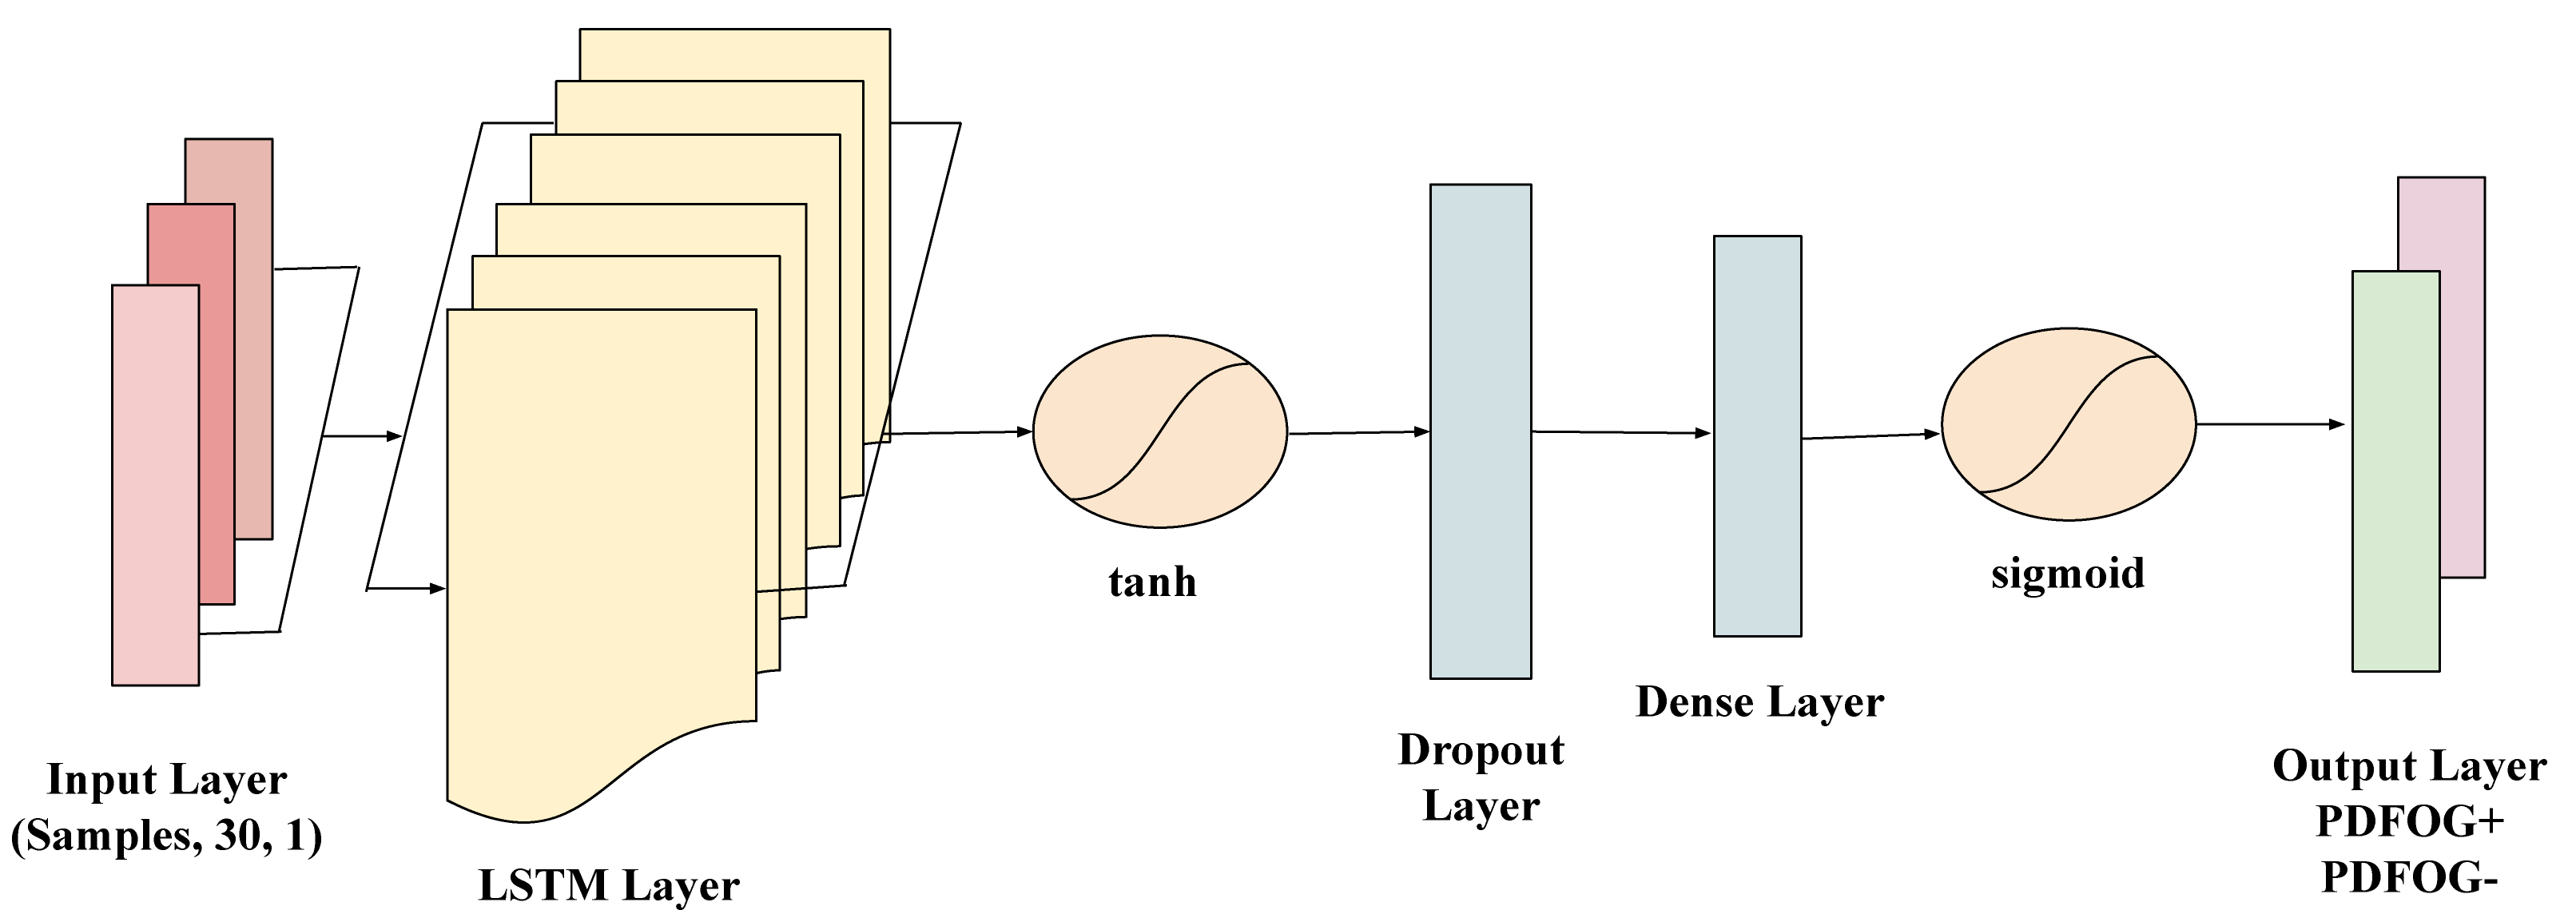 Fig. 2.
Architecture of the long short-term memory (LSTM) network used for classifying PDFOG+ and PDFOG– based on EEG data. The model takes input sequences shaped as (samples, 30, 1) representing 30 time steps with 1 feature each. It includes an LSTM layer with a tanh activation function to capture temporal dependencies, followed by a Dropout layer to prevent overfitting. A Dense layer further processes the extracted features, and the output layer with a sigmoid activation function performs binary classification into PDFOG+ and PDFOG– groups.
We used the grid search technique to explore a range of hyperparameter values that would optimize each model’s performance. We compared three different strategies to assess a trained model’s prediction outcomes on unseen data: LOSO-CV, 10-fold-CV, and stratified-CV.
LOSO-CV ensures that data from one subject is completely isolated during testing, which minimizes overfitting and evaluates the model’s ability to generalize across different individuals. Previous studies have employed LOSO-CV for EEG-based PD classification [32, 33, 34]. In this study, we divided the data into 82 subsets, each containing all the data from a single participant. Each model was trained on the data from 81 participants, leaving out the data from 1 participant as the test set. This process was repeated 82 times, with each participant taking a turn as the test set. For each model, after all 82 iterations, the performance metric from each test set was averaged to provide an overall assessment of that model’s ability to generalize across all participants.
We randomly split the entire dataset into 10 approximately equal folds [35]. For each of the 10 folds: we used one fold as the test set, combined the remaining 9 folds to form the training set, trained a model using the training set, and evaluated the model’s performance on the test set. Each fold was used as the test set exactly once. This approach is less computationally intensive compared to LOSO-CV.
We determined the proportions of PDFOG+ and PDFOG– in the dataset. In this study, the proportion was 50%:50%. We chose k = 10 as the number of folds for cross-validation. Then, we split the dataset into 10 folds such that each fold maintained the 50:50 ratio of PDFOG+ and PDFOG. In each iteration, one-fold was used as the test set, and the remaining k-1 folds were combined as the training set. We repeated this process k times, with each fold serving as the test set once. We trained each model on the training folds and evaluated its performance on the test fold.
We employed 5 performance metrics in this study. They are accuracy, precision, sensitivity, F1 score, and area under the receiver-operating characteristic (AUC-ROC) curve. We computed accuracy, which measures the proportion of correctly classified PDFOG+ and PDFOG– out of all instances, as ((true positive (TP) + true negative (TN))/(TP + false positive (FP) + false negative (FN) + TN)), where TP, TN, FP, and FN denote true positive, true negative, false positive, and false negative, respectively. We computed precision, which measures how many of the instances predicted as PDFOG+ actually are PDFOG+, as (TP/(TP + FP)). We computed sensitivity (or recall), which measures how many of the actual PDFOG+ instances were correctly identified by a model, as (TP/(TP + FN)). We calculated the F1 score, a metric that combines precision and sensitivity into a single value to balance both, as (2TP/(2TP + FP + FN)). Further, the AUC-ROC measures a model’s ability to discriminate between PDFOG+ and PDFOG– across various classification thresholds.
This section summarizes the classification outcomes for distinguishing PDFOG+ from PDFOG– subjects using EEG data. The analysis was conducted for both the Cz channel and the Cz-cluster, across the beta frequency band, with four ML models and one DL model: LR, RF, XGBoost, CatBoost, and LSTM.
For the Cz channel, as shown in Table 2, in the beta band, LR achieved an AUC-ROC score of 0.63 using LOSO-CV, with an accuracy of 0.40, precision of 0.34, and F1-score of 0.34. However, the relatively lower sensitivity (0.40) suggests a trade-off between precision and recall. The performance metrics for 10-fold and stratified-CV were lower, with AUC-ROC scores of 0.50. RF, XGBoost, and CatBoost exhibited comparable performance, with AUC-ROC values ranging between 0.44 and 0.50, showing limited discriminatory power. LSTM outperformed all traditional models, achieving the highest AUC-ROC of 0.55 and an accuracy of 0.51 in both LOSO and 10-fold cross-validation.
| Model | Cross-validation | Accuracy | Precision | Sensitivity | F1-score | AUC-ROC |
|---|---|---|---|---|---|---|
| LR | LOSO | 0.40 | 0.34 | 0.40 | 0.34 | 0.63 |
| 10-fold | 0.51 | 0.51 | 0.51 | 0.49 | 0.50 | |
| Stratified | 0.50 | 0.50 | 0.50 | 0.50 | 0.50 | |
| RF | LOSO | 0.45 | 0.45 | 0.45 | 0.45 | 0.47 |
| 10-fold | 0.49 | 0.49 | 0.49 | 0.48 | 0.49 | |
| Stratified | 0.50 | 0.50 | 0.50 | 0.50 | 0.49 | |
| XGBoost | LOSO | 0.46 | 0.46 | 0.46 | 0.46 | 0.46 |
| 10-fold | 0.49 | 0.49 | 0.49 | 0.48 | 0.49 | |
| Stratified | 0.49 | 0.49 | 0.49 | 0.49 | 0.50 | |
| CatBoost | LOSO | 0.43 | 0.43 | 0.43 | 0.43 | 0.44 |
| 10-fold | 0.49 | 0.49 | 0.49 | 0.49 | 0.50 | |
| Stratified | 0.50 | 0.50 | 0.50 | 0.50 | 0.49 | |
| LSTM | LOSO | 0.51 | 0.51 | 0.51 | 0.51 | 0.55 |
| 10-fold | 0.51 | 0.51 | 0.51 | 0.51 | 0.55 | |
| Stratified | 0.49 | 0.49 | 0.49 | 0.49 | 0.48 |
In the Cz-cluster configuration, as seen in Table 3, LR demonstrated an AUC-ROC of 0.47 using LOSO, with accuracy, precision, and F1-score all at 0.47. The performance improved slightly under 10-fold (AUC-ROC = 0.51, accuracy = 0.51) and stratified-CV (AUC-ROC = 0.51, accuracy = 0.51). RF, XGBoost, and CatBoost showed moderate performance, with AUC-ROC values ranging from 0.48 to 0.51. LSTM, however, achieved the best performance with an AUC-ROC of 0.68 and accuracy of 0.63 in LOSO-CV. The performance of LSTM further improved under 10-fold-CV, with AUC-ROC of 0.62 and accuracy of 0.57, demonstrating its superior ability to handle temporal dependencies in EEG data.
| Model | Cross-validation | Accuracy | Precision | Sensitivity | F1-score | AUC-ROC |
|---|---|---|---|---|---|---|
| LR | LOSO | 0.47 | 0.47 | 0.47 | 0.47 | 0.47 |
| 10-fold | 0.51 | 0.51 | 0.51 | 0.51 | 0.51 | |
| Stratified | 0.51 | 0.51 | 0.51 | 0.51 | 0.51 | |
| RF | LOSO | 0.47 | 0.47 | 0.47 | 0.47 | 0.50 |
| 10-fold | 0.49 | 0.49 | 0.49 | 0.49 | 0.50 | |
| Stratified | 0.49 | 0.49 | 0.49 | 0.49 | 0.50 | |
| XGBoost | LOSO | 0.47 | 0.47 | 0.47 | 0.46 | 0.48 |
| 10-fold | 0.50 | 0.50 | 0.50 | 0.50 | 0.51 | |
| Stratified | 0.48 | 0.48 | 0.48 | 0.48 | 0.49 | |
| CatBoost | LOSO | 0.44 | 0.44 | 0.44 | 0.44 | 0.41 |
| 10-fold | 0.49 | 0.49 | 0.49 | 0.49 | 0.50 | |
| Stratified | 0.50 | 0.50 | 0.50 | 0.50 | 0.51 | |
| LSTM | LOSO | 0.63 | 0.65 | 0.63 | 0.63 | 0.68 |
| 10-fold | 0.57 | 0.58 | 0.57 | 0.56 | 0.62 | |
| Stratified | 0.54 | 0.54 | 0.54 | 0.53 | 0.57 |
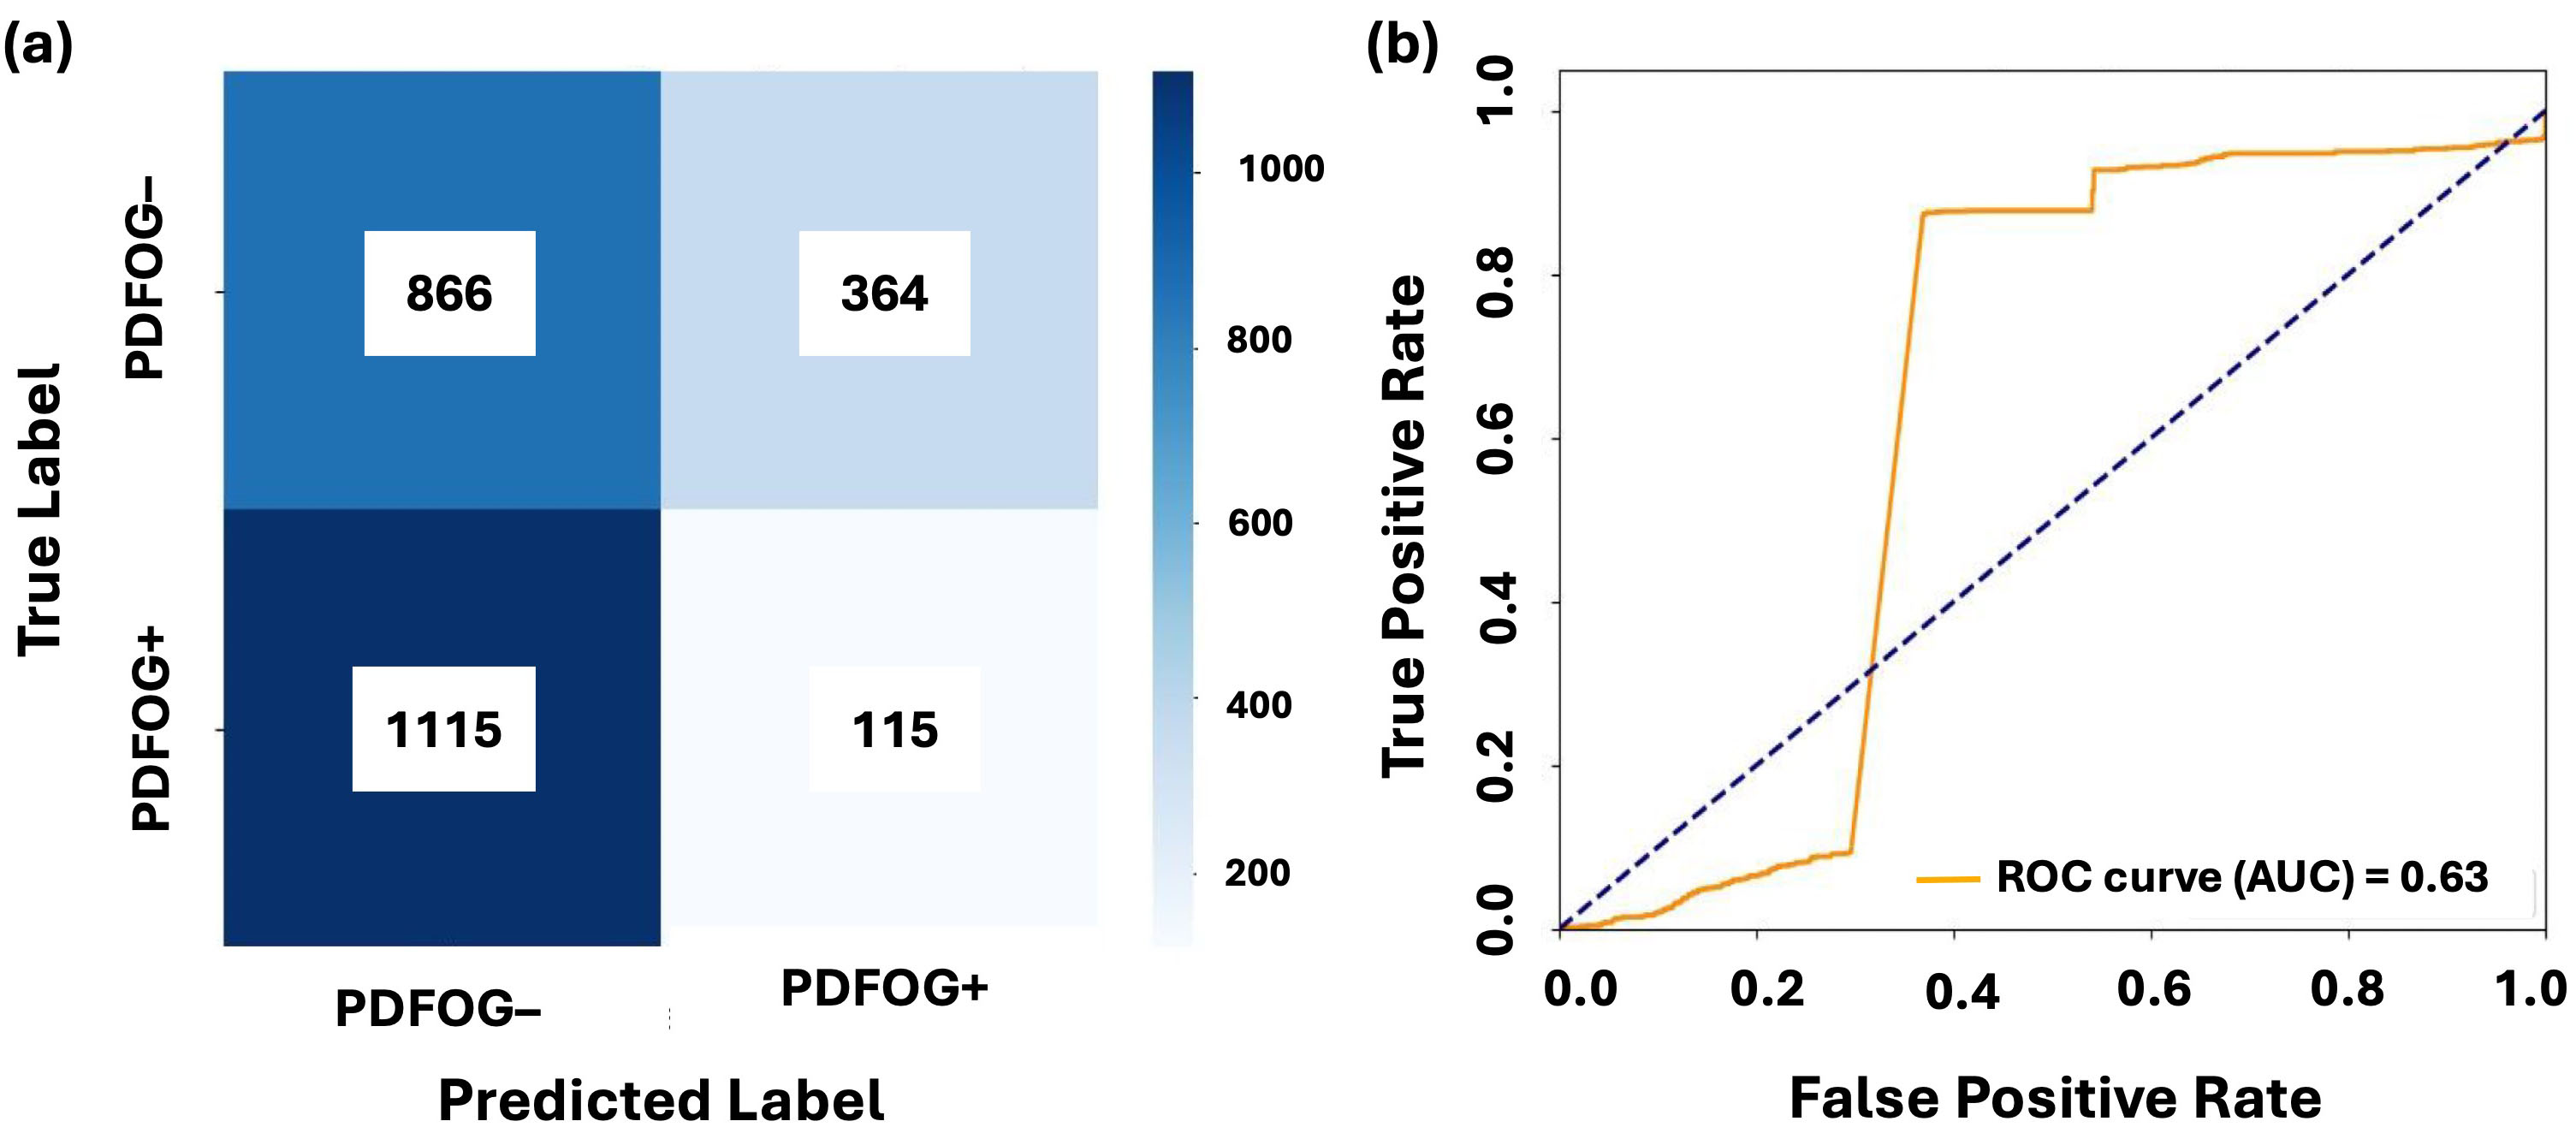
Figs. 3,4 illustrate the confusion matrices and AUC-ROC curves for LR and LSTM models under LOSO-CV for the Cz channel and Cz-cluster configurations, respectively. In Fig. 3, the performance of LR on the Cz channel in the beta band is shown, with an AUC-ROC of 0.63. The confusion matrix reveals a higher number of false positives (364) and false negatives (1115), reflecting difficulty of model in distinguishing PDFOG+ from PDFOG–. In contrast, Fig. 4 shows performance of LSTM on the Cz-cluster with an AUC-ROC of 0.68, where the confusion matrix indicates better performance with more true positives (32) and fewer false positives (21), supporting improved discriminative ability of LSTM.
 Fig. 3.
Classification performance of LR on midfrontal Cz beta band. (a,b) show the confusion matrix and AUC-ROC curve for LR with leave-one-subject-out cross-validation on the midfrontal (Cz) beta band. The confusion matrices illustrate the distribution of true positives, false positives, true negatives, and false negatives for PDFOG+ and PDFOG– groups. The AUC-ROC curves demonstrate ability of model to discriminate between PDFOG+ and PDFOG– across varying classification thresholds, with the AUC indicating the models’ discriminative performance (0.63 for LR).
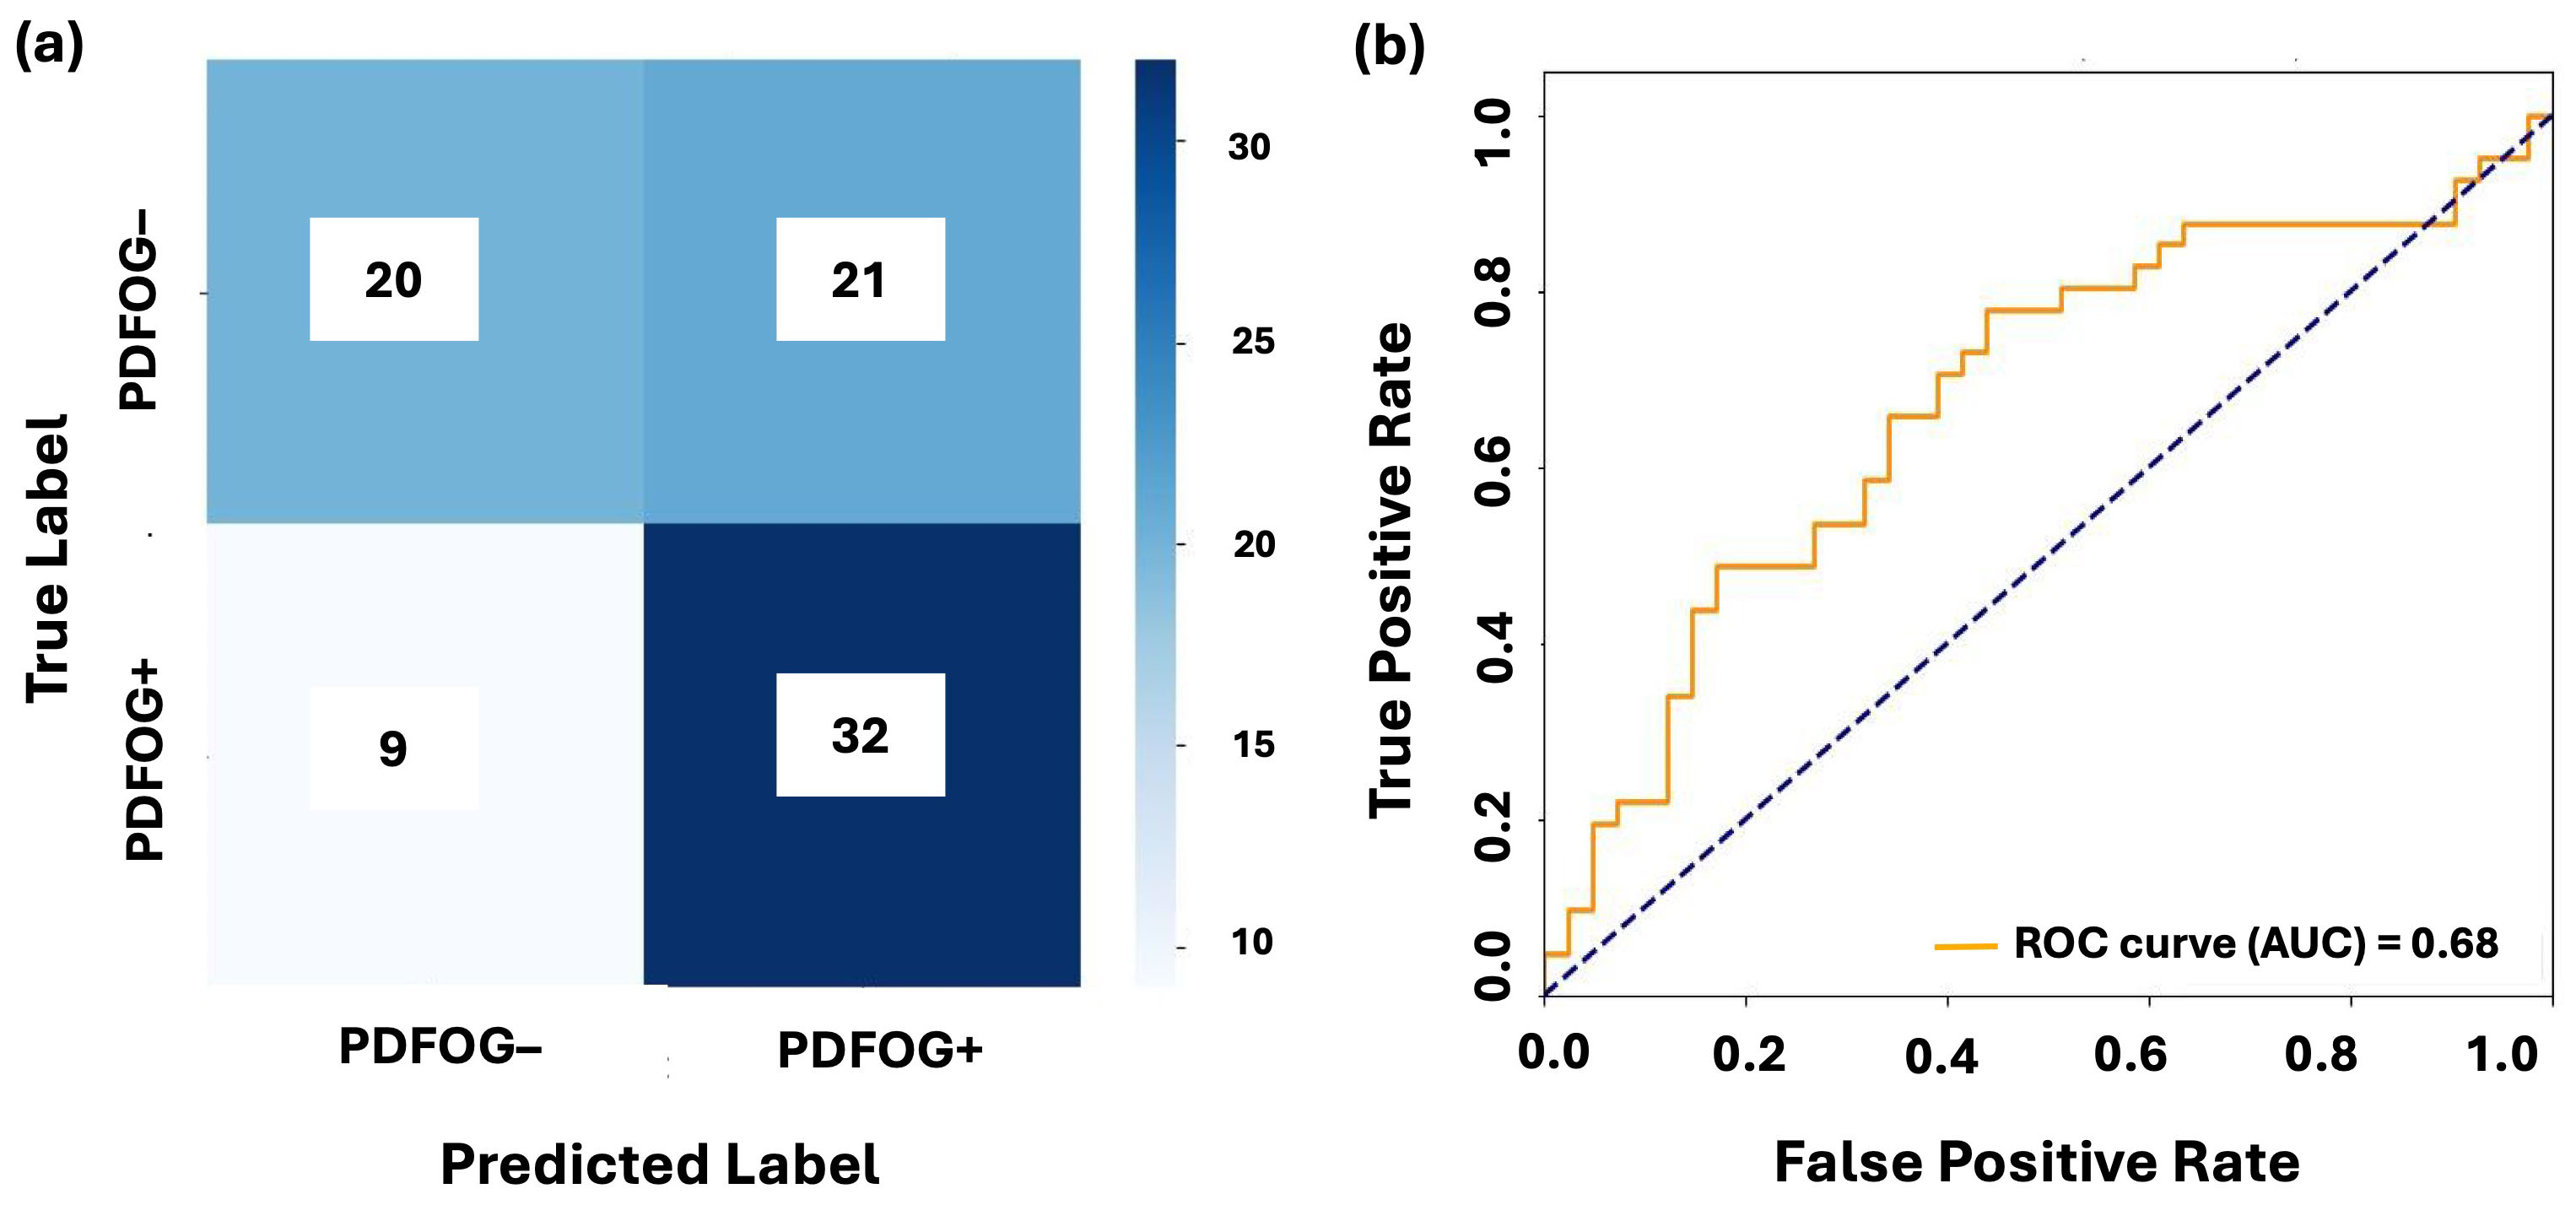 Fig. 4.
Classification performance of LSTM on midfrontal Cz-cluster beta band. (a,b) show the confusion matrix and AUC-ROC curve for LSTM with leave-one-subject-out cross-validation on the midfrontal Cz-cluster beta band. The confusion matrices illustrate the distribution of true positives, false positives, true negatives, and false negatives for PDFOG+ and PDFOG– groups. The AUC-ROC curves demonstrate ability of model to discriminate between PDFOG+ and PDFOG– across varying classification thresholds, with the AUC indicating the models’ discriminative performance (0.68 for LSTM).
Overall, the midfrontal beta oscillatory features from Cz and Cz-cluster provided moderate discriminatory power. LR achieved the highest AUC-ROC of 0.63 but was limited by low accuracy and F1-scores. LSTM outperformed the traditional models, particularly in the Cz-cluster configuration, achieving an AUC-ROC of 0.68 and accuracy of 0.63. These results highlight the importance of temporal dependencies in EEG analysis and suggest that the midfrontal beta band may serve as a possible key biomarker for PDFOG+ classification.
The results of this study demonstrate that LSTM was the most effective model for distinguishing between PDFOG+ and PDFOG– subjects using EEG data from the midfrontal Cz and Cz-cluster signals, particularly in the beta band. LSTM achieved the highest AUC-ROC of 0.68 for the beta band using the Cz-cluster configuration, with an accuracy of 0.63, precision of 0.65, and F1-score of 0.63. These results highlight ability of LSTM to capture temporal dependencies in EEG data, offering superior performance compared to traditional ML models. In contrast, LR despite achieving a relatively high AUC-ROC of 0.63 for the Cz configuration, showed much lower accuracy (0.40), precision (0.34), and F1-score (0.34). This discrepancy emphasizes the challenge of translating high-ranking probabilities into effective classifications at a fixed threshold, where the high AUC-ROC score did not align with the model’s true classification accuracy, particularly in the case of LR.
The relatively lower performance metrics for LR, RF, XGBoost, and CatBoost (AUC-ROC values ranging from 0.44 to 0.50) suggest that while these models capture some discriminatory information from the beta band, they are less effective at distinguishing between PDFOG+ and PDFOG– subjects. These models had moderate performance, with AUC-ROC values indicating only limited discriminatory power. This could be due to overlapping distributions between the two groups, which makes it harder for these models to find clear decision boundaries. However, LSTM, by leveraging the temporal structure of the data, outperformed these traditional models, particularly with the Cz-cluster data, which likely enabled it to capture more complex patterns and interactions in the EEG signals. The inclusion of the Cz-cluster, as seen in Table 3, provided some improvement, with LR’s F1-score increasing to 0.47 compared to 0.34 with Cz alone. This suggests that using a cluster of nearby electrodes improves the ability of model to detect subtle spatial patterns associated with PD with FOG classification. This is consistent with prior research showing that cluster-based approaches can enhance the stability of EEG signals by averaging activity across neighboring electrodes, reducing noise, and improving generalizability [10, 12]. However, the improvements were modest, and the performance of traditional ML models remained limited compared to LSTM.
LSTM demonstrated an AUC-ROC of 0.68 and accuracy of 0.63 with the Cz-cluster,
reflecting its ability to capture the temporal dynamics of EEG signals more
effectively. The improvement of LSTM’s performance with temporal modeling
highlights the importance of understanding the sequential nature of EEG data in
clinical contexts. To further validate the reliability of the observed AUC-ROC
value, we conducted a post-hoc power analysis. The analysis confirmed that our
sample size (n = 82) provided 83% power to detect an AUC of 0.68 at
Additionally, the use of LOSO-CV in this study helped to account for subject-specific variability, a common challenge in EEG-based classification. The high AUC-ROC values observed in LOSO-CV confirm that the models, especially LSTM, generalize well across different individuals. Despite the modest performance metrics for some models, the findings underscore the need for multimodal approaches that integrate EEG with other modalities like functional near-infrared spectroscopy (fNIRS) or eye-tracking to capture complementary information and improve classification accuracy [37, 38]. The relatively lower performance of traditional models like LR could be due to misalignment between the AUC-ROC score and the default classification threshold. Since AUC-ROC measures the ranking ability of the model across various thresholds, performance at a fixed threshold (e.g., 0.5) may not align with the model’s probability distribution. Adjusting the classification threshold or using threshold optimization techniques could improve precision and recall, mitigating the trade-off observed in models like LR. Furthermore, LSTM models highlight the importance of optimizing architectures for EEG data. While LSTM outperformed traditional methods, it still requires further refinement to address issues like subject-specific variability and performance consistency. Hybrid models, combining Convolutional Neural Networks with LSTMs, could be explored to better capture both spatial and temporal features, potentially enhancing classification accuracy [39].
Several limitations should also be noted. One limitation of the current study is the absence of confidence intervals for AUC values. While AUC was used to assess model performance, the limited sample size may result in unstable or misleading interval estimates. Future work will incorporate confidence intervals and larger sample sizes to better quantify the robustness and generalizability of classification outcomes. The dataset size may also have constrained the generalizability of results, particularly for deep learning models. Larger datasets with greater variability are needed to validate these findings. The EEG data used in this study were collected at the University of Iowa and are fully independent of the current laboratory’s internal datasets. The dataset has been previously published [9, 17] and is publicly accessible (http://predict.cs.unm.edu/downloads.php), ensuring full transparency and reproducibility. Although external datasets were not used for validation in this study, we recognize the importance of generalizability and plan to validate the current findings using independent datasets in future research. Another notable limitation of this study is that all EEG recordings were conducted while participants were in the ON-medication state. Levodopa and related dopaminergic medications are known to alter cortical oscillatory activity, and their effects can vary significantly between individuals with and without FOG. As such, limiting data collection to the ON state may reduce the ability to capture pathological neural signatures that emerge or intensify during the OFF-medication state, potentially introducing bias into our findings. However, this design choice was made to ensure participant safety and comfort, as OFF-state assessments can increase the risk of falls and other adverse events during data acquisition. Moreover, the ON state still provides clinically relevant insights, especially in cases where FOG persists despite medication. In future studies, we plan to include both ON- and OFF-state recordings to better understand state-dependent neural dynamics and to enhance the robustness of FOG classification models. Though healthy controls were not included in the present classification task, comparative analyses involving healthy individuals will be performed in future studies to isolate disease-specific EEG signatures. Therefore, future research can leverage three-way comparisons (PDFOG+, PDFOG–, age-matched healthy controls) to better isolate pathological neural activity and enhance clinical interpretation. The reliance on resting-state EEG may limit the applicability to task-based paradigms where neural dynamics are more pronounced. Future research should explore the inclusion of lower-limb motor task-based EEG recordings to assess whether dynamic neural responses enhance classification performance. We should also aim to acquire EEG during active FOG episodes using task-based paradigms, gait simulations, or wearable-triggered recordings. Integrating additional features such as functional connectivity or spectral entropy could further improve discrimination. Finally, integrating multimodal data (e.g., fNIRS, motion capture, eye-tracking) with EEG may also yield synergistic insights into FOG dynamics, and such approaches can be explored in future studies [40, 41, 42]. Future work should also consider threshold optimization and advanced metrics to better align with clinical objectives, including techniques like Generative Adversarial Networks to augment datasets and reduce biases [43]. In this study, we focused on power spectral features due to their relevance in FOG-related beta oscillations [12, 13, 44]. However, future work could also expand this approach to include nonlinear EEG features. Additionally, while we demonstrate that LSTM, a deep learning approach, can be effective even with limited data, further data collection will support exploration of more complex deep architectures. Moreover, future analyses can also explore the integration of other frequencies features (such as theta, alpha, and gamma) with beta-band data to improve classification accuracy and capture broader neurophysiological patterns associated with FOG. Statistical and transformation-based fusion methods, including principal component analysis (PCA), kernel fusion, or neural attention layers, can also be considered to enhance multi-band integration.
This study demonstrates the potential of using EEG data, particularly from the midfrontal beta frequency band, to classify PDFOG+ and PDFOG– subjects. The results conclude that while traditional ML models such as LR, RF, XGBoost, and CatBoost provide some discriminatory power, LSTM, a DL model, outperformed all other models, particularly with the Cz-cluster configuration. The capability of LSTM to capture temporal dependencies in EEG signals proved crucial in achieving the highest performance, with an AUC-ROC of 0.68 and accuracy of 0.63. These findings suggest that the midfrontal beta oscillations can hold promise as a biomarker for distinguishing PDFOG+ from PDFOG– subjects, especially when combined with the temporal modeling capabilities of LSTM. The study emphasizes the importance of integrating both spatial and temporal features to improve classification accuracy and generalizability, making LSTM a significant tool for this task. While the results are promising, further optimization of model architectures, including hybrid models combining convolutional networks with LSTM, and the incorporation of multimodal data, may lead to even better performance in clinical applications. Future research should focus on refining the models to handle subject-specific variability more effectively and explore task-based EEG recordings to capture more dynamic neural responses. These improvements could enhance the reliability and clinical applicability of EEG-based classification for PD with FOG and potentially improve diagnostic tools for PD.
The datasets and code generated during and/or analyzed during the current study are available from the corresponding author on reasonable request.
SR, JN, and AS designed, analyzed, and wrote the manuscript. TJB and RB organized the data and preprocessed the data. MS, TK, and KS analysed the codes and reviewed the manuscript. TJB and RB also reviewed the manuscript. All authors read and approved the final manuscript. All authors have participated sufficiently in the work and agreed to be accountable for all aspects of the work.
Not applicable.
Not applicable.
This work was supported by SSOM Biomedical AI and Computation Idea Competition (BACIC).
The authors declare no conflict of interest.
References
Publisher’s Note: IMR Press stays neutral with regard to jurisdictional claims in published maps and institutional affiliations.