
- Academic Editor
Alzheimer’s disease (AD) is the most common neurodegenerative disease affecting the elderly, with its diagnosis at early stages crucial for effective intervention. Recent evidence increasingly supports the role of epigenetic alterations in AD pathogenesis, highlighting the need for innovative biomarkers that reflect these changes. This study aimed to characterize the genome-wide DNA methylation profiles of cell-free DNA in peripheral blood for potential biomarkers associated with AD.
The Illumina Infinium array was utilized to detect the methylation patterns of circulating cell-free DNA from AD patients and healthy controls. The R Bioconductor Linear Models for Microarray Data (LIMMA) package was employed to identify methylation variable positions (MVPs), and Probe Lasso was used to pinpoint differentially methylated regions (DMRs) linked to AD. Bioinformatics enrichment analysis of the annotated genes was performed using EnrichR. A second cohort was recruited to validate the methylation changes at the C-terminal binding protein1 (CTBP1) promoter cytosine-phosphate-guanine (CpG) sites via pyrosequencing. Additionally, microarray data from the Gene Expression Omnibus (GEO) database were analyzed to further validate gene expression and immune infiltration.
A unique DNA methylation landscape in peripheral blood was characterized for AD patients and 4335 MVPs showed significant differential methylation (p < 0.01). Functional annotation and pathway enrichment analysis underscored processes and pathways inherent in the nervous system. Probe Lasso identified 68 DMRs annotated to 10 genes, with hypermethylation of CpG islands in the CTBP1 TSS1500 promoter showing significant differences when AD and controls were compared (p < 0.01), with an area under the receiver operating characteristic (ROC) curve (AUC) of 0.779. Analysis of immune cell infiltration revealed CTBP1 expression is significantly correlated with altered distribution of immune cells (p < 0.001), underscoring its potential role in modulating immune responses in AD. Moreover, CTBP1 expression levels significantly varied across multiple GEO datasets.
AD displays distinct DNA methylation patterns in peripheral blood and CTBP1 promoter hypermethylation represents a promising potential biomarker for AD diagnosis.
Alzheimer’s disease (AD) is the most common aging-associated neurodegenerative
disorder with symptoms including progressive cognitive impairment and memory
loss. Histopathologically, AD is characterized by extracellular senile plaques
(deposition of beta-amyloid peptides), presence of intracellular neurofibrillary
tangles (comprised of hyperphosphorylated tau protein) and neuron loss in the
brain [1]. The pathogenesis of AD is complex and involves multiple genetic,
epigenetic and environmental factors. AD is clinically diagnosed via biological
assays and neuroimaging, such as measurements of beta-amyloid and tau levels in
the cerebrospinal fluid [2], structural magnetic resonance imaging [3], and
amyloid positron-emission tomography [4]. Given that peripheral
blood biomarkers are much less invasive and more convenient in clinical practice,
increased effort has focused on the analysis of amyloid
Epigenetics describes the heritable chemical modifications of DNA and histones that lead to altered gene expression without changes in DNA sequence, including histone modification, DNA methylation, and non-coding RNA [10]. DNA methylation is one of the most important epigenetic modifications that regulate gene expression in response to environmental agents and lifestyle factors. The methylation of cytosine residues at specific cytosine-phosphate-guanine (CpG) dinucleotide sites is one of the best currently described epigenetic mechanisms. As critical epigenetic modification of the human genome, DNA methylation represents a crucial manner for the regulation of many cellular processes, including gene regulation, X chromosome inactivation, genomic imprinting, and chromatin structure, stability and transcription [11]. Aberrant DNA methylation is implicated in the pathogenesis of numerous human diseases, including developmental diseases, cancer and neurological disorders [12]. A growing number of studies delineate the potential mechanisms of particular action for DNA methylation linked to the pathophysiology of AD [13, 14, 15].
High levels of gene methylation are usually associated with transcriptional silencing. Sanchez-Mut et al. [16] reported that dual specificity phosphatase 22 (DUSP22) expression, which was associated with tau pathology, was reduced because of promoter hypermethylation in hippocampus from AD patients. Alternatively, presenilin 1 (PSEN1) gene hypomethylation in promoter, both at CpG and non-CpG sites, was considered to be significantly associated with higher expression of pSEN1 in AD. Furthermore, PSEN1 methylation in blood DNA was significantly lower in AD patients than in controls [17], suggesting that DNA methylation profiling in peripheral blood contributes to discovery of potential biomarkers for AD. Recently, increased research has focused on shaping the DNA methylation landscape of AD for noninvasive biomarkers [18, 19, 20]. It has been demonstrated that peptidylprolyl cis/trans isomerase, NIMA-interacting 1 (PIN1) promoter methylation level is associated with AD risk in a southern Chinese population [21]. While a recent work has developed a targeted sequencing protocol to detect the methylated circulating cell-free DNA in the plasma of AD patients that has identified differentially methylated CpG of the LIM homeobox 2 (LHX2) gene as a candidate noninvasive biomarker in AD diagnosis [22].
The C-terminal binding protein1 (CTBP1) gene is located on chromosome 4p, and its protein products include CtBP1-L (440 aa) and CtBP1-S (429 aa) with molecular weights of approximately 55 and 50 kDa. CTBP1 is a transcriptional co-repressor that has a critical role in regulating gene expression in the nucleus [23]. It interacts with various transcription factors and co-regulators, such as retinoblastoma protein through the adaptor protein CtIP [24], E2F transcription factor 4 [25], and histone deacetylases [26]. CTBP1 is primarily localized in the nucleus but also shuttles between the nucleus and cytoplasm, undertaking diverse regulatory functions in cellular physiological processes. This dynamic localization is facilitated by its post-synaptic density-95, disks-large and zonula occludens-1 (PDZ)-binding domain at the N-terminal region, which mediates interactions with partners such as neuronal nitric oxide synthase, enabling CTBP1 to perform distinct cytoplasmic functions when associated with such enzymes [27, 28]. Thus it is involved in various biological processes, such as cell proliferation [29], differentiation [30] and apoptosis [31]. Notably, in vitro downregulation of CTBP1 led to cell apoptosis of cerebellar granule neurons (CGNs), implying a key role in the nervous system [32]. Mutations in the CTBP1 gene have been associated with some pathogenic phenotypes, including intellectual disability and hypotonia, ataxia, developmental delay, and tooth enamel defect syndrome (HADDTS), characterized by hypotonia, ataxia, developmental delay and tooth enamel defects [33]. A developmental study using a mouse model has shown a critical involvement for CTBP1 in neurodevelopment, with region-specific expressions in the central nervous system, notably in Purkinje cells and the developing hippocampus, indicating its essential roles from embryonic stages through to adulthood [34]. These data implied the critical roles for CTBP1 during vertebrate neurodevelopment.
In this study, the epigenetic mechanisms implicated in AD were investigated by profiling DNA methylation in circulating cell-free DNA from peripheral blood. The focus was on identifying methylation variations and their potential association with AD, particularly the potential utility as diagnostic biomarker. Gene expression data from the GEO database were analyzed to observe variations in the expression of these genes in AD-affected brain regions. Our findings suggest that AD is characterized by unique DNA methylation patterns in peripheral blood, with CTBP1 promoter hypermethylation showing promise as a potential biomarker for early AD diagnosis.
A total of four AD patients (2 females, 2 males, mean age 78.5
Peripheral blood samples from all participants were drawn after fasting for at least 12 h. A total of 10 mL of whole blood was collected in EDTA tubes (Becton Dickinson, Franklin Lakes, NJ, USA). Genomic DNA was extracted from the blood samples using QIAamp DNA Mini Kit (# 51304, Qiagen, Germantown, MD, USA) according to the manufacturer’s instructions. The extracted DNA was aliquoted and stored at –80 °C until used.
Genomic DNA samples were bisulfite-converted by EpiTect Bisulfite Kit (#59104,
Qiagen) according to the manufacturer’s instructions. Subsequently, DNA
methylation profiles were depicted using Infinium 850K MethylationEPIC BeadChip
(15070022/WG-317-1002, Illumina) on a HiScan system
(SY-101-1001, Illumina), covering more than 850,000 different
CpGs at single-nucleotide resolution. Methylation level at each CpG site was
evaluated by a beta value that represents the normalized probe fluorescence
intensity ratio of methylated bead signal to the sum of both methylated and
unmethylated signals [beta = methylated intensity/(methylated intensity +
unmethylated intensity)]. Resulting beta values vary from 0 (no methylation) to 1
(complete methylation). Raw data preprocessing was carried out, probes with a low
detection rate (p
The differentially methylated candidate genes were validated using pyrosequencing on a cohort of blood samples (17 AD and 17 HC). Pyrosequencing assay was designed with the PyroMark Assay Design software (version 2.0, Qiagen). The primers are listed in Supplementary Table 1. The genomic DNA extracted from peripheral blood was bisulfite-converted. PCR was then performed with the KAPA2G Robust HotStart ReadyMix PCR Kit (KK5603, Kapa Biosystems, Wilmington, MA, USA) in a total volume of 25 µL per reaction, using the ABI Verity PCR System (Thermo Fisher Scientific, Waltham, MA, USA) according to the manufacturer’s instructions. Cycling conditions for PCR were 95 °C for 3 min, 35 cycles of 95 °C for 15 s, 55 °C for 15 s and 72 °C for 15 s followed by final extension at 72 °C for 3 min. The DNA methylation level was then quantified using PyroMark Q48 Advanced CpG Reagents on the Pyromark Q48 Autoprep system (Qiagen). The methylation status of CpG loci was quantified as the percentage of the relative light unit of the C peak (methylated cytosines)/[relative light unit of the C peak + T peak (unmethylated cytosines converted to thymines)].
The microarray data of AD from the Gene Expression Omnibus (GEO;
https://www.ncbi.nlm.nih.gov/geo/) was used to compare the DMR-associated genes
between AD patients and HCs. Raw data from datasets GSE66351 (106 AD and 84
controls), GSE48350 (80 AD and 173 controls), GSE5281 (84 AD and 74 controls),
GSE118553 (167 AD and 100 controls) and GSE28146 (22 AD and 8 controls) were
downloaded for bioinformatics analyses. GSE48350 gives sequencing data from
entorhinal cortex (EC), hippocampus (H), postcentral gyrus (PCG) and superior
frontal gyrus (SFG) of the brains. GSE5281 was from EC, H, medial temporal gyrus,
posterior cingulate (PC), SFG, and primary visual cortex of the brain based on
the GPL570 platform. GSE118553 included tissue samples from the cerebellum (C),
EC, frontal cortex, and temporal cortex, which were obtained from the GPL10558
platform. GSE28146 data was from fresh frozen hippocampal tissue blocks
containing both gray and white matter. The web tool GEO2R was utilized to
identify differentially methylated genes and differentially expressed genes in
the microarray data (p
Gene Ontology (GO) and Kyoto Encyclopedia of Genes and Genomes (KEGG) pathway
enrichment analyses were performed using the EnrichR web platform
(http://amp.pharm.mssm.edu/Enrichr). The criterion for selection of significant
CpG loci in GO terms and KEGG pathways analyses was p
Immune cell infiltration analysis was applied to identify the types and
abundance of immune cells in the given tissues or samples. This analysis provides
valuable insights into the roles of the immune system in AD. The immune cell
infiltration scores for the GSE118553 and GSE48350 datasets were evaluated using
the CIBERSORT algorithm (https://cibersort.stanford.edu/). This algorithm
estimated the proportional analysis of twenty-two immune cell types and the
infiltration levels of immune cells between AD and control groups. Additionally,
it facilitated the correlation analysis of relationships between DMR-annotated
genes and immunocyte subsets. Wilcoxon analysis by SPSS 19.0 software (IBM SPSS,
Armonk, NY, USA) was applied to compare the differences between the two groups.
Tests were considered statistically significant at p
The nonparametric Mann-Whitney test was used to compare the
methylation levels of candidate genes in AD patients and controls. A value of
p
To explore the methylation profiling of AD, an Infinium MethylationEPIC BeadChip (850K) was used for eight participants (4 AD cases, and 4 HCs). Density plot depicted the averaged raw beta-values of all CpG sites (755743 probes) from AD patients and HCs (Fig. 1A). The beta mixture quantile dilation method was applied to standardize the original data. After normalization, the density plots of normalized beta-values were generated for each sample using 850K methylation data, where a red line represents the densities from the AD patient, and a black line for the HC (Fig. 1B). Normalized methylation beta values of all CpG probes in each sample were compared by box plot that reflected the mean value, the degree of dispersion and the maximum and minimum value which showed no significant intragroup diversity between the samples from AD and HCs (Fig. 1C). Principal component analysis (PCA) used normalized methylation beta values. A separation between the AD (red dots) and normal samples (green triangles) can be observed in the first PCA component (Fig. 1D). And 4335 MVPs were examined with two-way (samples and MVPs) hierarchical clustering. The two groups (AD and HC) separated into distinct clusters (Fig. 1E). The MVPs were further analyzed by volcano plot. The generated plot illustrated the MVPs between the HCs and AD patients. The red dots in the upper left corner represent the hypomethylated loci; and those at the upper right denote hypermethylated loci in AD patients when compared to HC (Fig. 1F).
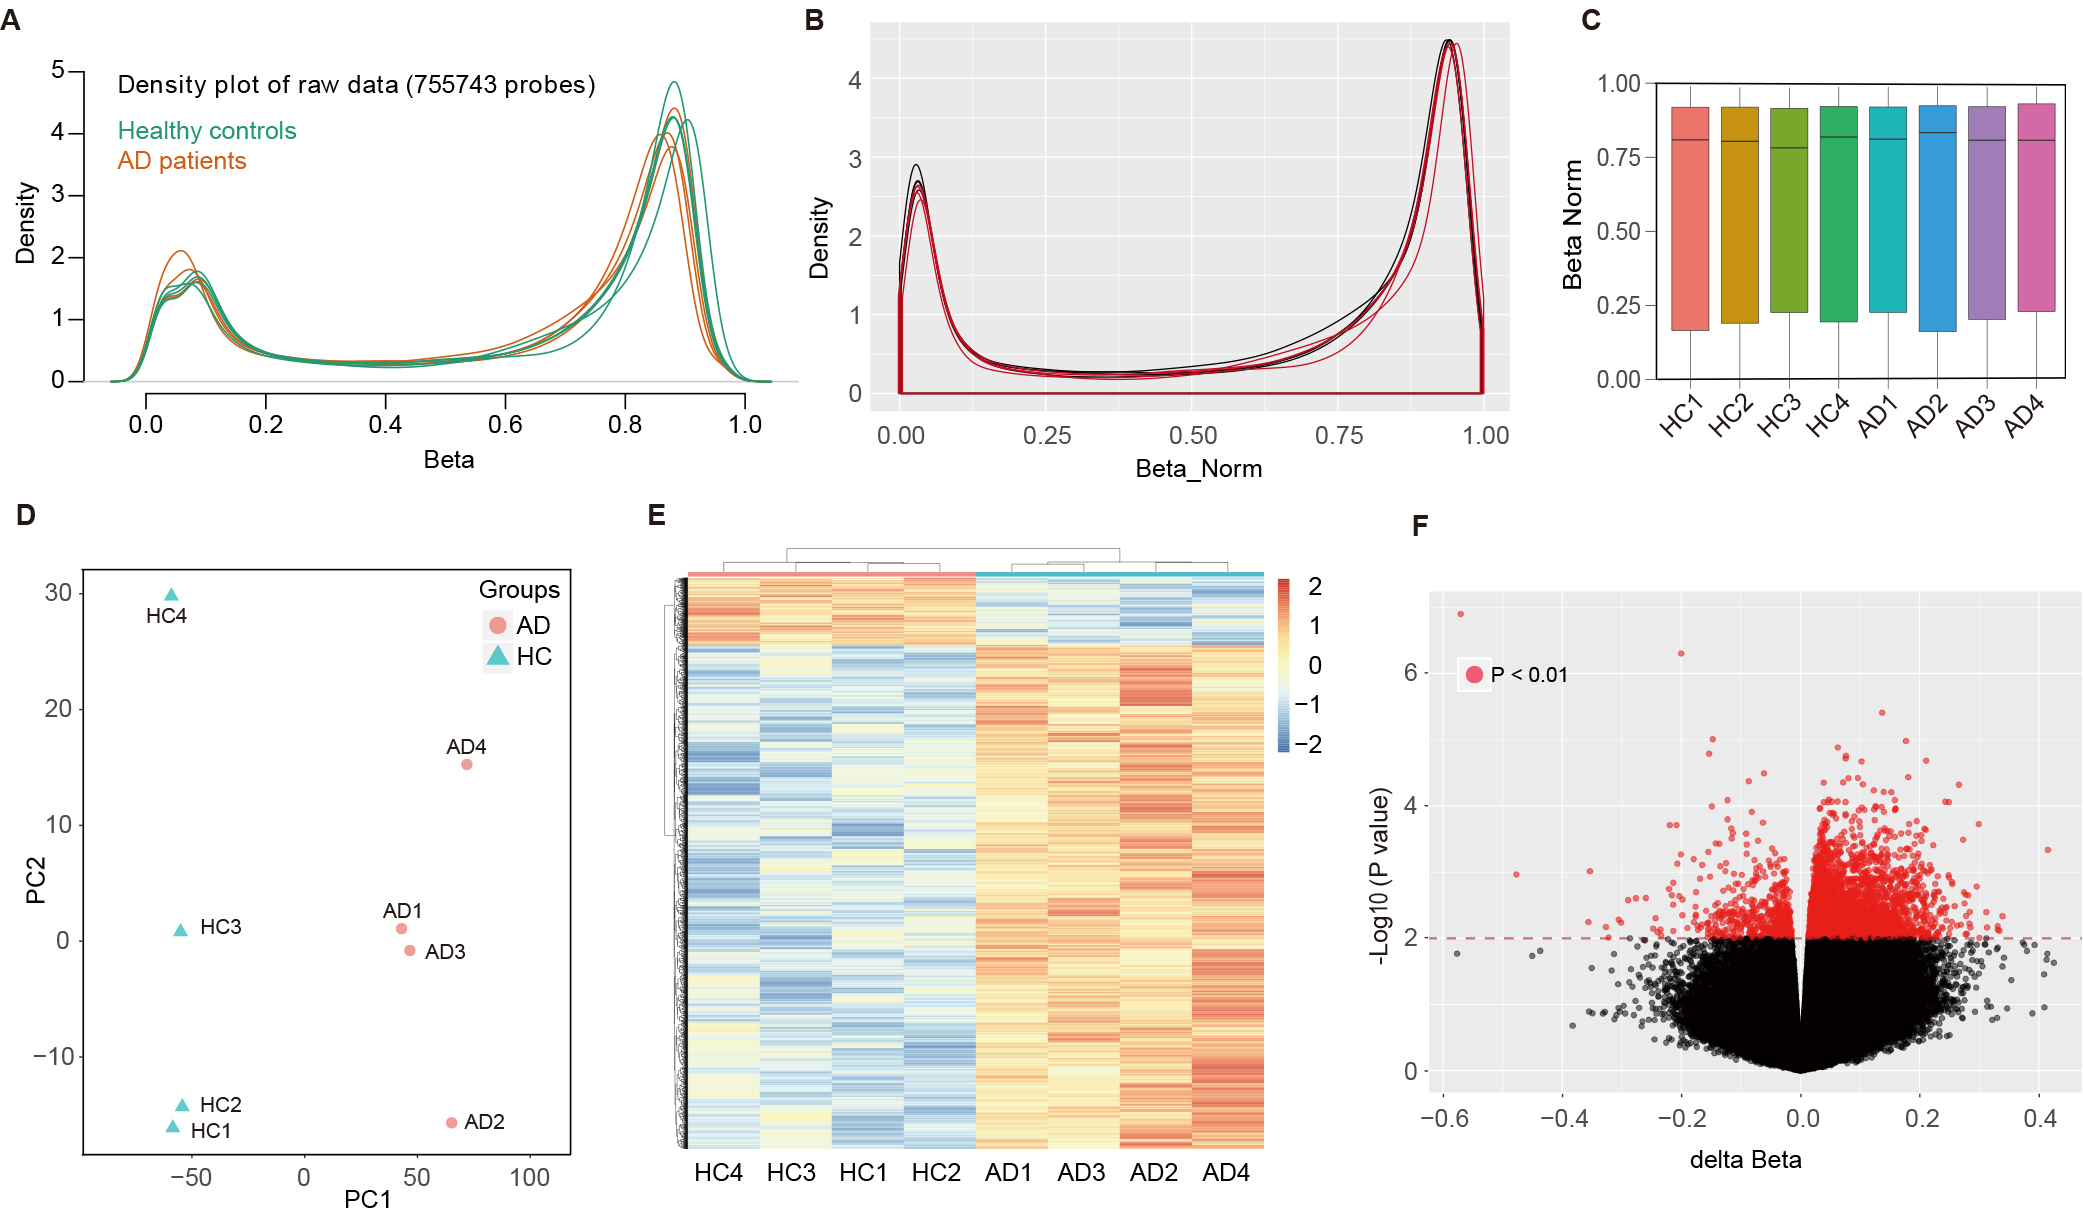 Fig. 1.
Methylation profiling and analysis of AD and control samples using Infinium MethylationEPIC BeadChip. (A) Density plot of raw beta-values from 755,743 CpG sites across eight participants (4 AD cases, 4 controls). (B) Post-normalization density plots show standardized beta-values for each individual, with AD patients (red) and healthy controls (black). (C) Box plot of normalized methylation beta values for each sample. (D) PCA scatter plot of the normalized methylation beta values. (E) Two-way hierarchical clustering of the 4335 MVPs identified, showing distinct clusters formed by AD and control groups. (F) Volcano plot of the MVPs comparing HC and AD patients. The horizontal axis depicts the delta normalized beta values and the vertical axis reflects the –log10 (p-value). AD, Alzheimer’s disease; CpG, cytosine-phosphate-guanine; PCA, principal component analysis; MVPs, methylation variable positions; HC, healthy control.
The array analysis by LIMMA indicated that
4335 MVPs showed DNA methylation differences
(p
Functional annotation analysis (Gene Ontology, GO) was performed for genes that were associated with the identified MVPs (Fig. 2A). GO annotations, including biological process, cellular component, and molecular function categories, were analyzed according to the MVP-annotated genes. The biological process category emphasized the processes of nervous system development, generations of neurons, and neurogenesis. The cellular component category highlighted neuron projection, dendrite, and synaptic membrane. The molecular function category was differentially enriched in calcium ion binding, Ras/Rho guanyl-nucleotide exchange factor activity, phospholipid binding, GTPase/nucleoside-triphosphatase regulator activity, cytoskeletal protein binding and other related functions (Supplementary Table 3). KEGG pathway enrichment of the targeted genes showed that glutamatergic synapse, neuroactive ligand-receptor interaction, retrograde endocannabinoid signaling, γ-Aminobutyric acid (GABA)ergic synapse, circadian entrainment and Hippo signaling pathway were highly connected to AD (Fig. 2B, Supplementary Table 3). The KEGG pathway enrichment bubble plot of MVPs is shown in Fig. 2C.
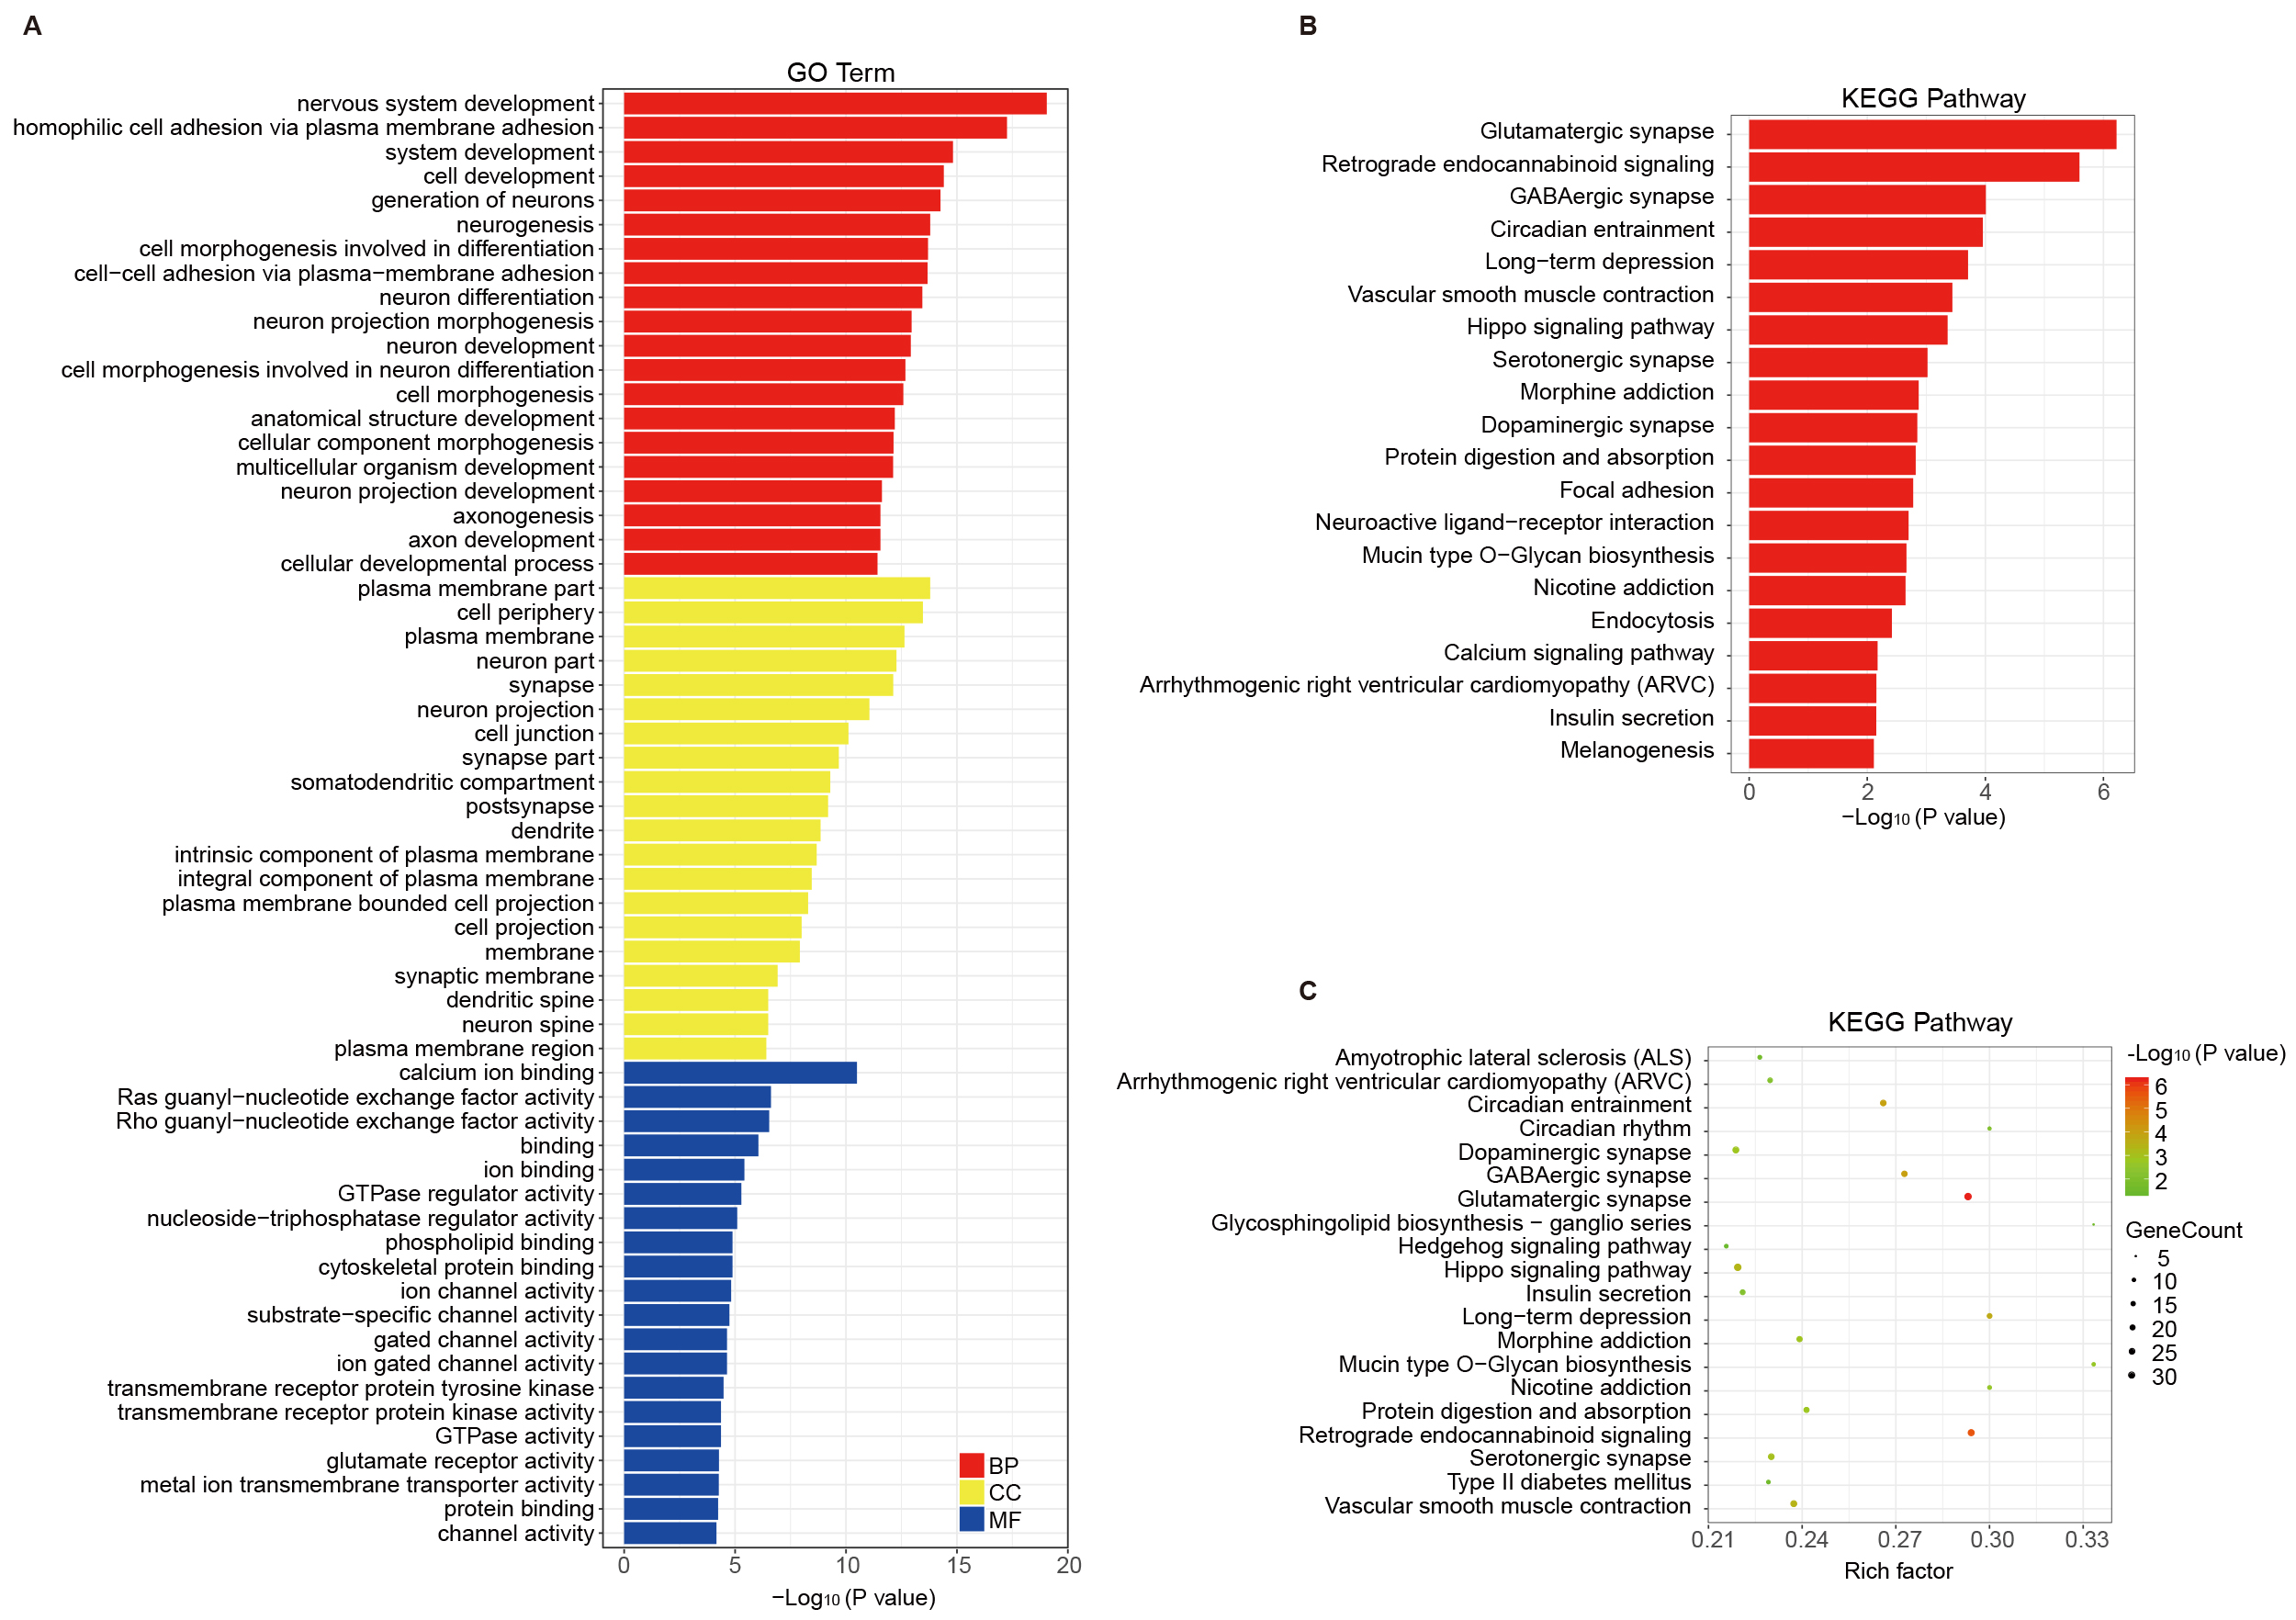 Fig. 2.
Functional annotation and pathway analysis of genes linked to MVPs in AD. (A) GO categories for MVP-associated genes, highlighting roles in nervous system development and synaptic structures. (B,C) KEGG pathway enrichment analysis, showing significant pathways (e.g., glutamatergic synapse and Hippo signaling) relevant to AD pathophysiology. GO, Gene Ontology; KEGG, Kyoto Encyclopedia of Genes and Genomes.
DMRs represent discrete genomic sequences with a distinct CpG methylation status
that distinguishes one phenotype from another reducing the genome-wide scale to
easy-to-understand regions. The identification and utility of genome-wide DMRs
have led to a better understanding of the pathogenesis of various diseases and
have introduced the development of effective assays for clinical diagnosis. DMR
hunting is run by the algorithm “Probe-Lasso”. Probes which are located in the
promoter regions (including TSS200 or/and TSS1500) and the other regions
(including 5′-untranslated region (UTR), 1st Exon, gene body, 3′-UTR and intergenic region) are
stratified by epigenomic CpG-island-relation region (island, shore, shelf, and
open sea). Considering that the probe racing is not uniform in the methylation
tests, Probe Lasso defines dynamic boundaries for each probe depending upon its
genomic feature type (Fig. 3A). Probe Lasso uses dynamic windows to identify a
clear DMR boundary for spanning multiple neighboring MVPs. Probe Lasso identified
68 altered DMRs annotated to 10 genes in this study (see Table 1 and Supplementary Table 4 for detailed annotation of the regions). As shown
in Table 1, the DMRs showing hypermethylation in AD samples annotated to
ANKRD33, MIR487B (miRNA cluster also contains MIR381,
MIR539, MIR381HG and MIR889), SLC43A2,
TMEM100, GDF7, SALL4, KRBOX1-AS1
(KRBOX1), VWA5B2 (MIR1224), CTBP1
(C4orf42) and PCDHB11. The methylation levels of the DMRs from
different annotated genes were estimated by the average
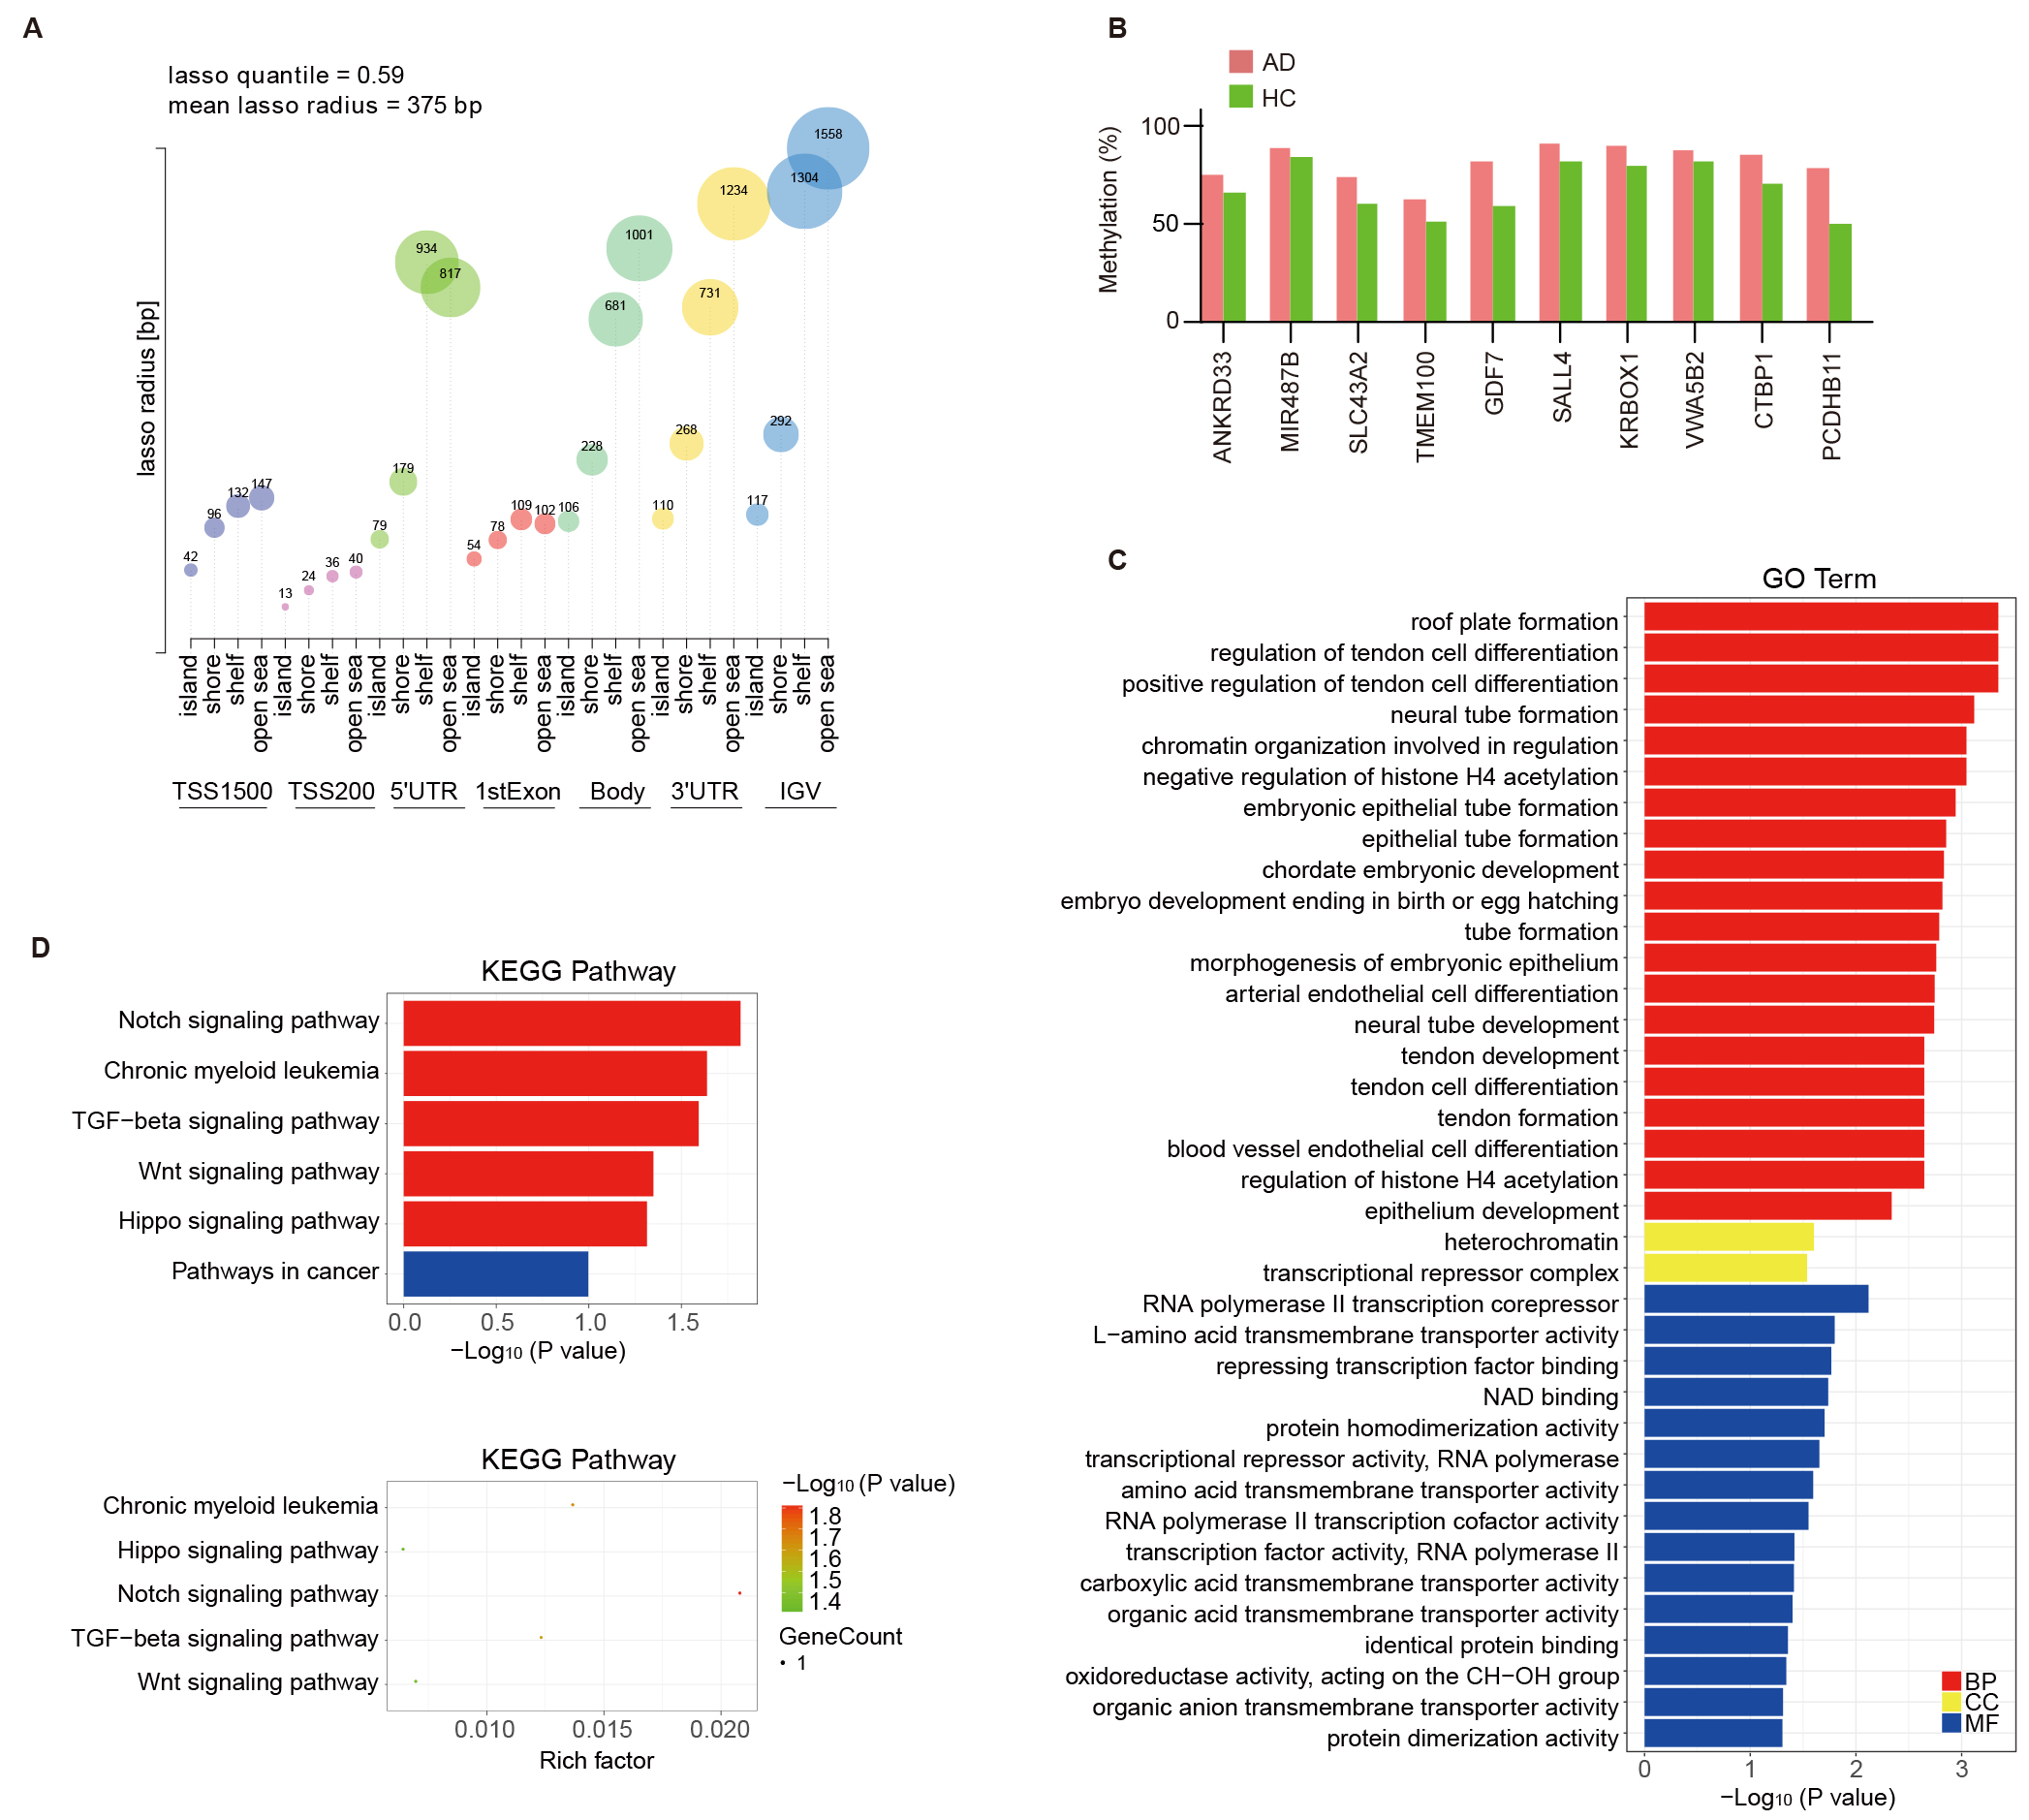 Fig. 3.
Probe Lasso algorithm calling AD-associated DMRs and
functional analysis of DMR-related genes. (A) Visualization of lasso quantile
and radius across various genomic features stratified by CpG island (CGI)
relations, showcasing the methodology for identifying AD-associated DMRs. The
vertical axis represents the lasso radius and the horizontal axis represents the
28 genetic/epigenetic categories (7 genomic features
| Position | Gene feature | Gene symbol | n | p-value | Average methylation % | |
| Control | AD | |||||
| chr12:52281387-52283020 | TSS1500 + TSS200 + 1stExon + 5′UTR | ANKRD33 | 11 | 0.0044 | 0.66 | 0.75 |
| chr14:101511657-101513658 | TSS1500 + Body | MIR487B; MIR381; MIR539; MIR381HG; MIR889 | 14 | 0.0388 | 0.84 | 0.89 |
| chr17:1520033-1522483 | Body | SLC43A2 | 5 | 0.60 | 0.73 | |
| chr17:53799224-53801300 | 5′UTR | TMEM100 | 6 | 0.0086 | 0.51 | 0.62 |
| chr2:20871109-20871692 | Body + 3′UTR + Intergenic | GDF7 | 4 | 0.59 | 0.82 | |
| chr20:50419152-50419343 | TSS200 + TSS1500 | SALL4 | 4 | 0.82 | 0.91 | |
| chr3:42977471-42978069 | Body + Intergenic | KRBOX1-AS1; KRBOX1 | 10 | 0.0004 | 0.79 | 0.89 |
| chr3:183958772-183959261 | Body | VWA5B2; MIR1224 | 7 | 0.81 | 0.88 | |
| chr4:1243964-1244047 | TSS1500 | CTBP1; C4orf42 | 4 | 0.70 | 0.85 | |
| chr5:140579272-140579326 | TSS200 | PCDHB11 | 3 | 0.50 | 0.78 | |
Displayed for each region: chromosomal position (genome build 37), gene feature (TSS, transcription start site; UTR, untranslated region), gene symbol, number of probes in region (n), p-value, and average beta per group.
GO annotation and KEGG pathway enrichment analyses were carried out based on the DMRs annotated genes. The biological process category emphasized the enriched GO terms related to nervous system development, including neural tube formation and development. The cellular component category highlighted heterochromatin and transcriptional repressor complex. The molecular function category was differentially enriched in RNA polymerase II transcription corepressor, repressing transcription factor binding, protein homodimerization activity, and NAD binding (Fig. 3C). KEGG pathway enrichment highlighted the roles for the Notch, TGF-β, Wnt, and Hippo signaling pathways in AD (Fig. 3D). This suggests that DMRs annotated genes in AD may influence the disease’s progression by modulating immune processes.
Based on the enrichment analysis results, the aim was to understand the
alterations in immune cell dynamics within AD. Consequently, immune cell
infiltration in AD was further investigated using CIBERSORT. The immune cell
infiltration analysis (Fig. 4) compares the distribution of immune cells in AD
patients and HCs using data from public GEO datasets. Fig. 4A,B show
bar graphs representing the immune cell distributions in datasets GSE48350 and
GSE118553, respectively, depicting the overall distribution of various immune
cells. Fig. 4C,D provide box plots that further detail these
distributions, offering insights into the variability and median levels of immune
cells across both conditions. In the GSE48350 dataset, monocytes (p
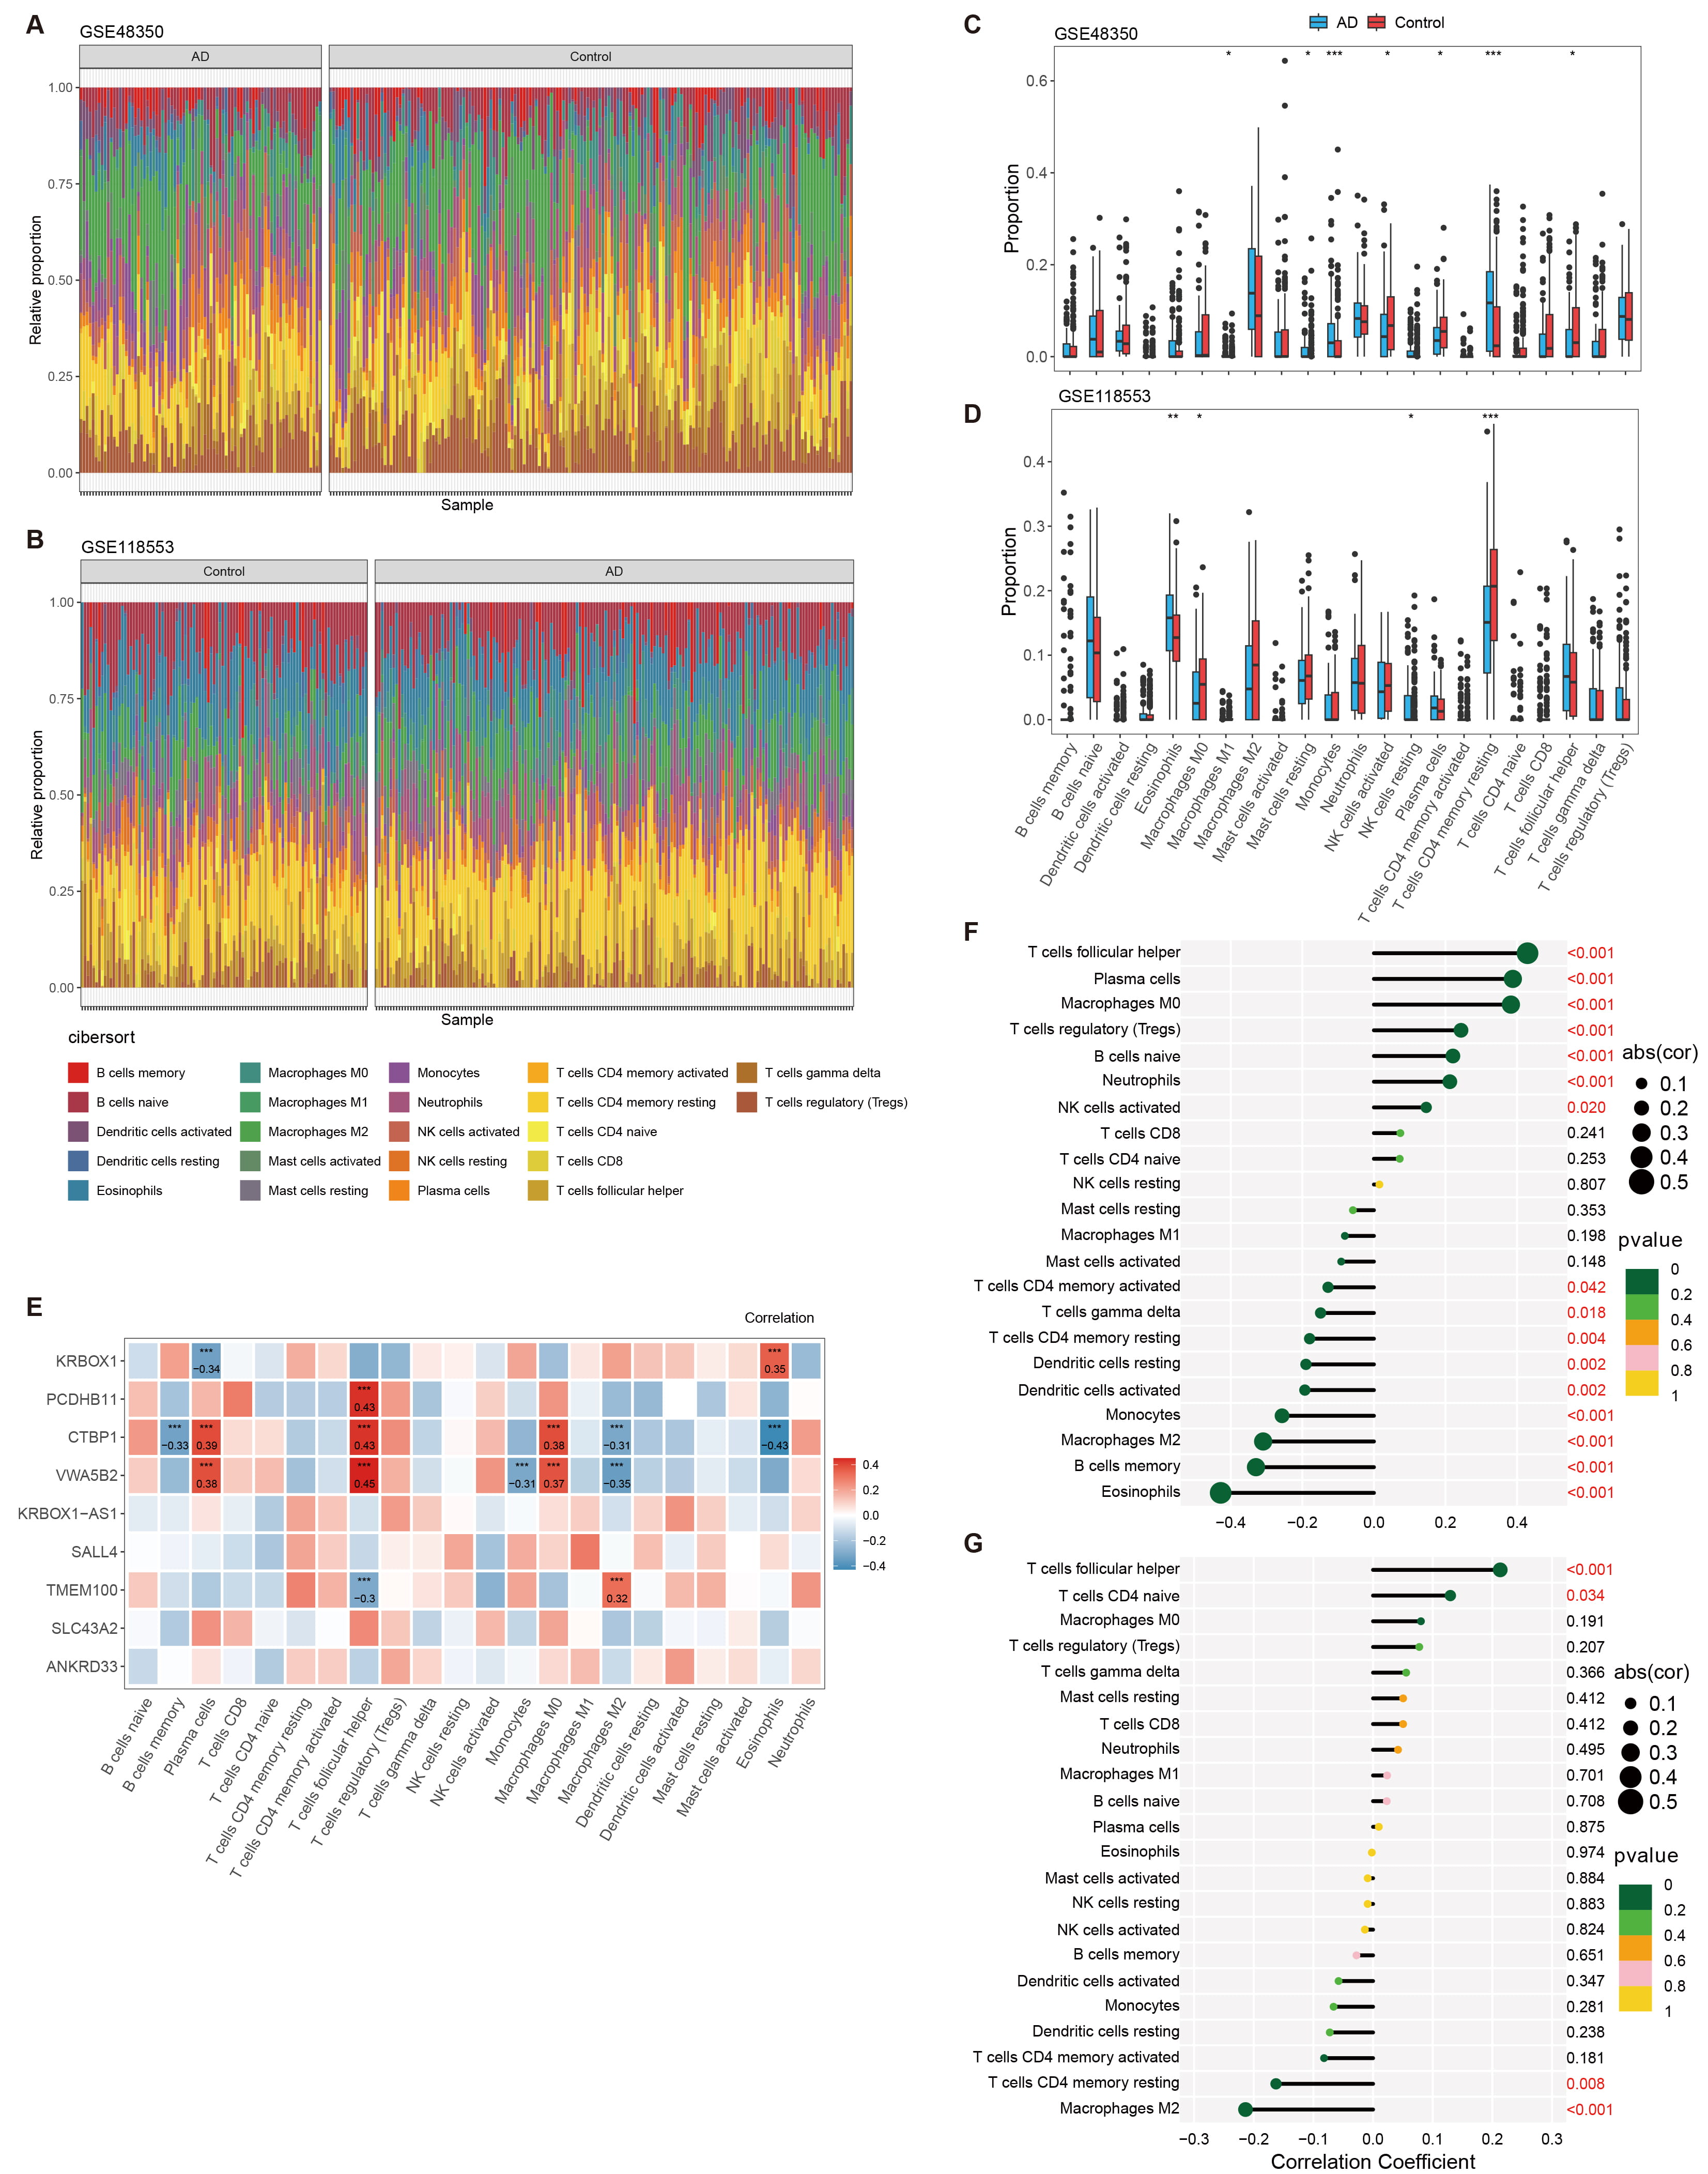 Fig. 4.
Analysis of immune cell infiltration in AD using
CIBERSORT. (A,B) Bar graphs depicting the distribution of immune cells across AD
patients and healthy controls, as analyzed from datasets GSE48350 and GSE118553,
respectively. (C,D) Box plots providing a detailed view of the immune cell
distributions within the GSE48350 and GSE118553 datasets. (E) Heatmap showing the
correlation between the expression of genes associated with DMRs and the
distribution of immune cells. (F,G) Correlation plots illustrating the
relationship between various immune cell types and the pathology of AD, with
significance levels marked. * p
To further verify the hypermethylation of the CTBP1 TSS1500 promoter,
the methylation levels of DMRs covering four CpG sites (cg26479374, cg16399632,
cg25897951, and cg08948841) were validated by pyrosequencing on a larger cohort
of blood samples. Analysis revealed that all four sites had a similar
differential methylation pattern when compared with the 850K array data. CpG
island sites cg26479374, cg25897951, cg08948841 in the CTBP1 promoter
region were significantly hypermethylated in AD when compared with HCs. Although,
the CpG island site cg16399632 showed no significant difference in the
methylation between the two groups, when the methylation percentages of the four
probes in CTBP1 promoter were averaged, the mean methylation levels were
also significantly increased in AD cases relative to HCs (Fig. 5A). The ROC curve
analysis was applied to evaluate the diagnostic performance of
CTBP1 promoter hypermethylation for AD. The area under
curve (AUC) was 0.779 (95% CI: 0.604–0.90, p
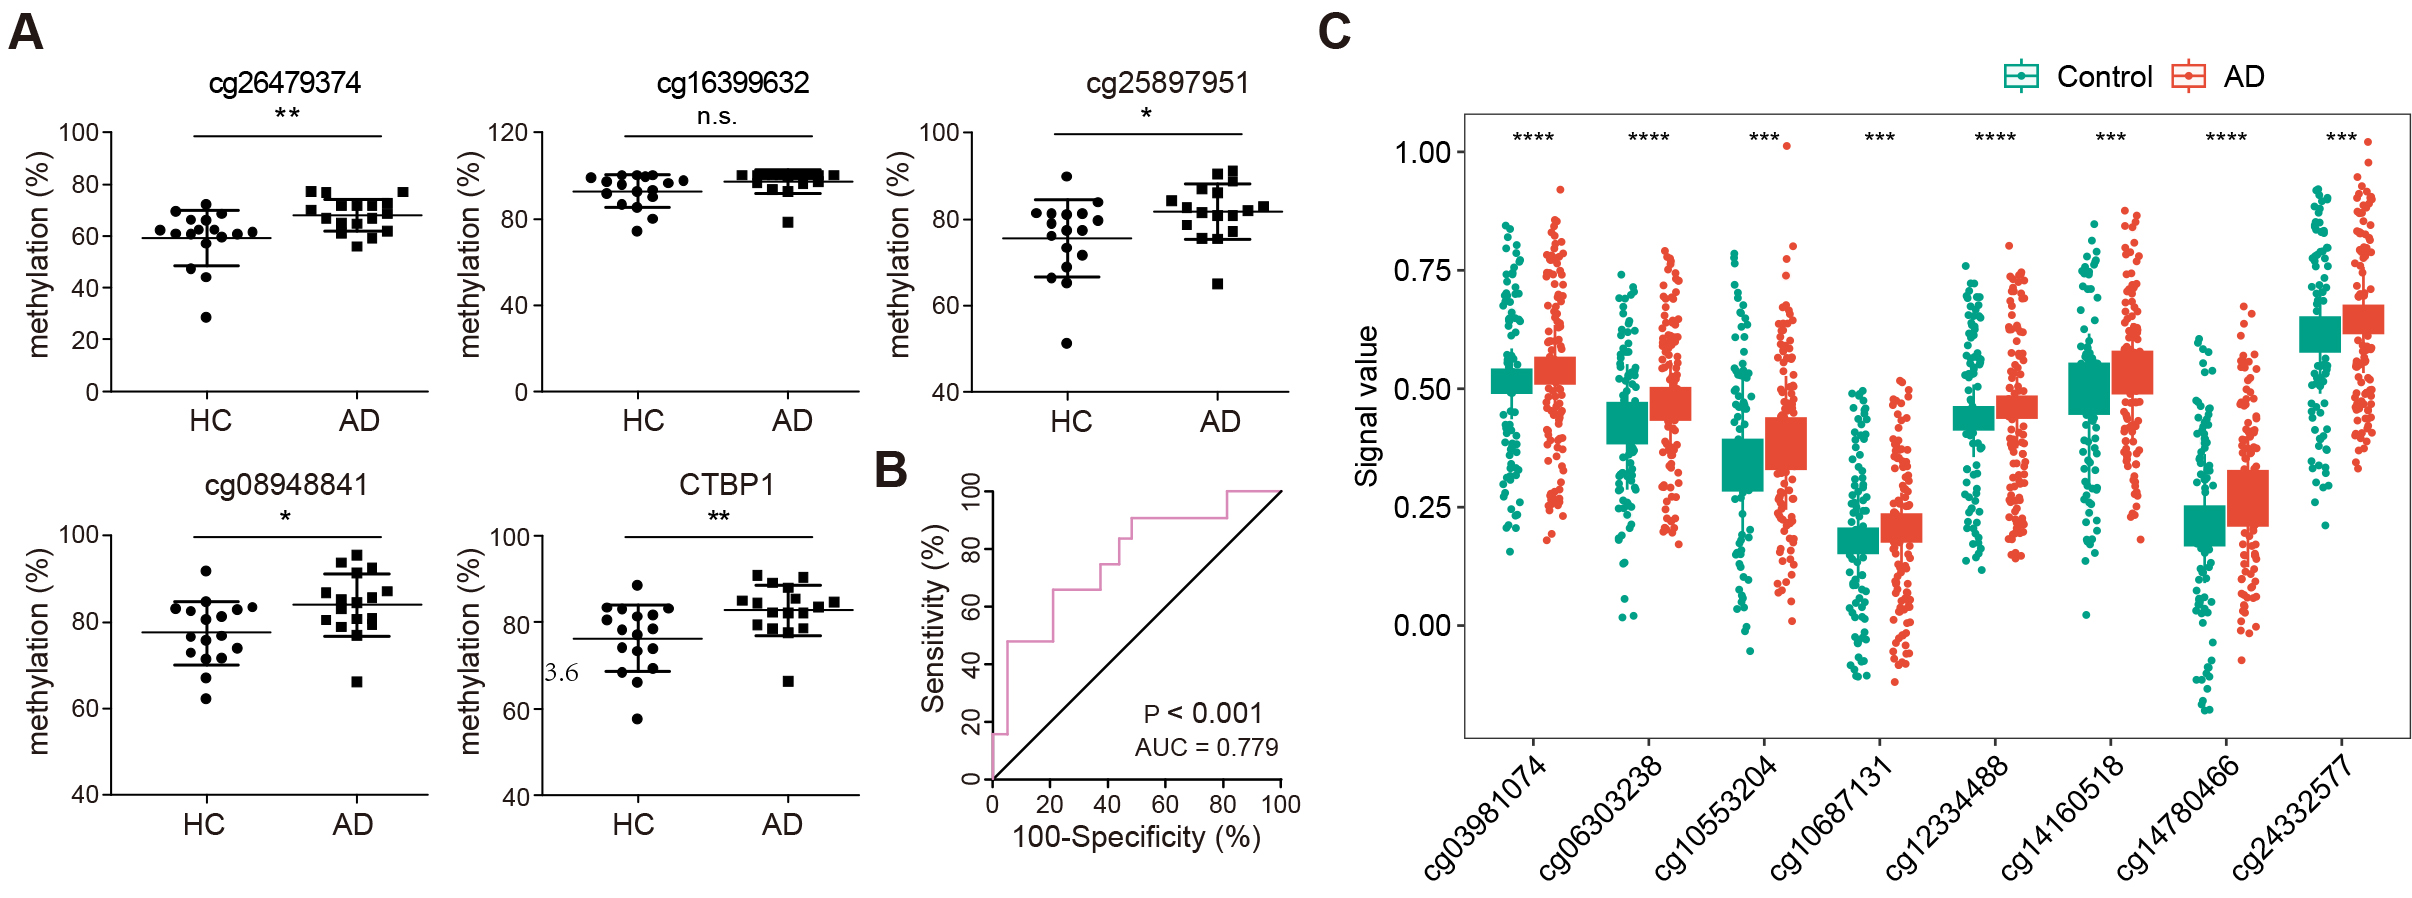 Fig. 5.
Validation and diagnostic analysis of CTBP1
promoter methylation in AD. (A) Scatter plots illustrating methylation levels at
four specific CpG sites within the CTBP1 promoter region (cg26479374,
cg16399632, cg25897951, cg08948841) in AD and HC. n = 34 (HC: 17, AD: 17), n.s.,
no significance (* p
Previously, Song et al. [39] obtained 10054 aberrantly methylated genes via methylation microarray in Gasparoni DNAm data (GSE66351), including 5002 hypermethylated and 5052 hypomethylated loci. To further verify the status of the 68 altered DMRs, eight aberrant methylated loci were found annotated to the genes in the 850K microarray data, including four probes annotated to GDF7 (cg14780466, cg12334488, cg10553204, cg10687131), three probes annotated to SALL4 (cg06303238, cg14160518, cg24332577), and one probe annotated to VWA5B2 (cg03981074; Fig. 5C and Table 2).
| CpG | deltaBeta | CHR | Gene | Feature |
| cg14780466 | –0.060708787 | 2 | GDF7 | Body |
| cg06303238 | –0.041825338 | 20 | SALL4 | 1stExon |
| cg14160518 | –0.050684232 | 20 | SALL4 | 1stExon |
| cg24332577 | –0.029795626 | 20 | SALL4 | TSS1500 |
| cg12334488 | –0.023214562 | 2 | GDF7 | Body |
| cg03981074 | –0.023115439 | 3 | VWA5B2 | Body |
| cg10553204 | –0.046972531 | 2 | GDF7 | 3′UTR |
| cg10687131 | –0.022081727 | 2 | GDF7 | Body |
CHR, chromosome.
Regions of aberrant methylation were initially identified in the DNA in peripheral blood from AD patients and these regions were linked to key genes. To investigate whether the expression of these genes in the brain undergoes changes that might influence the progression of AD, four datasets from the GEO public database were analyzed: GSE5281, GSE118553, GSE48350, and GSE28146. Results indicated that CTBP1 expression changes were the most significant and consistent across these datasets (Fig. 6A–D), However, the expression of CTBP1 varied significantly across these datasets, showing both downregulation (Fig. 6B) and upregulation (Fig. 6C,D) in AD when compared to HCs. This variability in CTBP1 expression was attributable to its distinct expression specificity in different brain regions, such as decreased CTBP1 in the cerebellum (GSE118553) and increased CTBP1 in the hippocampus (GSE48350, GSE28146), implying a regional involvement in AD development
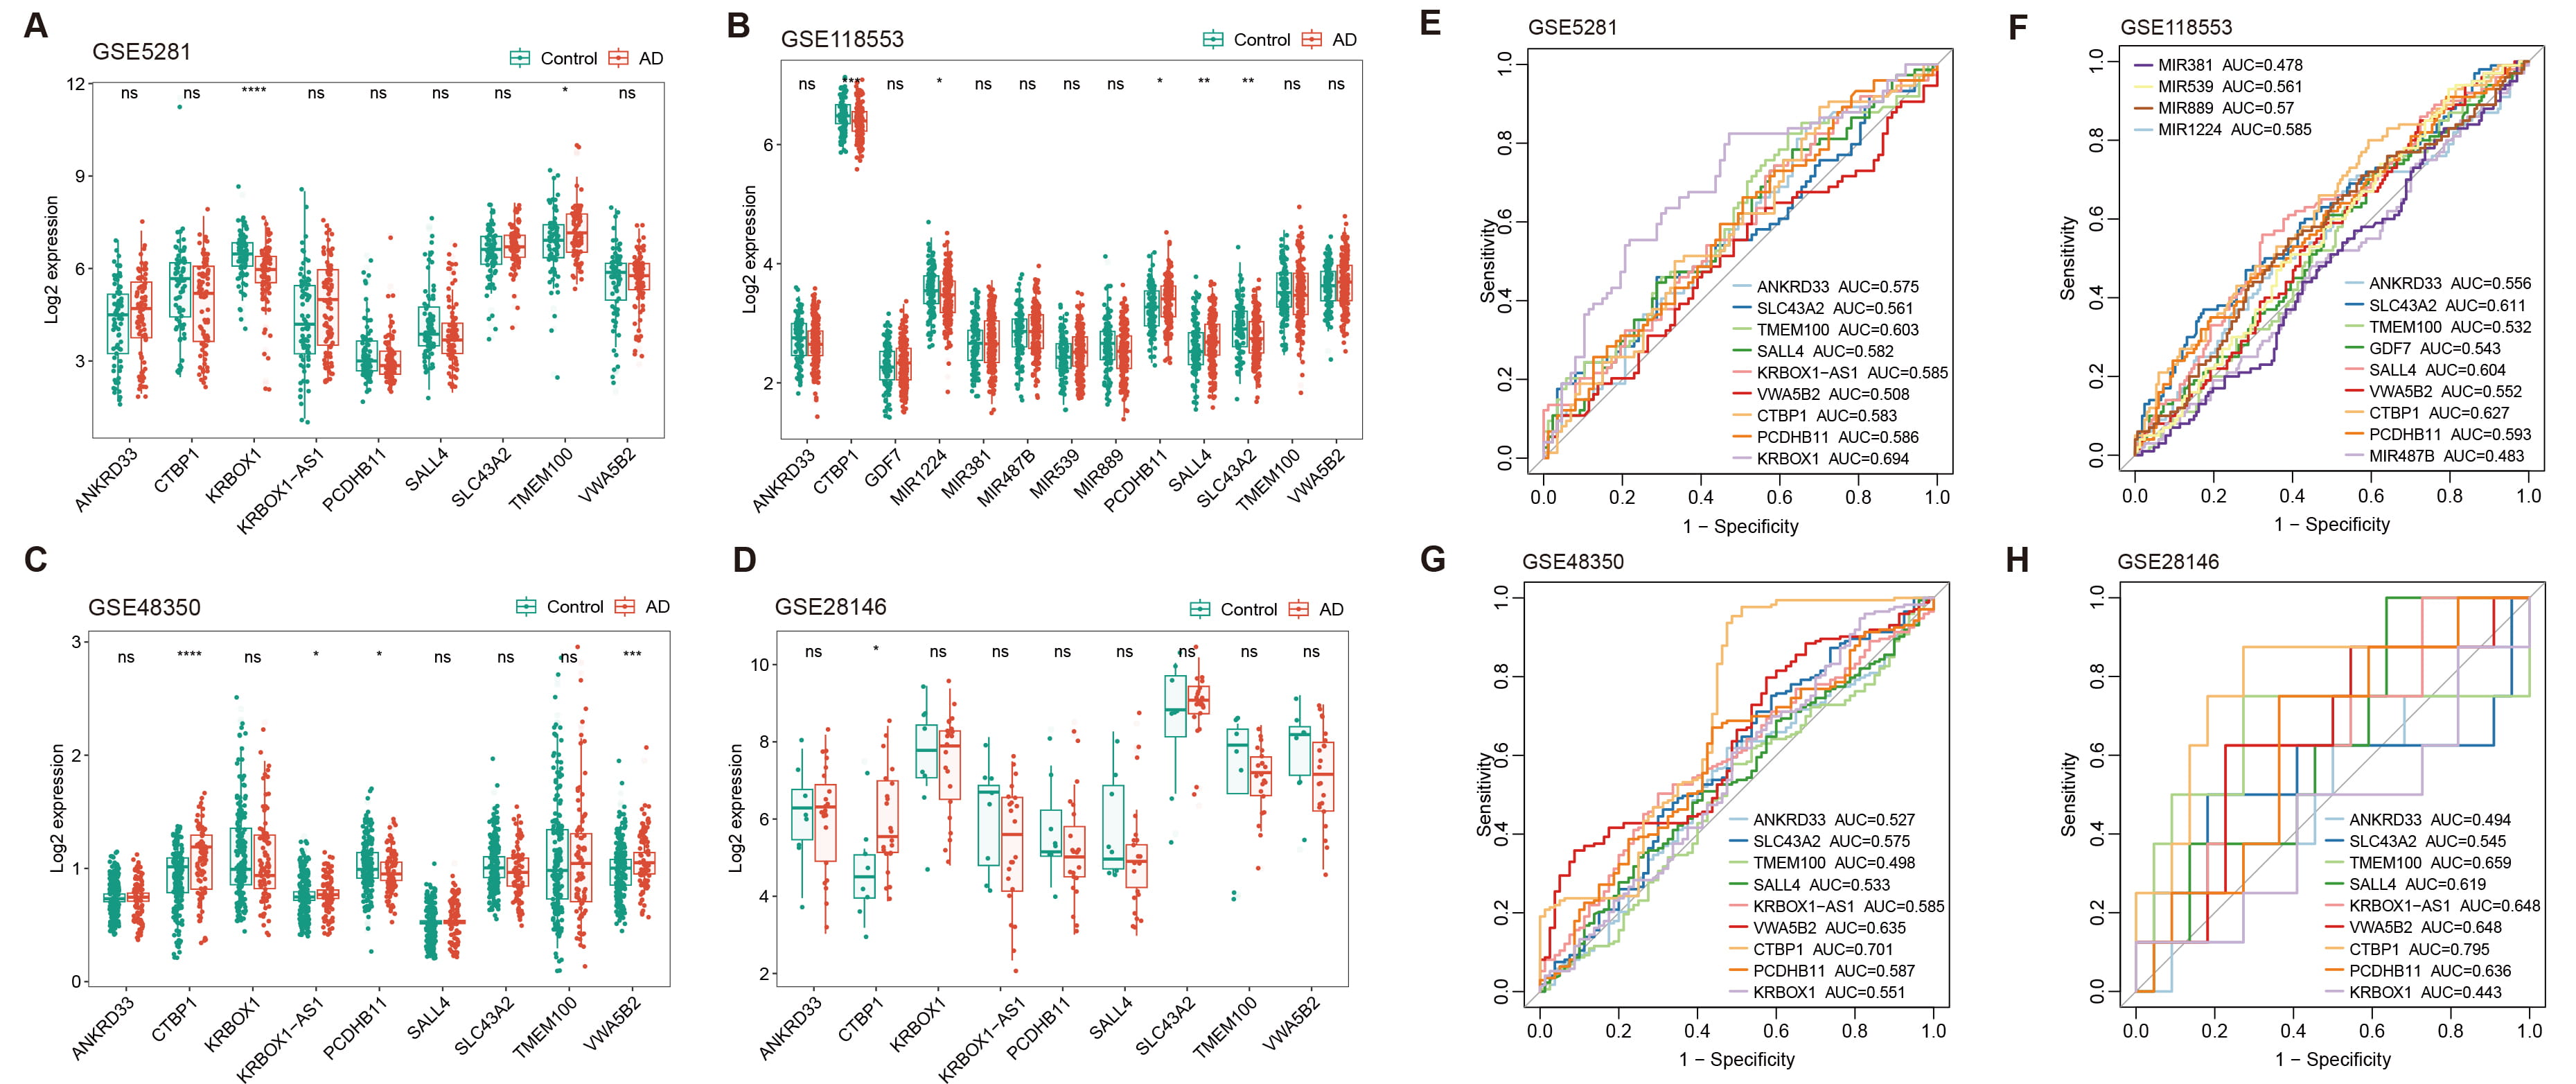 Fig. 6.
Expression analysis and diagnostic evaluation of DMR-annotated
genes across multiple GEO datasets. (A–D) Box plots show the expression levels
of DMR-annotated genes in AD patients versus healthy controls across four
different GEO datasets: GSE5281, GSE118553, GSE48350, and GSE28146. Plots
illustrate varying levels of CTBP1 expression, with notable
downregulation and upregulation in certain datasets, reflecting the gene’s
complex role in AD progression. (E–H) ROC curves evaluating the diagnostic
potential of CTBP1 and other gene expressions as biomarker for AD. Each
panel represents one of the four datasets. Curves show AUC values, highlighting
the elevated and stable diagnostic potential of CTBP1 across different
datasets (* p
Further analysis was conducted using ROC curve analysis to evaluate the potential of these gene expressions as biomarkers for AD in the brain. CTBP1 showed the highest and most stable AUC values (GSE5281, AUC = 0.583; GSE118553, AUC = 0.627; GSE48350, AUC = 0.701; GSE28146, AUC = 0.795), reinforcing the significance of its role in AD progression (Fig. 6E–H). However, when compared to findings presented above, measuring the methylation level of the CTBP1 promoter in peripheral blood is more suitable and convenient for use as a biomarker for AD. Our study emphasizes the relevance of CTBP1 in AD research as a biomarker. Additionally, it highlighted that the expression of CTBP1 likely has a crucial regulatory role in the progression of AD within the brain.
AD is a widespread neurodegenerative disorder that increasingly affects the aging population worldwide [40]. Early diagnosis is particularly important for the management of AD, but the current biomarkers used to detect the disease still have many limitations [9]. In this context, exploring the methylation profile based on peripheral blood has become a promising alternative, as blood samples are easy to collect, convenient for routine monitoring and bring fewer potential risks to the patients. This application is not only non-invasive, but discloses the multiple changes of gene expressions of the disease, facilitating a better understanding of its underlying pathological mechanisms. More and more research have shown that DNA methylation, a key epigenetic mechanism that regulates gene expression without changing the DNA sequence, undergoes significant changes in AD [20, 41]. These changes in the methylation levels have the potential to develop novel biomarkers of AD, and facilitate to obtain valuable information about the onset and progression of the disease before clinical symptoms appear.
Our work depicted the DNA methylation profiles in peripheral blood from AD patients by Illumina Infinium MethylationEPIC BeadChip, covering over 850,000 CpG methylation sites, and discovered MVPs and pathology-linked DMRs. Notably, elevated methylation levels in CTBP1 promoter were significantly correlated with the onset of AD in both test and validation groups. This discovery likely promotes the development of AD diagnostic biomarkers from the methylation alterations. The innovative methodology had already been submitted to and approved by China National Intellectual Property Administration (Application No. CN202311322013.6), potentiating the clinical application of the biomarker.
The study discovered four unique DMRs, predominantly located upstream of the TSS1500 in the CTBP1 promoter, as confirmed by notable rise in methylation at these sites in the AD patients compared to healthy individuals using pyrosequencing. Our primary focus was on the pathology-associated DMRs. Intriguingly, we found a link between these methylation changes in CTBP1and the onset of osteoarthritis [42] and acute pancreatitis [43]. Previous research using animal model demonstrated a low presence of CtBP1 in the hippocampus and brain cortex, yet its overexpression in rat brains correlated with improved cognitive and memory processes [44]. In the hippocampal formation, CtBP1 located in synapses of all the neuropil layers. However, CtBP1 was only detectable in the synaptic region of molecular layer in cerebellum. While, CtBP1 was slightly detected in the cell nuclei throughout the molecular and granular cell layers in cerebellum, suggesting its unique functions performed regionally within the brain [45, 46].
In this study, we found that the CTBP1 gene expressions significantly varied in different gene expression omnibus series (GSE) datasets. This may be attributed to its differential expression patterns in different brain regions [34]. For instance, CTBP1 is highly expressed in the cerebellum and participated in the development and function of Purkinje cells [34]. These cells are predominantly involved in motor coordination and balance, interacting intricately with climbing and mossy fibers, while projecting to the deep cerebellar nuclei [47]. As previous demonstrated, CtBP1 plays important roles in hippocampal and cortical neurons [44], influencing neuronal differentiation and synaptic plasticity [46]. Intriguingly, in differentiated primary cultured hippocampal neurons CtBP1 is partially localized at presynaptic terminals, where it is involved in synaptic network formation and maintenance [48]. Disruptions in CtBP1’s function may contribute to the pathogenesis of neurodegenerative diseases, including AD. The inconsistency in CTBP1 expression levels across the datasets likely reflects the specific brain regions sampled in the datasets. This gives a clue to understanding the complex gene expression data and emphasizes the necessity to consider the impact of location when investigating the molecular mechanisms of AD.
Our research applied enrichment studies to evaluate correlations between DMR-related genes and immune systems, and examined immune cell infiltration data from GSE118553 and GSE48350 public datasets. Our data uncovered distinct disparities in the distribution of immune cells between AD and healthy controls, suggesting the engagement of CD4 memory resting monocytes, T cells, NK cells activated, plasma cells and T cell follicular helper in AD. These data provide hints of correlation between DMR-linked genes and immune cell patterns in Alzheimer’s pathology.
Our results suggest that the crucial gene methylation patterns are related to the pathogenesis of AD and aberrant CTBP1 methylation levels represent promising circulating biomarkers in the diagnosis of AD onset. However, its exact diagnostic performance needs further clinical verification.
Our study depicted the methylation profiles in circulating cell-free DNA from AD, disclosing the pathology-related MVPs and DMRs. Crucially, four specific hypermethylated CpG sites in the TSS1500 promoter of the CTBP1 gene distinguished AD patients from controls, representing a potential non-invasive biomarker in the peripheral blood.
The data supporting the findings of this study are available within the article and/or its supplementary material.
ZD, KZ, and HG conceived and designed the research study. ZD, KZ, HG, WY and XZ conducted the experiments. ZD and KZ analyzed the data. ZD wrote the manuscript. KZ revised the manuscript. All authors contributed to editorial changes in the manuscript. All authors read and approved the final manuscript. All authors have participated sufficiently in the work and agreed to be accountable for all aspects of the work.
The research studies were reviewed and approved by the Ethics Committee of Shanghai Second People’s Hospital (SC2023-KY-27). The research project for Hongjun Gu was approved in 2019 and actually completed by the end of 2022 due to the impact of the epidemic from 2020 (NO. 201905). The written informed consents were obtained from the participants or their legally acceptable representatives. The research experiments in the study complied with the World Medical Association Declaration of Helsinki regarding ethical conduct of research involving human subjects.
Not applicable.
This study was funded by the National Natural Science Foundation of China (Grant number 82141131), Natural Science Foundation of Shanghai Municipal Science and Technology Commission (Grant number 19ZR1439300 and 22ZR1436300), the project from Shanghai Jinshan District Health Commission (JSKJ-KTMS-2019-13), and the Professional Training Program from Shanghai Huangpu District Health Commission (2023XD04).
The authors declare no conflict of interest.
Supplementary material associated with this article can be found, in the online version, at https://doi.org/10.31083/JIN36527.
Publisher’s Note: IMR Press stays neutral with regard to jurisdictional claims in published maps and institutional affiliations.