
- Academic Editor
†These authors contributed equally.
Cognitive dysfunction in cerebral small vessel disease (CSVD) patients is associated with white matter hyperintensity (WMH), which demonstrates frequency-dependent correlations with brain functional activities. However, the neural mechanisms underlying the relationship between these structural and functional abnormalities and cognitive impairment remain unclear.
We recruited 34 CSVD patients (mean age 63.74 ± 4.85 years, 19 males) and 45 age-matched healthy controls (mean age 63.69 ± 6.15 years, 15 males). All participants underwent magnetic resonance imaging (MRI) scanning and comprehensive cognitive assessments, including three behavioral tasks and a cognitive questionnaire battery. Regional brain activity and network topological properties were separately compared between the two groups for each of the three frequency bands (slow-4, slow-5, and typical band) using two-sample t-tests. Simple and multiple mediation analyses were performed to examine the relationships among WMH, functional brain measures, and global cognition.
CSVD patients exhibited frequency-specific alterations in regional activity and reduced global functional organization in the slow-4 band. Frequency-dependent functional measures in the slow-4 band significantly mediated the relationship between deep WMH and cognitive performance.
Our findings demonstrate the frequency-specific mediating role of abnormal brain functions in the pathophysiological pathway linking WMHs to cognitive impairment. This study provides new insight into the pathological mechanisms underlying WMH-related cognitive dysfunction.
ChiCTR2100043346, 02 November 2021, https://www.chictr.org.cn/showproj.html?proj=52285.
White matter hyperintensity (WMH), a neuroimaging hallmark of cerebral small vessel disease (CSVD) with presumed vascular origin [1, 2, 3], represents a significant contributor to vascular dementia (45% of cases) and ischemic strokes (20% of cases) [4]. Detectable through fluid-attenuated inversion recovery (FLAIR) sequences on magnetic resonance imaging (MRI), WMHs are associated with increased risks of stroke, dementia, and mortality in the aging population [5, 6]. Extensive evidence demonstrates a strong correlation between WMH burden and global cognitive decline [7], with accelerated WMH progression representing an early pathological marker in the pre-symptomatic phase of CSVD that precedes cognitive impairment [8, 9]. Longitudinal studies have consistently shown that extensive confluent WMHs predict dementia onset and functional disability [10]. Investigating early WMH progression therefore provides critical opportunities for preventing CSVD-related brain damage and improving cognitive, physical, neurological outcomes [11]. However, the precise mechanisms underling WMH-associated cognitive impairment remain poorly understood, necessitating further investigation into their role in CSVD-related cognitive decline.
The insidious onset and heterogeneous clinical manifestations of CSVD pose significant challenges in establishing direct correlations between WMHs and cognitive dysfunction, particularly during early stages when clinical symptoms are minimal or absent [4, 12]. Emerging evidence suggests that in asymptomatic CSVD, WMHs may indirectly influence cognitive decline through alterations in functional neural representations [4]. This phenomenon may be explained by the regulatory effects of regional neural activity on the relationship between WMH burden/spatial distribution and cognitive impairment. Supporting this hypothesis, resting-state functional magnetic resonance imaging (fMRI) study has onstrated that the amplitude of low-frequency fluctuations (ALFF) in the right middle frontal gyrus mediated the relationship between WMHs and immediate recall memory [13].
From a network topology property perspective, CSVD is increasingly recognized as a whole-brain disease characterized by focal lesions that disrupt distant brain structures and impair structural/functional network connectivity [2, 14]. This recognition has led to the hypothesis that network topological properties may mediate the effects of WMHs on global cognition. For example, network efficiency mediated the relationship between deep WMHs (dWMH) and processing speed [15], while the participation coefficient in the right inferior frontal gyrus mediated the association between periventricular WMHs (pWMH) and visuospatial abilities in CSVD patients with mild cognitive impairment [16]. Furthermore, global efficiency in the frontal and parietal regions has been shown to mediate the connection between pWMH and information processing speed [17]. Morphological connectivity between the left insula and right thalamus/orbitofrontal gyrus mediated WMH-related cognitive impairment [18, 19], as do functional connectivity (FC) within the frontoparietal network and between the salience network and medial frontal cortex [20]. Notably, the relationship between WMHs and global cognition, as measured by the Mini-Mental State Examination and Montreal cognitive assessment (MoCA), is mediated by FC between the left superior parietal lobule and the right amygdala, as well as between the left precuneus and right basal ganglia [21].
In summary, CSVD patients demonstrate distinct abnormalities in both network topology and regional brain activity, which collectively represent a unique mechanism through which WMHs influence global cognition. These findings suggest a complex interplay between network topological properties and regional neural activities in mediating cognitive impairment. Investigating the relationships among WMHs, cognitive dysfunction, global network properties, and regional neural activities therefore offers valuable insights in the organization of brain function under pathological conditions.
Resting-state functional brain activity is typically analyzed within the frequency range of 0.01–0.08 Hz (typical band), which can be further divided into two distinct sub-bands: slow-5 (0.01–0.027 Hz) and slow-4 (0.027–0.073 Hz) [22]. Emerging evidence suggests that CSVD patients exhibit frequency-specific alterations in functional brain activity. Specifically, in the slow-5 band, patients with subcortical ischemic vascular disease (SIVD) showed positive correlations between the ALFF in the right angular gyrus and activities of daily living scale [23]. The CSVD patients showed lower ALFF than the healthy controls in both the typical and slow-4 bands, although these frequency-specific ALFF abnormalities do not correlate with neuropsychological measures, such as digit span test and verbal fluent test [24]. These findings suggest that WMHs may exert frequency-dependent effects on both regional and global functional activities, warranting further investigation into how frequency-specific neural representations mediate WMH-related brain dysfunction and cognitive impairment.
In conclusion, to advance our understanding of cognitive impairment and elucidate the pathophysiological mechanisms underlying cognitive dysfunction in CSVD, this study examines the relationship between CSVD markers (particularly WMHs) and global cognition, with specific attention to the potential mediating roles of frequency-specific regional brain activity and network topological properties. Our investigation addresses three primary objectives: first, to identify potential alterations in regional brain activity and network topological properties across different frequency bands in CSVD patients; second, to determine whether these alterations are associated with cognitive impairment; and third, to investigate whether frequency-specific regional brain activity and network topological properties mediate the effects of WMHs on cognitive function.
This study recruited 81 right-handed elderly
participants from Beijing Tiantan Hospital in 2023, comprising 35 patients with
CSVD and 46 age-matched healthy controls (HC). The inclusion criteria for CSVD
patients were: (1) age 45 to 75 years; (2) fazekas score
Exclusion criteria for all participants included: (1) acute ischemic stroke with
high signal intensity on diffusion-weighted imaging (DWI) and lesions diameter
Due to incomplete resting-state fMRI data and the presence of old hemorrhagic lesions, one participant from the CSVD group and one from the HC group were excluded. Consequently, the final sample consisted of 34 CSVD patients and 45 HC individuals (see Table 1 for demographic details). This cross-sectional study was approved by the Ethics Committee of Beijing Tiantan Hospital, Capital Medical University (approval number: KY 2019-140-02; approval date: January 3, 2020). The study was carried out in accordance with the guidelines of the Declaration of Helsinki and written informed consent was obtained from all participants.
| Characteristic | CSVD (n = 34) | HC (n = 45) | t/ |
p value | Cohen’s d | ||
| Demographic characteristics | |||||||
| Age (years) | 63.74 |
63.69 |
0.036 | 0.971 | 0.008 | ||
| Gender (male/female) | 19/15 | 15/30 | 4.017* | 0.045a | - | ||
| Education level | 3.207 | 0.344b | - | ||||
| College or higher | 5 | 12 | |||||
| Senior high school graduate | 18 | 25 | |||||
| Junior high school graduate | 9 | 8 | |||||
| Primary school graduate | 1 | 0 | |||||
| Risk factors (yes/no) | |||||||
| Smoke | 18/16 | 3/42 | 21.250*** | - | |||
| Drink | 16/18 | 9/36 | 6.556* | 0.011a | - | ||
| Hypertension | 15/19 | 3/42 | 15.440*** | - | |||
| Hyperlipemia | 4/30 | 5/40 | 0 | 1.000c | - | ||
| Hyperglycemia | 7/27 | 1/44 | 5.302* | 0.021c | - | ||
| CSVD markers | |||||||
| tWMH Fazekas score | 3.35 |
1.67 |
9.422*** | 2.141 | |||
| pWMH | 1.53 |
0.82 |
6.614*** | 1.503 | |||
| dWMH | 1.82 |
0.84 |
8.708*** | 1.979 | |||
| Atrophy | 0.91 |
0.58 |
2.290* | 0.025 | 0.520 | ||
| CMB | 3.29 |
0.11 |
2.588* | 0.012 | 0.588 | ||
| tPVS | 2.83 |
2.53 |
1.287 | 0.202 | 0.303 | ||
| bPVS | 1.53 |
1.16 |
2.370* | 0.020 | 0.559 | ||
| cPVS | 1.30 |
1.38 |
–0.477 | 0.635 | –0.113 | ||
| Lacune | 0.59 |
0 | - | - | - | ||
| WMH volume | |||||||
| tWMH volume (cm3) | 8.49 |
1.48 |
5.476*** | 1.255 | |||
| pWMH volume (cm3) | 5.91 |
1.28 |
5.839*** | 1.338 | |||
| dWMH volume (cm3) | 2.50 |
0.19 |
4.419*** | 1.013 | |||
| Brain volume, mean % (SD) | |||||||
| GMV, mean % (SD) | 0.43 |
0.44 |
–1.072 | 0.287 | –0.244 | ||
| Framewise displacement | 0.10 |
0.07 |
3.230** | 0.002 | 0.734 | ||
| Global cognition (tasks) | |||||||
| Working memory task (updating) | –0.71 |
0.54 |
–3.593*** | –0.816 | |||
| Color-word Stroop task (inhibition) | –0.60 |
0.45 |
–2.897** | 0.005 | –0.658 | ||
| Number-arrow switching task (shifting) | –0.55 |
0.41 |
–2.576* | 0.012 | –0.585 | ||
| Global cognition (questionnaires) | |||||||
| MMSE | 28.53 |
29.27 |
–1.933 | 0.058 | –0.529 | ||
| MoCA | 25.21 |
26.82 |
–2.619* | 0.011 | –0.716 | ||
| AVLT-immediate memory | 5.43 |
6.22 |
–2.021* | 0.048 | –0.564 | ||
| AVLT-short delay memory | 5.83 |
6.62 |
–1.169 | 0.247 | –0.326 | ||
| AVLT-long delay memory | 5.39 |
6.31 |
–1.322 | 0.191 | –0.369 | ||
| AVLT-cue memory | 5.11 |
6.00 |
–1.195 | 0.237 | –0.333 | ||
| AVLT-recognition | 20.61 |
21.96 |
–2.308* | 0.024 | –0.644 | ||
| DST-B | 5.72 |
6.13 |
–0.629 | 0.532 | –0.175 | ||
| DST-F | 10.67 |
11.11 |
–1.339 | 0.186 | –0.373 | ||
| STT-A | 78.05 |
70.22 |
1.175 | 0.245 | 0.328 | ||
| STT-B | 211.10 |
168.15 |
2.527* | 0.014 | 0.705 | ||
| HAMA | 0.79 |
1.04 |
–0.555 | 0.581 | –0.152 | ||
| HAMD | 1.68 |
2.13 |
–0.421 | 0.675 | –0.115 | ||
ap value was obtained by the Peasons’s
* p
Abbreviations: AVLT, auditory verbal learning test; bPVS, basal ganglia perivascular spaces; CMB, cerebral microbleed; cPVS, centrum semiovale PVS; CSVD, cerebral small vessel disease; DST-B & F, digit span task-backward & forward; GMV, gray matter volume; HAMA, Hamilton anxiety scale; HAMD, Hamilton depression scale; HC, health control; MMSE, mini-mental state examination; MoCA, Montreal cognitive assessment; STT-A & B, alternative shape trail-making test- form A & B; tPVS, total PVS; WMH, white matter hyperintensity.
All participants underwent comprehensive cognitive assessments, including standardized neuropsychological tests and behavioral tasks. The neuropsychological battery comprised the mini-mental state examination (MMSE), Montreal cognitive assessment (MoCA), auditory verbal learning test (AVLT), digit span task (DST), alternative shape trail-making test (STT), Hamilton anxiety scale (HAMA), and Hamilton depression scale (HAMD). Participants subsequently completed three computerized cognitive tasks in a fixed order: a working memory task (526 s), a color-word Stroop task (466 s), and a number-arrow category switching task (466 s) (Fig. 1A). The tasks were presented in a block design and implemented using E-Prime 3.0 (Psychology Software Tools, Pittsburgh, PA, USA). Each of the three tasks consisted of one run containing six blocks. Prior to formal testing, participants completed a practice session requiring a minimum accuracy rate of 85% within one hour [25]. The images used in the practice session were not appear in the formal experiment to prevent learning effects.
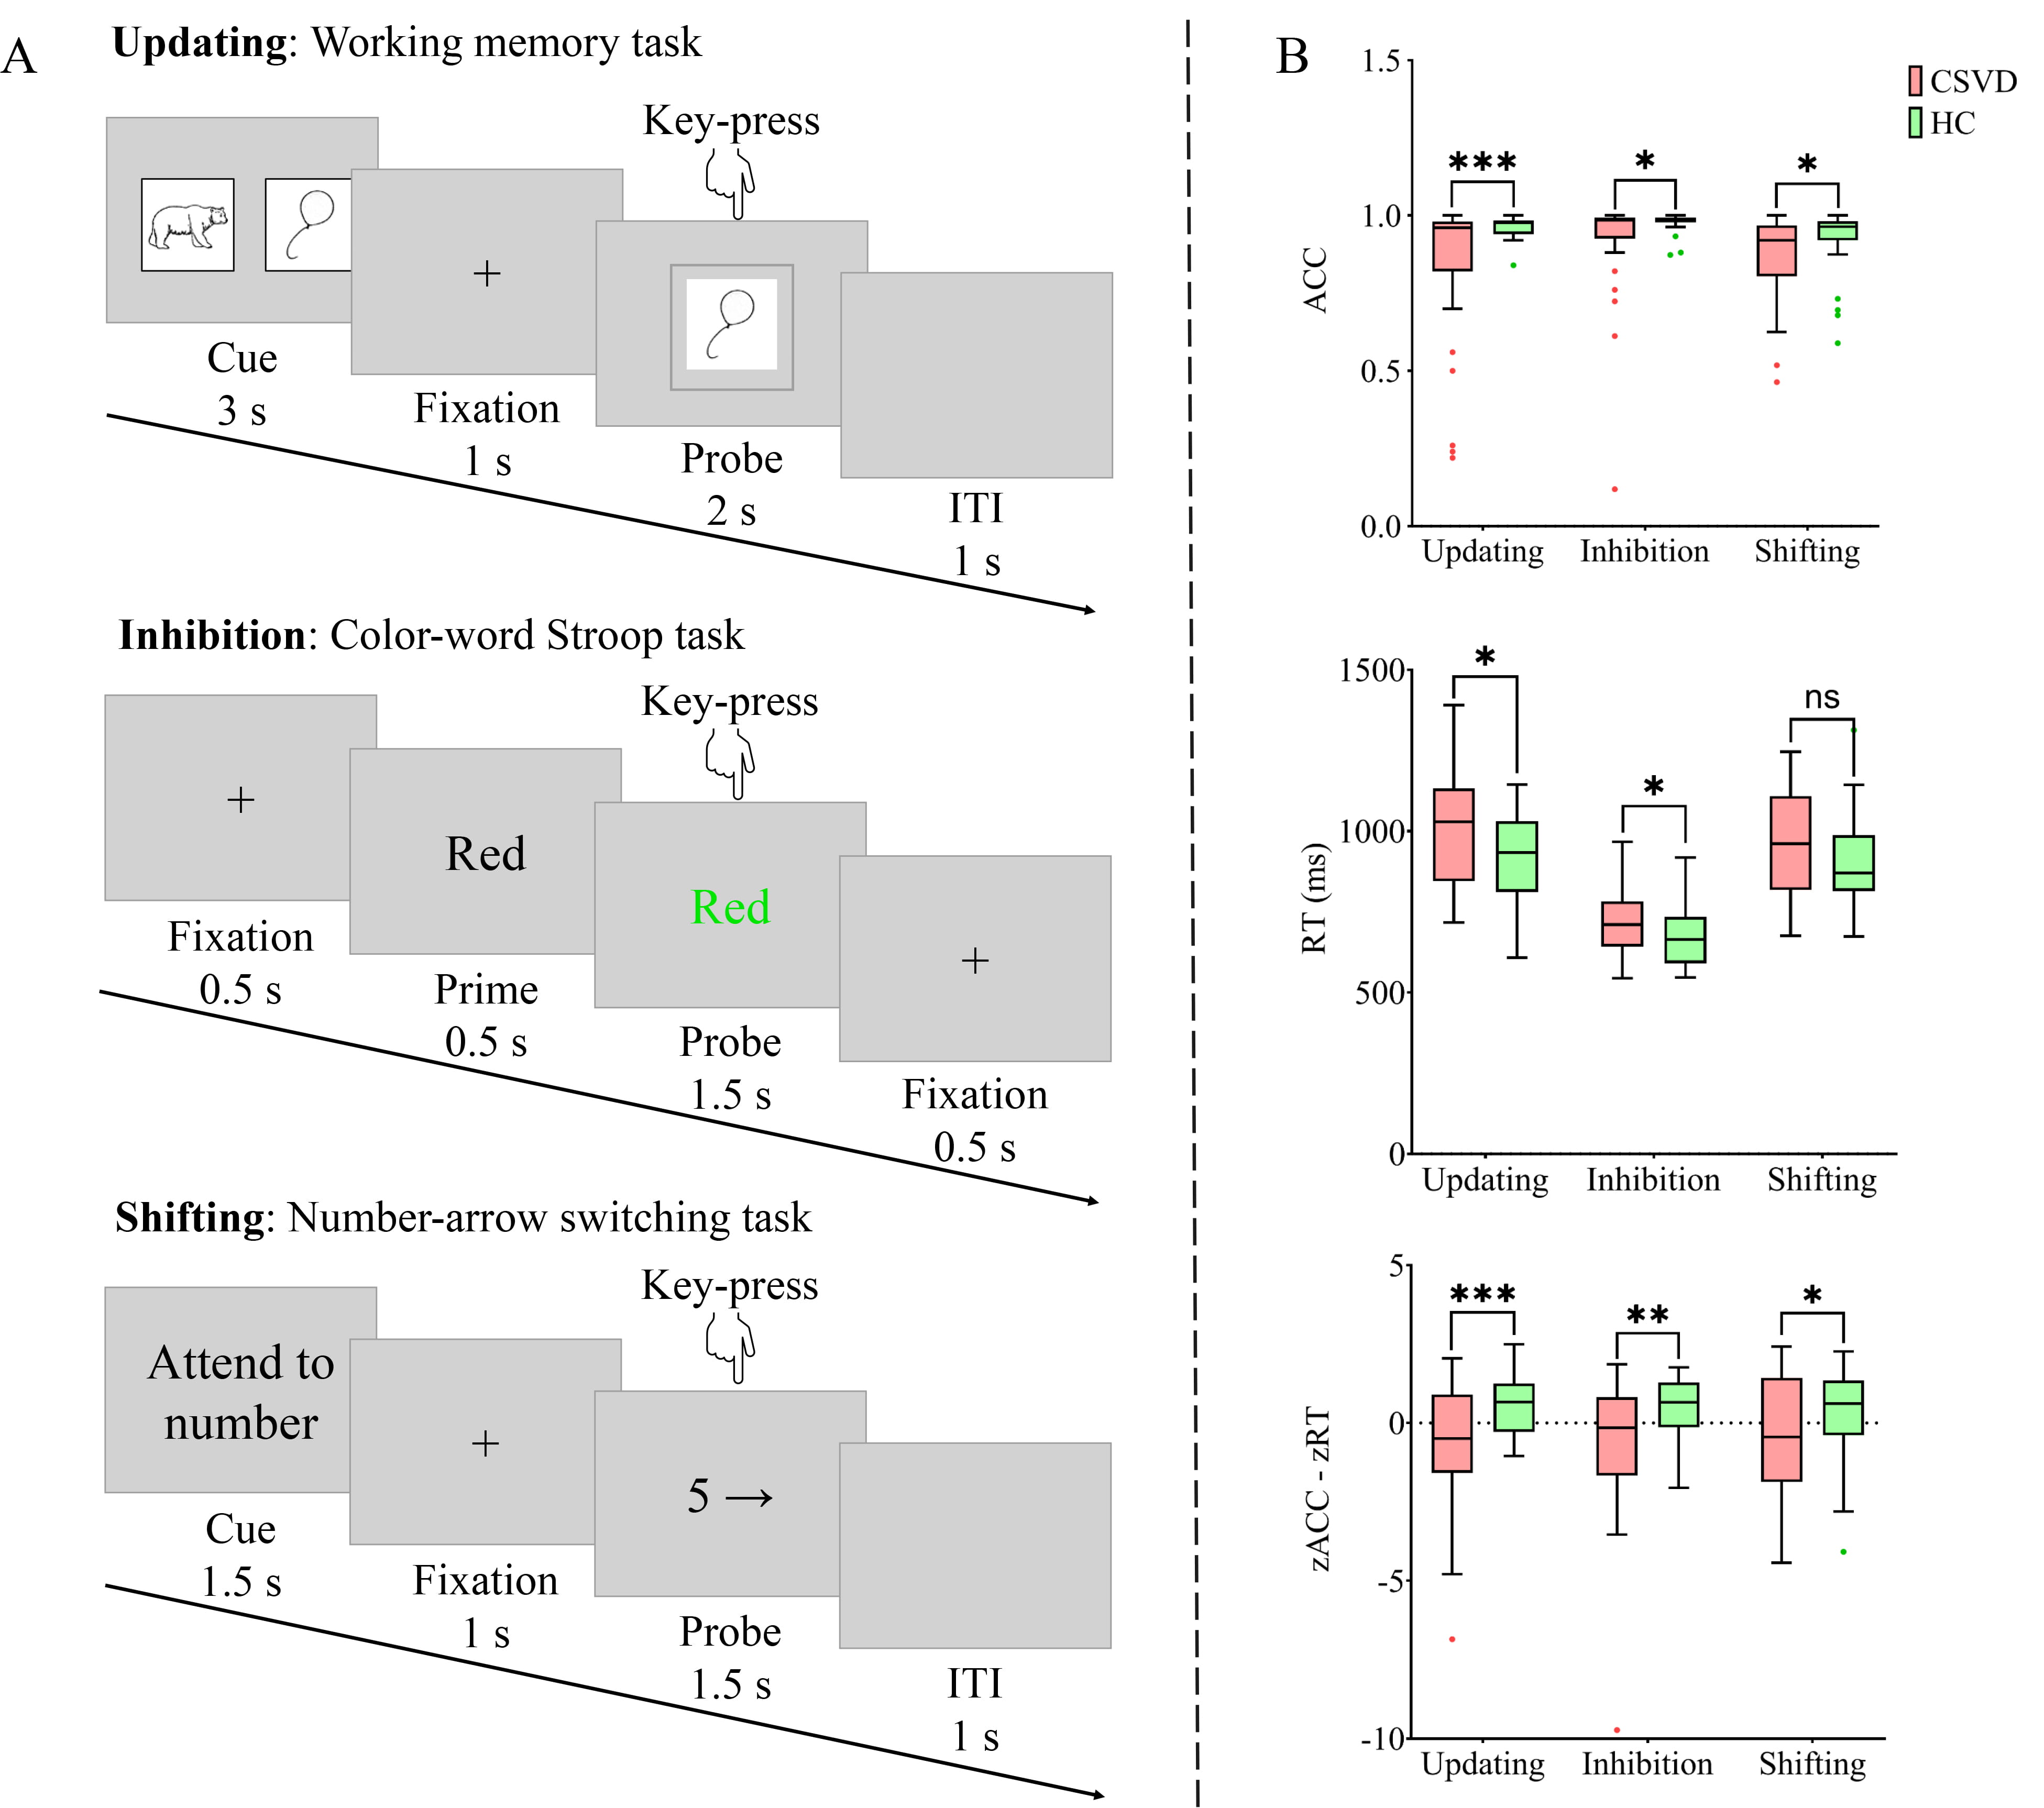 Fig. 1.
Overview and performance of the three behavioral
tasks. (A) The flow of a single trial for each task. (B) Performance of each
sub-components. Updating was measured by the working memory task, inhibition by
the color-word Stroop task, and shifting by the number-arrow switching task. ACC,
accuracy; CSVD, cerebral small vessel disease; HC, health control; ITI,
intertrial interval; ns, not significant; RT, reaction time. * p
The tasks were designed to assess three core cognitive domains: updating, inhibition, and shifting [26, 27, 28, 29]. Specifically, the working memory task evaluate working memory capacity, providing measures of short-term memory retention and cognitive control. The color-word Stroop task assessed cognitive flexibility and inhibitory control through measures of interference processing and conflict resolution. The number-arrow switching task measured cognitive flexibility and attentional shifting by evaluating performance during transitions between different information types.
In the working memory task, each trial lasted 7 seconds. Each trial began with the presentation of one or two cue images at the center of the screen for 3 seconds, followed by a 1-second fixation cross. A probe image with a gray border then appeared for 2 seconds, followed by a 1-second intertrial interval (blank screen). Each block contained 10 trials. Participants were instructed to indicate whether the probe image matched the cue image by pressing “1” for match or “2” for a non-match. Stimuli consisted of standardized black-and-white line drawings depicting everyday objects or common animals.
In the color-word Stroop task, each 2.5-seconds trial began with a 0.5-seconds fixation cross, followed by a 0.5-seconds black prime word and a 1.5-seconds probe (colored Chinese character). Each block included 24 trials. Participants were required to identify the probe’s color while ignoring its semantic meaning, responding with “1” for red/yellow or “2” for green/blue.
In the number-arrow switching task, each trial lasted 5 seconds. Each trial began with a 1.5-seconds cue (“Attend to Number” or “Attend to Arrow”) at the center of the screen, followed by a 1-second fixation cross. A probe stimulus (number from 1 to 9 and arrow pointing in one of six directions) then appeared for 1.5-seconds, followed by a 1-second intertrial interval. Participants were required to memorize the cue stimulus quickly and respond rapidly to the probe stimulus. When the cue stimulus was “Attend on number”, participants focused on the number within the probe stimulus, pressing “1” for odd number and “2” for even number. When the cue stimulus was “Attend on Arrow”, participants concentrated on the arrow within the probe stimulus, pressing “1” for arrow pointing left and “2” for arrow pointing right.
Behavioral performance was assessed using mean accuracy (ACC) and mean reaction time (RT) for each of the three tasks. A composite efficiency index was calculated by combining standardized ACC and RT scores using the formula: efficiency z-score = (zACC – zRT) [30]. Higher efficiency z-scores indicate better task performance, reflecting both higher accuracy and faster responses.
MRI data were acquired using a 3T scanner (Siemens MAGNETOM Prisma, Erlangen,
Germany) at the Tiantan neuroimaging center, with a total acquisition time of 23
minutes 8 seconds. Participants wore noise-reducing earplugs and foam padding to
minimize head motion and scanner noise. They were instructed to remain awake with
eyes open, avoid systematic thinking, and maintain head position throughout the
scan. Structural images were obtained using a sagittal 3D magnetization-prepared
rapid gradient-echo (MPRAGE) T1-weighed sequence with the following parameters:
repetition time (TR) = 2300 ms, echo time (TE) = 2.26 ms, inversion time (TI) =
900 ms, flip angle = 8∘, matrix size = 256
To ensure objective assessment, experienced neurologists evaluated CSVD markers on MRI scans. The evaluation included: WMH from FLAIR images, brain atrophy from T1-weighted images (T1-WI) using a five-point scale (0–4), cerebral microbleeds (CMB) from susceptibility-weighted imaging (SWI), perivascular space (PVS) from T2-weighted images (T2-WI), and lacunes from T2-WI and FLAIR images. WMH severity was rated using the Fazekas scale (0–6 points), with separate scores for periventricular WMH (pWMH, 0–3 points) and deep WMH (dWMH, 0–3 points) [31]. PVS were categorized as total PVS (tPVS), centrum semiovale PVS (cPVS), and basal ganglia PVS (bPVS), while lacunes and CMB were quantified using standardized counting methods.
T1-WI images were preprocessing using the Computational Anatomy Toolbox (CAT12,
https://www.nitrc.org/projects/cat) implemented in Statistical Parametric Mapping
(SPM12, https://www.fil.ion.ucl.ac.uk/spm) on MATLAB R2021b (MathWorks, Natick,
MA, USA). The preprocessing pipeline included: (1) Tissue segmentation using the
“Segment” tool in CAT12, which performed skull-stripping segmented 3D T1 images
into white matter (WM), grey matter (GM) and cerebrospinal fluid (CSF) using an
adaptive maximum a posterior (AMAP) technique that dose not require priori tissue
probabilities information [32]. (2) Spatial registration of segmented images to
the standard montreal neurological institute (MNI) template. (3) Modulation to account for volume changes during
spatial normalization [33]. Total intracranial volume (TIV) and regional volumes
(WM, GM, CSF) were extracted using the ‘get TIV’ tool in CAT12. Gray matter
volume percentage (GMV%) was calculated as (grey matter volume/TIV)
Resting-state fMRI data were preprocessed using SPM12
(http://www.fil.ion.ucl.ac.uk/spm) and the Data Processing & Analysis for Brain
Imaging toolbox (DPABI 5.1, http://rfmri.org/dpabi) [34]. The preprocessing steps
included: (1) removal of the first 10 volumes to account for magnetic field
stabilization; (2) slice timing correction and realignment for head motion
correction, with motion parameters quantified using framewise displacement (FD)
[35]; (3) segmentation T1-WI into GM, WM, and CSF using the New Segment
and DARTEL tool in DPABI, followed by co-registration of T1-weighted and
functional data; (4) nuisance regression, including (A) motion parameters
(Friston-24 model) [36], (B) polynomial trend, (C) WM and CSF signals; (5)
scrubbing of time points with FD
Preprocessed time series data were transformed to the frequency domain using
Fast Fourier Transform (FFT). The ALFF was calculated as the averaged square root
of the power spectrum for each frequency band at the voxel level [39]. Individual
zALFF maps were converted to z-scores for standardization and used in subsequent
analyses. Whole-brain FC was computed for each frequency band using unsmoothed
preprocessed data. Network nodes were defined according to the 246-region Human
Brainnetome Atlas (BNA246; http://atlas.brainnetome.org/) and Pearson correlation
coefficients between all nodes paires were calculated to generate 246
Demographic and clinical characteristics were compared using independent
sample t-tests for continuous variables (age, mean FD, GMV, CSVD
markers, task performance) and chi-square tests for categorical variables
(gender, education, cerebrovascular risk factors). All analyses were performed in
SPSS 26.0 (IBM SPSS statistics, Chicago, IL, USA) with a significance threshold
of p
Regional brain activity (ALFF) and network topology (AUC of sigma [aSigma],
Eglob, Eloc, hierarchy) across three frequency bands were compared between groups
using independent sample t-tests, controlling for age, gender, and mean
FD. Multiple comparisons were corrected using voxel-wise permutation test (5000
iterations) with threshold-free cluster enhancement (TFCE), applying a cluster
threshold of z
Variables showing significant between-group differences were selected for
Pearson correlation analyses across all participants and within the CSVD group.
These included: (1) CSVD markers: tWMH, pWMH, dWMH, brain atrophy, CMB, and bPVS;
(2) functional indicators: ALFF (typical, slow-4, slow-5 bands), aSigma (typical
and slow-4 bands), and hierarchy AUC (slow-4 band); (3) executive function (EF) task performance.
Pairwise correlations were computed among these three variable sets. To maximize
variable inclusion in subsequent structural equation modeling, the significance
threshold was set at p
Our preliminary analyses revealed complex interrelationships among CSVD markers (tWMH, pWMH, or dWMH), functional indicators (ALFF in typical, slow-4, or slow-5 band), and global cognition (updating, inhibition, and shifting), as well as among CSVD markers (dWMH), functional indicators (aSigma in the slow-4 band), and global cognition (updating, inhibition, and shifting) among all participants. To reduce model complexity while capturing these relationships, we defined two latent variables: ALFF (observed variable: zALFF values in specific regions) and general cognition (GC) (observed variable: efficiency z-scores of the three tasks). The Fazekas score of tWMH/dWMH/pWMH and aSigma in the slow-4 band were defined as observed variables.
We formulated three primary hypotheses with complementary alternatives: (1) ALFF
mediates the WMH-GC relationship (alternative: WMH mediates ALFF-GC); (2) aSigma
in the slow-4 band mediates the dWMH-GC relationship (alternative: dWMH mediates
Based on hypotheses 1–2, we constructed four simple mediation models (Supplementary Fig. 1): (1) ALFF (typical/slow-4/slow-5 band) mediating tWMH/pWMH/dWMH-GC (Supplementary Fig. 1A); (2) WMH (tWMH/pWMH/dWMH) mediating ALFF (typical/slow-4/slow-5 band)-GC (Supplementary Fig. 1B); (3) aSigma (slow-4) mediating dWMH-GC (Supplementary Fig. 1C); (4) dWMH mediating aSigma (slow-4)-GC (Supplementary Fig. 1D).
Based on the results of the simple mediation models and hypothesis 3, we developed four multiple mediation models (Supplementary Fig. 2): (1) aSigma and ALFF (slow-4) as chain mediators between dWMH and GC (Supplementary Fig. 2A); (2) ALFF and aSigma (slow-4) as chain mediators between dWMH and GC (Supplementary Fig. 2B); (3) dWMH and ALFF (slow-4) as chain mediators between aSigma and GC (Supplementary Fig. 2C); (4) ALFF and aSigma (slow-4) as parallel mediators between dWMH and GC (Supplementary Fig. 2D). All models controlled for age, gender, and mean FD.
Model fitting and evaluation were performed using AMOS version 26.0.0 (IBM Corporation, Armonk, NY, USA).
Goodness-of-fit was assessed using established criteria: chi-square degrees of
freedom ratio (
Table 1 summarizes the demographic, clinical and cognitive characteristics of
participants. No significant differences were observed between CSVD and HC groups
in age, education level, hyperlipemia prevalence, tPVS, cPVS, or GMV%. However,
the groups differed significantly in gender and mean FD (p
In the three cognitive tasks, the efficiency z-scores for the working memory
task (updating; t(77) = –3.593, p
In the typical band, the CSVD group exhibited decreased ALFF in the right
supra-marginal gyrus (SMG), and increased ALFF in the left inferior/middle
temporal gyrus (ITG/MTG) and the right inferior temporal gyrus/fusiform gyrus
(ITG/FFG) (corrected p
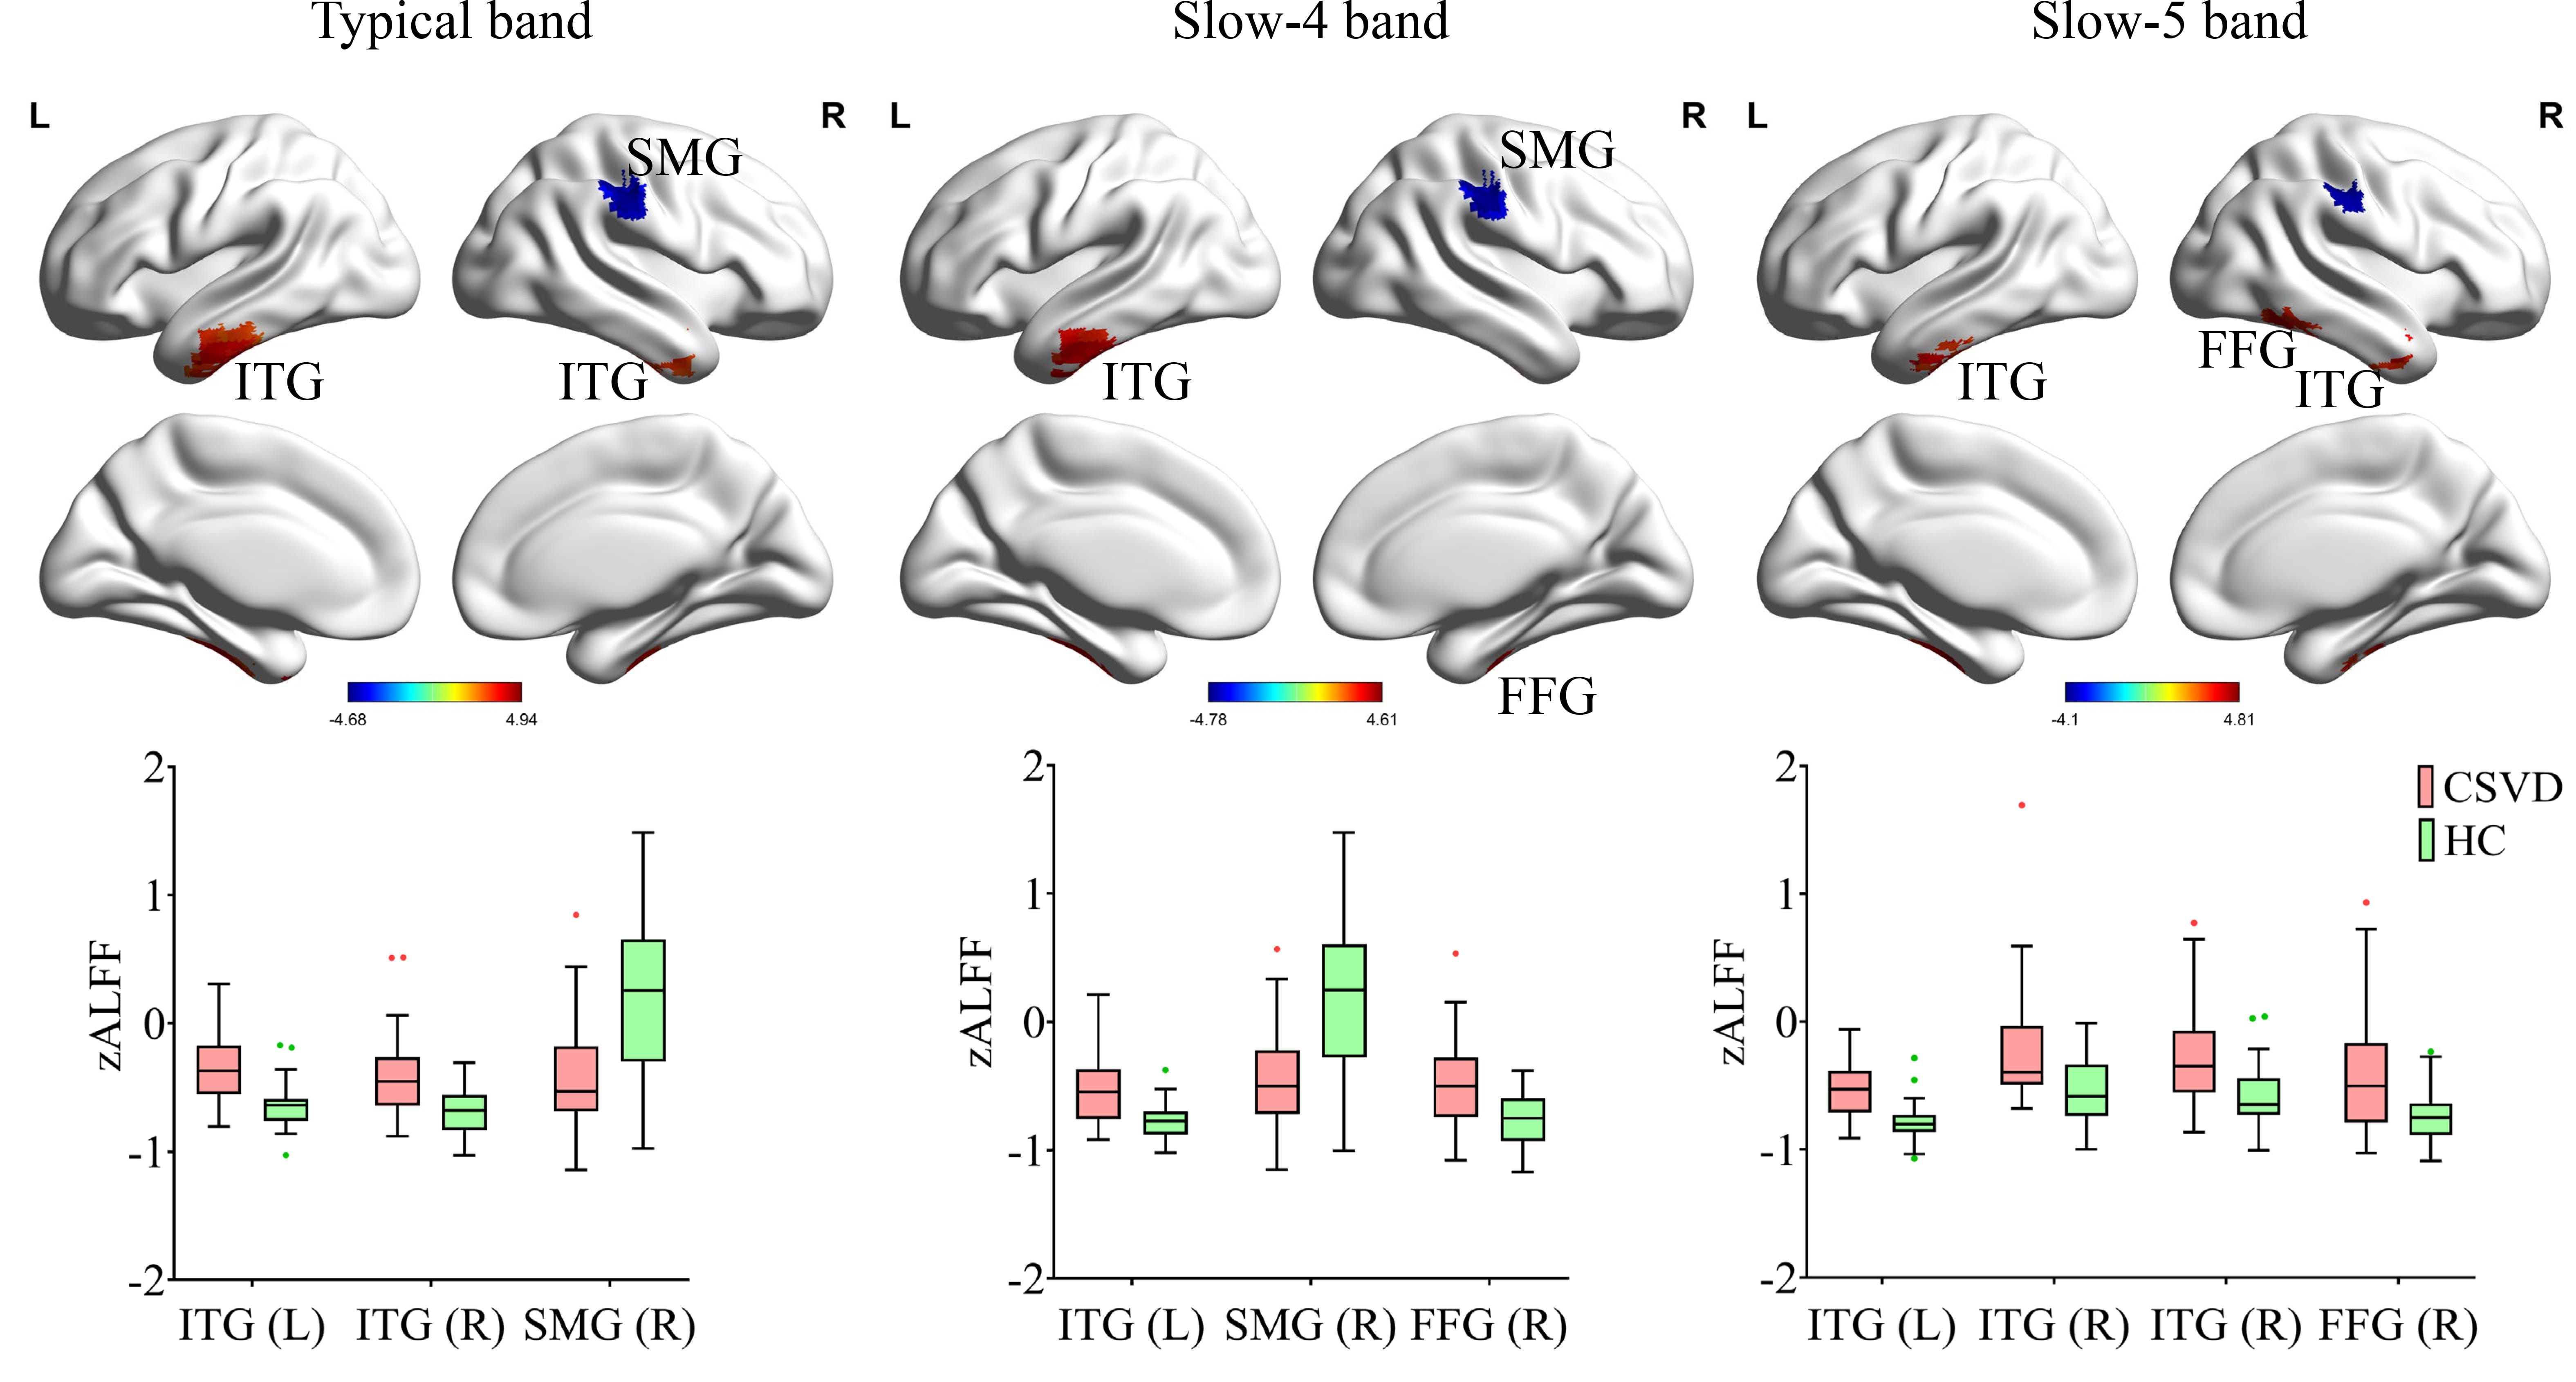 Fig. 2.
Regional functional changes (ALFF) in the typical band, slow-4
band, and slow-5 band in CSVD compared to HC (5000 permutations, TFCE corrected,
p
In the typical band, the CSVD group exhibited decreased aSigma (t(77) = –2.827, p = 0.006). In the slow-4 band, the CSVD group exhibited decreased aSigma (t(77) = –2.726, p = 0.008) and AUC of hierarchy (t(77) = –2.327, p = 0.023). No significant differences were found between the groups for other graph theory measures (AUC of Eglob and Eloc) across any of the three frequency bands. The results are shown in Fig. 3.
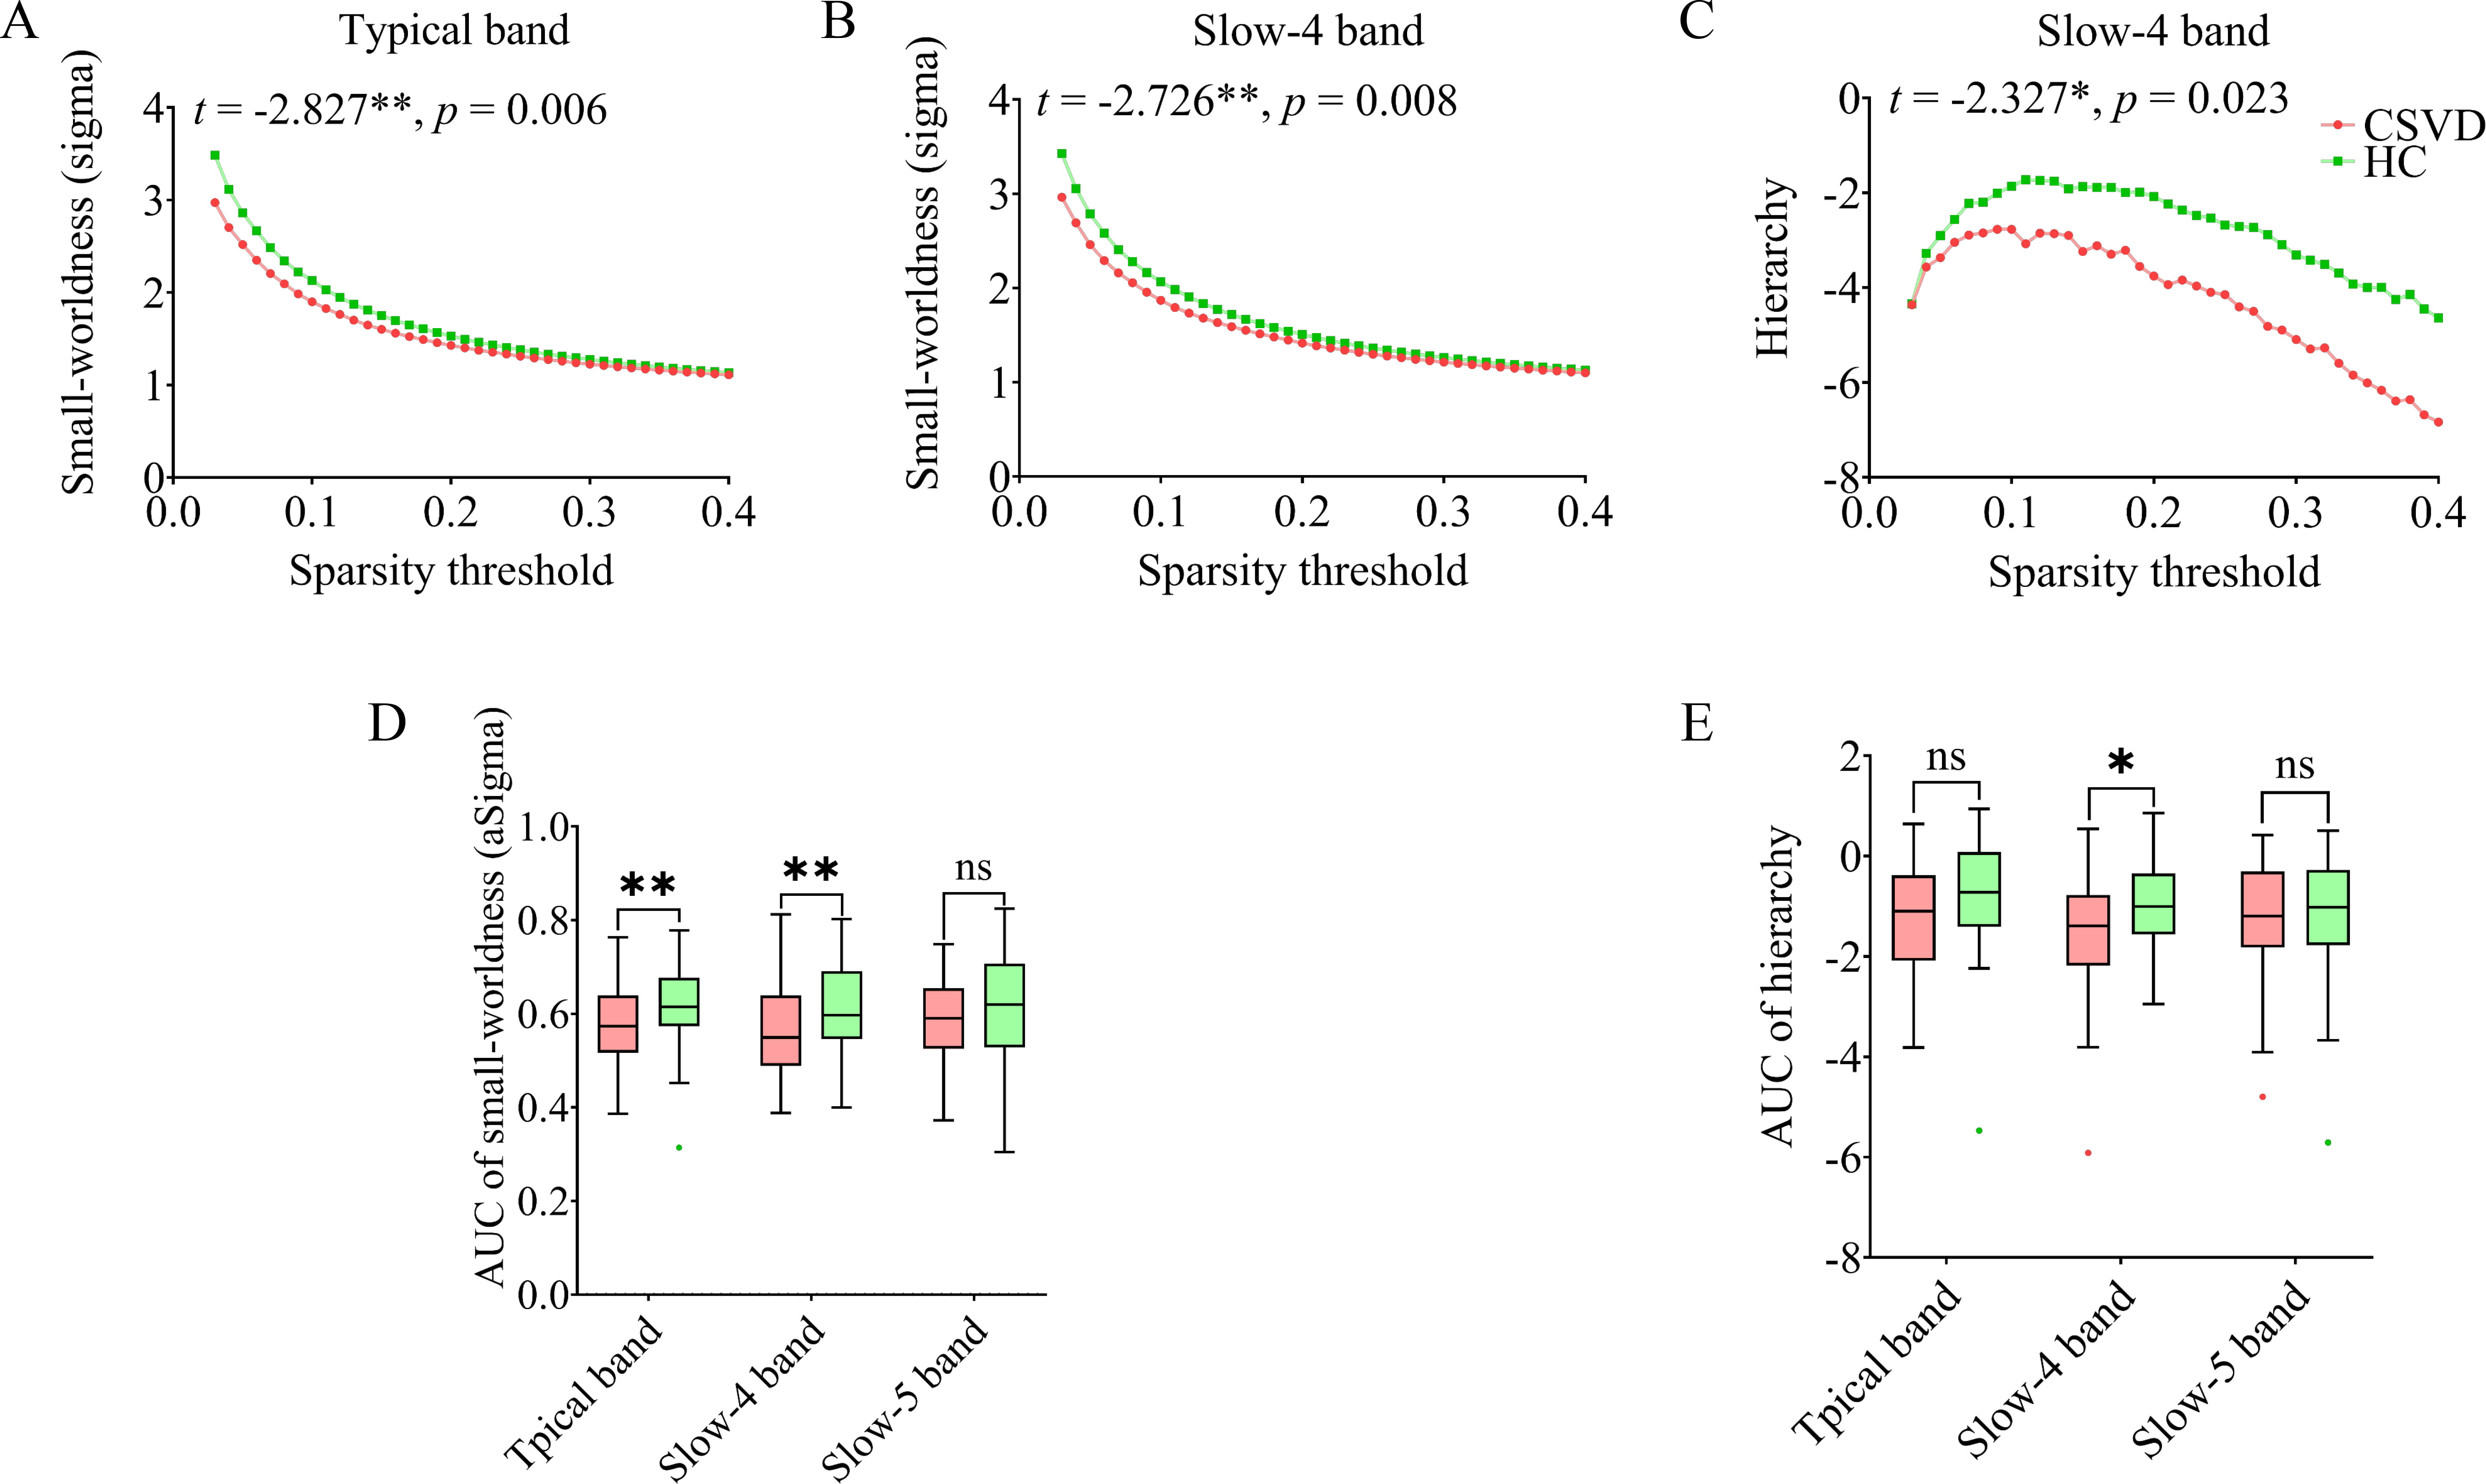 Fig. 3.
Topological properties changes in CSVD compared to HC.
Areas-under-the-curve (AUC) were plotted according to sparsity (ranging from
0.03 to 0.4, interval = 0.01). Significant group differences were observed in
small-worldness in the (A) typical band and (B) slow-4 band, and (C) hierarchy in
the slow-4 band. The overall AUC value for (D) small-worldness and (E) hierarchy
across three frequency bands between the two groups are shown.
ns, not significant. * p
Significant group differences were identified in three categories of measures through independent sample t-tests: (1) CSVD markers (tWMH, pWMH, dWMH, brain atrophy, CMB, bPVS), (2) functional indicators (ALFF in three frequency bands, aSigma in the typical and slow-4 band, AUC of hierarchy in the slow-4 band), and (3) global cognition (updating, inhibition, shifting). These measures were subsequently included in pairwise correlation analyses. The correlation coefficient matrix for all participants is presented in Fig. 4, with detailed coefficients and corresponding p-values provided in Supplementary Tables 2–4. Supplementary Table 2 displays correlations between CSVD markers and functional indicators, Supplementary Table 3 displays correlations between CSVD markers and cognitive performance, and Supplementary Table 4 displays correlations between functional indicators and cognitive performance. Scatter plots with fitted regression lines are shown in Supplementary Fig. 4, while the correlation matrix specific to the CSVD patients is presented in Supplementary Fig. 5. These findings suggest a close relationship among WMHs (tWMH, dWMH, pWMH), ALFF across the three frequency bands, and cognitive performance, as well as dWMH, aSigma in the slow-4 band, and cognitive performance.
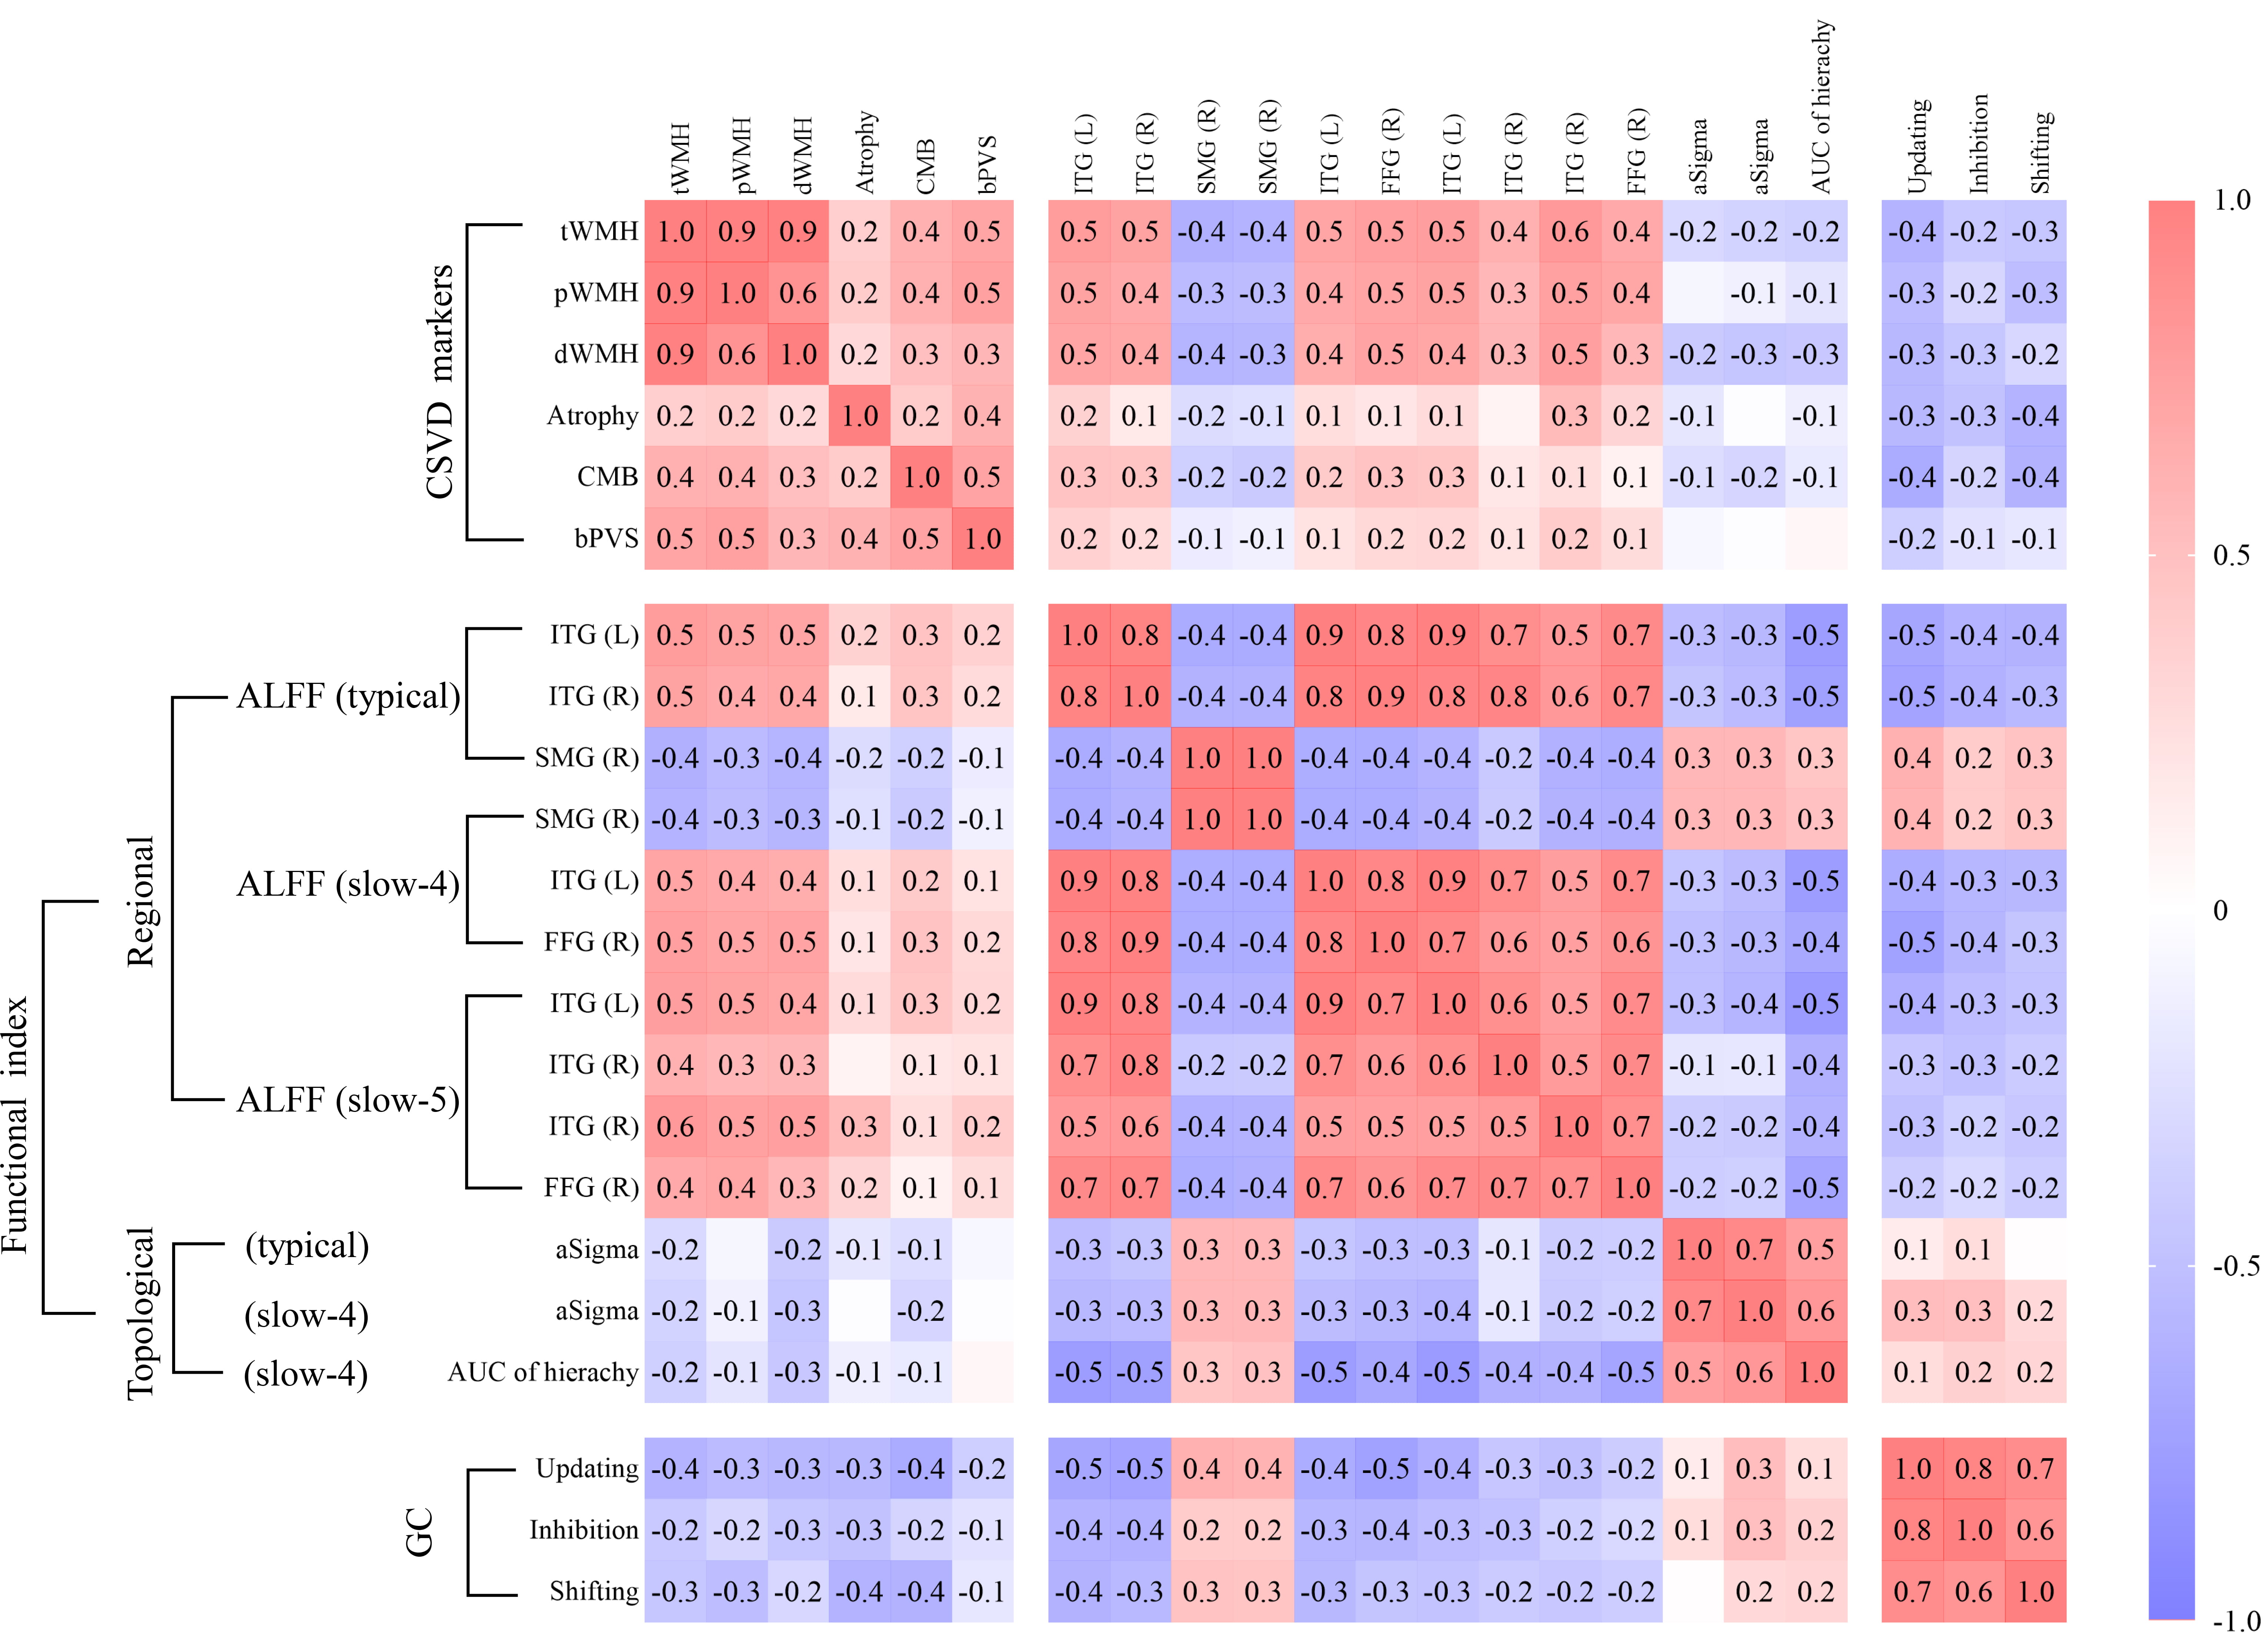 Fig. 4.
Pearson’s correlations among CSVD markers, functional
indicators, and global cognition. Significance was set at p
As shown in Fig. 5 and Supplementary Table 5, ALFF in the typical band (indirect effect = –0.225, 95% CI = [–0.432, –0.090], p = 0.001) (Fig. 5A), slow-4 band (indirect effect = –0.249, 95% CI = [–0.484, –0.105], p = 0.001) (Fig. 5B), and slow-5 band (indirect effect = –0.200, 95% CI = [–0.543, –0.043], p = 0.009) (Fig. 5C) significantly mediated the relationship between dWMH and GC. Similar mediation patterns were observed for tWMH and pWMH. However, WMH (tWMH, pWMH, dWMH) did not mediate the relationship between ALFF in any of the three frequency bands and GC. These results suggest that WMH may influence GC through regional functional brain activities.
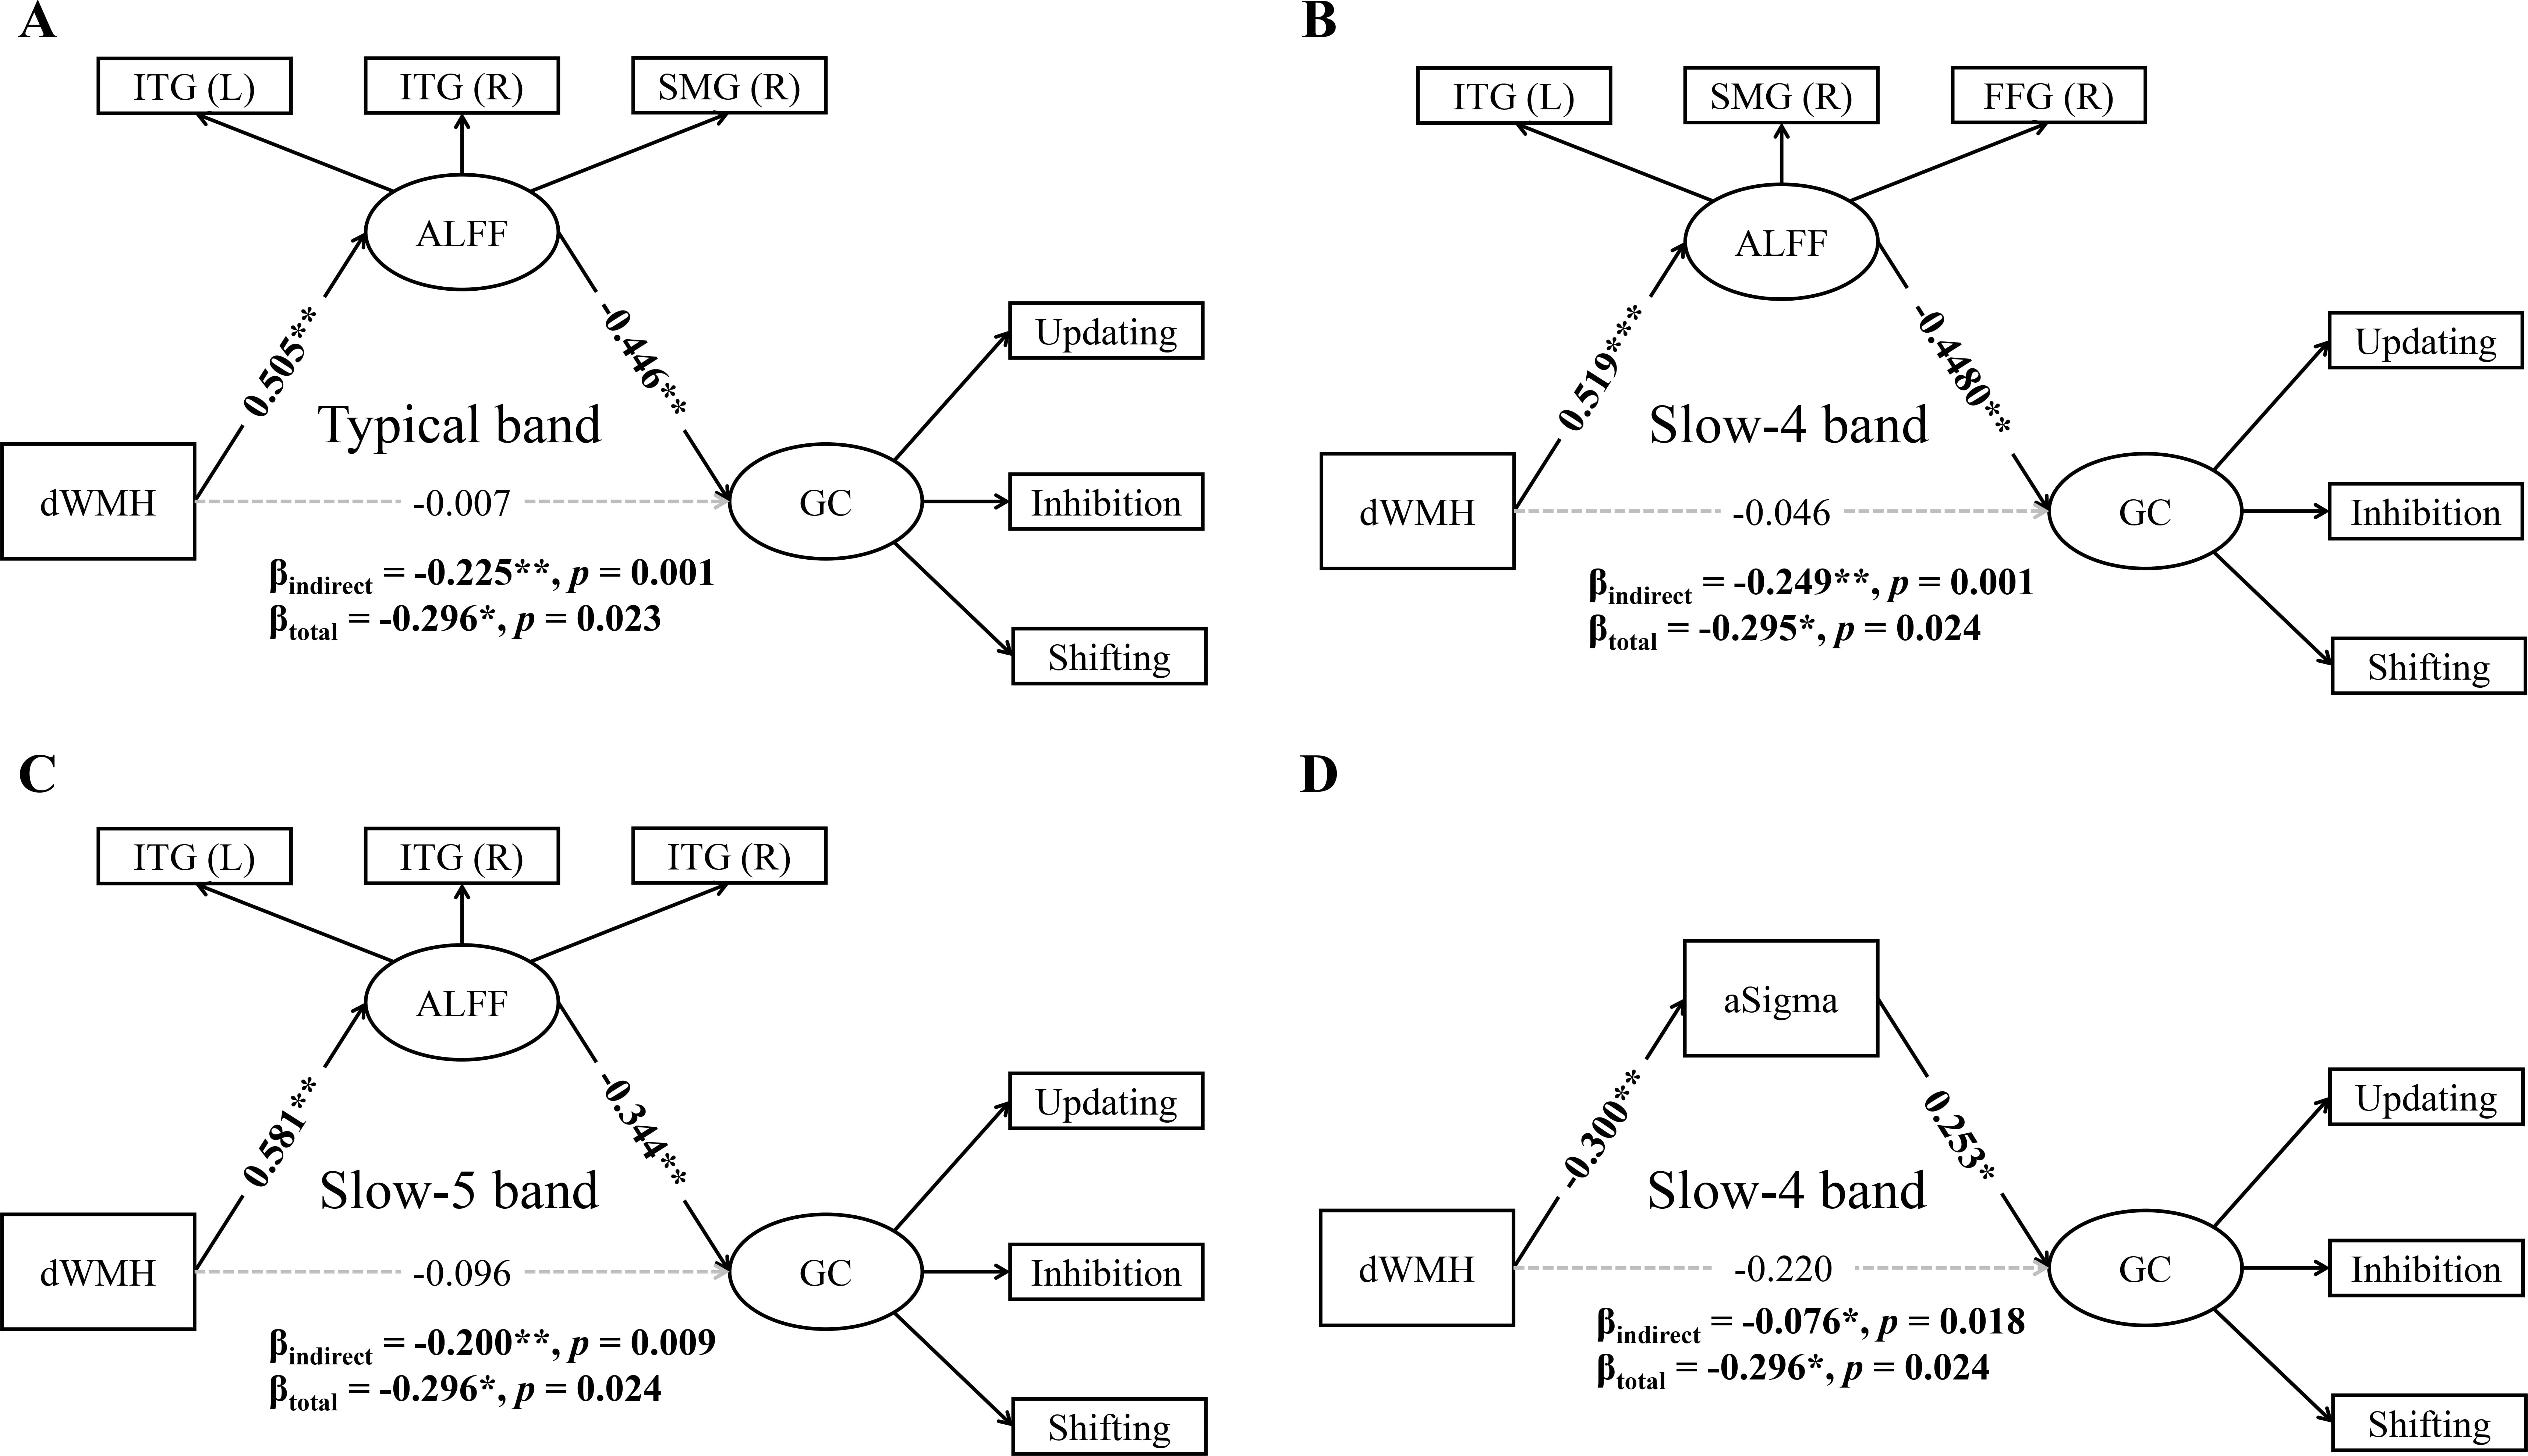 Fig. 5.
Simple mediation analyses between dWMH, ALFF/aSigma, and global
cognition. The association between dWMH and global cognition was significantly
mediated by ALFF (A) in the bilateral ITG and right SMG in the typical band; (B)
in the left ITG, right SMG, and right FFG in the slow-4 band; (C) in the
bilateral ITG in the slow-5 band; and (D) by aSigma in the slow-4 band. *
p
Additionally, aSigma in the slow-4 band mediated the relationship between dWMH and GC (indirect effect = –0.076, 95% CI = [–0.211, –0.011], p = 0.018) (Fig. 5D). Conversely, the relationship between aSigma in the slow-4 band and GC cannot be mediated by dWMH. These results suggest that dWMH may affect GC through large-scale functional brain network organization in the slow-4 band. These simple mediation analyses collectively show that WMHs is associated with GC through frequency-specific mechanisms involving both regional brain activity and network topological property, particularly in the slow-4 band.
Based on the well-fitted simple mediation models, we constructed a chain
mediation model to examine the relationship among dWMH, aSigma and ALFF in the
slow-4 band, and GC (Supplementary Fig. 2A, model 5; parameters in
Supplementary Table 6). The chain mediation results (model 5; Fig. 6)
revealed three significant pathways: (1) dWMH negatively predicted aSigma
(
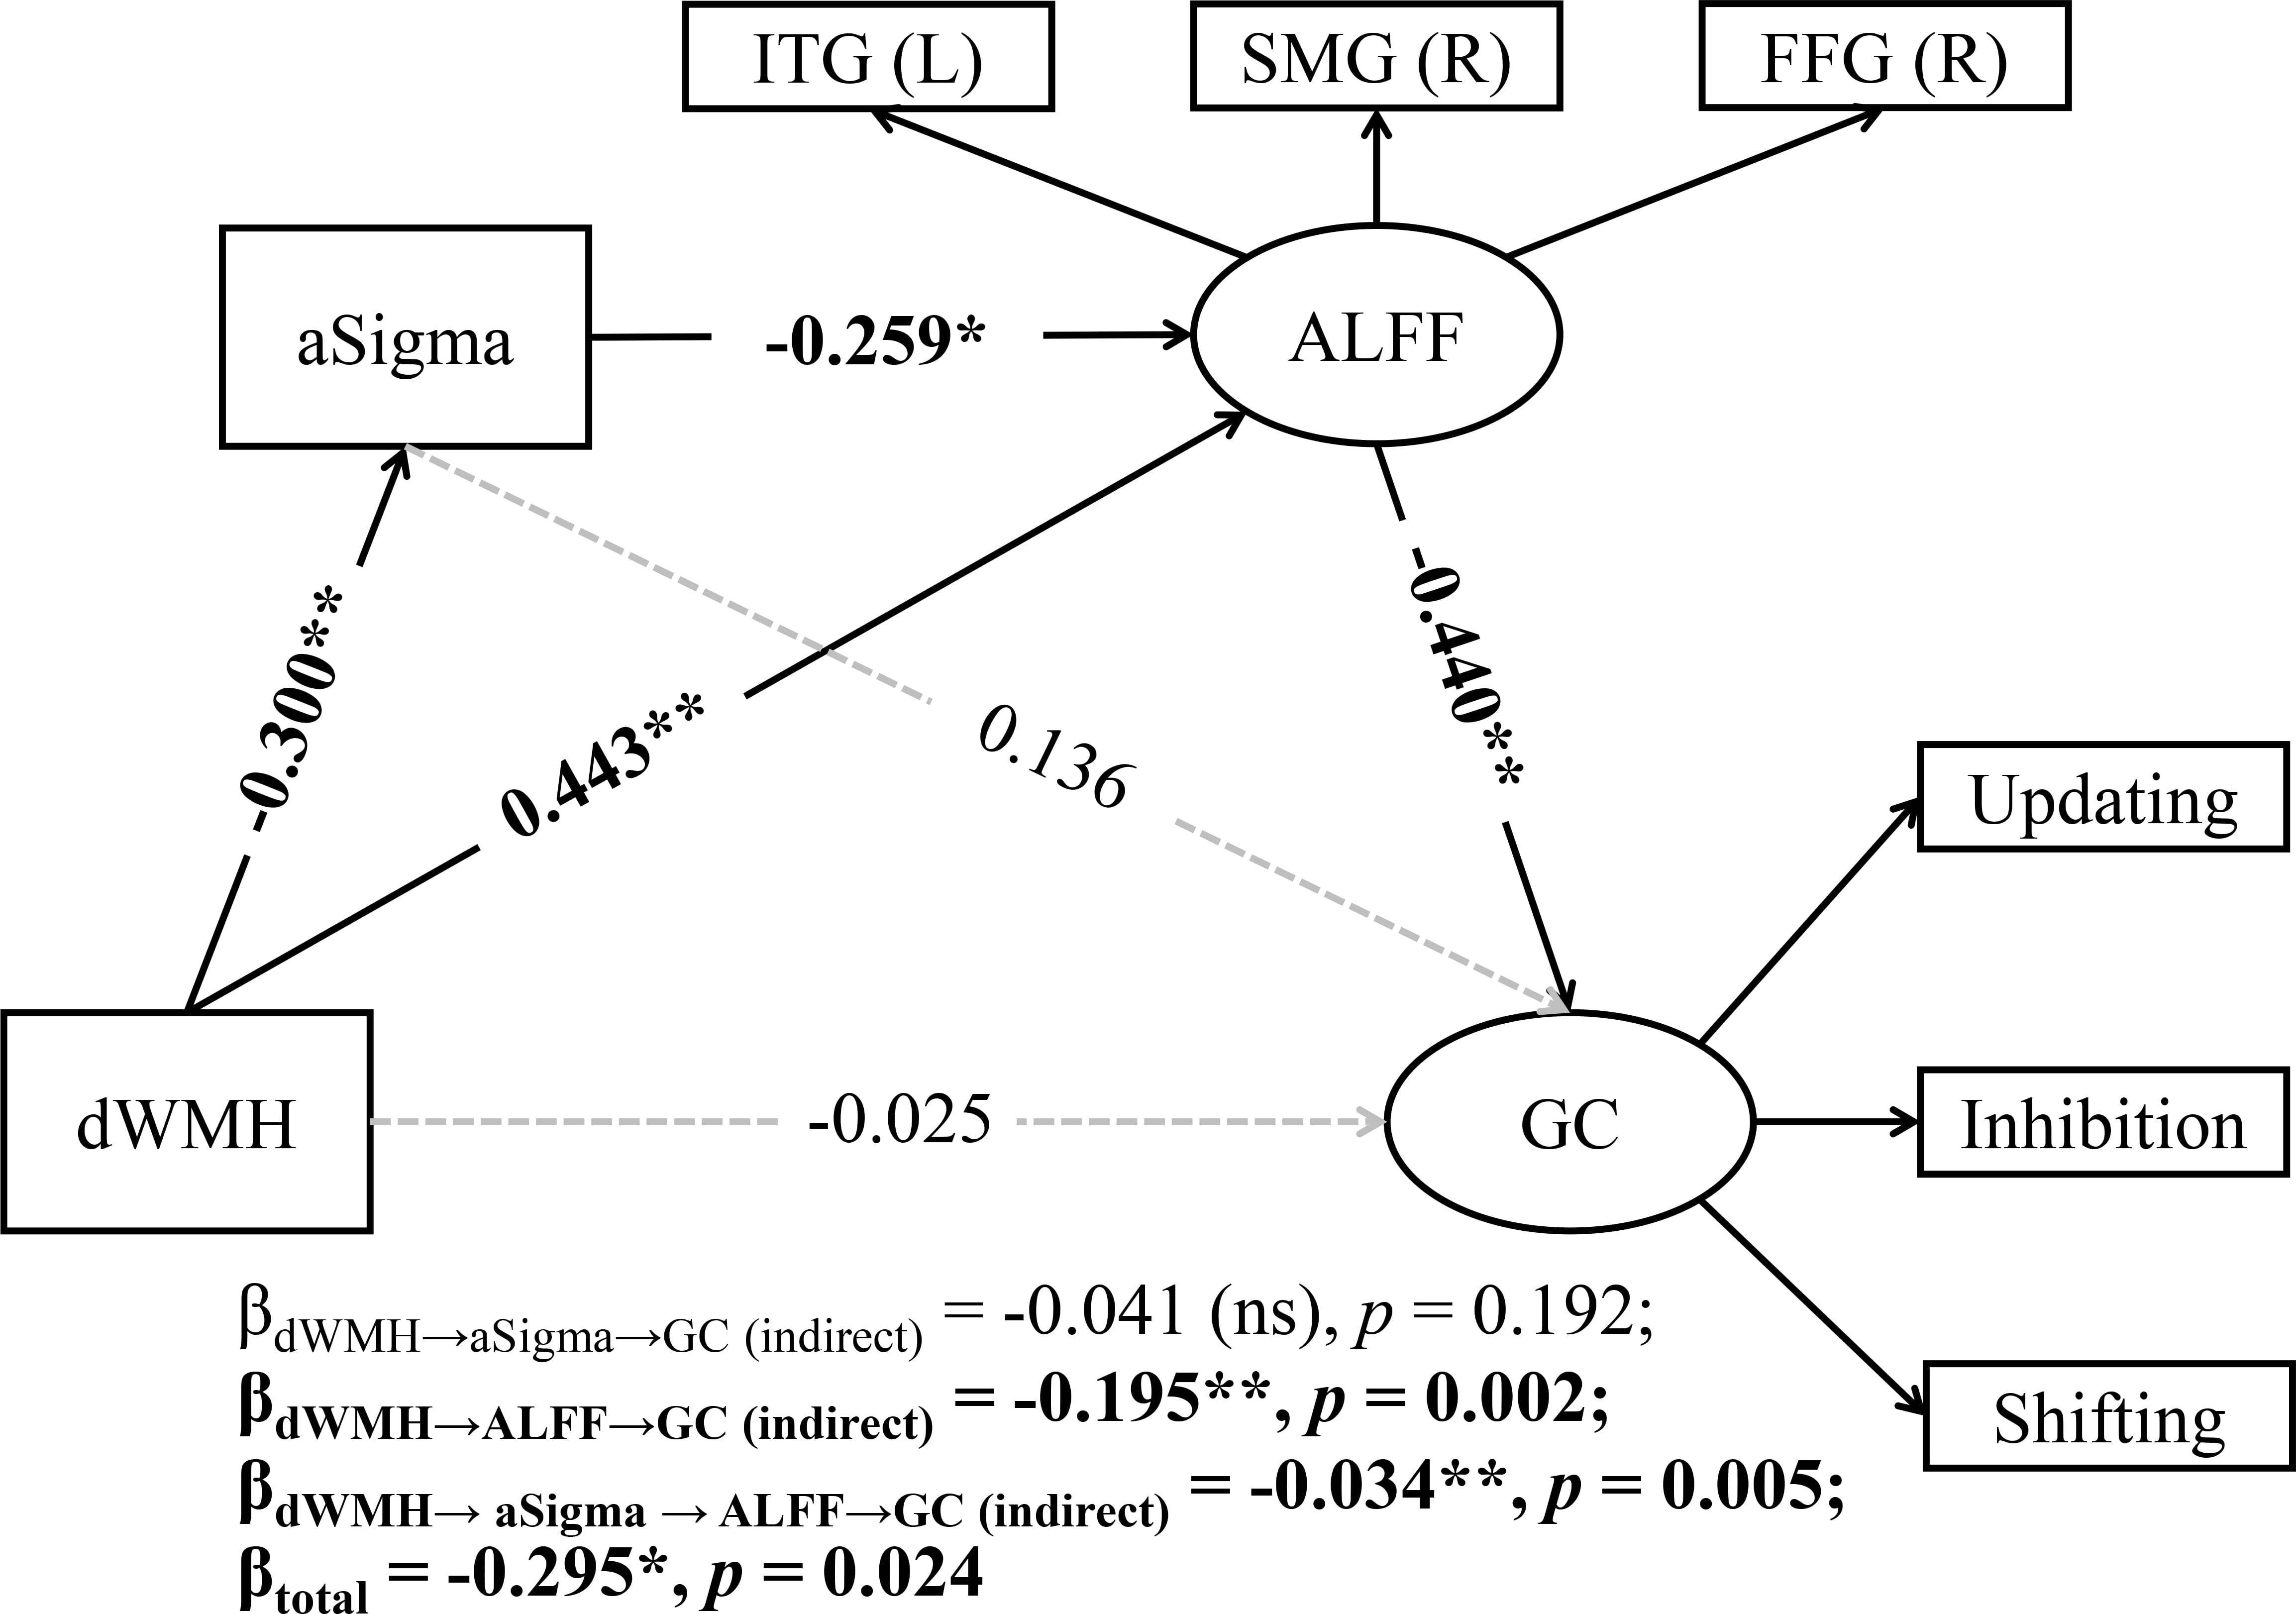 Fig. 6.
A chain mediation model with aSigma and ALFF as mediators of the
association between dWMH and global cognition (GC). ns, not significant. *
p
We further developed three alternative multiple mediation models
(Supplementary Fig. 2B–D, models 6–8) to validate these findings. In
model 6, the alternative pathway
(dWMH
This study investigated the influence of CSVD markers, particularly WMHs, on cognitive function, while investigating the roles of regional brain activity and network topological properties across three resting-state frequency bands. First, CSVD patients showed significantly worse cognitive task performance compared to the HC group. Second, CSVD patients exhibited frequency-specific alterations in regional brain activity and network topology. Further chain mediation analysis identified small-worldness and ALFF in the slow-4 band as key mediators linking dWMH to cognitive functions, highlighting the importance of complex functional brain changes resulting from WMH damage in cognitive decline. These findings provide integrated evidence for understanding the neural mechanisms underlying cognitive impairment in CSVD.
By dividing the typical band into slow-5 and slow-4, this study revealed distinct patterns of functional changes in CSVD patients across all three frequency bands. Specifically, decreased ALFF was observed in the right SMG, while increased ALFF was found in the bilateral ITG and right FFG. This pattern aligns with recent study reporting decreased ALFF in the posterior cortex and increased ALFF in deep gray matter nuclei and temporal lobe in CSVD patients [51]. Notably, regions showing increased ALFF (bilateral ITG and right FFG) demonstrated positive correlations with WMH and negative correlations with cognitive performance. Conversely, the right SMG, which showed decreased ALFF, exhibited negative correlations with WMH and positive correlations with cognitive performance. These changes suggest that both ALFF increases and decreases may represent either decompensatory mechanisms or functional impairment resulting from CSVD pathology [52].
The observed regional alterations have important functional implications. The SMG, a key node in the ventral attention network, plays critical roles in visual word recognition [53, 54, 55], and is specifically activated during executive function updating tasks in healthy young individuals [56]. The ITG, associated with higher-order cognitive functions including visual and language processing, verbal fluency, and emotional regulation [57, 58], shows synaptic deficits that correlate with cognitive test performance [57]. The FFG, critical for advanced visual functions such as face perception, object recognition, and reading [59], also demonstrated altered activity. These findings suggest that regions showing altered functional activity in CSVD are closely linked to cognitive domains, potentially serving as both biomarkers of cognitive impairment mechanisms and targets for neuromodulation interventions.
Small-worldness reflects the communication efficiency of functional brain networks, with higher values indicating greater clustering coefficients and shorter characteristic path lengths [60, 61]. CSVD-induced local structural damage exerts widespread effects on distant brain regions, impacting both functionality and network connectivity [2, 14]. Previous studies have demonstrated that high WMH burden leads to disrupted topological organization of intrinsic functional networks [62, 63, 64], with pWMH and dWMH exhibiting distinct functional, microstructural, and clinical correlates [65]. While the slow-5 band primarily reflects cortical neuronal activity, the slow-4 band is mor representative of basal ganglia function [22, 66]. This study found significantly reduced small-worldness in CSVD patients in both the typical and slow-4 band. Notably, small-worldness in the slow-4 band showed negative correlations with dWMH and positive correlations with cognitive performance, suggesting that reducted network efficiency in CSVD patients in particularly pronounced in this frequency band. These findings highlight the slow-4 band as a major contributor to variability within the typical band and emphasize the potential significance of dWMH in the overall WMH-related cognitive impairment [67].
The interpretation of altered small-worldness in CSVD remains debated, particularly regarding whether these changes represent functional compensation or impairment. Some studies suggested compensatory machanisms, with non-demented CSVD patients showing increased small-worldness compared to controls [68], potentially maintaining cognitive function through reducted modularity and increased network integration [69]. Conversely, other research demonstrated reduced small-worldness in CSVD structural networks, with these alterations correlating with deficits in executive function, attention, and processing speed [70]. Our findings support the latter perspective, indicating that reduced small-worldness in CSVD patients primarily represents functional impairment rather than compensatory reorganization.
WMH promote neurodegeneration, and understanding the WMH-cognition relationship provides crucial insights into cognitive impairment in CSVD [71]. However, the specific patterns of brain reorganization patterns and their relationship with cognitive impairment remain unclear. Our simple mediation analyses indicated that ALFF in all three frequency bands fully mediated the effects of WMH (including tWMH, pWMH, and dWMH) on EF, suggesting widespread association between WMH and regional brain activity throughout the brain and across multiple frequency bands. Furthermore, small-worldness in the slow-4 band completely mediated the relationship between dWMH and global cognition. Chain mediation analysis revealed that small-worldness and ALFF significantly mediate the effects of dWMH on global cognition, with the mediating pathway flowing from small-worldness to ALFF. While previous studies have primarily examined simple mediation models [13, 15, 16, 17, 18, 19, 20, 21, 72], our fingdings extend the WMH-brain function-cognition pathway, highlighting the complexity of WMH-related cognitive impairment mechanisms.
Two key insights emerge from these findings. Firstly, the mediation effects of regional brain activity and network topology suggest that WMH influence cognition indirectly through functional brain changes [10]. Pathological studies indicate that WMH may induce cognitive impairment through multiple mechanisms, including ischemia, hypoxia, hypoperfusion, immune activation, blood-brain barrier dysfunction, metabolic alterations, and glial injury [10, 73, 74]. These pathological changes may disrupt white matter integraty and alter blood-oxygen-level-dependent (BOLD) signal distribution [75], ultimately affecting cortical connectivity and function [76].
Secondly, the chain mediation effect occurs from global to local levels. Research indicates that changes in small-worldness may be associated with ALFF in specific brain regions. For instance, stroke patients showed decreased ALFF in the left superior frontal gyrus alongside reduced FC with other brain regions (right precentral gyrus, right postcentral gyrus, left inferior temporal gyrus, and right paracentral lobule), highlighting changes in network clustering and characteristic path length [77]. Our findings suggest that WMH primarily impaie global cognition by disrupting the overall organizational of functional networks, reducing communication efficiency, and subsequently causing abnormal increases or decreases local brain activity patterns that lead to cognitive deficits in CSVD.
This study has several limitations. First, our findings are based on non-demented CSVD patients (as determined by MoCA/MMSE score) with a relatively small sample size. The observed effects of dWMH on cognition and the mediating roles of small-worldness and ALFF in the slow-4 band require validation in larger cohorts and in CSVD populations with cognitive dysfunction or dementia [78]. Second, while we focused on three core components of global cognition using objective procedural tasks, our assessment did not encompass all cognitive domains. Given the extensive nature of CSVD-related cognitive impairment [79], future studies should implement more comprehensive and objective cognitive assessments. Third, this study identified macro-level neuroimaging evidence for the structure-function-behavior relationship in CSVD, the underlying pathological mechanisms remain unclear. Future research should integrate pathological processes to better differentiate WMH etiologies and uncover the mechanisms underlying clinical heterogeneity [11]. Fourth, the cross-sectional design limits causal inferences. Longitudinal studies are needed, particularly given that baseline WMH predicted cognitive impairment across diagnostic categories and dementia risk in mild cognitive impairment and post-stroke conditions [80], with WMH being one of the strongest predictors of cognitive function in CSVD patients over three-year follow-up [81]. Finally, while we identified a pathway from dWMH to global cognition through small-worldness and ALFF, the relationships are not merely unidirectional and potentially involve more complex interactions. Future studies should explore these intricate relationships in greater depth.
This study explored the pathophysiological mechanisms of cognitive dysfunction in CSVD by integrating structural markers, functional indicators, and behavioral data. Our findings indicate that the impact of dWMH on global cognition is significantly mediated by small-worldness and ALFF, with the slow-4 band primarily driving the variability within the typical band. These findings provide partial explanation for the heterogeneity of cognitive functions in CSVD patients under WMH influence, emphasizing the crucial mediating role of resting-state regional brain activity and network topology in the slow-4 band. This study provides important insights into the neurophysiological mechanisms underlying cognitive impairment in CSVD, potentially informing future intervention strategies.
Due to the restriction of ethics, we are not able to make our data publicly available. The code are available from the corresponding author.
DQF, HCZ, TL and YLW designed the study, DQF performed the experiment, TTW, CL and CHL assisted with data collection and analyzed the data. CHL provided clinical interpretation. DQF and HCZ analyzed the data. DQF wrote the original draft of the manuscript. HCZ, TL and YLW reviewed and edited the manuscipt. All authors contributed to editorial changes in the manuscript. All authors read and approved the final manuscript. All authors have participated sufficiently in the work and agreed to be accountable for all aspects of the work.
The research protocol was approved by the Ethics Committee of Beijing Tiantan Hospital, Capital Medical University (Ethics approval number: KY 2019-140-02, approved on January 3, 2020). The study was carried out in accordance with the guidelines of the Declaration of Helsinki and all of the participants provided signed informed consent.
Not applicable.
This research received support from the National Natural Science Foundation of China (Grant No. 82372040, 82425101, 32300859, 82202085), the National Key Research and Development Program of China (Grant No. 2022YFC2504902), Beijing Natural Science Foundation (Grant No. Z200016), Beijing Municipal Science & Technology Commission (No. Z231100004823036).
The authors declare no conflict of interest.
Supplementary material associated with this article can be found, in the online version, at https://doi.org/10.31083/JIN36303.
Publisher’s Note: IMR Press stays neutral with regard to jurisdictional claims in published maps and institutional affiliations.