
- Academic Editor
Neuromyelitis optica spectrum disorder (NMOSD) is a recurrent demyelinating neuroinflammatory disorder of the central nervous system. This study aimed to evaluate the neural conduction and sound information processing in individuals with NMOSD, through the analysis of auditory brainstem responses (ABRs) and cortical auditory evoked potentials (CAEPs).
Twenty-four individuals (9–21 years old) were distributed into two groups: the study group (SG), diagnosed with NMOSD, and the control group, healthy individuals. Their ABRs and CAEPs were evaluated, and the results were examined alongside data from cranial magnetic resonance imaging (MRI).
Abnormal ABRs were observed in 33% of the SG and increased I–III interpeak was the most prevalent finding. The CAEPs showed abnormalities in 58% of the SG, mainly to P1 latency. SG subjects presented longer P1, N1, and N2 latencies and lower N2–P3 amplitude. MRI showed alterations mostly in the pons, midbrain, and IV ventricle.
Alterations in neural conduction and sound information processing were observed in individuals with NMOSD when compared with their peers. Auditory evoked potentials are important instruments to identify central auditory dysfunction in this population as well as to monitor disease evolution.
Neuromyelitis optica spectrum disorder (NMOSD) is defined as a recurrent demyelinating neuroinflammatory disorder of the central nervous system (CNS), mainly affecting the optic nerve, spinal cord, and in some cases the brain stem [1].
Previously understood as an optical variant of multiple sclerosis (MS), the term NMOSD was separated into its category in 2004 when a study found its relationship with immunoglobulin G (IgG) antibodies, and the protein of the main water channels of the CNS, aquaporin-4 (AQP4), which have become fundamental in the diagnosis and treatment of the disease [2].
Unlike MS, the demyelination observed in NMOSD is a secondary factor, resulting from damage and functional changes to astrocytes, whose protective functions towards nearby structures, such as neurons, become deficient, in turn being caused by hypofunction of the blood-brain barrier and interference to AQP4 [2].
The disorder generally manifests in adults, more predominantly in the female population, but cases are also found in the pediatric population. The most referred symptoms are decreased visual acuity and eye pain [3, 4, 5].
Currently, the most common diagnostic method in addition to clinical evaluation is magnetic resonance imaging (MRI), but other methods that can be used in the evaluation of the CNS and peripheral areas are being investigated [6].
Due to its tendency to the recurrence of symptoms, NMOSD treatment is divided into two phases: first and foremost directed against the acute symptoms, and then towards long-term prevention of the disease, which is usually carried out using immunosuppressants such as corticosteroids, azathioprine, mycophenolate mofetil, methotrexate, cyclosporine A, tacrolimus, and mitoxantrone [7].
Auditory evoked potentials (AEPs) are frequently used in the audiological field to assess the integrity and functionality of auditory pathways and can be used in the differential diagnosis of auditory and neurological disorders [8].
Auditory brainstem responses (ABRs) can be used to check the conditions of the auditory pathway at the auditory nerve and brainstem level, whereas cortical auditory evoked potentials (CAEPs) can verify the functionality and integrity of cognitive structures and functions, evaluating areas such as the superior temporal gyrus, prefrontal cortex, and thalamic regions [8].
AEPs have great potential for identifying abnormalities related to demyelinating processes, in terms of evaluating the degree of involvement, identifying the most affected sites, and monitoring disease progression [9].
Regarding investigations on the use of AEP in MS, delayed neural conduction has been identified through the comparison of MS results with control subjects and it has been concluded that such assessments could be used as biomarkers for the disease and as monitoring methods [9, 10, 11, 12, 13].
Regarding NMOSD, the only study that has investigated AEPs in this population evaluated nine children (9 to 17 years old) diagnosed with NMOSD by ABR and CAEP. A longer I–V interpeak in the ABR; longer P1, N1, and P2 latencies; and a smaller N2–P3 amplitude in the CAEP were identified when compared with healthy controls [13].
Due to the sensitivity of AEPs in identifying changes in the conduction of the bioelectric signal, and their strong association with demyelinating diseases, increased latencies are also expected in individuals diagnosed with NMOSD. Thus, the objective of this study was to evaluate the neural conduction and sound information processing in individuals with NMOSD, through the analysis of ABRs and CAEPs.
The research was approved by the institution’s research ethics committee under number 1.784.31. All parents/guardians and participants signed informed consent and assent forms before the study.
The population evaluated consisted of 24 individuals of both genders, aged between 9 and 21 years old, distributed into two groups: the study group (SG), composed of 12 individuals diagnosed with NMOSD, and the control group (CG), composed of 12 healthy individuals, without NMOSD, recruited from local schools.
The inclusion criteria for the SG was an NMOSD diagnosis, determined by physical and neurological assessments performed by a neurologist, brain MRI, blood, and cerebrospinal fluid (CSF) exams, and AQP4-IgG tests. In addition, none of the SG individuals could have any other diseases. All individuals tested positive for AQP4-IgG, and the diagnosis followed the international consensus diagnostic criteria for NMOSD of 2015 [14]. CG individuals could not have developmental impairments or neurological or psychiatric complaints.
The exclusion criteria included excess of cerumen in the external acoustic meatus, abnormal audiometric results, conductive impairments, or previous use of ototoxic medication.
To guarantee the sample criteria adopted in this study, all participants underwent meatoscopy, immittance testing, and pure-tone audiometry utilizing a TDH-39 supra aural headphone (Telephonics, Los Angeles, CA, USA), at the frequencies of 250 Hz to 8 kHz, and speech audiometry. All subjects presented type A tympanometric curves [15], the presence of acoustic reflexes, hearing thresholds below 15 dB HL from 500 to 4000 Hz [16], speech recognition test results compatible with the tritone average of the 0.5, 1, and 2 kHz frequencies, and a speech recognition index above 88%.
The evaluation of AEPs was carried out using the two-channel Smart EP equipment (Intelligent Hearing Systems (IHS), Miami, FL, USA) developed by Intelligent Hearing System and ER 3-A insert headphones (IHS). During the assessment, the subjects remained seated in a reclining armchair, in an acoustically and electrically treated room. The skin surface of the forehead, mastoids, and scalp were cleaned using abrasive paste, and silver/silver chloride electrodes (IHS) were positioned with electrolytic paste, following the international 10-10 system (international electrode system). Electrode impedance was maintained below 3 kOhms.
To measure ABRs, the electrode was placed at Fz (active electrode), Fpz (ground), and M1 and M2 (reference electrodes). The rarefaction click stimuli were used, monaurally, at a rate of 19.1 clicks per second, at 80 dBnHL, using a 100 Hz high-pass filter, 1500 Hz low-pass filter, and 12 ms recording window.
To check the reproducibility of the waves, multiple trials were carried out with 2048 sweeps each. The absolute latencies of waves I, III, and V, and the latencies of interpeaks I–III, III–V, and I–V were analyzed.
The results were classified as normal or altered according to the equipment’s user manual [17] (Table 1).
| Wave | Mean | Standard Deviation | Interpeak | Mean | Standard Deviation |
| I | 1.54 | 0.22 | I–III | 2.14 | 0.23 |
| III | 3.69 | 0.20 | III–V | 1.86 | 0.14 |
| V | 5.54 | 0.38 | I–V | 4.00 | 0.20 |
ABR, auditory brainstem response.
For CAEPs, the electrode montage was Cz (active electrode), Fpz (ground), and M1 and M2 (reference electrodes). Tone-burst stimuli were presented monaurally in an oddball paradigm, at 75 dBnHL, composed of 85% standard stimulus (1000 Hz) and 15% target stimulus (2000 Hz). Three hundred sweeps were performed, presented at 1.1 sweeps per second, with high- and low-pass filters between 1 and 30 Hz, and a 500 ms recording window. Participants were instructed to pay attention to the target stimuli and count aloud the number of times they occurred. The P1, N1, P2, N2, and P3 components were identified and analyzed regarding the latencies following the normality proposed by McPherson [18], according to age (Table 2).
| Component | 5 to 12 Years Old | Above 12 Years Old |
| P1 | 54–75 | 54–73 |
| N1 | 83–135 | 83–135 |
| P2 | 137–194 | 137–194 |
| N2 | 200–280 | 188–231 |
| P3 | 241–396 | 225–365 |
CAEP, cortical auditory evoked potentials.
The ABR and CAEP results were compared between the groups and associations
between the normal or abnormal results and the alterations found on the MRI were
verified in the SG. The analysis of the association between nominal variables was
carried out using Fisher’s exact test or the Chi-squared test. To compare the
quantitative results of the latency values, the repeated measures ANOVA test was
carried out, in which the ear was considered as a repeated measure and the group
as a between-subjects factor, and the Bonferroni post hoc test was used when
necessary. For all analyses, a p-value
The characterization of the sample in terms of age, gender, and most prevalent clinical features are shown in Table 3. No significant differences were found between the groups, regarding age (t(22) = –0.219; p = 0.829) and gender (X2(1) = 0.686; p = 0.408).
| Control Group | Study Group | ||||||
| Individual | Gender | Age (years) | Individual | Gender | Age of Disease Onset (years) | Current Age (years) | Clinical Features |
| 1 | M | 12 | 13 | M | 9 | 9 | Cephalalgia, photophobia, bilateral low visual acuity |
| 2 | F | 9 | 14 | F | 9 | 9 | Cephalalgia, sudden blurred vision, dizziness, bilateral eyelid ptosis, gradual reduction of the visual acuity, diplopia, axial and appendicular ataxia, hyporeflexia, somnolence |
| 3 | F | 10 | 15 | F | 7 | 10 | Emesis, singultus, right LM and right UM paresis, tetraparesis, right eye low visual acuity |
| 4 | M | 11 | 16 | M | 10 | 11 | Cephalalgia, dizziness, emesis, low visual acuity, fever, eye pain |
| 5 | F | 11 | 17 | F | 9 | 11 | Cephalalgia, low visual acuity |
| 6 | M | 17 | 18 | M | 12 | 12 | Cephalalgia, central scotoma in the left eye |
| 7 | M | 17 | 19 | M | 13 | 17 | Cephalalgia, dizziness, emesis, diplopia, right hemiparesis, hemi-hypoesthesia |
| 8 | M | 17 | 20 | M | 15 | 17 | Nonspecific pain, paresthesia and paresis on LM and UM, tetraparesis, urinary incontinence |
| 9 | M | 17 | 21 | F | 12 | 18 | Torticollis, progressive LM and UM paresis, low visual acuity, breathing and swallowing difficulties, incontinence |
| 10 | M | 9 | 22 | F | 7 | 12 | Strabismus, bilateral low visual acuity, somnolence, LM and UM paresis with loss of balance |
| 11 | M | 17 | 23 | M | 13 | 16 | Somnolence, paresis and hypoesthesia on LM, urinary incontinence, emesis, cervical and lumbar pain |
| 12 | F | 12 | 24 | F | 10 | 21 | Cephalalgia, emesis, paresis and hypoesthesia on LM, paraparesis, urinary retention, constipation |
Legend: M, Male; F, Female; LM, Lower members; UM, Upper members. The MRI data, and CSF and blood analysis results are shown in Chart 1 (Supplementary Material). CSF, cerebrospinal fluid; MRI, magnetic resonance imaging.
The ABR recordings showed alterations in four SG individuals, two bilateral and two unilateral, and the main alteration was an increase in the I–III interpeak, observed in three individuals. All the CG individuals had normal ABRs, showing a trend towards a significant difference between the groups (Table 4, Supplementary Fig. 1).
| ABR | Sample Number | Percentage | Fisher’s Exact Test | |
| SG | Normal | 8 | 66.7% | p = 0.093 |
| Abnormal | 4 | 33.3% | ||
| CG | Normal | 12 | 100.0% | |
| Abnormal | 0 | 0.0% |
Legend: CG, Control Group; SG, Study Group.
The descriptive analysis of the absolute latency values of waves I, III, and V and the interpeak latencies I–III, III–V, and I–V are shown in Table 5.
| Ear | Group | Minimum | Maximum | Mean | Standard Deviation | |
| Wave I | Right | CG | 1.48 | 1.73 | 1.612 | 0.076 |
| SG | 1.43 | 1.75 | 1.603 | 0.116 | ||
| Left | CG | 1.53 | 1.73 | 1.613 | 0.061 | |
| SG | 1.38 | 1.85 | 1.554 | 0.141 | ||
| Wave III | Right | CG | 3.70 | 3.92 | 3.804 | 0.086 |
| SG | 3.20 | 4.15 | 3.758 | 0.228 | ||
| Left | CG | 3.60 | 3.92 | 3.772 | 0.109 | |
| SG | 3.53 | 4.33 | 3.839 | 0.207 | ||
| Wave V | Right | CG | 5.40 | 5.90 | 5.628 | 0.160 |
| SG | 5.15 | 5.83 | 5.595 | 0.174 | ||
| Left | CG | 5.47 | 5.85 | 5.617 | 0.146 | |
| SG | 5.25 | 6.13 | 5.615 | 0.215 | ||
| Interpeak I–III | Right | CG | 2.05 | 2.37 | 2.202 | 0.104 |
| SG | 1.48 | 2.50 | 2.155 | 0.234 | ||
| Left | CG | 1.95 | 2.35 | 2.174 | 0.117 | |
| SG | 2.05 | 2.78 | 2.288 | 0.201 | ||
| Interpeak III–V | Right | CG | 1.65 | 2.00 | 1.813 | 0.100 |
| SG | 1.57 | 1.95 | 1.839 | 0.104 | ||
| Left | CG | 1.60 | 1.95 | 1.832 | 0.097 | |
| SG | 1.50 | 1.93 | 1.778 | 0.116 | ||
| Interpeak I–V | Right | CG | 3.70 | 4.20 | 4.017 | 0.166 |
| SG | 3.43 | 4.15 | 3.994 | 0.187 | ||
| Left | CG | 3.77 | 4.20 | 4.003 | 0.127 | |
| SG | 3.80 | 4.58 | 4.065 | 0.189 |
Bold: abnormal latency values.
There was no significant difference between the groups for the absolute latency
of waves I (F(1) = 0.728; p = 0.403;
Regarding the CAEPs, the recordings showed alterations in seven SG individuals, with most abnormalities occurring in the P1 component and with significant differences between groups, as all CG individuals presented normal latencies for all components (Table 6, Supplementary Fig. 2).
| ABR | Sample number | Percentage | Chi-squared test | |
| SG | Normal | 5 | 41.7% | X2(1) = 9.882; p = 0.002* |
| Abnormal | 7 | 58.3% | ||
| CG | Normal | 12 | 100.0% | |
| Abnormal | 0 | 0.0% |
*statistically significant value.
Table 7 shows the descriptive analysis of the latencies values in milliseconds (ms) of the P1, N1, P2, N2, and P3 components, divided by ear and by group.
| Ear | Group | Minimum | Maximum | Mean | Standard Deviation | |
| P1 | Right | CG | 34 | 74 | 50.333 | 14.550 |
| SG | 38 | 145 | 74.333 | 33.622 | ||
| Left | CG | 41 | 72 | 56.250 | 13.137 | |
| SG | 35 | 109 | 60.250 | 22.194 | ||
| N1 | Right | CG | 66 | 128 | 97.083 | 21.500 |
| SG | 85 | 166 | 116.000 | 23.506 | ||
| Left | CG | 74 | 115 | 96.833 | 14.807 | |
| SG | 86 | 130 | 107.250 | 15.190 | ||
| P2 | Right | CG | 142 | 182 | 163.000 | 13.618 |
| SG | 154 | 222 | 174.500 | 18.604 | ||
| Left | CG | 106 | 193 | 166.417 | 24.452 | |
| SG | 146 | 192 | 169.333 | 15.576 | ||
| N2 | Right | CG | 198 | 259 | 224.250 | 19.891 |
| SG | 197 | 295 | 248.083 | 27.520 | ||
| Left | CG | 195 | 260 | 223.250 | 19.855 | |
| SG | 188 | 289 | 238.583 | 29.843 | ||
| P3 | Right | CG | 256 | 367 | 324.500 | 31.564 |
| SG | 290 | 395 | 321.833 | 29.145 | ||
| Left | CG | 267 | 349 | 314.250 | 28.677 | |
| SG | 265 | 395 | 334.083 | 39.109 |
In the comparison analysis, the SG tended to have longer P1 latencies than the CG only in the right ear (t = –2.624; p = 0.078; d = 1.071). There were longer latencies in the SG compared with the CG, regardless of the ear evaluated, for the N1 and N2 components. Although longer values were observed in the SG, there was no significant difference between the groups for the P2 and P3 components (Fig. 1).
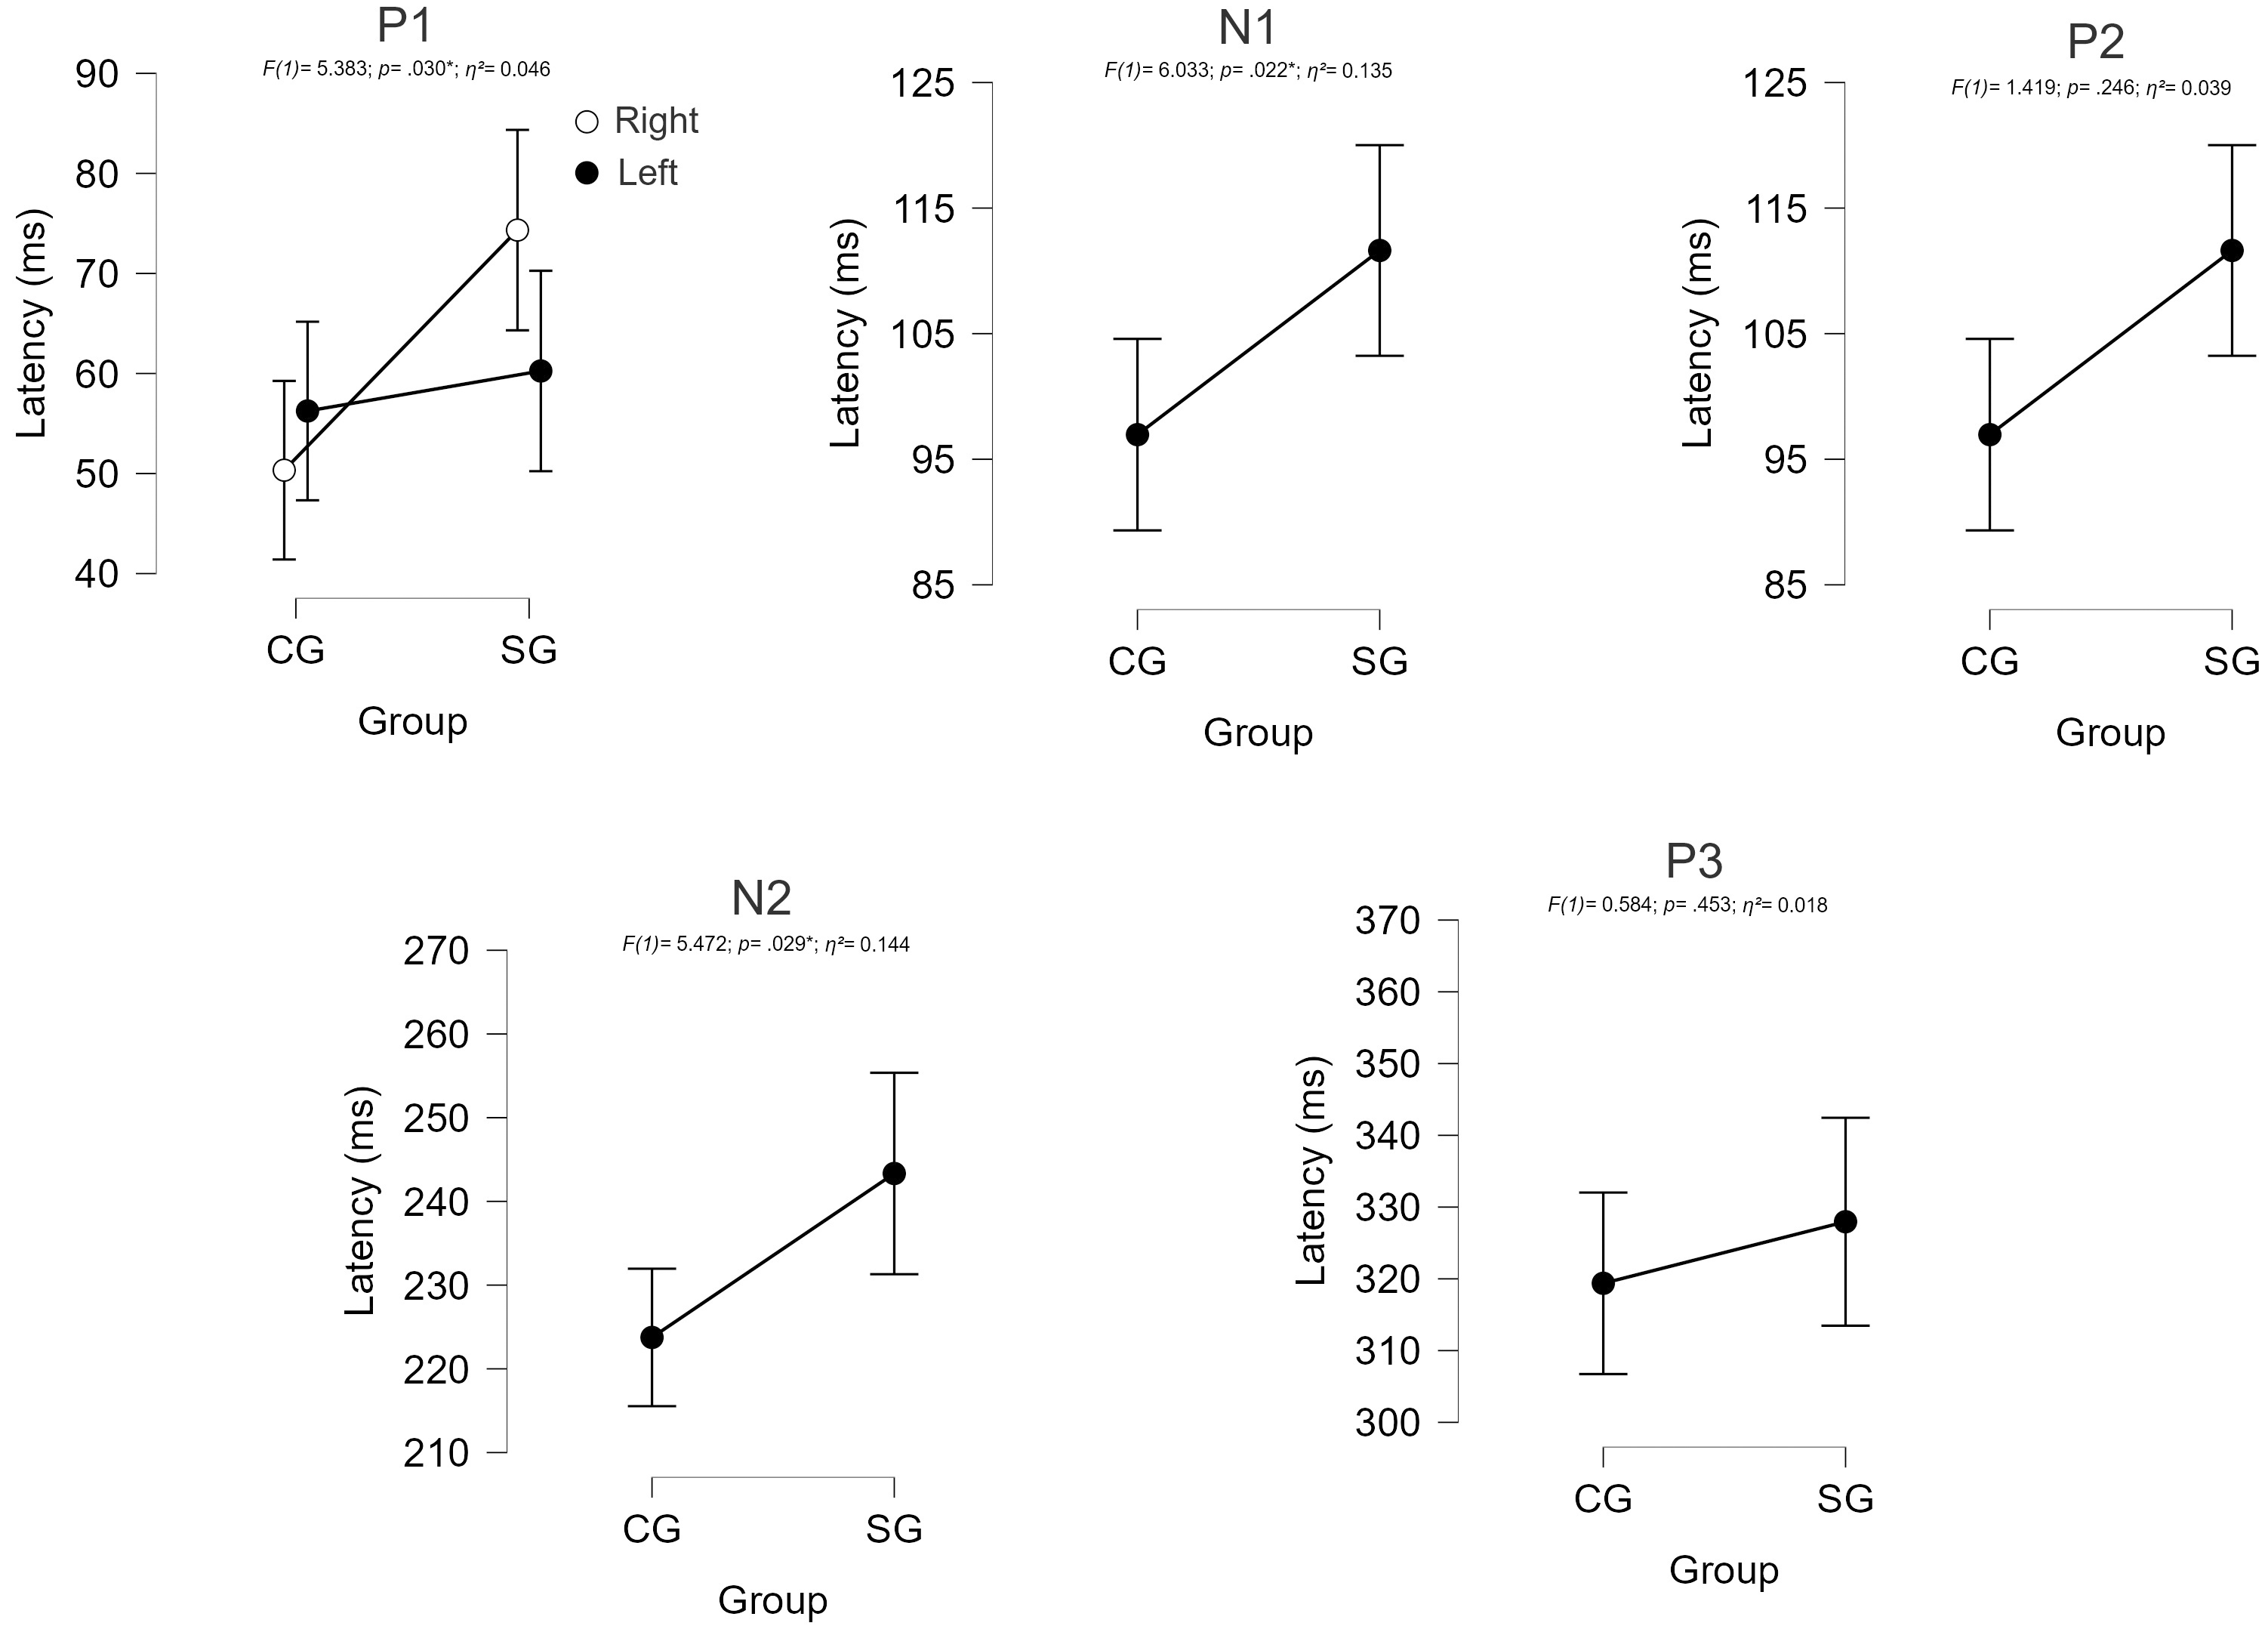 Fig. 1.
Comparison of CAEP component latencies between groups. CG, control group; SG, study group.
Table 8 shows the descriptive analysis of the P1–N1, P2–N2, and N2–P3 amplitudes values in microvolts (µV), divided by ear and by group.
| Ear | Group | Minimum | Maximum | Mean | Standard Deviation | |
| P1–N1 | Right | CG | 1.57 | 16.46 | 5.337 | 3.800 |
| SG | 0.78 | 12.14 | 4.068 | 2.999 | ||
| Left | CG | 0.97 | 10.19 | 4.799 | 2.948 | |
| SG | 0.74 | 16.33 | 4.204 | 4.182 | ||
| P2–N2 | Right | CG | 0.27 | 14.28 | 6.077 | 4.224 |
| SG | 2.14 | 12.67 | 5.957 | 3.709 | ||
| Left | CG | 0.67 | 14.51 | 5.593 | 4.363 | |
| SG | 0.93 | 11.41 | 5.353 | 3.502 | ||
| N2–P3 | Right | CG | 3.15 | 17.73 | 9.641 | 4.707 |
| SG | 0.35 | 13.80 | 6.612 | 4.472 | ||
| Left | CG | 2.77 | 24.41 | 10.717 | 6.012 | |
| SG | 0.25 | 12.18 | 6.139 | 3.997 |
Concerning amplitude measurements, there was no significant difference between
the groups for the P1–N1 (F(1) = 10.422; p = 0.475;
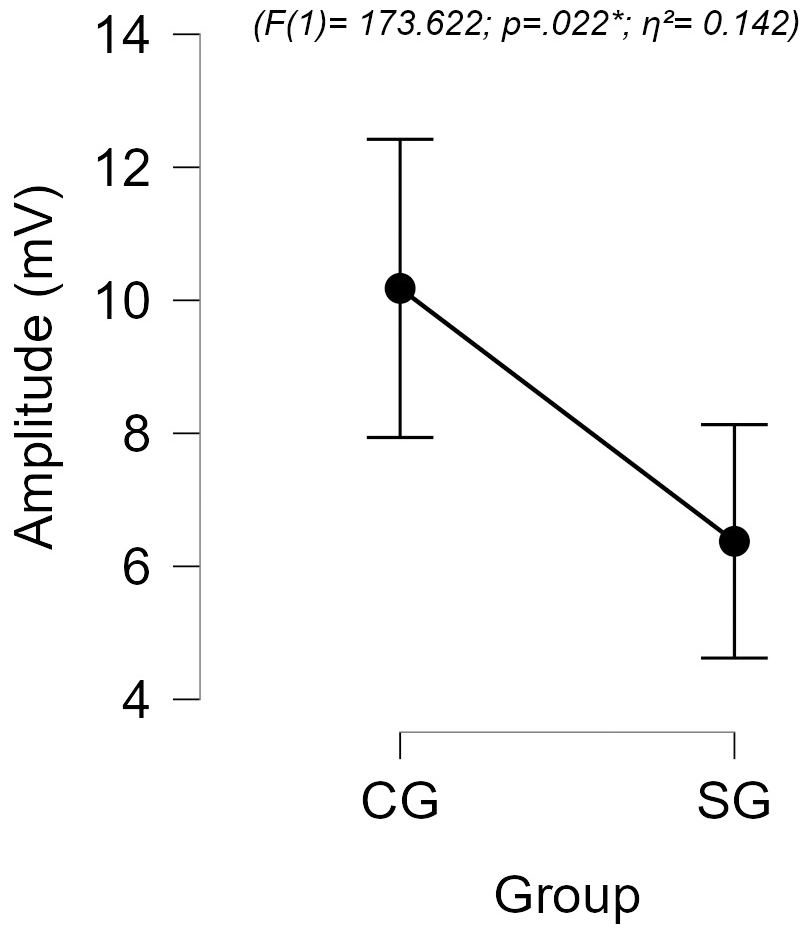 Fig. 2.
Comparison of N2–P3 amplitudes between groups.
The main alterations found on cranial MRI were in the regions of the pons, midbrain and IV ventricle. Analysis using cranial MRI showed an association between abnormal ABR results and IV ventricle alteration (p = 0.018*). In addition, three of the four individuals who had ABR alterations also had multiple foci in the pons, although no statistically significant association was observed (p = 0.576). No association was found with CAEPs.
This study aimed to evaluate the neural conduction and sound information processing in individuals with NMOSD, through the analysis of ABRs and CAEPs. Most of the sample consisted of children and adolescents with NMOSD, an age group rarely addressed in previous studies because it is a rare demyelinating disease and more prevalent in adults, which highlights the contribution of this study.
The association between AEPs and NMOSD is still unclear. Very few studies can be found in the current literature, and only a few small sample groups [19, 20] or isolated case studies [21, 22] could be identified. In addition, ABRs were primarily investigated, as only one past study was found that correlated CAEPs with NMOSD [13].
Regarding the ABR results, abnormalities were found in 33.3% of the SG, the majority showing an increase in the interpeak I–III latency, which suggests abnormalities at the lower brainstem level, between the distal portion of the auditory nerve and the cochlear nucleus. However, no statistically significant differences were observed regarding the absolute or interpeak latencies of waves I, III, and V.
The ABR results in the NMOSD population differed to those reported in the current literature, with some authors reporting no significant abnormalities [19, 21], while others reporting an increase in absolute and interpeak latencies. Altered results were reported in 42%, of which 32% showed an increase in the I–III interpeak latency, suggesting focused damage on the white matter, which, in its majority (59%), occurred only unilaterally [20]. A case report of a 40-year-old individual with NMOSD also presented, before drug treatment, abnormal ABR results in the right ear (decreased wave amplitudes), suggesting possible abnormalities in the superior olivary complex, with bilaterally normal otoacoustic emissions (evidencing cochlear integrity) and absent ipsi- and contralateral acoustic reflexes (suggesting retrocochlear impairment). After drug treatment, the patient had a slight improvement that was verified by the ABR wave V morphology, suggesting that NMOSD can affect auditory stimuli conductivity in the brainstem [22].
Such abnormalities may be related to the high degree of white matter and brainstem lesions in individuals with NMOSD, present in approximately 70% of individuals in this population [23, 24]. Severe damage to the myelin layer, often observed in NMOSD individuals [25], may also lead to deficits in bioelectric neural conduction, and therefore longer AEP latencies.
Another possible factor contributing to the abnormal findings is brainstem atrophy, which was observed in a study conducted by Lee et al. [26]. Here, the authors observed consistent brainstem volume reduction in patients with NMOSD, even when no damaged foci were found, which exposes the importance of further brainstem evaluations in this population.
Regarding the CAEP recordings, abnormalities were observed in 58.3% of the SG, and the component that showed the most change was P1. Although significant differences were observed in the P1, N1, and N2 components, longer latencies could be observed for all components, evidencing a global deficit in the processing of information. Moreover, statistically significant lower mean N2–P3 amplitudes were also observed in the SG, when compared with the CG, suggesting an impairment in the attentional response to acoustic stimuli.
Similarly, a previous study with nine children diagnosed with NMOSD also observed longer P1, N1, and N2 latencies and lower N2–P3 amplitudes, when compared with healthy controls, suggesting decreased neural conduction velocity and a lower number of neurons being activated in the process [13].
Hence, both the higher latencies and lower amplitudes of some CAEP components compared with the typical development groups suggest an impairment in the stimulus conduction in the more rostral regions of the auditory system, indicating that fewer neurons participate in these processes [27].
Such abnormalities may be related to the strong relationship between the generating sites of these components and areas frequently affected by NMOSD, such as thalamic regions, the hippocampus, and temporal regions [24]. Damage and/or hypofunction of these regions can lead to changes in CAEP components.
In addition to lesions in white matter, NMOSD leads to damage to gray matter, which may also affect the auditory temporal regions of the cortex [23, 28], evidencing the abnormalities found in the P1, N1, P2, and N2 components.
The results found in this study also highlight the central auditory processing disorder problems in individuals with NMOSD, which has special importance due to the possibility of disruption in literacy and the early schooling period of this group.
Possible abnormalities may be identified in the encoding of the auditory stimuli characteristics such as frequency and time, often associated with longer P1 latencies, in the decodification and auditory discrimination associated with longer N1 latencies and in the auditory attention associated with longer N2 latencies [18, 29].
Imaging exams revealed a correlation between abnormalities in the fourth ventricle region and abnormalities found in the ABR exams. Even with limited numbers, some relationships have already been reported by other authors, who described individuals with abnormalities in the fourth ventricle who presented increased ABR latencies [30, 31]. Due to its proximity, changes in the fourth ventricle can affect parts of the brainstem [32], which could lead to abnormal neural conduction through the brainstem.
The results also highlight the necessity of central auditory processing assessments, as well as counseling and guidance programs on strategies that can mitigate possible difficulties related to auditory processing derived from the demyelinating process, reducing listening effort and, especially, favoring performance in the school environment.
The small sample size was a limiting factor in this study. This was because NMOSD has a very low incidence rate, especially in the pediatric population, varying from about 0.01 to 0.06/100,000 people per year [33]. Furthermore, with the progression of the disease, different areas of the CNS may be affected, and different treatment methods may be selected, which leads to high variability between individuals. It is also important to note that AEPs are not a specific diagnostic method for NMOSD, hence the difficulty in their adaption as a neurophysiological biomarker.
Neurophysiological studies indicate that demyelination processes may induce a reduction in the propagation of nerve impulses, leading to impaired conductance, which results in increased latencies and reduced AEP amplitudes. Thus, abnormal AEP responses may provide clues about the location of lesions and evidentiate dysfunction along the auditory pathway, helping to confirm an organic basis for symptoms and even acting in the early identification of lesions, even before the onset of clinical symptoms [34]. Considering that MRI is a more expensive examination, which is not available in every health service, studies that investigate the effectiveness of AEPs in the detection of demyelinating diseases are essential. These studies contribute to more appropriate and accurate referrals to MRI [35], contributing to the reduction of unnecessary costs to the health system.
Thus, future investigations with a larger number of participants are necessary for better interpretation of the results. In addition, a longitudinal analysis should be considered in future studies with the aim of verifying changes in the neural response during follow-up of the disease.
Alterations in neural conduction and sound information processing were observed in individuals with NMOSD, with these patients taking longer to transmit sound and process acoustic stimuli from the brainstem to the thalamocortical regions. In addition, individuals with NMOSD had a slower, less active neural network, for the attentional response to stimuli than their peers. The AEPs are important instruments for the identification of central auditory dysfunction in this population as well as to monitor disease evolution.
NMOSD, Neuromyelitis optica spectrum disorder; CNS, Central nervous system; MS, Multiple Sclerosis; IgG, immunoglobulin G; AQP4, Aquaporin-4; MRI, Magnetic resonance imaging; AEP, Auditory evoked potentials; ABR, Auditory brainstem response; CAEP, Cortical auditory evoked potentials; SG, Study Group; CG, Control Group; CSF, Cerebrospinal fluid.
Additional data will not be shared due to the privacy safety of the patients involved.
LPM: writing — original draft; writing — review & editing; visualization; investigation. LAFS: formal analysis; investigation; visualization; writing — review & editing. DANB: conceptualization; data curation; formal analysis; investigation; methodology; writing — review & editing. GAM: writing — review & editing; visualization; investigation; data curation. AGS: methodology; visualization; writing — review & editing. CGM: conceptualization; investigation; methodology; project administration; supervision; validation; visualization; writing — review & editing. All authors read and approved the final manuscript. All authors have participated sufficiently in the work and agreed to be accountable for all aspects of the work.
The study was approved by the Faculty of Medicine (FMUSP), University of Sao Paulo’s Research Ethics Committee under the number 1.784.31, 20/10/2016. (CAPPESQ HCFMUSP (Comissão de Ética para Análise de Projetos de Pesquisa do HCFMUSP)). The study was carried out in accordance with the guidelines of the Declaration of Helsinki and informed consent was obtained from all participants involved in the study.
We would like to thank the patients who participated in the study and to Dr. José Albino da Paz for all his contributions.
This research received no external funding.
The authors declare no conflicts of interest.
Supplementary material associated with this article can be found, in the online version, at https://doi.org/10.31083/JIN27733.
Publisher’s Note: IMR Press stays neutral with regard to jurisdictional claims in published maps and institutional affiliations.