
- Academic Editor
†These authors contributed equally.
The conversion of pyruvate to lactate is primarily catalyzed by lactate-dehydrogenase-5 (LDH-5), which comprises four lactate-dehydrogenase-A (LDHA) subunits. However, the mechanism of LDH-5 in tuberculous meningitis (TBM) remains elusive.
Thirty-two samples of cerebrospinal fluid (CSF) were collected, including 15 from individuals without central nervous system (CNS) infectious diseases (control group) and 17 from individuals with TBM (TBM group). Based on the results of brain imaging, nine patients with TBM with meningeal enhancement were included in the meninges group. Eight patients with TBM with lesions in the brain parenchyma were included in the brain parenchyma group. The levels of adenosine triphosphatase (ATP), lactate, LDH-1, pyruvate and LDH-5 in the CSF were assessed. Subsequently, the levels of ATP, pyruvate and lactate, as well as the amplitude and frequency of action potentials (APs) in neurons overexpressing LDHA, were investigated.
Reduced levels of pyruvate and ATP and elevated levels of lactate and LDH-5 were observed in the CSF of individuals with TBM. The ATP level was decreased in the brain parenchyma group. In neurons with LDHA overexpression, the lactate level increased, while ATP and pyruvate levels, as well as the amplitude and frequency of APs, decreased.
Elevated levels of LDH-5 in the CNS of individuals with TBM may lead to a disturbance in brain energy and negatively affect neuronal activity.
Tuberculosis (TB) is an infectious disease caused by Mycobacterium tuberculosis (Mtb) [1]. Tuberculous meningitis (TBM) is regarded as a severe form of TB. Despite rapid treatment, approximately 50% of patients with TBM die or experience severe neurological aftereffects [2]. Such neurological sequelae, include hydrocephalus, stroke, seizures and tuberculoma that lead to severe neurological symptoms in patients and seriously affect their quality of life [3]. Neuronal damage is considered the main cause of neurologic symptoms [4]. However, neurons that play a key role in the central nervous system (CNS) are non-regenerative [5]. Non-regenerative neurons are also essential in irreversible neurological disorders. Therefore, protecting neurons has become an important challenge in TBM treatment.
During CNS damage and disease development, neuronal dysfunction is often accompanied by disorders of energy metabolism [6]. Sustained energy metabolism disorders can drive neuronal damage, while correcting energy metabolism helps to protect neurons [7]. When glucose and lactate are available, neurons tend to preferentially use lactate for energy metabolism, producing adenosine triphosphate (ATP) [8]. Under normal physiological conditions, the lactate and ATP levels in the brain are positively correlated [8]. However, there is a negative correlation between ATP and lactate levels in infectious CNS diseases. A previous study demonstrated increased lactate levels [9] and decreased ATP levels in the cerebrospinal fluid (CSF) of patients with infectious CNS diseases [10]. The mechanism underlying the negative correlation between CNS lactate and ATP levels in infectious CNS diseases remains unclear.
The lactate metabolism process in neurons is highly complex. The conversion of lactic acid to ATP is closely linked to lactate dehydrogenase (LDH), a homotetrameric or heterotetrameric enzyme composed of two subunits: LDHA and LDHB [11]. Four subunits of LDHA form LDH-5 and four subunits of LDHB form LDH-1 [12]. Under the action of LDH-1, neurons convert lactate into pyruvate, which is further oxidized to acetyl coenzyme A in the mitochondria, which enteris the tricarboxylic acid cycle and generates ATP [13]. Additionally, pyruvate is converted to lactate, which does not provide energy for neurons, by the action of LDH-5 [14]. Currently, alterations in lactate metabolism in the brain of patients with TBM, including the levels of pyruvate, LDH-1, LDH-5 and ATP, remain unclear.
To further investigate the alteration of lactate metabolism in patients with TBM and provide new perspectives for protecting and treating the CNS, CSF was first collected from individuals with TBM and changes in lactate, pyruvate, LDH-1, LDH-5 and ATP levels in the brain were assessed. Finally, according to the characteristics of the CSF, an in vitro model of neurons was established to explore the effects of LDH-1/5 on neurons.
Cases were collected from hospitalized patients at the Fourth
People’s Hospital of Nanning from June 2021 to June 2024. Thirty-two CSF samples,
including 15 samples from individuals without CNS infectious diseases (Ctrl
group) and 17 samples from individuals with definite TBM (TBM group), were
collected. The individuals in the Ctrl group included 15 with ischemic stroke
(non-acute phase). The final diagnosis of the 17 individuals without
antituberculosis therapy in the TBM group was based on positive CSF test results
(Mtb isolation in CSF culture and positive molecular biology of
Mtb in CSF). Informed consent was obtained from all 32 patients or their families/legal guardians. The TBM stage was stratified based on International Consensus and British
Medical Research Council criteria [15, 16]: stage I, Glasgow Coma Scale (GCS) 15
or no focal neurological signs; stage II, GCS 11–14 or GCS 15 with focal
neurological signs; stage III, GCS
Intracranial pressure (reference: 80–180 mm H2O) and CSF laboratory data
were collected, including white cell counts (reference: 0–5
The levels of lactate, pyruvate, ATP, LDH-5 and LDH-1 were evaluated using enzyme-linked immunosorbent assay kits (Boshen Biotechnology, Nanjing, Jiangsu, China). Item codes of the kits were: BS-E4820H1, BS-E5562H1, BS-E4835H1, BS-E7114H1 and BS-E7110H1. Lactate, pyruvate, ATP, LDH-5 and LDH-1 levels were measured using a microplate reader (Infinite F50; TECAN, Männedorf, Switzerland).
The neuronal culture method was based on previous studies [7, 17]. Newborn rats
(24 h old) were bought from the Animal Laboratory Center of the Guangxi Medical
University. Lentiviruses (LV) with green fluorescence, negative control (NC,
titer: 4.62
After immobilization, impregnation and blocking, neurons were incubated with the primary antibody, anti-neuron-specific enolase (NSE) antibody 1:50 (A02930, BOSTER, Wuhan, Hubei, China). Neurons were then incubated with the secondary antibody, DyLight 594 Conjugated Avidin 1:500 (BA1143, BOSTER, Wuhan, Hubei, China). Fluorescence signals, including transfected cells (green) and neurons (red), were obtained using a microscope (BX53, OLYMPUS, Tokyo, Japan).
The specific steps of sodium dodecyl-sulfate polyacrylamide gel electrophoresis were followed according to previous studies [7, 17, 18]. The primary antibodies used were anti-LDHB antibody 1:1000 (D164590, Sangon Biotech, Shanghai, China), anti-LDHA antibody 1:1000 (D164055, Sangon Biotech, Shanghai, China) and anti-alpha-tubulin antibody 1:10,000 (ab7291, Abcam, Cambridge, UK). Subsequently, nitrocellulose membranes were incubated with a secondary antibody 1:2500 (#5151, CST, Wuhan, China). The band intensities of Western blot images were quantified using ImageJ software (version 1.8.0.345, National Institutes of Health, Bethesda, MD, USA). Protein levels were determined using a normalized tubulin-loading control.
The lactate, pyruvate, and ATP levels of neurons were detected using an assay kit [19, 20, 21] acquired from Solarbio (Beijing, China). Item codes of kits were: BC2235, BC2205 and BC0305. Data for neuronal lactate, pyruvate and ATP were obtained using a microplate reader (infinite F50, TECAN, Männedorf, Switzerland).
The neuronal action potentials (APs) were recorded using a Digidata patch-clamp
amplifier (1550B, Molecular Devices, San
Jose, CA, USA) and the Axon Digidata 16-bit data acquisition system (1550B,
Molecular Devices, San Jose, CA, USA). A P97 Sutter Instrument (P-97, Sutter Instrument Company, Novato, CA, USA) was used to make
patch electrodes (3–6 M
Continuous variables are given as mean
The age, CSF-glucose and CSF-LDH5 data were normally distributed. The remaining
data were non-normally distributed. Intracranial pressure and
CSF data for the Ctrl and TBM groups are given in Fig. 1. Significantly higher
intracranial pressure was observed in the TBM group (Fig. 1B; versus Ctrl,
p
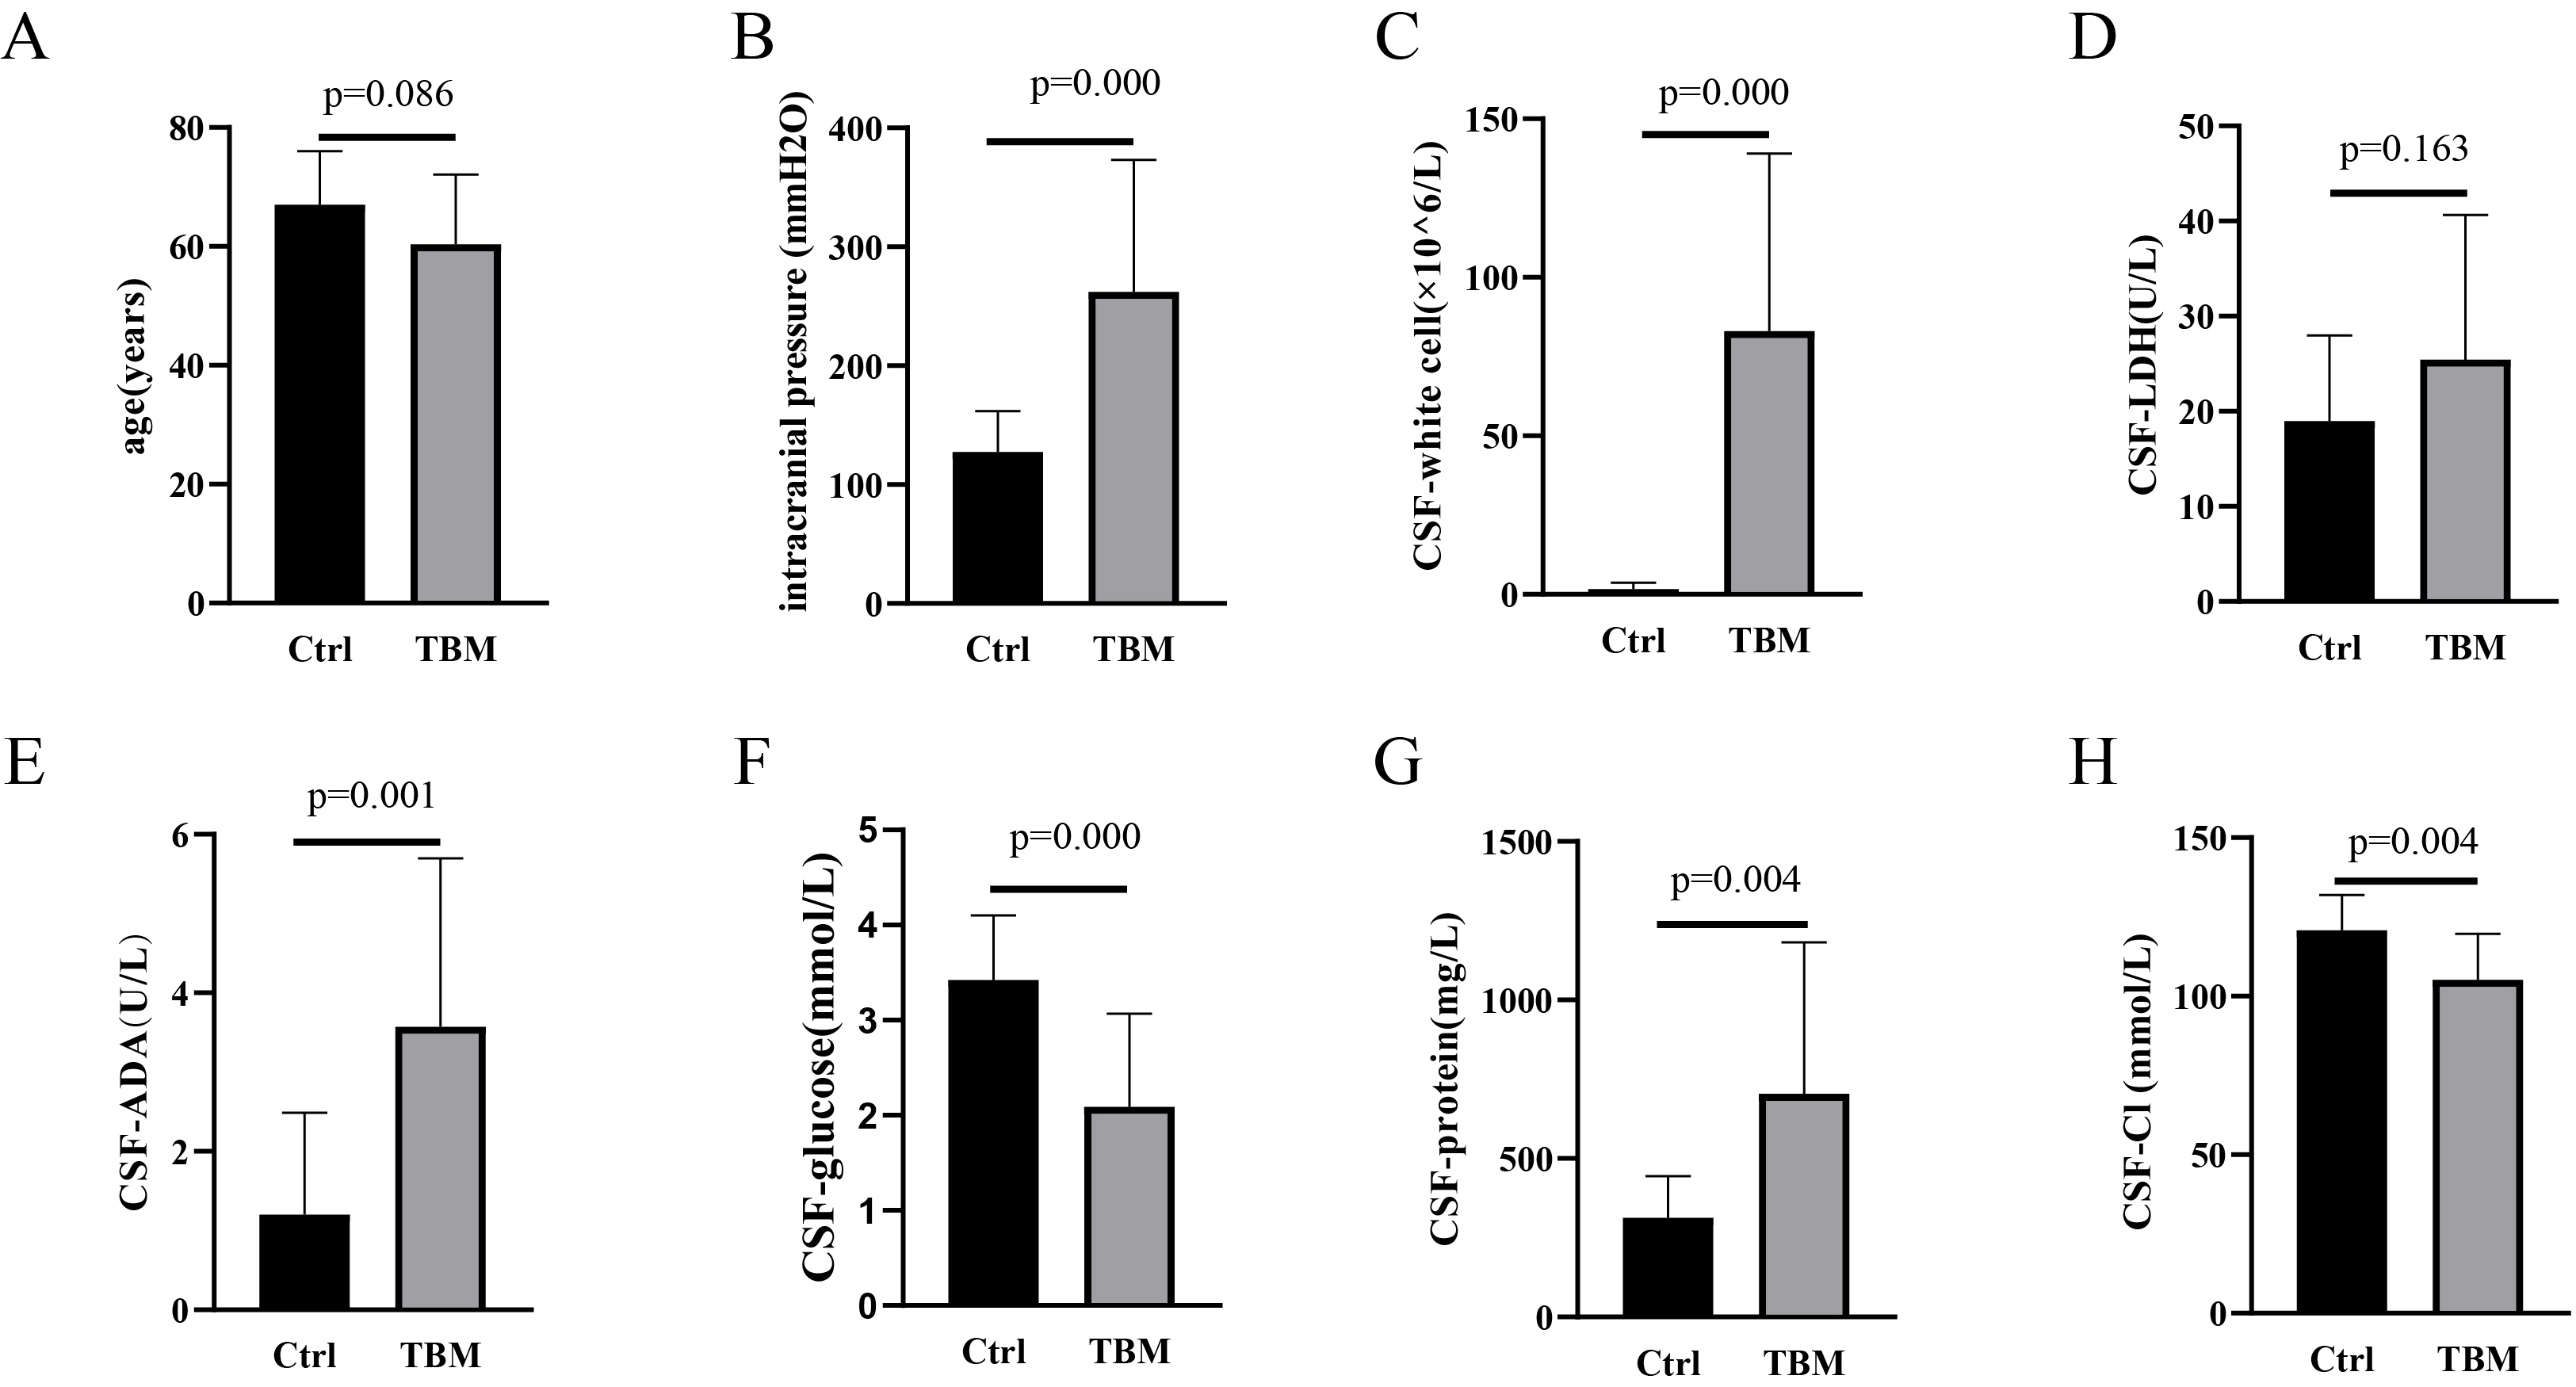 Fig. 1.
Characteristics of population and CSF between Ctrl and TBM groups. (A) Age, (B) Intracranial pressure, (C) CSF-white cell counts, (D) LDH level, (E) ADA level, (F) Glucose level, (G) Protein level and (H) Cl level between Ctrl and TBM groups. CSF, cerebrospinal fluid; TBM, tuberculous meningitis; LDH, lactate dehydrogenase; ADA, adenosine dehydrogenase; Cl, chloride.
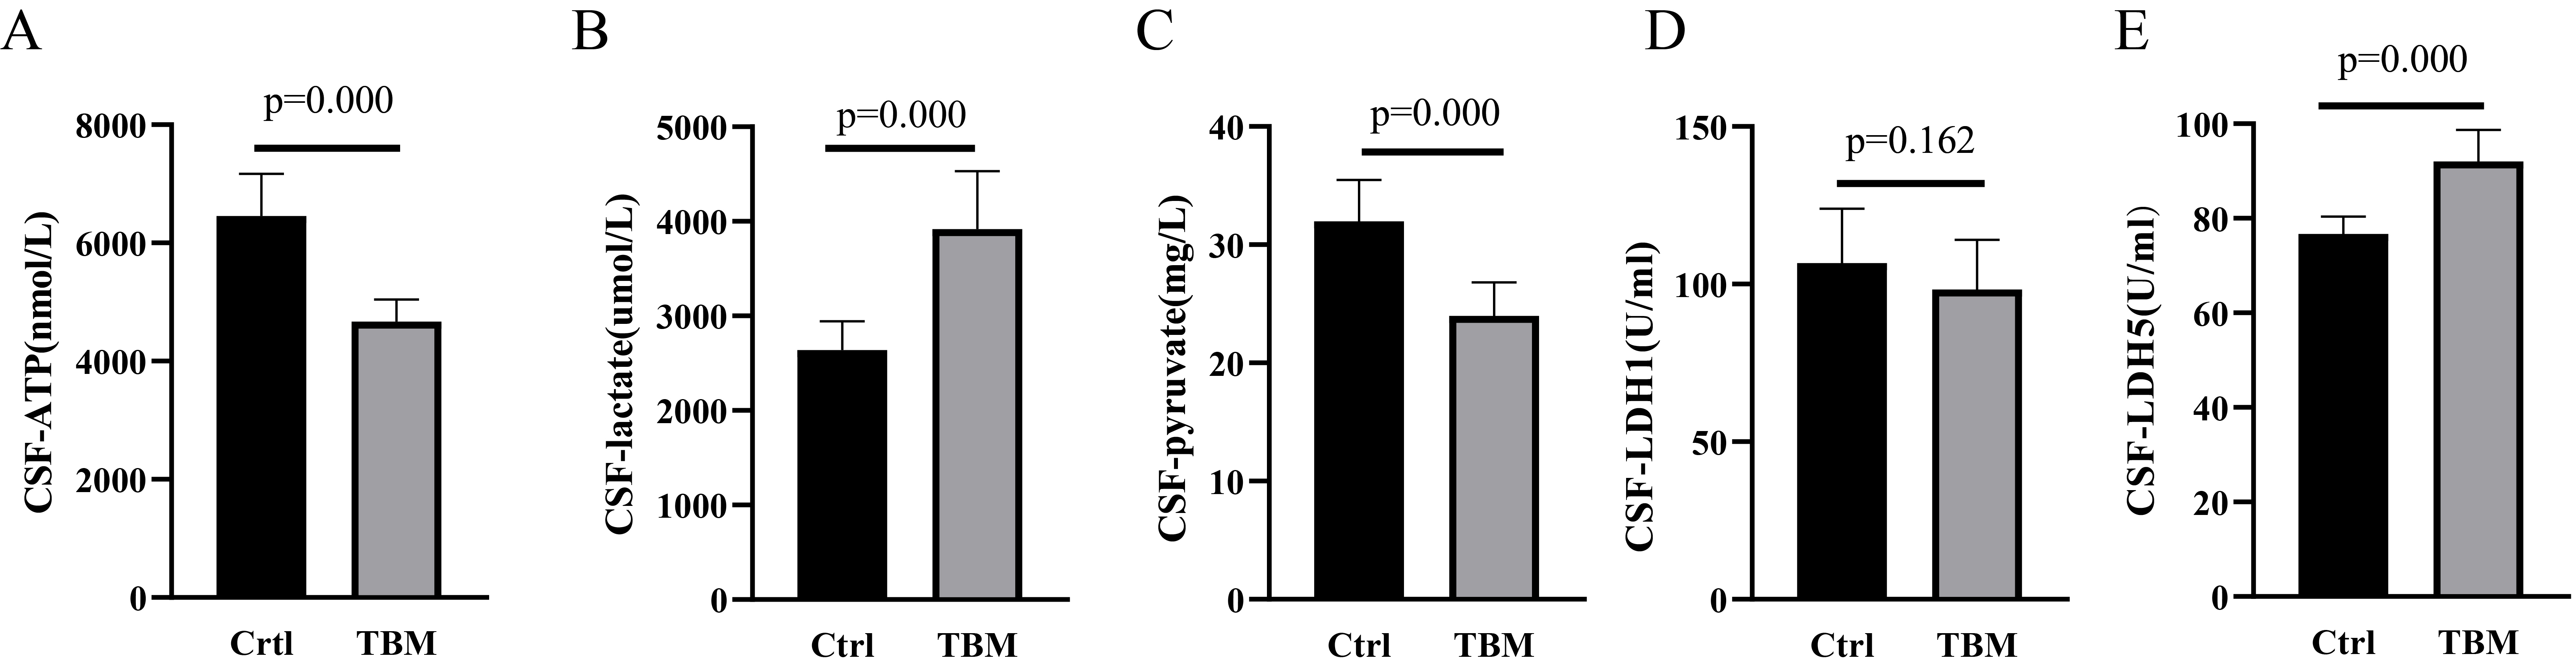 Fig. 2.
Lactate, pyruvate, ATP, LDH-1 and LDH-5 levels between Ctrl and TBM groups. (A) ATP, (B) Lactate, (C) pyruvate, (D) LDH-1, and (E) LDH-5 levels between Ctrl and TBM groups. ATP, adenosine triphosphatase.
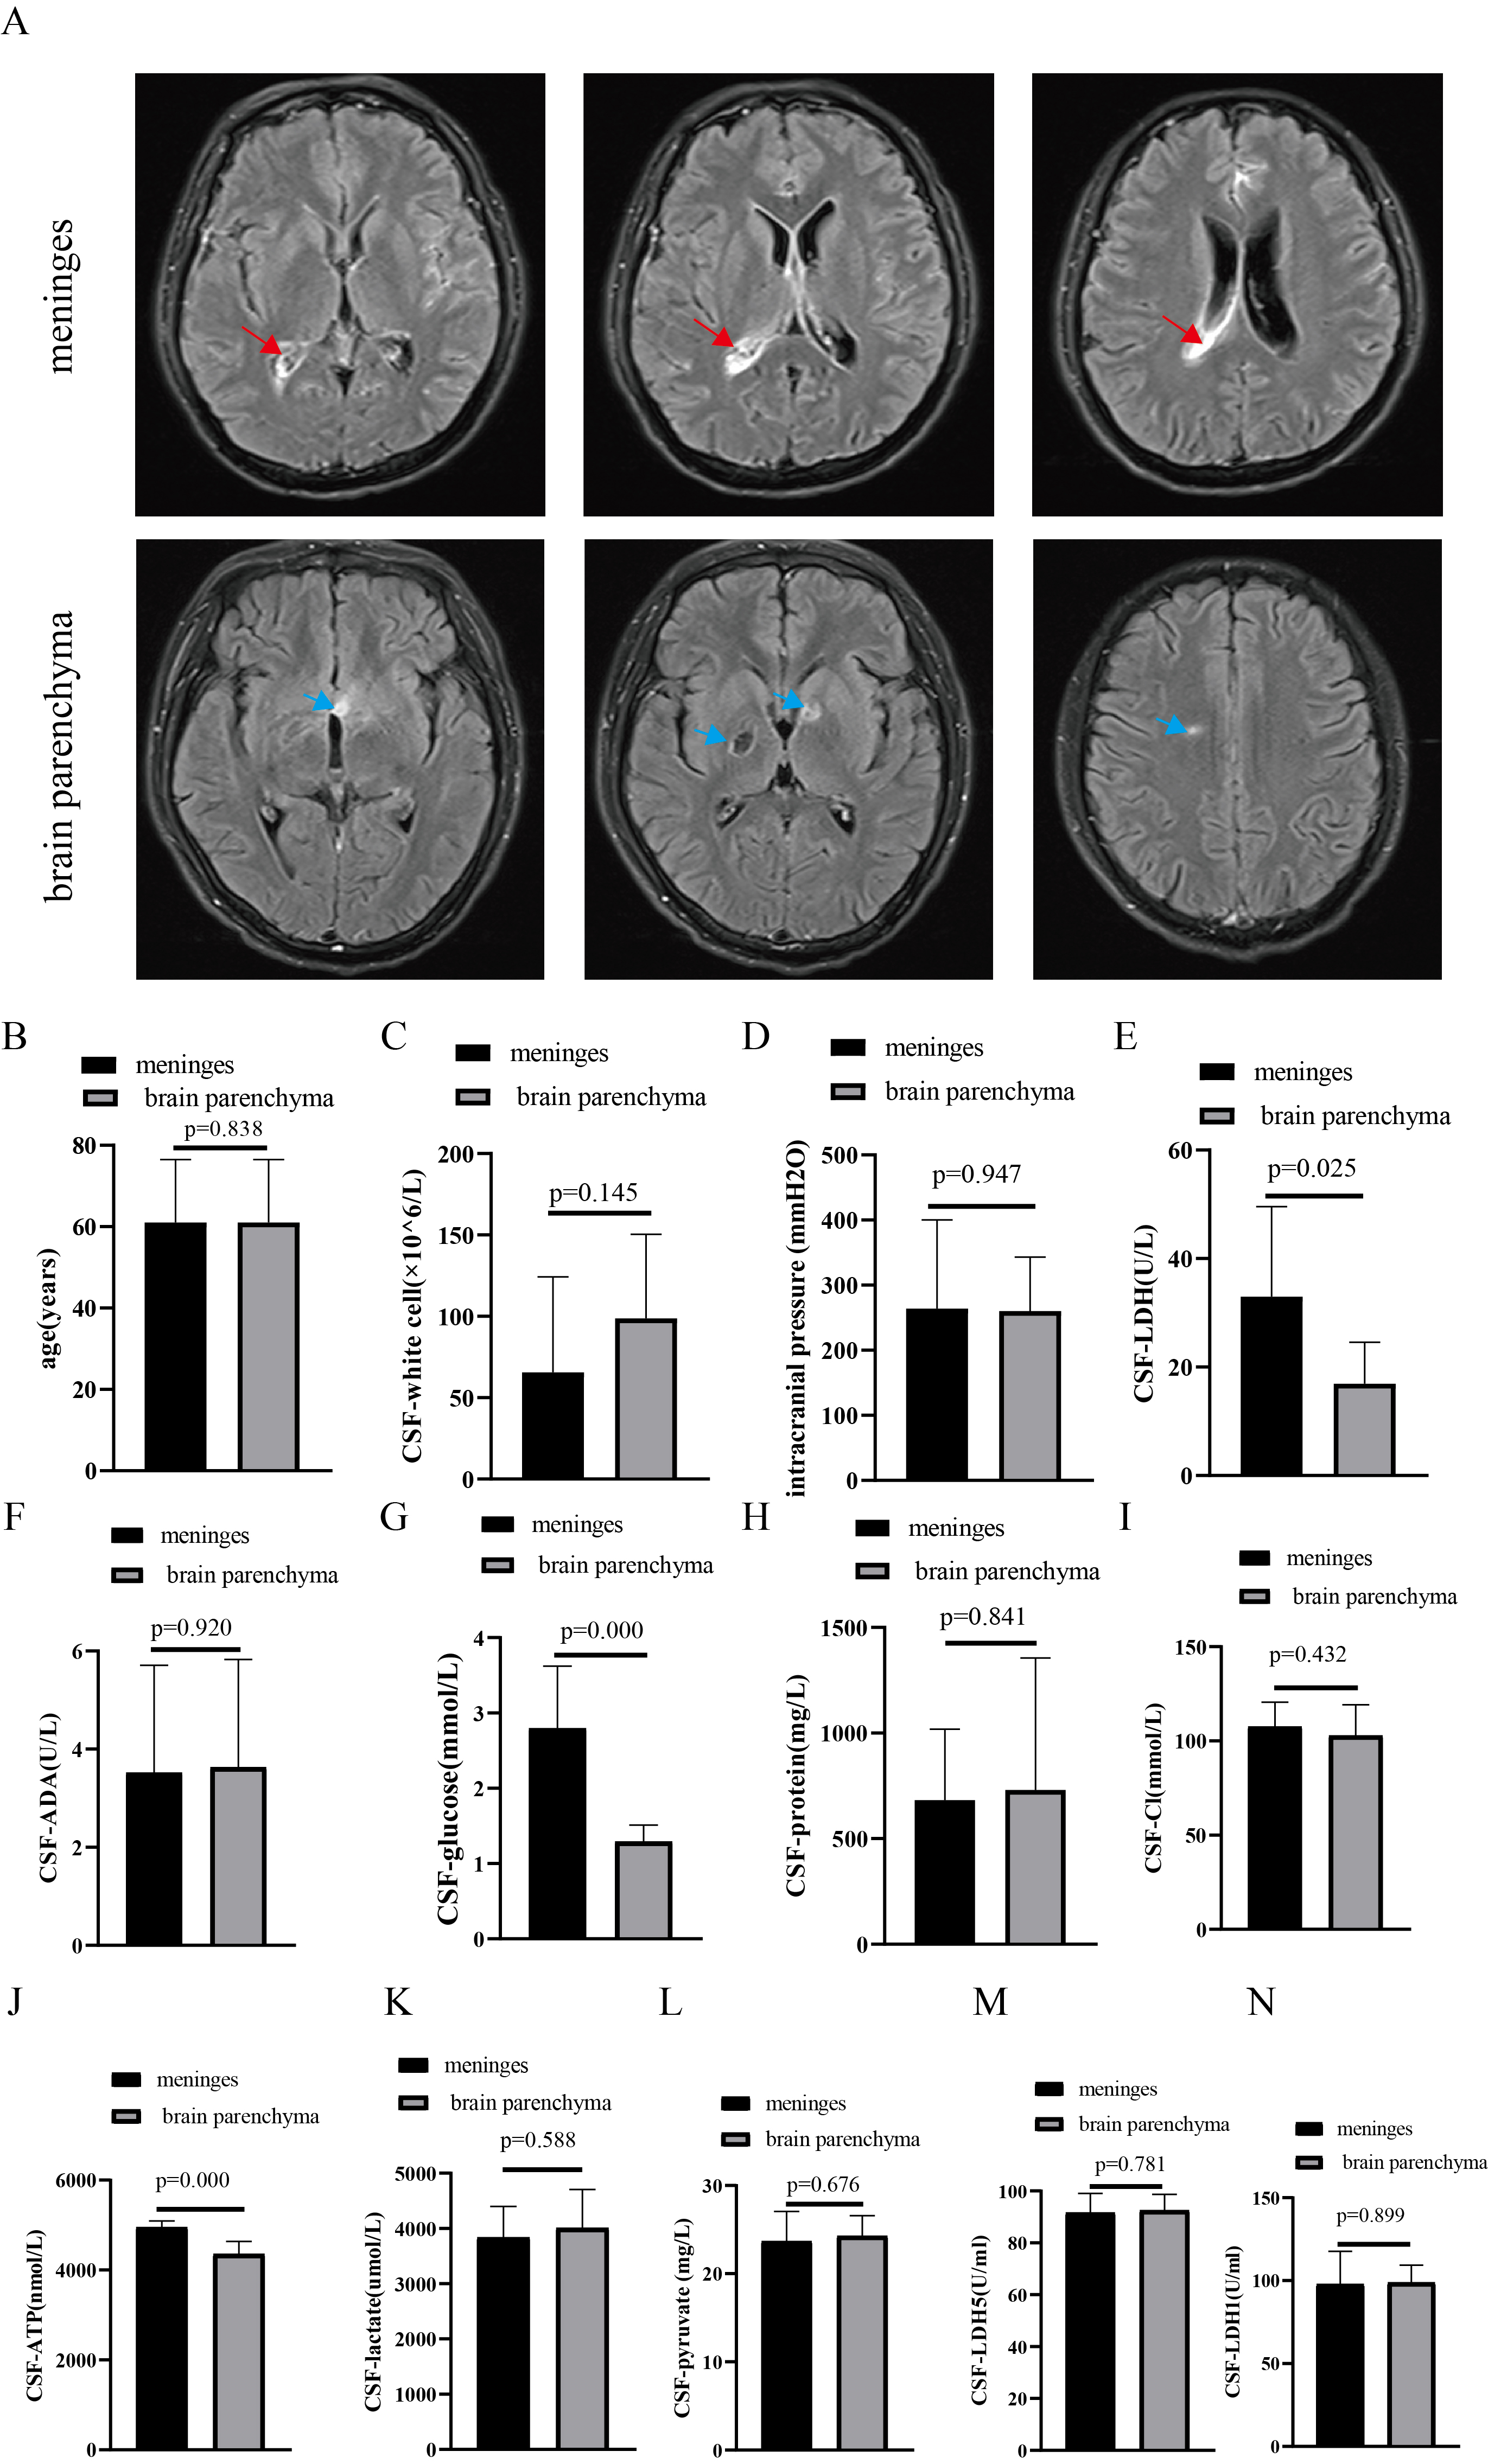 Fig. 3.
Comparison of population and CSF between meninges and brain parenchyma groups. (A) Brain MRI (red arrow, meningeal enhancement; blue arrow, brain parenchyma’s lesions), (B) Age, (C) CSF-white cell counts, (D) Intracranial pressures, (E) LDH level, (F) ADA level, (G) Glucose level, (H) Protein level, and (I) Cl level, (J) ATP, (K) Lactate, (L) Pyruvate, (M) LDH-5 and (N) LDH-1 levels between Ctrl and TBM groups. MRI, magnetic resonance imaging.
Both green and red fluorescence were observed in neurons, suggesting that
neurons were successfully transfected by LV (Fig. 4A). Western blot results
showed that LDHB expression in neurons of the OE-LDHA group was not significantly
changed. However, LDHA expression was significantly increased (Fig. 4B; versus
NC, p
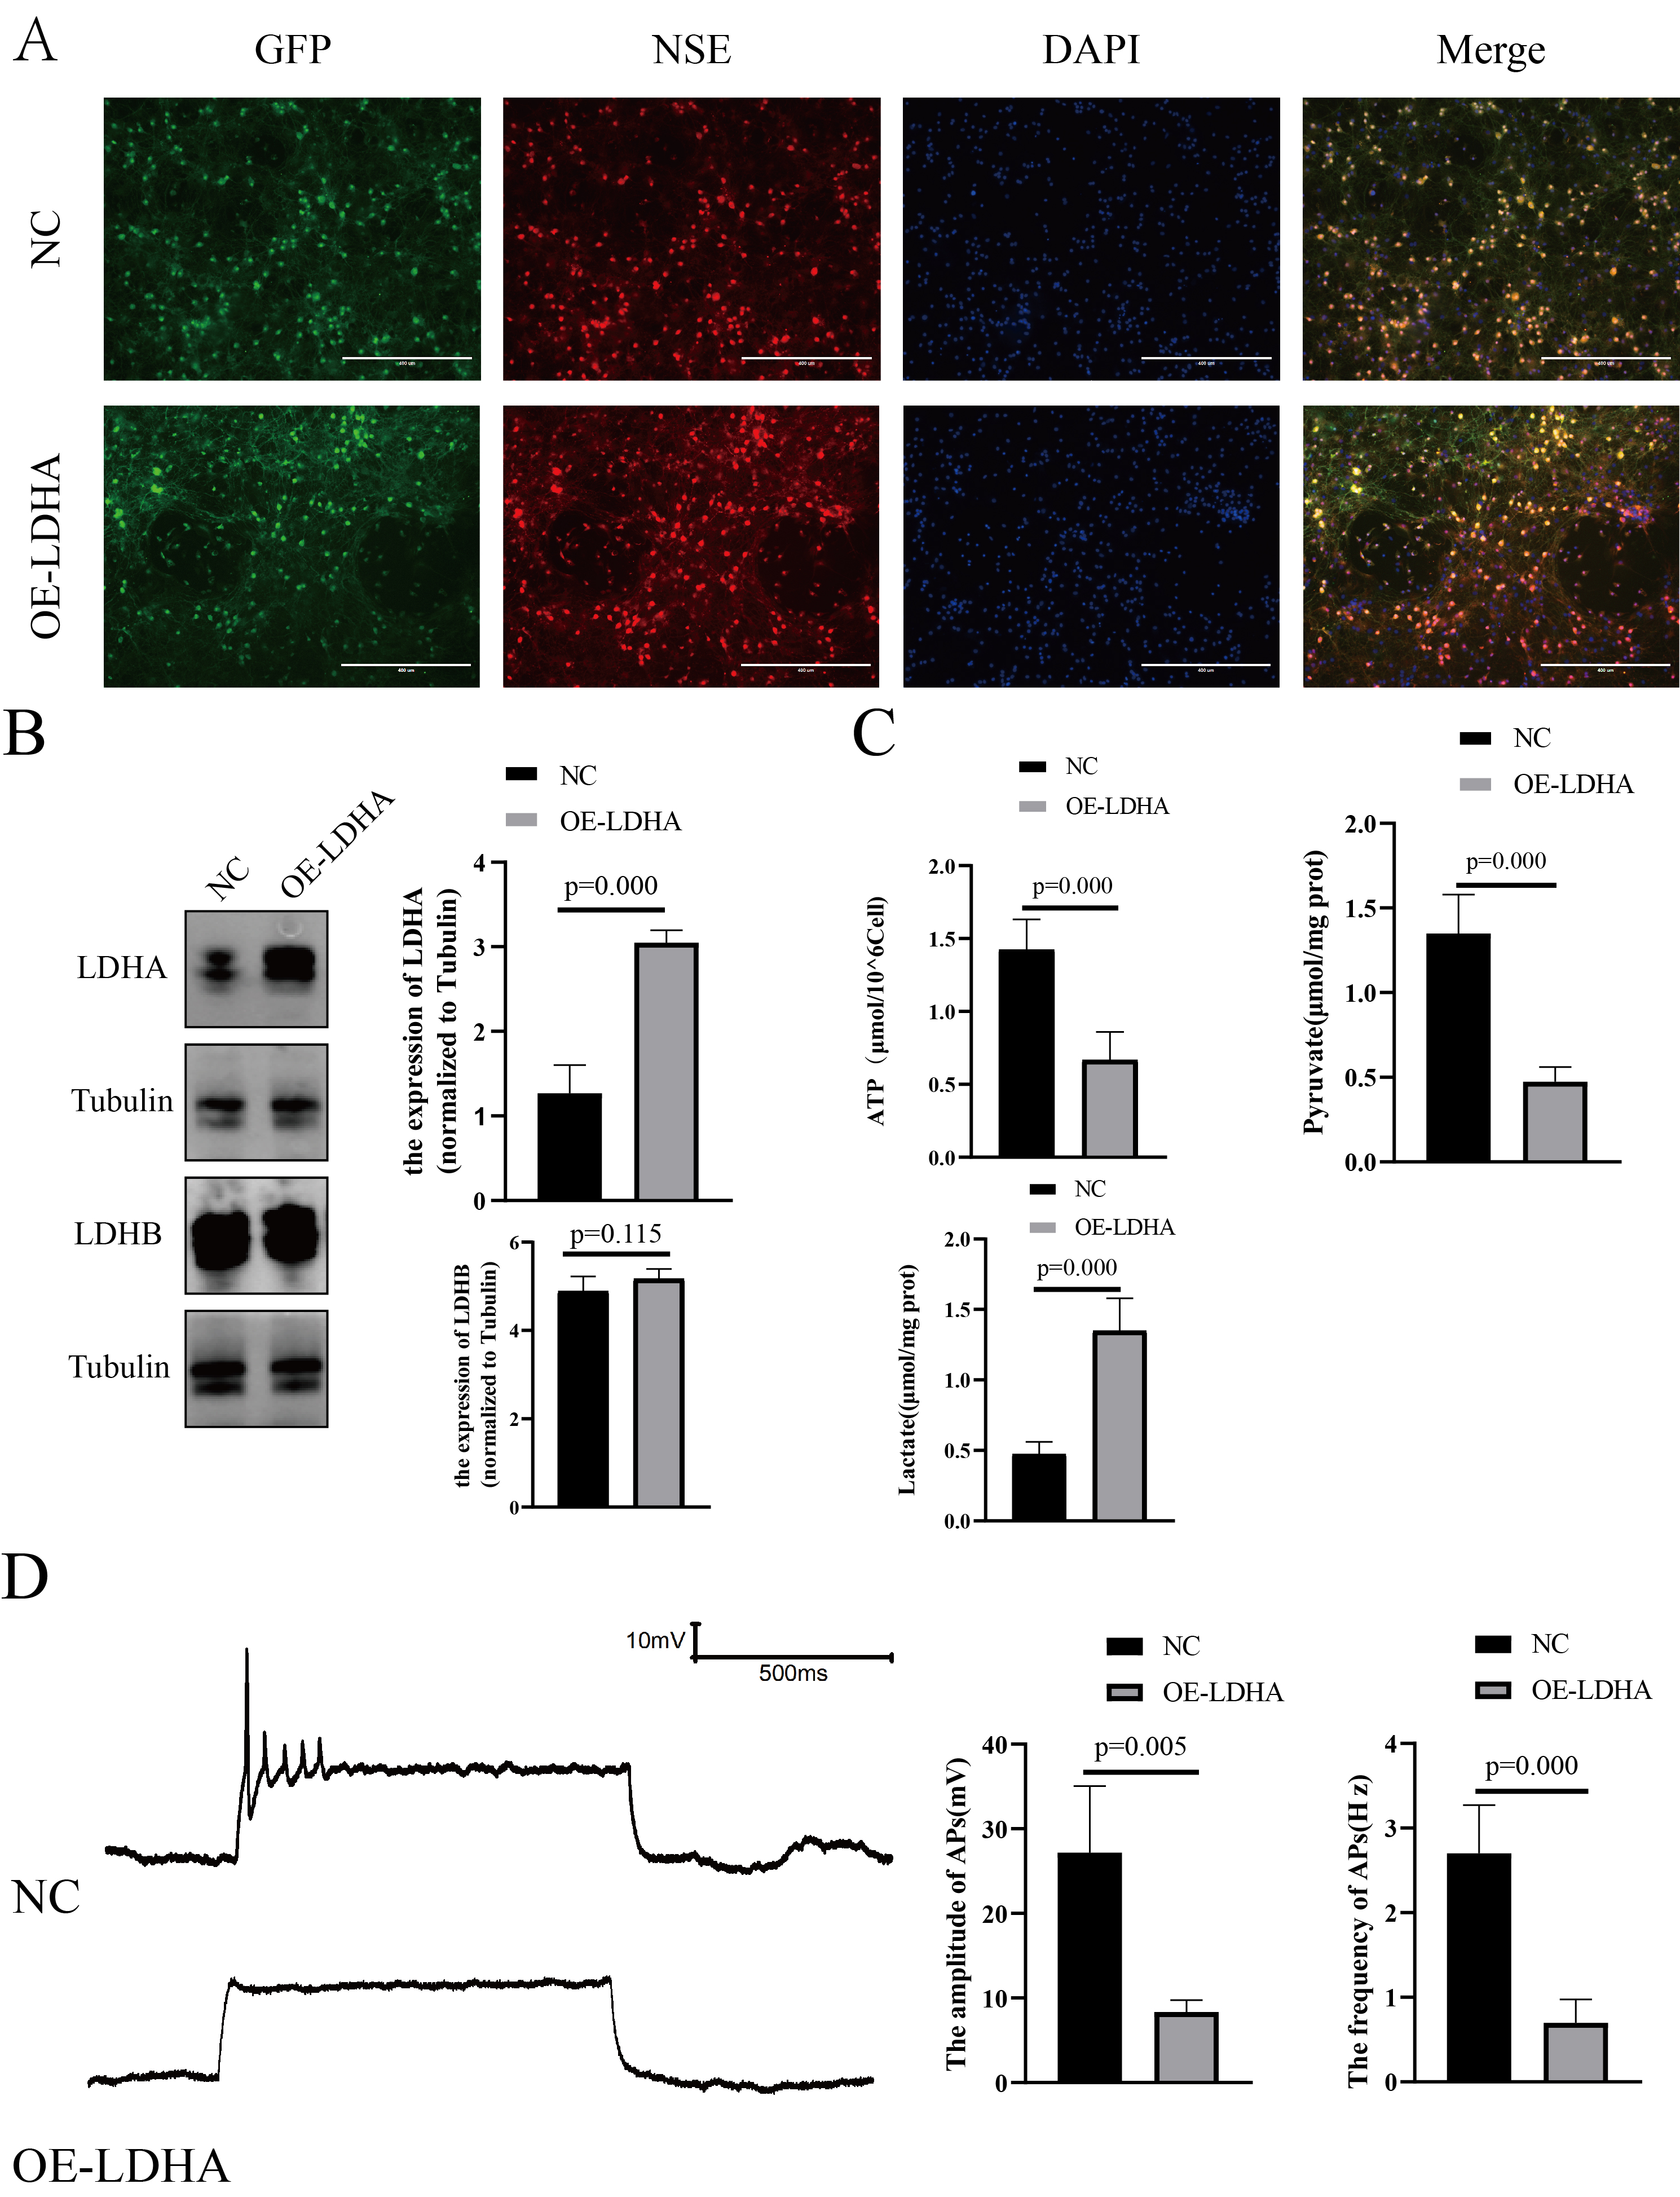 Fig. 4.
In vitro model of neurons overexpressing LDHA. (A)
Neuronal fluorescence (
CSF data are considered to play an essential role in TBM diagnosis and treatment. An increased white cell count in the CSF is a common TMB phenomenon, which suggests that the CNS is infected by pathogenic microorganisms [22]. A similar phenomenon was observed in this study. The ADA level was found to be increased in the TBM group. The higher levels of ADA involved in purine metabolism, including purine synthesis, recycling and degradation, indicate cell damage and abnormal purine metabolism [23]. In the TBM group, changes in intracranial pressure and protein, glucose and Cl levels were consistent with those previously reported [1, 24]. Higher intracranial pressure indicates that the brain may be experiencing edema [25], suggesting these patients should receive dehydration treatment. A higher CSF-protein level is considered to indicate the severity of inflammation in the brain [26], which is a common phenomenon in patients with CNS infections [27, 28]. Wang et al. [29] indicated that Mtb reproduction required the consumption of large amounts of glucose from the external environment. A lower glucose level may alter the patient’s internal environment by affecting glucose-sensing neurons in the hypothalamus, causing decreased Cl [30]. A previous study revealed that the reproduction of Mtb appears to require a high intake of Cl [31], which may be responsible for the CSF reduction of Cl. Unfortunately, lower Cl may prevent the host’s immune system from clearing Mtb and may also affect the effectiveness of anti-TB drugs [32].
Mtb consumes cerebral glucose, which may cause elevated cerebral lactate [33]. Additionally, Mtb leads to energy metabolism disorders in the CNS, which may intensify neuronal damage [7]. Mtb invasion of the CNS leads to decreased brain glucose levels [34], resulting in reduced ATP production in the brain and a lack of energy supply to neurons. Upon entering the brain through glucose transporter 1 on vascular endothelial cells, peripheral blood glucose is taken up by glucose transporter 3 on the surface of neurons to undergo a series of biological processes, such as glycolysis and entering the tricarboxylic acid cycle, ultimately generating ATP to provide energy to neurons [8]. A reduction in ATP levels in CSF was observed in individuals with TBM, which may be associated with decreased glucose levels in the CSF. Interestingly, the glucose and ATP levels were significantly lower in the brain parenchyma group. A previous study [27] demonstrated that levels of CSF-glucose were significantly decreased in patients with infectious CNS diseases with structural damage to the brain. The lower cerebral glucose and ATP levels in TBM patients with brain parenchymal injury may be associated with structural damage to the brain parenchyma.
Decreased ATP levels in the CNS were influenced by various factors and besides decreased glucose, abnormal lactate metabolism may play a significant role [35]. Abnormal lactate levels in the brain were observed in patients with TBM [36]. CSF lactate levels could serve as a predictor for the definite diagnostic classification of TBM [37]. Faried et al. [38] found that higher levels of lactate in CSF corresponded to a lower Glasgow Outcome Scale and a poorer prognosis for patients. Consequently, brain lactate level serves as an auxiliary diagnostic factor for TBM and plays a crucial role as a prognostic indicator. In this study, the elevated lactate levels in the CSF of patients with TBM were consistent with the results of Abassi et al. [9]. A previous study showed that neurons preferentially use lactate for aerobic metabolism to generate ATP when both glucose and lactate are present [4]. This suggests that a positive correlation exists between lactate and ATP levels in the brain [8]. However, a negative correlation between lactate and ATP levels in the CNS of individuals diagnosed with TBM was observed.
Lactate metabolism is considered an essential part of the brain energy metabolism pathway. Glucose entering the brain can be converted into lactic acid in astrocytes and discharged from these cells for direct uptake by neurons [13]. Further, neurons directly take up glucose in peripheral blood via glucose transporter 3 and convert it to lactate [7]. The conversion of lactate to ATP requires a series of complex biological processes. After neurons ingest lactic acid, it is converted into pyruvate under the action of LDH-1 and pyruvate is then oxidized into acetyl-CoA in the mitochondria, which enters the tricarboxylic acid cycle and generates ATP [13]. Another LDH subtype, LDH-5, performs the opposite function by converting pyruvate into lactate [7].
Further analysis of the CSF of patients with TBM revealed a decrease in pyruvate levels and an increase in LDH-5 levels, while a changes in LDH-1 levels were not significant. This suggests that increased lactate and decreased pyruvate levels in patients with TBM may be correlated with increased LDH-5 levels. The increased LDH-5 level leads to more pyruvate being reversely converted into lactate, resulting in reduced precursor compounds for the tricarboxylic acid cycle to effectively generate ATP and provide sufficient energy for the brain. To further verify the effects of changes in LDH-5 levels on neurons, in vitro neuronal models were constructed with LDHA overexpression. An increased LDHA and decreased pyruvate and ATP levels were found in neurons in the OE-LDHA group, consistent with clinical data. This result suggested that increased LDHA promotes increased lactate, which in turn inhibits pyruvate production and ultimately reduces ATP levels, leading to insufficient energy supply for neurons. Elevated levels of LDHA may also disturb lactate metabolism and affect the electrophysiological activity of neurons.
Neurons are considered the most important part of the CNS, playing a key role in the reception and transmission of signals, with their energy supply derived from ATP [39]. Na+/K+-ATPase is vital for neuronal energy metabolism, which is thought to be related to neuronal activity [40]. The transport of Na+ and K+ ions, which consumes up to 70% of ATP, is considered a key factor in AP formation [41]. Patch clamp was applied to evaluate neuronal APs and understand the effects of LDHA on neurons. Electrophysiological results demonstrated that LDHA overexpression resulted in a significant decrease in the amplitude and frequency of neuronal APs, suggesting inhibition of neuronal activity.
Nevertheless, this study has limitations that must be addressed. First, the number of clinical samples used was small. Second, there is no in-depth study on the CNS energy metabolism of TBM based on in vitro and in vivo models of TBM. Finally, the damage, edema and metabolic alterations of glial and myelin should also be considered.
Elevated LDH-5 levels in the CNS of individuals with TBM may both lead to disturbances in brain energy and negatively affect neuronal activity.
The datasets used and analyzed during the current study are available from the corresponding author upon reasonable request.
QZ and HH contributed this work equally. QZ and HH: designed the study, collected, analyzed and interpreted the clinical and experimental data. QL and CW: performed and analyzed the levels of LDH-1, LDH-5, pyruvate, lactate, ATP. JC: helped to design the study, analyzed the data and part of the experiment. LN: performed graph visualization and analyzed the data. SL: performed the in vitro model and patch clamp experiments and analyzed the data. All authors contributed to editorial changes in the manuscript. All authors read and approved the final manuscript. All authors have participated sufficiently in the work and agreed to be accountable for all aspects of the work.
All patient protocols were authorized by the Ethics Committee of Fourth People’s Hospital of Nanning (approval number [2022] 70) and conformed to the Declaration of Helsinki’s ethical principles. Informed consent was obtained from all 32 patients or their families/legal guardians. All experimental procedures were approved by the Ethics Committee of Guangxi Medical University (ethical batch number: (NO. 202101023)) and were conducted in accordance with the National Institutes of Health Guide for the Care and Use of Animals.
Not applicable.
This research received no external funding.
The authors declare no conflict of interest.
Supplementary material associated with this article can be found, in the online version, at https://doi.org/10.31083/JIN26741.
Publisher’s Note: IMR Press stays neutral with regard to jurisdictional claims in published maps and institutional affiliations.