


 , Ju Gao 2, Yinggang Xiao 2, Tianfeng Huang 2,*
1 Department of Pain Management, Northern Jiangsu People’s Hospital Affiliated to Yangzhou University, Yangzhou University, 225001 Yangzhou, Jiangsu, China
2 Department of Anesthesiology, Northern Jiangsu People’s Hospital Affiliated to Yangzhou University, Yangzhou University, 225001 Yangzhou, Jiangsu, China
Abstract
Thalamic hemorrhage (TH) is a severe neurological condition, the molecular mechanisms of which are poorly understood, particularly in clinical settings. N-acetyltransferase 10 (NAT10), a regulator of RNA N4-acetylcytidine (ac4C) modification, has been implicated in cell cycle regulation and identified as a potential therapeutic target. This study explored the effects of NAT10 inhibition on TH pathology using a multi-omics approach.
A mouse model of TH was established via collagenase IV injection. NAT10 activity was detected by dot blot and inhibited using Remodelin. Comprehensive multi-omics analyses, including 16S ribosomal Deoxyribonucleic Acid (16S rDNA) sequencing, metabolomics, and transcriptomics, were used. Behavioral, histological, and molecular evaluations were conducted to evaluate the key genes.
A total of 35 hub genes, 30 hub metabolites, and 28 hub microorganisms associated with NAT10 inhibition were identified. Among them, the xanthine dehydrogenase (XDH) and guanine deaminase (GDA) genes were linked to xanthine, which is a key metabolite implicated in TH pathology. Based on these findings, the xanthine oxidase inhibitor febuxostat was tested, demonstrating significant therapeutic benefits in TH-affected mice. Behavioral, histological, and molecular evaluations confirmed that NAT10 inhibition alleviated TH-induced damage.
This study provides the first comprehensive molecular insights into the therapeutic potential of NAT10 inhibition in TH. Moreover, it identified NAT10 inhibitors and febuxostat as promising candidates for TH management, paving the way for future therapeutic development targeting NAT10 in this condition.
Keywords
- thalamic diseases
- N-acetyltransferase inhibitors
- 16S rRNA gene sequencing
- metabolomics
- gene expression profiling
- xanthine
Thalamic hemorrhage (TH) mainly leads to a range of debilitating phenotypes, and
central post-stroke pain (CPSP) is one of the most prominent phenotypes. CPSP,
characterized by abnormal sensation and chronic pain, frequently arises after TH
[1]. The underlying mechanisms primarily involve several key processes. Firstly,
partial damage to the spinothalamic tract can disrupt pain modulation, leading to
hyperalgesia and spontaneous pain [2]. Secondly, functional abnormalities in the
thalamus, particularly the ventral posterolateral (VPL) nucleus, and the cortex,
including neuronal hyperexcitability and altered plasticity, represent key
pathological mechanisms underlying CPSP. Central sensitization, mediated by
N-methyl-D-aspartate (NMDA) receptor activation and disinhibition, further
amplifies abnormal pain responses to normally non-painful stimuli [2].
Concurrently, microglial activation initiates central inflammatory responses,
while increased glutamate levels and decreased levels of inhibitory
neurotransmitters (e.g.,
N-acetyltransferase 10 (NAT10) is a versatile acetyltransferase that plays a
critical role in regulating RNA stability and translation through
N4-acetylcytidine (ac4C) modification, influencing various cellular processes,
including gene expression and protein synthesis [8, 9]. NAT10 has been implicated
in multiple pathological conditions, particularly diverse cancer types and
neurological diseases, where it promotes cell cycle progression and serves as a
potential therapeutic target [10, 11, 12]. In cancer, NAT10’s function in cell cycle
regulation has made it a focal point for drug development, and the NAT10
inhibitor Remodelin is the only known compound capable of inducing cell cycle
arrest by targeting NAT10 [13]. Remodelin has exhibited promise in sensitizing
tumor cells to chemotherapy, halting the progression of prostate cancer, and
inducing apoptosis in acute myeloid leukemia cells, making NAT10 inhibition an
attractive therapeutic approach across various malignancies [11, 14]. Beyond
oncology, recent evidence suggests that NAT10 also plays a significant role in
neurological diseases, particularly in TH-induced CPSP. Prior research revealed
that NAT10 contributes to CPSP by activating the Nuclear Factor Kappa-Light-Chain-Enhancer of Activated B Cells (NF-
Multi-omics approaches provide a robust framework to elucidate the molecular mechanisms underlying NAT10 inhibition further. Multi-omics integrates data from various biological layers, including genomics, transcriptomics, metabolomics, microbiomics, and proteomics, to provide a comprehensive understanding of complex biological systems [16]. This holistic approach not only identifies disease-associated markers but also provides insights into the molecular pathways and processes that distinguish pathological states from normal conditions. By combining multiple types of omics data, researchers can uncover novel pathogenic mechanisms, therapeutic targets, and potential biomarkers for a wide range of diseases [17].
The present study aimed to investigate the therapeutic potential of NAT10 inhibition, specifically using Remodelin, in the context of TH. Utilizing a multi-omics approach that encompasses microbiome, metabolome, and transcriptome analyses, in conjunction with in vivo experiments, this investigation unraveled the molecular mechanisms underlying the influences of Remodelin on TH. The findings may deepen our understanding of TH at the molecular level and promote the identification of new therapeutic targets for this condition.
Male C57BL/6J mice, aged 6–8 weeks, were obtained from SiPeiFu Biotechnology Co., Ltd. (Beijing, China). Mice were housed in an animal incubator under a 12-h light/dark cycle with ad libitum access to food and water. To minimize variability in behavioral outcomes both within and between groups, mice underwent pre-training before the commencement of the experiment. Additionally, experimenters who conducted the behavioral tests were blinded to the treatment groups to ensure unbiased assessment.
Mice were anesthetized using vaporized isoflurane (2.5% for induction and 2.0% for maintenance; R510-22-10, RWD Life Science, Shenzhen, Guangdong, China) and subsequently positioned in a stereotaxic frame for precise surgical procedures. Collagenase IV (Coll IV; C5138, Sigma-Aldrich, St. Louis, MO, USA; 0.01 U/10 nL), dissolved in saline, was stereotactically injected into the right ventral posterior medial and ventral posterior lateral nuclei of the thalamus in mice designated for the model group (group B). The injection coordinates relative to the bregma were as follows: 0.82–2.30 mm in the anterior-posterior axis, 1.30–1.95 mm lateral to the midline, and 3.01–4.25 mm ventral to the skull surface. The injection was performed at a rate of 0.01 nL/sec. Mice in the control group (group A) received an equal volume of sterile saline. After injection, the glass micropipette was left in place for 10 min to ensure complete diffusion of Coll IV. The micropipette was carefully withdrawn, and the cranial opening was sealed with bone wax. The scalp was sutured using 4-0 surgical sutures.
Mice in the intervention group (group C) received intraperitoneal injection of the NAT10 inhibitor, Remodelin (5 mg/kg, S7641, Selleck, Shanghai, China), beginning on the first day post-stereotaxic injection. Treatment was administered twice a week for a total of six injections. The health status, physiological parameters, and pain-related behaviors of all mice were monitored at baseline (pre-injection) and on days 1, 3, 5, 7, 14, and 21 post-stereotaxic injection to validate the successful establishment of the model.
Pain behavior was assessed through thermal and cold stimulation tests, measuring
paw withdrawal latency in mice using a hot and cold plate pain meter (Model
35100, Ugo Basile, Gemonio, Italy) [18]. During the tests, each mouse was placed
in a separate resin glass box. For the thermal stimulation test, mice were
positioned on a glass plate maintained at 26
Upon completion of the pain behavior assessments, motor function evaluations were conducted, including the cliff avoidance response, forelimb grip strength, and righting reflex tests [19, 20]. For the cliff avoidance test, a mouse was placed at the edge of a table, with its forepaws gripping the edge and its hind limbs dangling. The ability of the mouse to promptly return its hind paws to the table was then recorded. In the forelimb grip strength test, the mouse was placed on a wire grid, and the ability of its forepaws to grasp the grid was assessed. The righting reflex test measured the time it took for a mouse to reorient itself when placed on its back on a flat surface. Mice that required more than 2 seconds to right themselves were excluded to minimize individual variability. Each trial was conducted for 30 seconds, with a normal righting response defined as occurring within 2 seconds.
Following the behavioral tests, thalamic brain tissue samples from mice in each group were prepared for paraffin sectioning. Anesthesia was induced with isoflurane (5% for induction and 2% for maintenance, R510-22-10, RWD Life Science), after which perfusion was performed using phosphate-buffered saline (PBS) (G5001, Servicebio Technology Co., Ltd., Wuhan, Hubei, China), followed by 4% paraformaldehyde (20210827, GUANG FU, Tianjin, China). The thalamus was rapidly dissected and stored at 4 °C. Tissues were fixed in 4% paraformaldehyde for 24 hours. After fixation, the samples were dehydrated in graded ethanol solutions (100092683, Sinopharm), cleared with xylene (10023418, Sinopharm, Shanghai, China), and then embedded in paraffin (69019961, Sinopharm). Sections of 20 µm thickness were cut for Nissl staining and immunohistochemistry (IHC). Following the experiment, the carcasses were then sealed in bags, frozen, and transferred to certified disposal facilities for safe and compliant disposal.
Paraffin-embedded tissue sections were baked at 64 °C for 1 h, followed by dewaxing in xylene and rehydration in graded ethanol. The sections were thrice rinsed with PBS for 5 minutes each. They were then stained with Nissl staining solution (G1430, Solarbio, Beijing, China) at 50–60 °C for 30–60 minutes, followed by differentiation in 95% ethanol. The sections were then dehydrated in absolute ethanol, cleared in xylene, and finally mounted with neutral gum (10004160, Sinopharm) for long-term preservation. Once dried, the stained thalamic tissue was examined under a microscope (Leica DM500, Leica Microsystems, Wetzlar, Germany), and the number of neurons with Nissl bodies was quantified using ImageJ software (V1.53k; NIH, Bethesda, MD, USA).
Following the same dewaxing and hydration steps as in Nissl staining, antigen retrieval was performed using citrate buffer (G1202, Servicebio). Endogenous peroxidase activity was blocked by incubating the sections in 3% H₂O₂ (H1009, Sigma-Aldrich) for 20 minutes at room temperature. After blocking with 5% bovine serum albumin (BSA; A1933, Sigma-Aldrich), sections were incubated overnight with the following primary antibodies: rabbit anti-NAT10 (DF12427, 1:50; Affinity, Shanghai, China), rabbit anti-xanthine dehydrogenase (XDH, DF8111, 1:50, Affinity), rabbit anti-nucleoside phosphorylase (NP, HA500062, 1:150; Huabio, Woburn, MA, USA), rabbit anti-hypoxanthine phosphoribosyltransferase 1 (HPRT1 15059-1-AP, 1:50; Proteintech, Rosemont, IL, USA), and rabbit anti-guanine deaminase (GDA, DF2701, 1:50, Affinity). The next day, sections were treated with a reaction-enhancing solution for 20 minutes, followed by incubation with a universal secondary antibody for another 20 minutes. Staining was visualized using the 3,3′-diaminobenzidine (DAB) substrate (G1212, Servicebio), and sections were counterstained with hematoxylin (G1004, Servicebio) for at least 15 minutes to achieve a blue background. The sections were dehydrated and cleared following the same protocol used for Nissl staining, with three 5-minute rinses in PBS between each step. Mean optical density was analyzed using ImageJ software.
Protein extraction from thalamic homogenates was performed using a commercial whole-protein extraction kit (EX1100, Solarbio). After quantifying protein concentration, samples were heated at 99 °C for 5 minutes. Subsequently, 30 µg of protein per sample was loaded onto 4–20% precast polyacrylamide gel electrophoresis (PAGE) gels (M42015, GenScript, Nanjing, Jiangsu, China) for electrophoresis. Proteins were then transferred onto polyvinylidene fluoride (PVDF) membranes (1620177, Bio-Rad, Hercules, CA, USA) via wet transfer. The membranes were blocked for 1 hour with 5% skim milk in Tris-buffered saline containing 0.1% Tween-20 (TBST). Primary antibodies, diluted in blocking buffer, were incubated overnight at 4 °C, including rabbit anti-XDH (DF8111, 1:1000; Affinity), anti-NP (HA500062, 1:1000; Huabio), anti-HPRT1 (15059-1-AP, 1:2000; Proteintech), anti-GDA (DF2701, 1:1000; Affinity), and anti-beta actin (AF7018, 1:10,000; Affinity). After washing with TBST, membranes were incubated for 2 hours at room temperature with a goat anti-rabbit IgG secondary antibody (S0001, 1:10,000; Affinity). Protein bands were visualized using ECL (1705061, Bio-Rad) and quantified with ImageJ software.
Protein extracts from mouse thalamic tissues collected 21 days post-modeling
were analyzed for inflammatory cytokine levels using commercial ELISA kits
(EM0005 for IL-10, EM0004 for IL-6, and EM0029 for IL-1
The conserved regions of the 16S ribosomal deoxyribonucleic acid (16S rDNA)/Internal Transcribed Spacer 2 (ITS2) sequences were targeted for primer design. Total microbial DNA was extracted from mouse feces and used as a template for one-step polymerase chain reaction (PCR) with Phusion enzyme (F531L, Thermo Fisher Scientific, Waltham, MA, USA). Amplification was performed for 35 cycles. Sequencing adaptors and sample-specific barcodes were added to the amplified products via PCR. The PCR products were analyzed using 1.5% agarose gel electrophoresis, and the target fragments were extracted. The AxyPrep MAG PCR Clean-up kit (MAG- PCR-CL-50, Axygen Scientific, Union City, CA, USA) was utilized for the recovery. Purified PCR products were quantified and pooled using the Promega QuantiFluor fluorescence system with the Quant-iT PicoGreen dsDNA Assay kit (E2670, Promega Corporation, Madison, WI, USA). Finally, Illumina sequencing (PE250) was performed according to standard procedures.
Total RNA was isolated from thalamic tissue using the TRIzol reagent (15596026,
Invitrogen, Carlsbad, CA, USA) following the manufacturer’s protocol. RNA
concentration and purity were evaluated using a NanoDrop ND-1000
spectrophotometer (NanoDrop, Wilmington, DE, USA). The RNA integrity was assessed
via a 2100 Bioanalyzer (Agilent, Santa Clara, CA, USA) and verified by agarose
electrophoresis. RNA samples with a concentration greater than 50 ng/µL, a
RIN above 7.0, an OD260/280 ratio exceeding 1.8, and a total RNA amount over 1
µg were selected for subsequent analysis. Oligo(dT) magnetic beads were
utilized to capture polyadenylated mRNA, which was then fragmented under high
temperatures. First-strand cDNA was synthesized with reverse transcriptase,
followed by second-strand synthesis via RNase H digestion. The resulting
double-stranded DNA was then end-repaired, followed by A-tailing and ligation
with T-tailed adaptors. The resulting fragments (300 bp
Blood samples (20 µL) were collected from each group of mice, and metabolites were extracted using a 50% methanol buffer (A452-4, Thermo Fisher Scientific). Briefly, 120 µL of precooled 50% methanol was added to 20 µL of the sample, followed by 1-minute vortexing and 10-minute incubation at room temperature. The samples were stored overnight at –20 °C. After centrifugation at 4000 g for 20 min, the supernatants were transferred to a 96-well plate. Quality control (QC) samples were prepared by mixing an equal volume (10 µL) of diluent from each sample. Samples were stored at –80 °C before liquid chromatography–mass spectrometry (LC-MS) analysis.
Chromatographic separations were conducted using an ultra-performance liquid
chromatography (UPLC) system (SCIEX, Macclesfield, UK) with an ACQUITY UPLC T3
column (100 mm
Mass spectrometry analysis was conducted using a TripleTOF 5600+ system (SCIEX, Framingham, MA, USA) in both positive and negative ion modes. The ion source pressure was set to 30 Pounds per square inch (PSI), while gas 1 and gas 2 pressures were maintained at 60 PSI. The source temperature was maintained at 650 °C, and the ionization voltage was +5000 V for positive mode and –4500 V for negative mode. Data acquisition was performed in Information Dependent Acquisition (IDA) mode, with accuracy corrections implemented for every 20 samples. QC samples were analyzed after every 10 samples to monitor and mitigate batch effects.
To enhance the reliability of the 16S rRNA sequencing results, data processing included error correction, de-duplication, and chimera filtering to improve the accuracy of identifying amplicon sequence variants (ASVs). A Venn diagram was plotted to illustrate the common and unique ASVs among different sample groups, providing a visual comparison of similarities and specificities across groups. Differences in species diversity between samples were depicted using rarefaction curves, which allowed for the visualization of species richness and saturation.
Alpha and beta diversity analyses were conducted to evaluate the diversity
within and between the samples, respectively. Alpha diversity, which reflects
species richness and evenness, was assessed using the Chao1, Observed, Shannon,
and Simpson indices. The Chao1 and Observed indices provide estimates of the
number of species present in the community, while the Shannon index, based on
information entropy, quantifies species diversity, and higher values indicate
greater diversity. The Simpson index ranges from 0 to 1, and values approaching 1
indicate higher diversity. The differences in group-wise diversity were
statistically tested using the Kruskal-Wallis test (p
According to the species richness and taxonomic annotation, the relative abundance of the top 30 taxa at the genus level was compared across the groups. To further explore the differences and similarities between samples, the Bray-Curtis distance was used for hierarchical clustering. This clustering method enabled differentiation between taxa of high and low abundance, providing insights into the similarities and variations in the genus-level composition among the three groups, which were visualized using color gradients and similarity measures.
Subsequently, linear discriminant analysis (LDA) combined with linear
discriminant analysis effect size (LEfSe) was applied to compare microbial
compositions between groups (p
The principal component analysis (PCA) was employed to investigate differences
in metabolomic profiles across the three groups. Additionally, orthogonal partial
least squares discriminant analysis (OPLS-DA) was utilized for pairwise
comparisons (group A vs. group B and group B vs. group C) using both positive and
negative ion modes. The variable importance in projection (VIP) values for each
metabolite were calculated. The t-test was employed to analyze group 1
(model vs. control) and group 2 (intervention vs. model), identifying metabolites
with p
Differential gene expression between group 1 (model vs. control) and group 2
(intervention vs. model) was analyzed using the DESeq2 R package (v1.38.0;
Bioconductor) [22]. The
criteria for identifying differentially expressed genes (DEGs) were p
Multi-omics association analysis enables the identification of potential association patterns across different omics layers, facilitating the systematic elucidation of regulatory networks involved in complex biological processes and the discovery of key regulatory nodes. In this study, we integrated three omics layers: microbiome (differentially abundant microbial taxa), metabolome (shared differentially expressed metabolites), and transcriptome (shared DEGs). This study concentrated on molecules that were significantly altered across multiple layers, based on the hypothesis that coordinated changes may reflect functionally relevant regulatory crosstalk.
To investigate these associations, Pearson and Spearman correlation analyses
were performed (
Finally, a metabolite–response–enzyme–gene regulatory network was generated using the MetScape (https://apps.cytoscape.org/apps/metscape) plugin in Cytoscape to map biochemical pathways and interactions. Differential expression of hub genes, hub metabolites, and hub microorganisms was analyzed across groups A, B, and C to further investigate their functional roles.
To investigate the influences of xanthine on the thalamus, three groups were established: control group (group D), model group (group E), and febuxostat (FBX) intervention group (group F). Mice in the FBX group received 10 mg/kg of febuxostat (HY-13418, MedChemExpress, Shanghai, China) via intraperitoneal injection once daily for five consecutive days, beginning on the first day post-stereotaxic injection [24]. The treatment protocols for groups D and E followed the same procedures as those for groups A and B, respectively.
Thalamus tissue RNA from groups D, E, and F was collected to assess the
expression levels of key genes. RNA extraction was conducted following the
previously described procedure. Subsequently, 1 µg of total RNA was
reverse transcribed into cDNA using the SureScript First-Strand cDNA Synthesis
kit (G3130, Servicebio). Primers for key genes were
synthesized by Tsingke Biotech Co., Ltd. (Beijing, China), and further details
are presented in Supplementary Table 1. Quantitative reverse
transcription PCR (RT-qPCR) was performed on the CFX96™ Real-Time
PCR Detection system (Bio-Rad) using 2
RNA extraction was performed according to previously described protocols. The purified RNA samples were applied to Hybond-N+ membranes (HNB001, Solarbio), briefly air-dried, and subjected to UV crosslinking at 254 nm for 60 s. Membranes were then blocked with 5% non-fat milk for 1.5 h and incubated overnight at 4 °C with rabbit anti-ac4C antibody (ab252215, 1:250; Abcam, Cambridge, UK). After washing, membranes were incubated for 1.5 h with horseradish peroxidase (HRP)-conjugated goat anti-rabbit IgG antibody (ab6721, 1:10,000; Abcam). Signals were detected using an enhanced chemiluminescence kit (34580, Thermo Fisher Scientific).
The statistical analysis was conducted using R (v4.2.2; R Foundation for
Statistical Computing, Vienna, Austria). Statistical significance was determined
using the Kruskal-Wallis and Wilcoxon tests, and p
Compared with the control group, mice subjected to TH experienced a significant halt in body weight gain, as well as a reduction in food and water intake. However, administration of a NAT10 inhibitor partially reversed these effects (Fig. 1A–C). Both heat and cold pain hypersensitivity were observed in mice with TH. Remodeling treatment significantly reduced hypersensitivity induced by Coll IV microinjection. After the intervention, the latency period for response to cold and heat stimuli was significantly prolonged in group C, approaching a period similar to that observed in group A (Fig. 1D,E). Additionally, results from the grip strength test, plane righting reflex, and cliff avoidance test indicated that in group C, grip strength and righting reflex scores fell between those of groups A and B (Fig. 1F–H). Compared with group A, group B showed a significant increase in ac4C-modified mRNA level, whereas group C exhibited a reduction in ac4C level relative to group B (Fig. 1I). These findings suggest that inhibition of NAT10 has a therapeutic effect on thalamic hemorrhage.
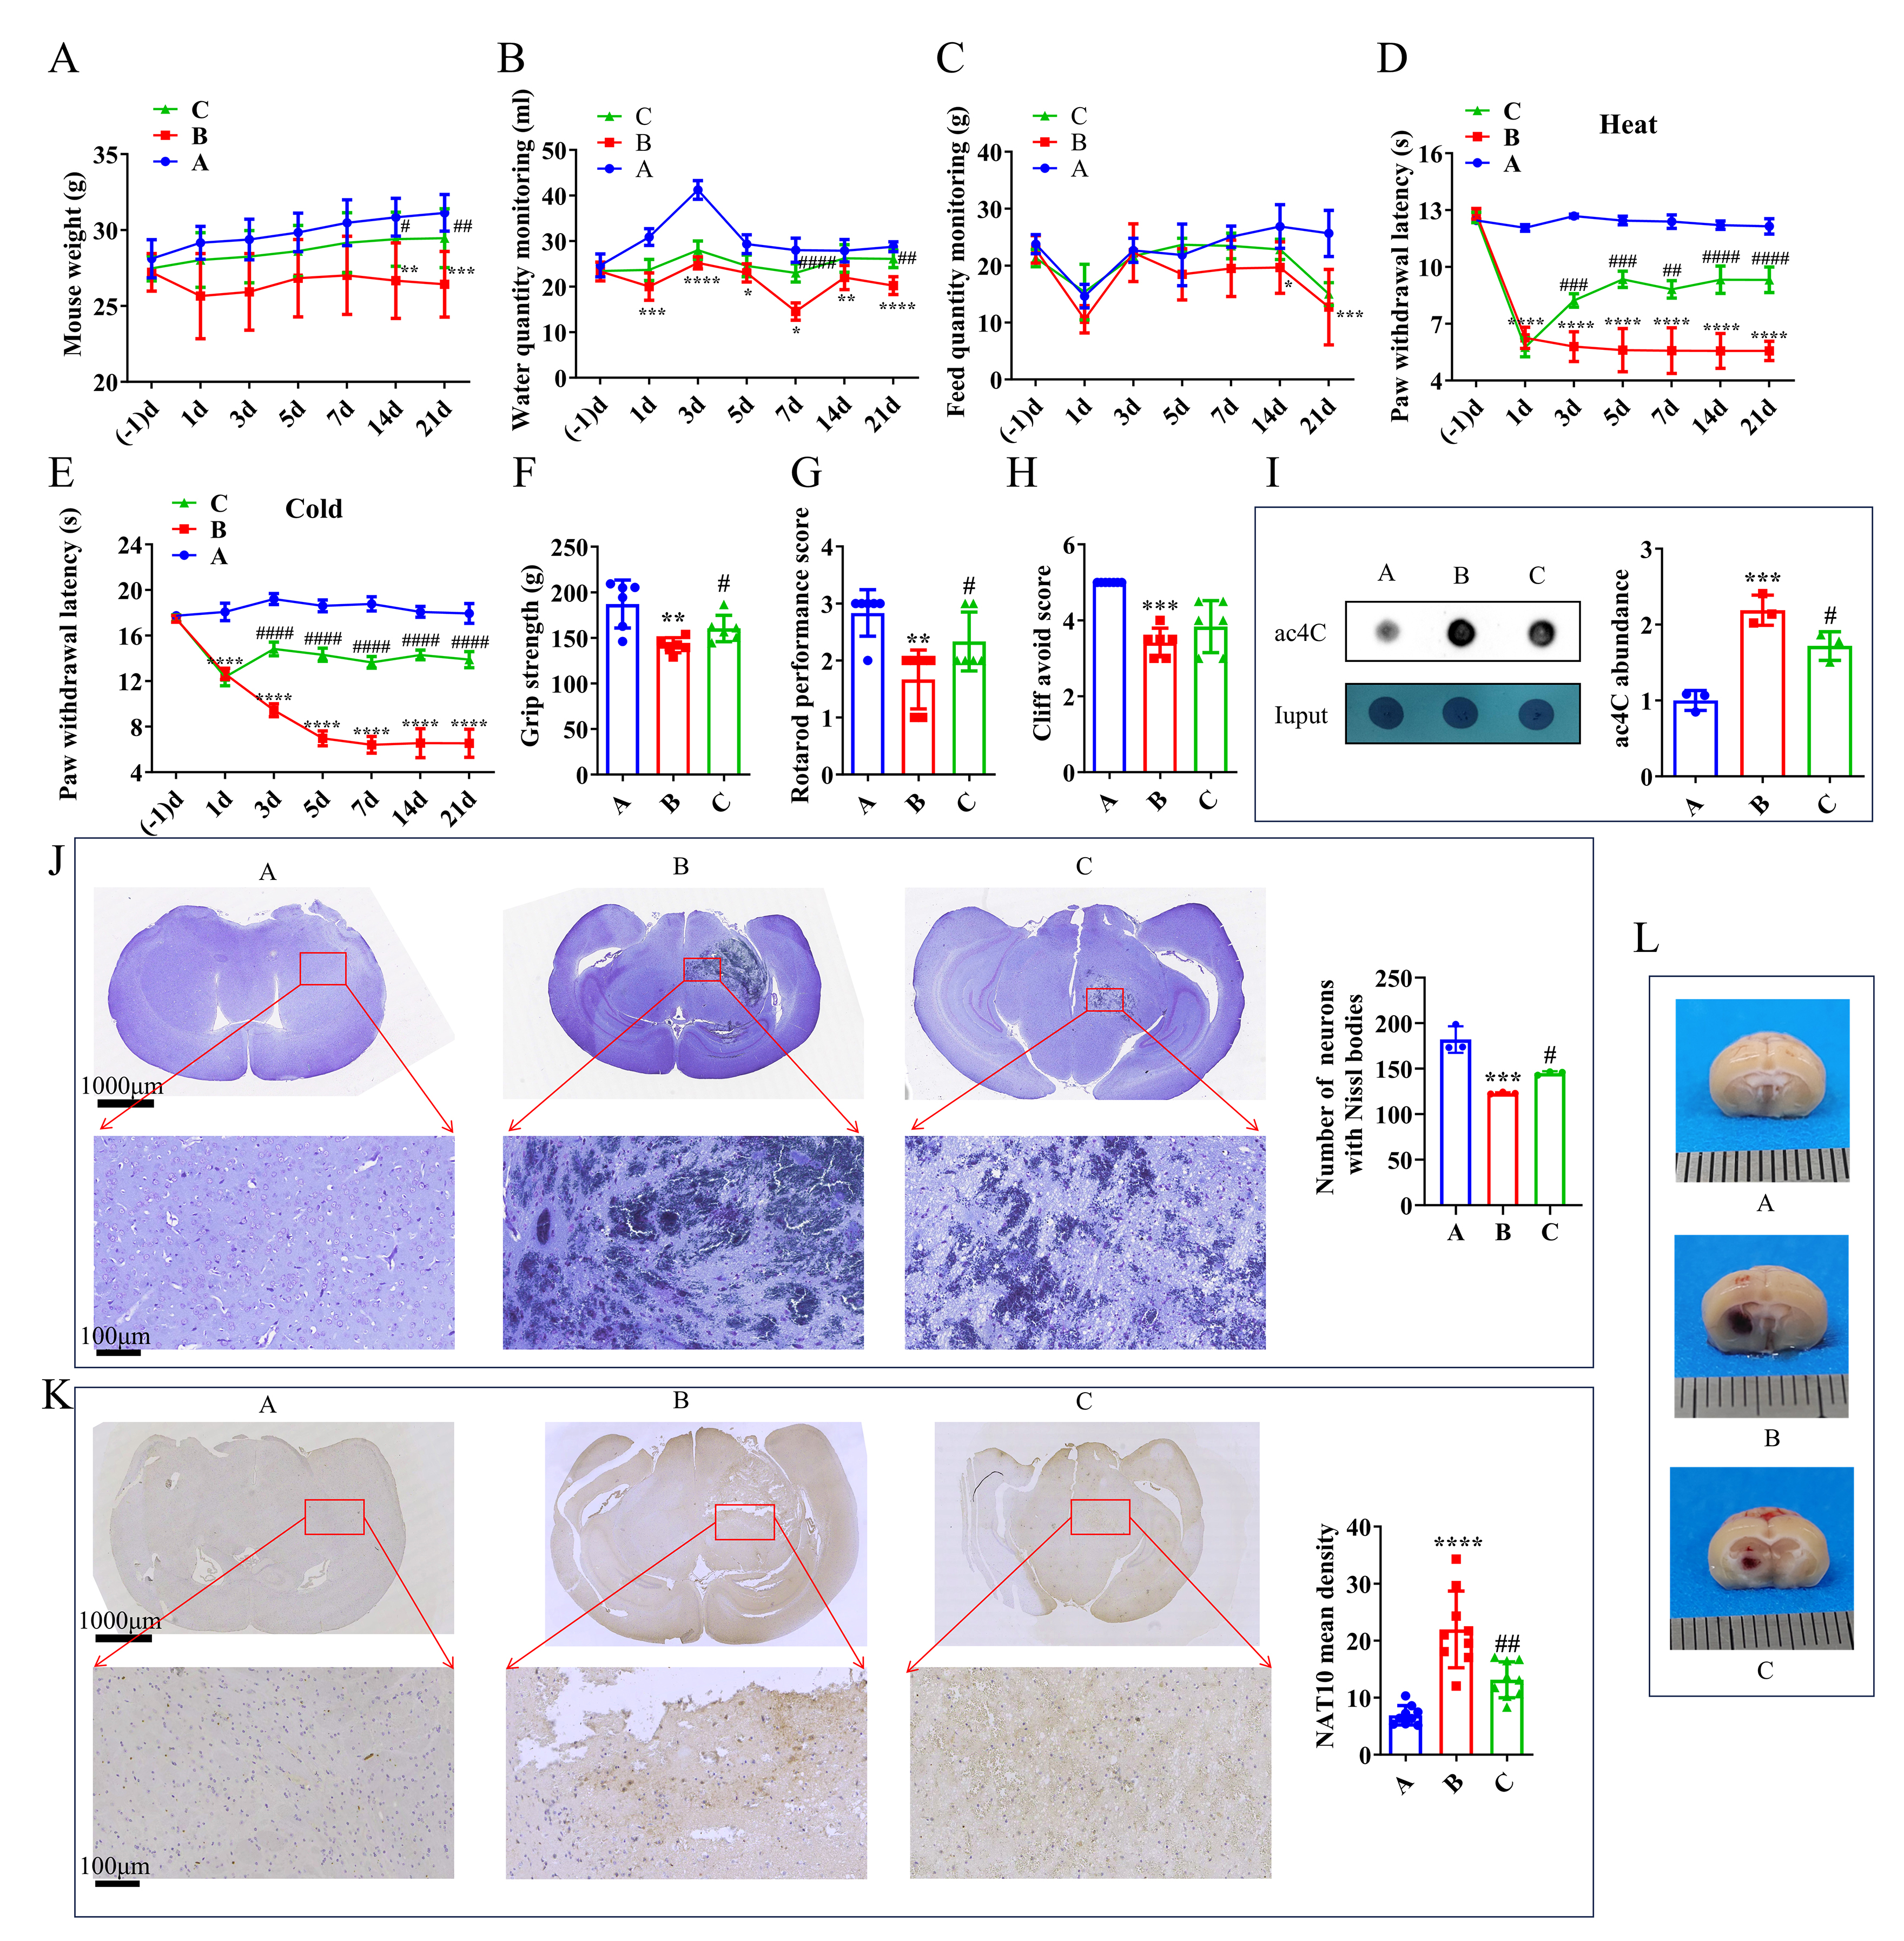 Fig. 1.
Effect of the NAT10 inhibitor in the TH model. (A) Mouse weight
measurements. (B) Monitoring of water intake. (C) Monitoring of feed intake in
mice. (D) Response to heat pain stimulation. (E) Response to cold pain
stimulation. (F) Forelimb grip strength assessment. (G) Plane righting test
results. (H) Cliff avoidance test outcomes on day 21 post-intervention. (I)
Analysis of ac4C expression level by dot blot in the mouse brain on day 21
post-intervention. (J) Nissl body observation and (K) NAT10 IHC staining in the
mouse brain on day 21 post-intervention. (L) Visualization of bleeding points in
the mouse brain on day 3 post-intervention. (J,K) Scale bars: 1000 μm in the upper panel and 100 μm in the lower panel, respectively. (L) Scale bar: 1 mm (each division). For panels (A–H), n = 6; for panel (K), n = 9; for
panels (I) and (J), n = 3. Statistical analysis: (A–E) Repeated ANOVA with
Bonferroni post-hoc test; (F–K) One-way ANOVA with Bonferroni post-hoc test.
*p
On day 3 post-intervention, thalamic tissues from all three groups were examined. Visible hemorrhages were observed in both group B and group C, with more severe bleeding in group B (Fig. 1L). On day 21, neuronal changes in the thalamus were assessed using Nissl staining. Neurons in group A maintained normal morphology, whereas group B exhibited extensive areas of infarction. Notably, the infarct area in group C was significantly reduced compared with that in group B (Fig. 1J). IHC revealed that NAT10 protein expression was upregulated in group B, while significantly suppressed in group C (Fig. 1K). These histological findings further support the therapeutic potential of NAT10 inhibitors in treating TH.
The multi-omics association analysis was carried out to gain a comprehensive understanding of microbial and molecular interactions across the different groups. Firstly, the gut microbiota was analyzed using a Venn diagram to assess the commonality and uniqueness of microbial species. A total of 788 core ASVs were shared among all three groups, while groups A, B, and C had 1534, 1819, and 1353 unique ASVs, respectively (Fig. 2A).
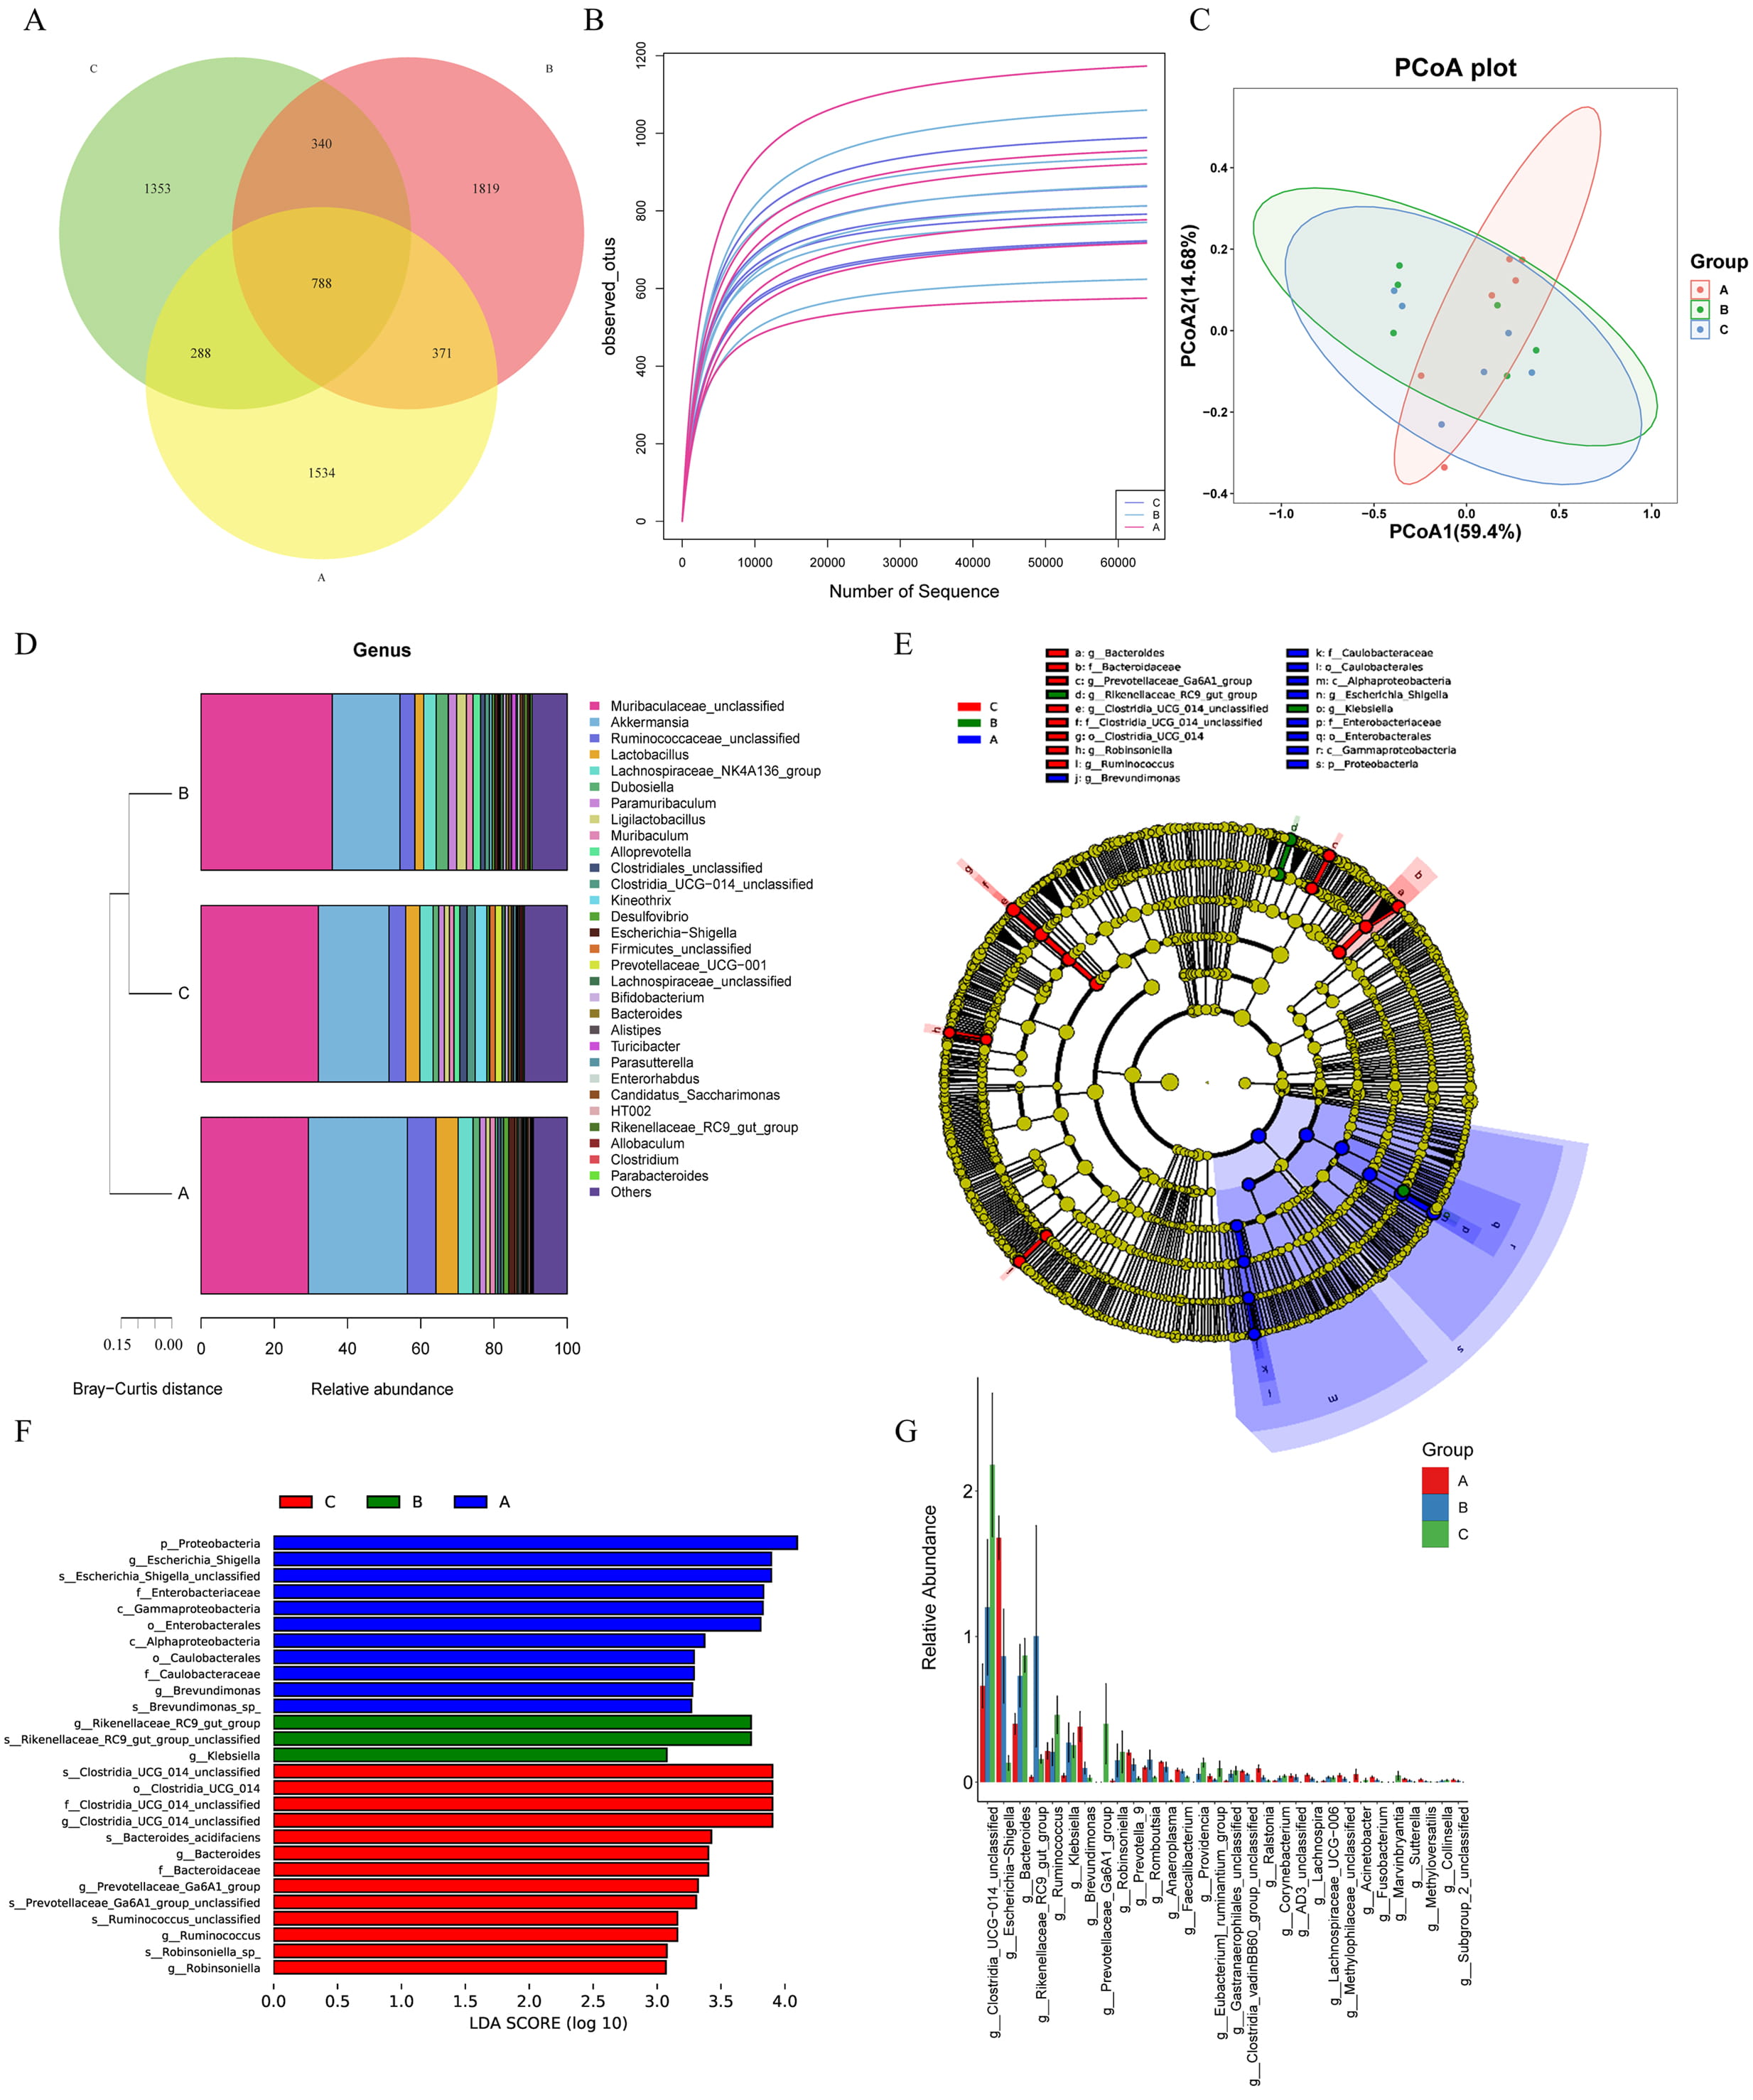 Fig. 2.
Analysis of gut microbiota. (A) The Venn diagram showed the distribution of ASVs among three groups of samples in the experiment, and clearly presented the shared and unique microbial taxa. (B) Assessment of microbial richness across all samples, quantifying the diversity of gut microbiota. (C) PCoA depicting sample clustering based on microbial community composition, revealing relationships among the samples. (D) The heatmap of microbial community composition (at the genus level) showed the relative abundance of major microbial genera among the three groups of samples. The color gradient reflected the level of abundance, and clearly presented the differences in intestinal microbial community composition among different treatment groups. (E) Identification of taxa with significant differences in richness between groups, highlighting those that were differentially enriched. (F) Overview of differentially abundant genera, highlighting those with significant variations in abundance across samples. (G) Summary of the top 30 differential microbial taxa, which were ranked by their abundance, showcasing the most significant alterations in gut flora. Group A: control group, Group B: TH model group, Group C: NAT10 inhibitor intervention group. ASVs, amplicon sequence variants; PCoA, principal coordinate analysis; LDA, linear discriminant analysis.
Next, species richness was evaluated both between and within the groups. As illustrated in Fig. 2B, there were notable variations in richness across the three groups. However, Alpha diversity indices, Chao1, Observed, Shannon, and Simpson, exhibited no significant differences in microbial diversity among the three groups (Supplementary Fig. 1). In contrast, PCoA revealed that samples from the three groups clustered separately, indicating subtle beta diversity differences (Fig. 2C).
The microbial community composition was examined at the genus level to identify specific differences among groups A, B, and C (Fig. 2D). The stacked bar plot revealed notable variations in the relative abundance rates of different genera across the three groups. Among them, Muribaculaceae_unclassified consistently exhibited a relatively high abundance in all the groups.
Cluster analysis provided additional insights into the community composition, displaying clear distinctions among the three groups. Notably, while group A displayed a unique microbial profile, groups B and C demonstrated greater similarity in their species composition. This suggests that the microbial communities in groups B and C may share more overlapping characteristics, which may be attributed to the shared treatment conditions.
Following the analysis of microbial diversity and genus-level composition across the three groups, LEfSe was employed to identify taxa with significant differential abundance (Fig. 2E). The LEfSe revealed 27 distinct taxa with differential expression among the three groups. Specifically, group A exhibited 11 distinct bacterial taxa, including p_Proteobacteria, g_Escherichia/Shigella, and s_Escherichia/Shigella_unclassified. Group B was characterized by g_Rikenellaceae_RC9_gut_group, s_Rikenellaceae_RC9_gut_group_unclassified, and g_Klebsiella. In contrast, group C had 13 significantly enriched genera, such as s_Clostridia_UCG_014_unclassified, o_Clostridia_UCG_014, and f_Clostridia_UCG_014_unclassified (Fig. 2F). Additionally, genus-level comparisons across the three groups identified a total of 40 bacterial taxa with differential expression, and the top 30 taxa were visualized in a bar chart (Fig. 2G). These findings highlight distinct microbial profiles and potential biomarkers across the three groups, reflecting how treatment or intervention may influence gut microbial composition.
To further explore the metabolic variations between groups, PCA was conducted to assess the variations in metabolomic profiles. The PCA results, based on principal components PC1 and PC2, revealed a low degree of separation among the three groups, suggesting subtle differences in their metabolomes (Supplementary Fig. 2A,B). However, OPLS-DA, performed under both positive and negative ion modes, successfully distinguished among the three groups, highlighting distinct metabolic differences (Supplementary Fig. 2C–F).
Next, to identify metabolites shared across different experimental conditions, the differentially expressed metabolites from group 1 (model vs. control) and group 2 (intervention vs. model) were intersected. This analysis yielded 20 shared differentially expressed metabolites in the positive ion mode and 22 in the negative ion mode, which were subsequently combined and refined to identify a total of 42 shared differentially expressed metabolites (Fig. 3A–D).
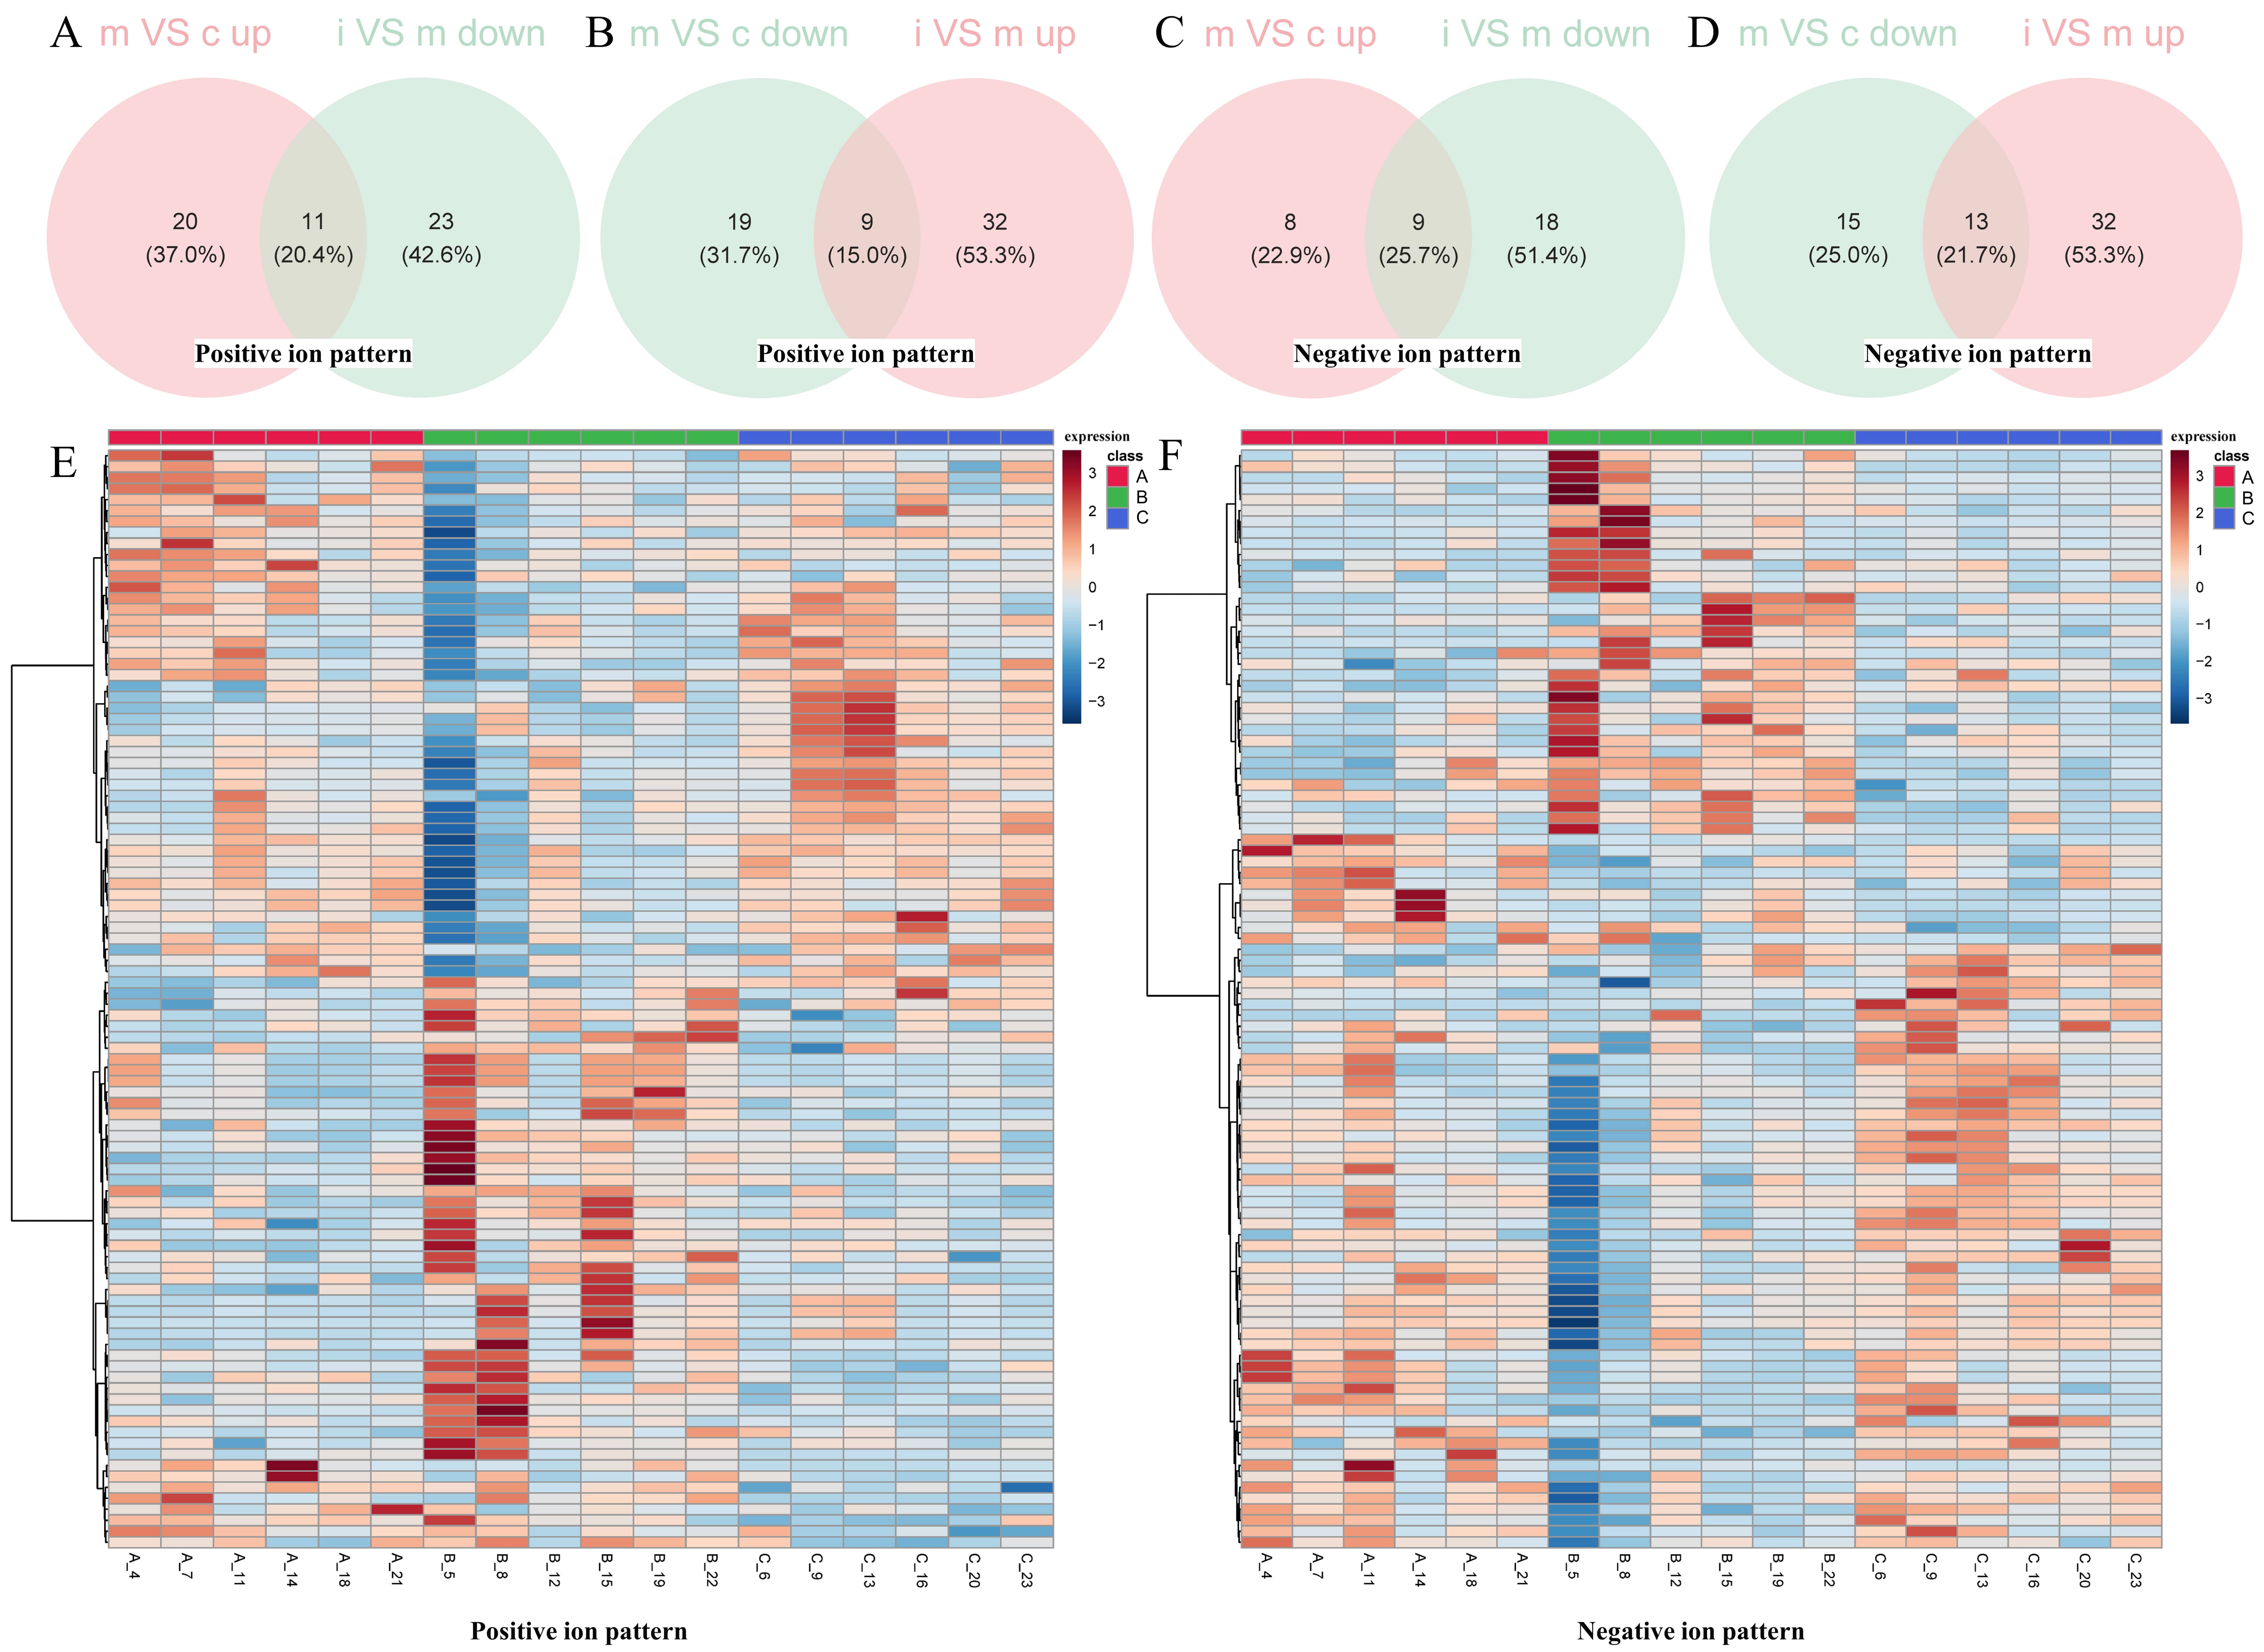 Fig. 3.
Analysis of metabolites in thalamic tissue. (A–D) Venn diagrams illustrating the identification of differentially expressed metabolites across the three groups. (E,F) Heatmaps represent the patterns of differentially expressed metabolites. Positive ionization patterns are illustrated in (A,B,E), while negative ionization patterns are presented in (C,D,F). Group designations are as follows: m, model; c, control; i, intervention. Group A, control group; group B, model group; Group C, intervention group.
Heatmaps representing the differentially expressed metabolites for both ionization modes were generated, exhibiting clear differences in metabolic profiles (Fig. 3E,F). In addition, the KEGG pathway analysis of these shared differentially expressed metabolites identified 29 enriched pathways, including arginine and proline metabolism, alpha-linolenic acid metabolism, and glycerophospholipid metabolism (Supplementary Table 2). These pathways provide insight into the potential biological mechanisms underlying the observed metabolic shifts.
Differential expression analysis revealed 499 DEGs in group 1 (model vs. control), comprising 315 upregulated and 184 downregulated DEGs (Fig. 4A,B). Similarly, group 2 (intervention vs. model) included a total of 664 DEGs, with 345 upregulated and 319 downregulated DEGs (Fig. 4C,D). By intersecting the upregulated and downregulated genes from group 1 with the corresponding downregulated and upregulated genes from group 2, 46 shared DEGs affected by the inhibitors were identified (Fig. 4E,F). The shared DEGs, metabolites, and bacterial genera identified above were subsequently compiled in Supplementary Table 3.
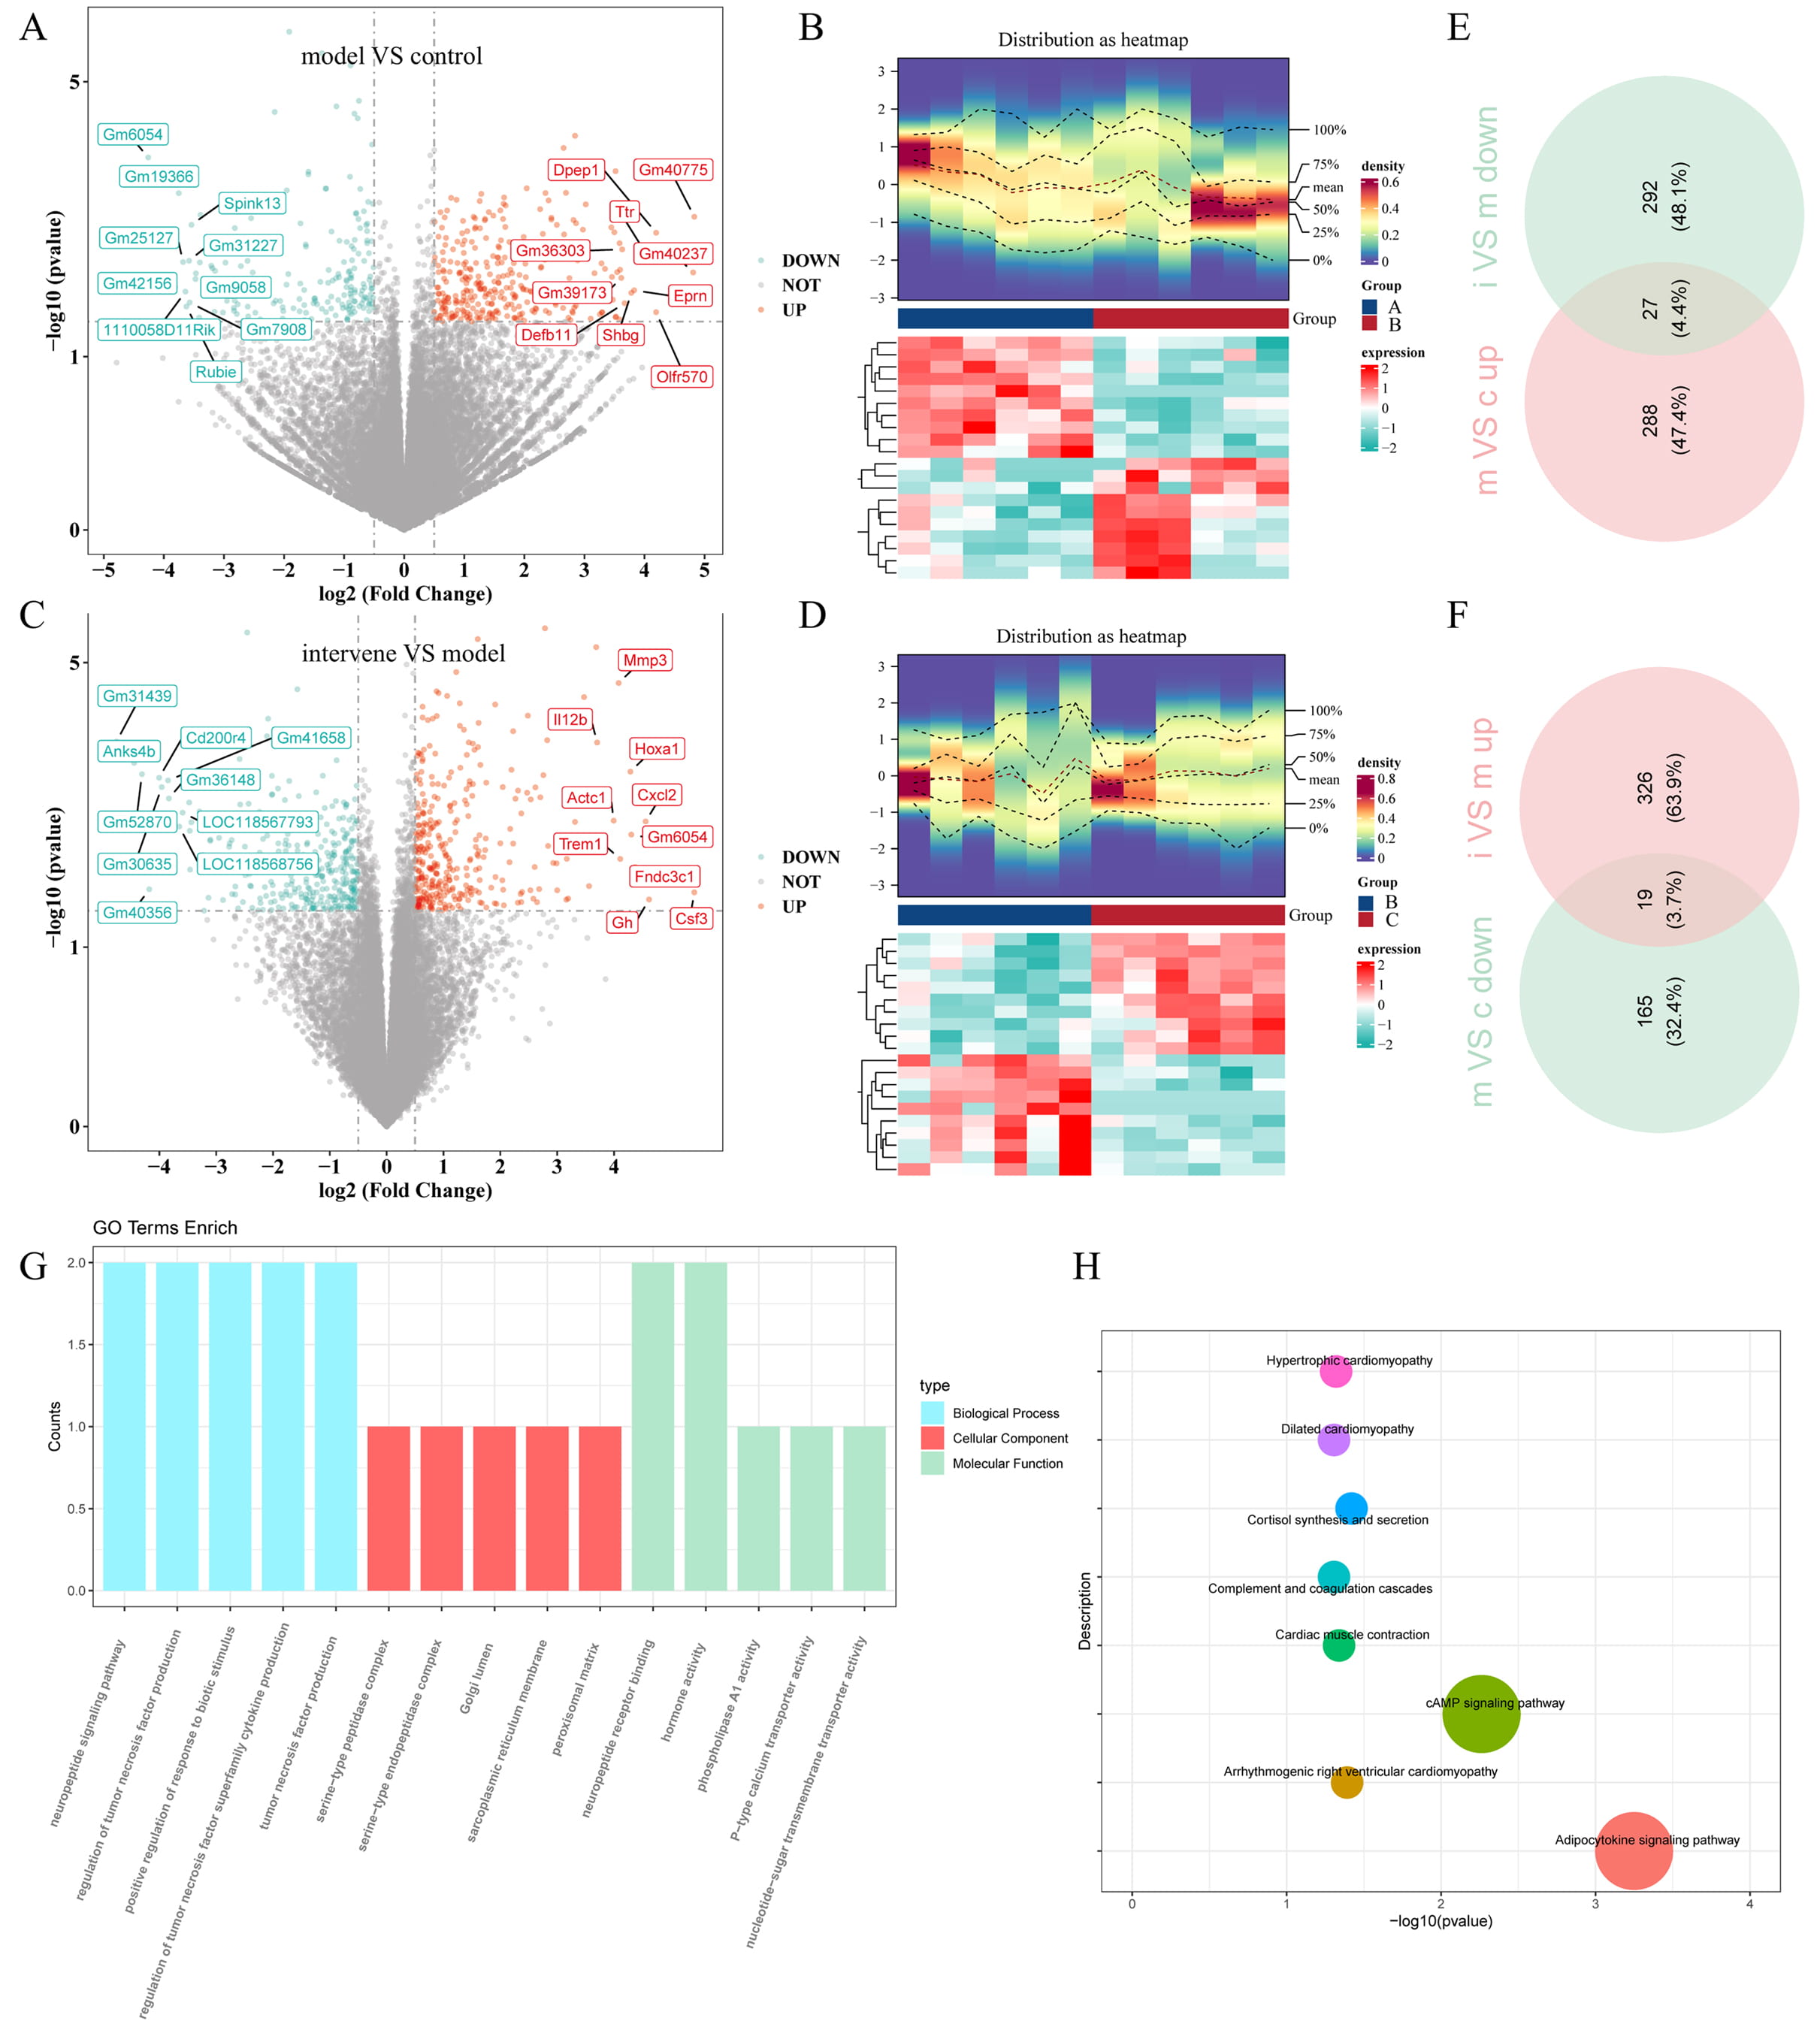 Fig. 4.
Transcriptome analysis of thalamic tissue. (A,C) Volcano plots displaying DEGs for (A) group 1 (TH model vs. control) and (C) group 2 (intervention vs. TH model). (B,D) Heatmaps illustrating the expression profiles of DEGs in (B) group 1 and (D) group 2. (E,F) Venn diagrams showing the shared DEGs between (E) group 1 and (F) group 2. (G) GO analysis and (H) KEGG pathway analysis of all the shared DEGs, providing insights into their functional roles and associated pathways. Different colors correspond to distinct pathways, and the size of each dot reflects the number of genes enriched in that pathway. DEGs, differentially expressed genes; GO, Gene Ontology; KEGG, Kyoto Encyclopedia of Genes and Genomes. Control group (group A, c); model group (group B, m); intervention group (group C, i).
Functional and pathway enrichment analyses were subsequently conducted to investigate the potential roles of these shared DEGs. A total of 66 GO biological processes were enriched, including the neuropeptide signaling pathway, regulation of tumor necrosis factor production, and positive regulation of responses to biotic stimuli. In terms of cellular components, the shared DEGs were mainly enriched in the serine-type peptidase complex, serine-type endopeptidase complex, and Golgi lumen. Molecular function analysis indicated involvement in neuropeptide receptor binding, hormone activity, and phospholipase A1 activity (Fig. 4G). Additionally, the shared DEGs were enriched in eight KEGG signaling pathways, including the adipocytokine signaling pathway and cAMP signaling pathway (Fig. 4H).
Correlation analysis revealed significant relationships among 23 differentially abundant bacterial species, 45 shared DEGs, and 31 shared differentially expressed metabolites (Supplementary Fig. 3A,B). These significantly correlated bacteria, metabolites, and DEGs were integrated into a joint network (Fig. 5A), identifying 35 hub genes, 30 hub metabolites, and 28 hub microorganisms. Notable relationships were identified, such as between g_Acinetobacter and Helianyl octanoate, as well as between Retinyl beta-glucuronide and Gm14002.
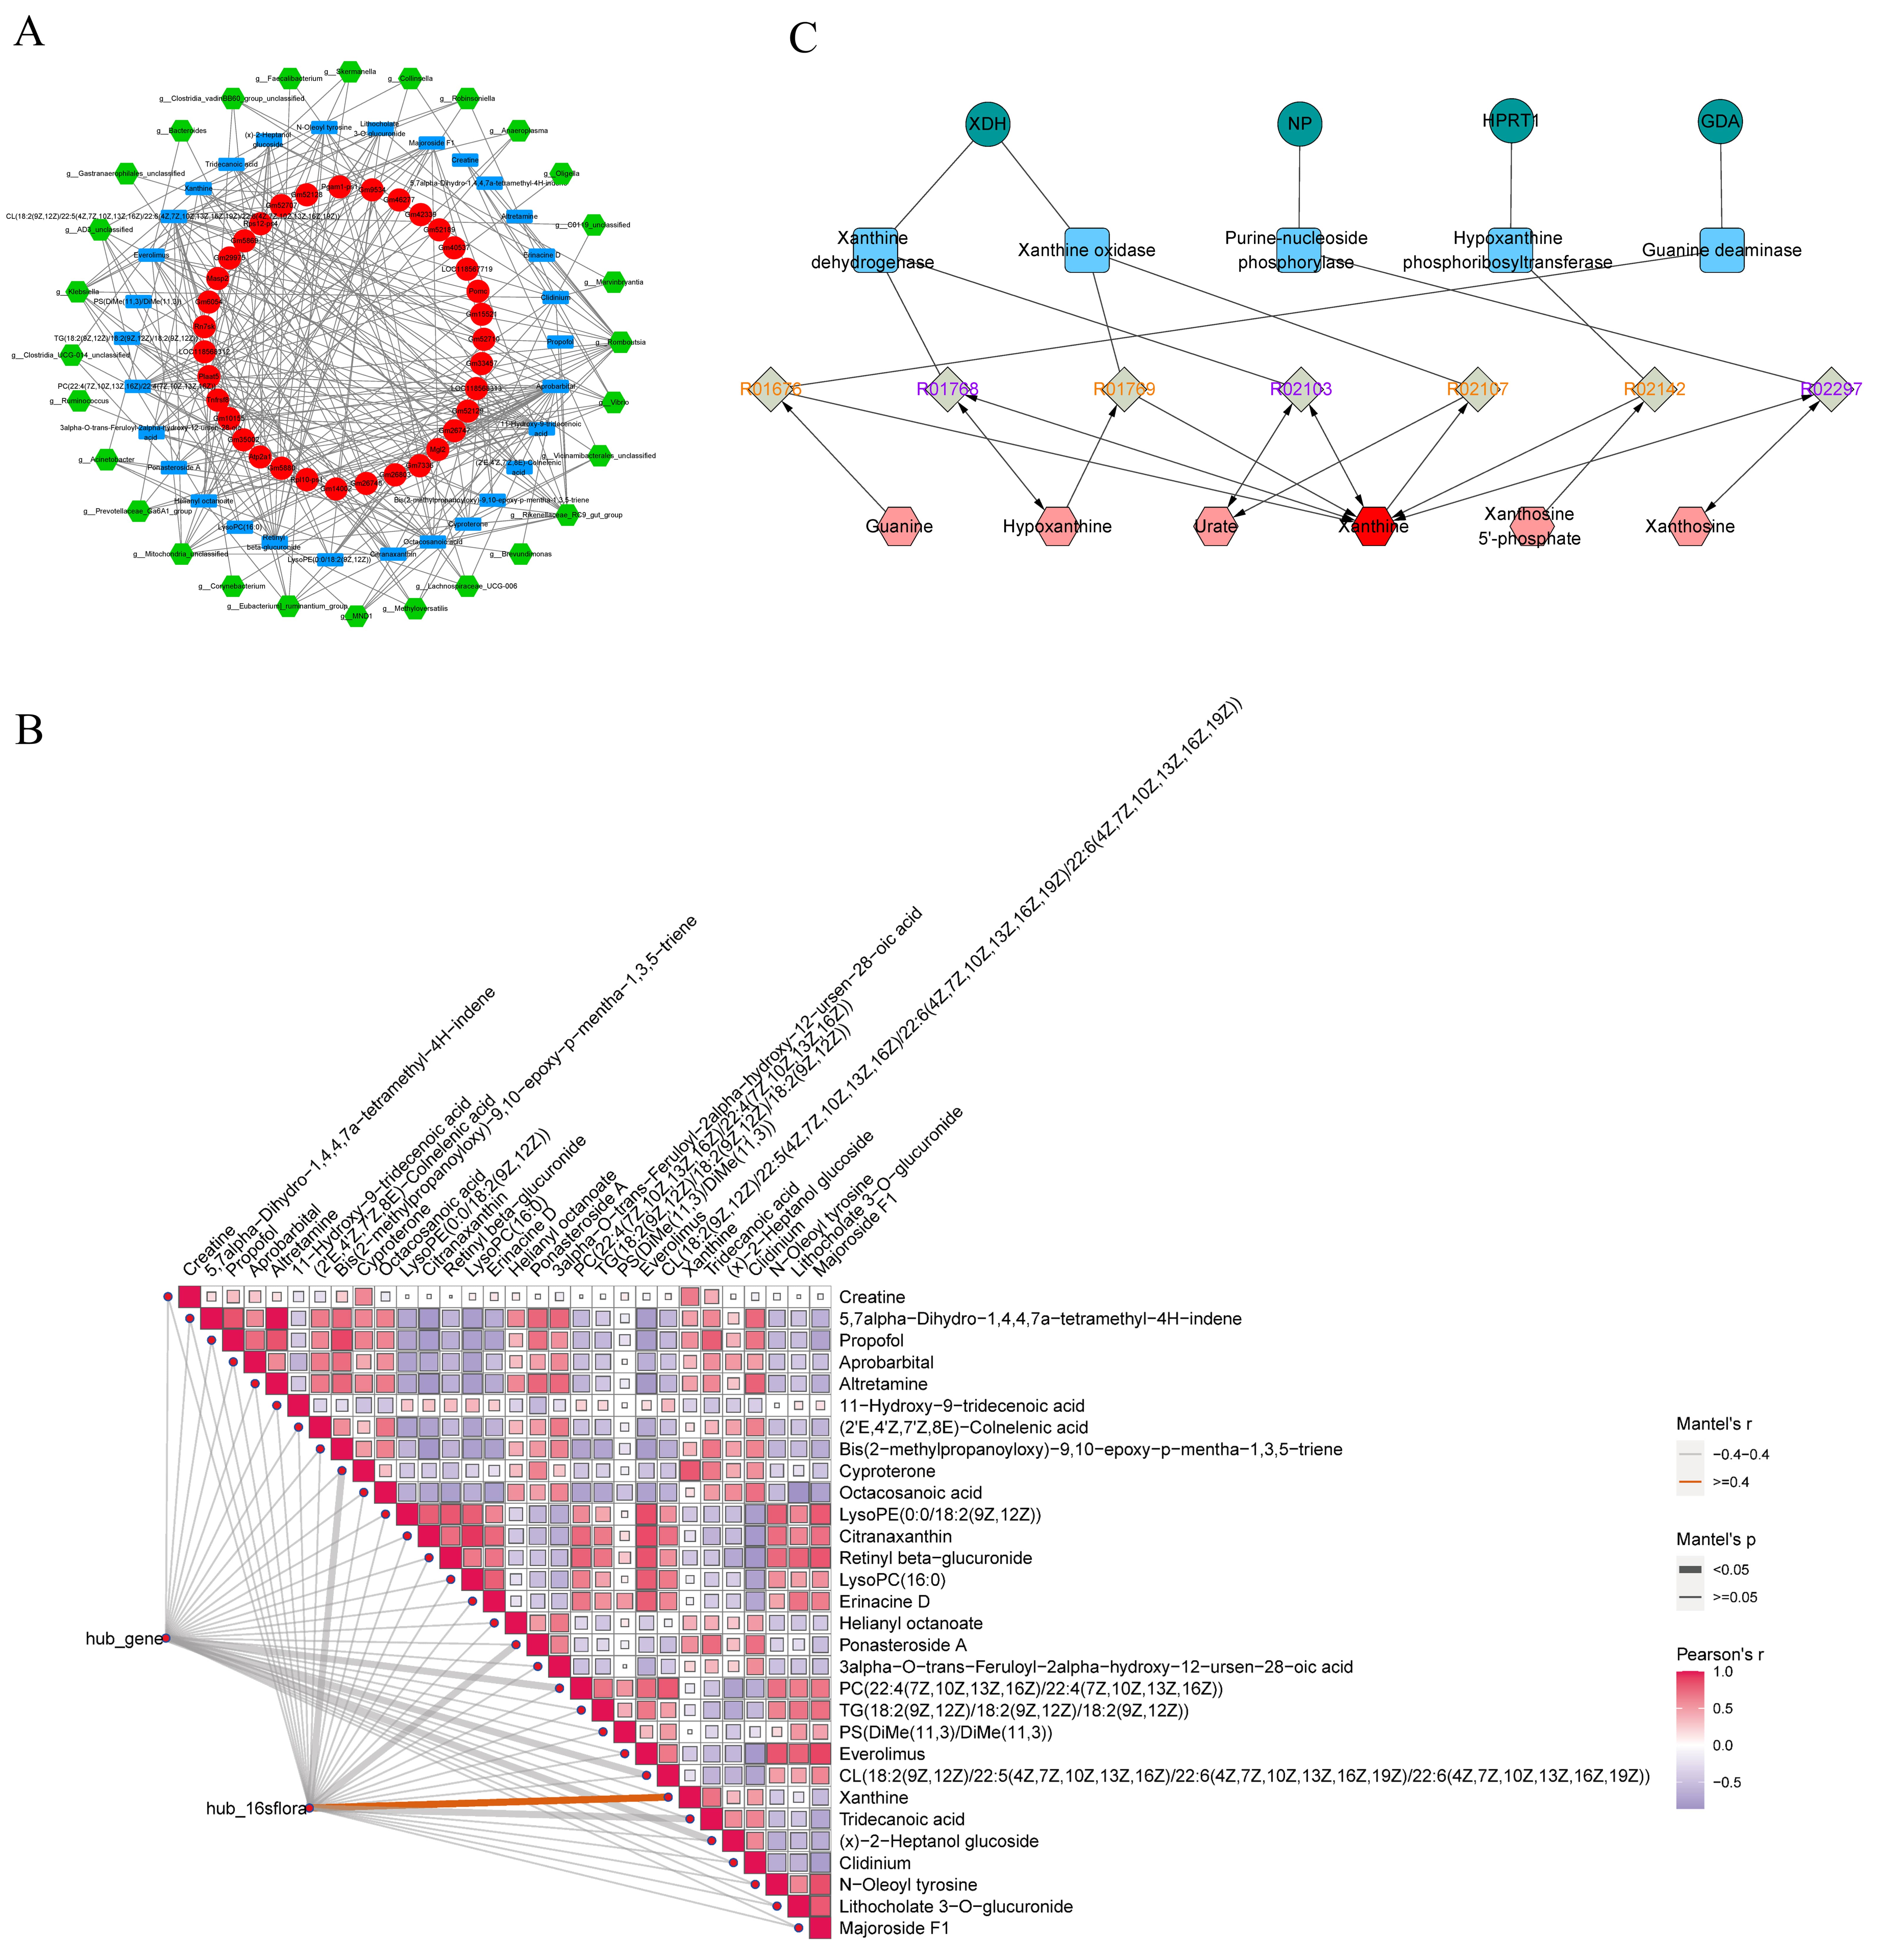 Fig. 5.
Multi-Omics association analysis. (A) Joint network representation incorporating differential bacteria, shared differentially expressed metabolites, and shared DEGs with significant correlations, constructed using Least Absolute Shrinkage and Selection Operator penalized Cox analysis. (B) Pearson and Mantel analyses illustrating the relationships among 35 hub genes, 30 hub metabolites, and 28 hub microorganisms. (C) Metabolite-response-enzyme-gene regulatory network centered on xanthine, which was constructed using MetScape, highlighting the interconnections among metabolites, enzymes, and genes. Green circles represent key genes, blue squares denote enzymes, gray diamonds, colored in orange and purple, distinguish different types of metabolic reaction pathways, and red hexagons indicate metabolites. XDH, xanthine dehydrogenase; NP, Purine nucleoside phosphorylase; HPRT1, hypoxanthine phosphoribosyltransferase 1; GDA, guanine deaminase; PC, Phosphatidylcholine; TG, Triglyceride; PS, Phosphatidylserine; CL, Cardiolipin.
Subsequent Pearson and Mantel analyses indicated a strongly positive correlation
between the metabolite Xanthine and hub microorganisms (Mantel’s R
Furthermore, the expression levels of hub genes, metabolites, and microorganisms across groups A, B, and C were visualized in Supplementary Fig. 4A–C. Among them, the Pomc and Rn7sk genes, the g__Bacteroides and g__Clostridia_UCG-014_unclassified microorganisms, and the LysoPC (16:0) metabolite were highly expressed in all the three groups.
As previously described, Xanthine exhibited a significantly positive correlation with hub microorganisms, and its expression levels were upregulated in group B, while they were downregulated following intervention with a NAT10 inhibitor. To investigate Xanthine’s role in TH, FBX, a xanthine oxidase (XO) inhibitor, was administered to the TH mouse model. Behavioral tests indicated that after 3 days, group F (FBX-treated) exhibited a longer latency period for cold and thermal stimuli compared with group E (Fig. 6A,B). In motor function tests, including grip strength, plane righting, and cliff avoidance, group F demonstrated intermediate performance compared with group E (Fig. 6C–E). These findings suggest that FBX provides a therapeutic benefit in alleviating clinical symptoms of TH.
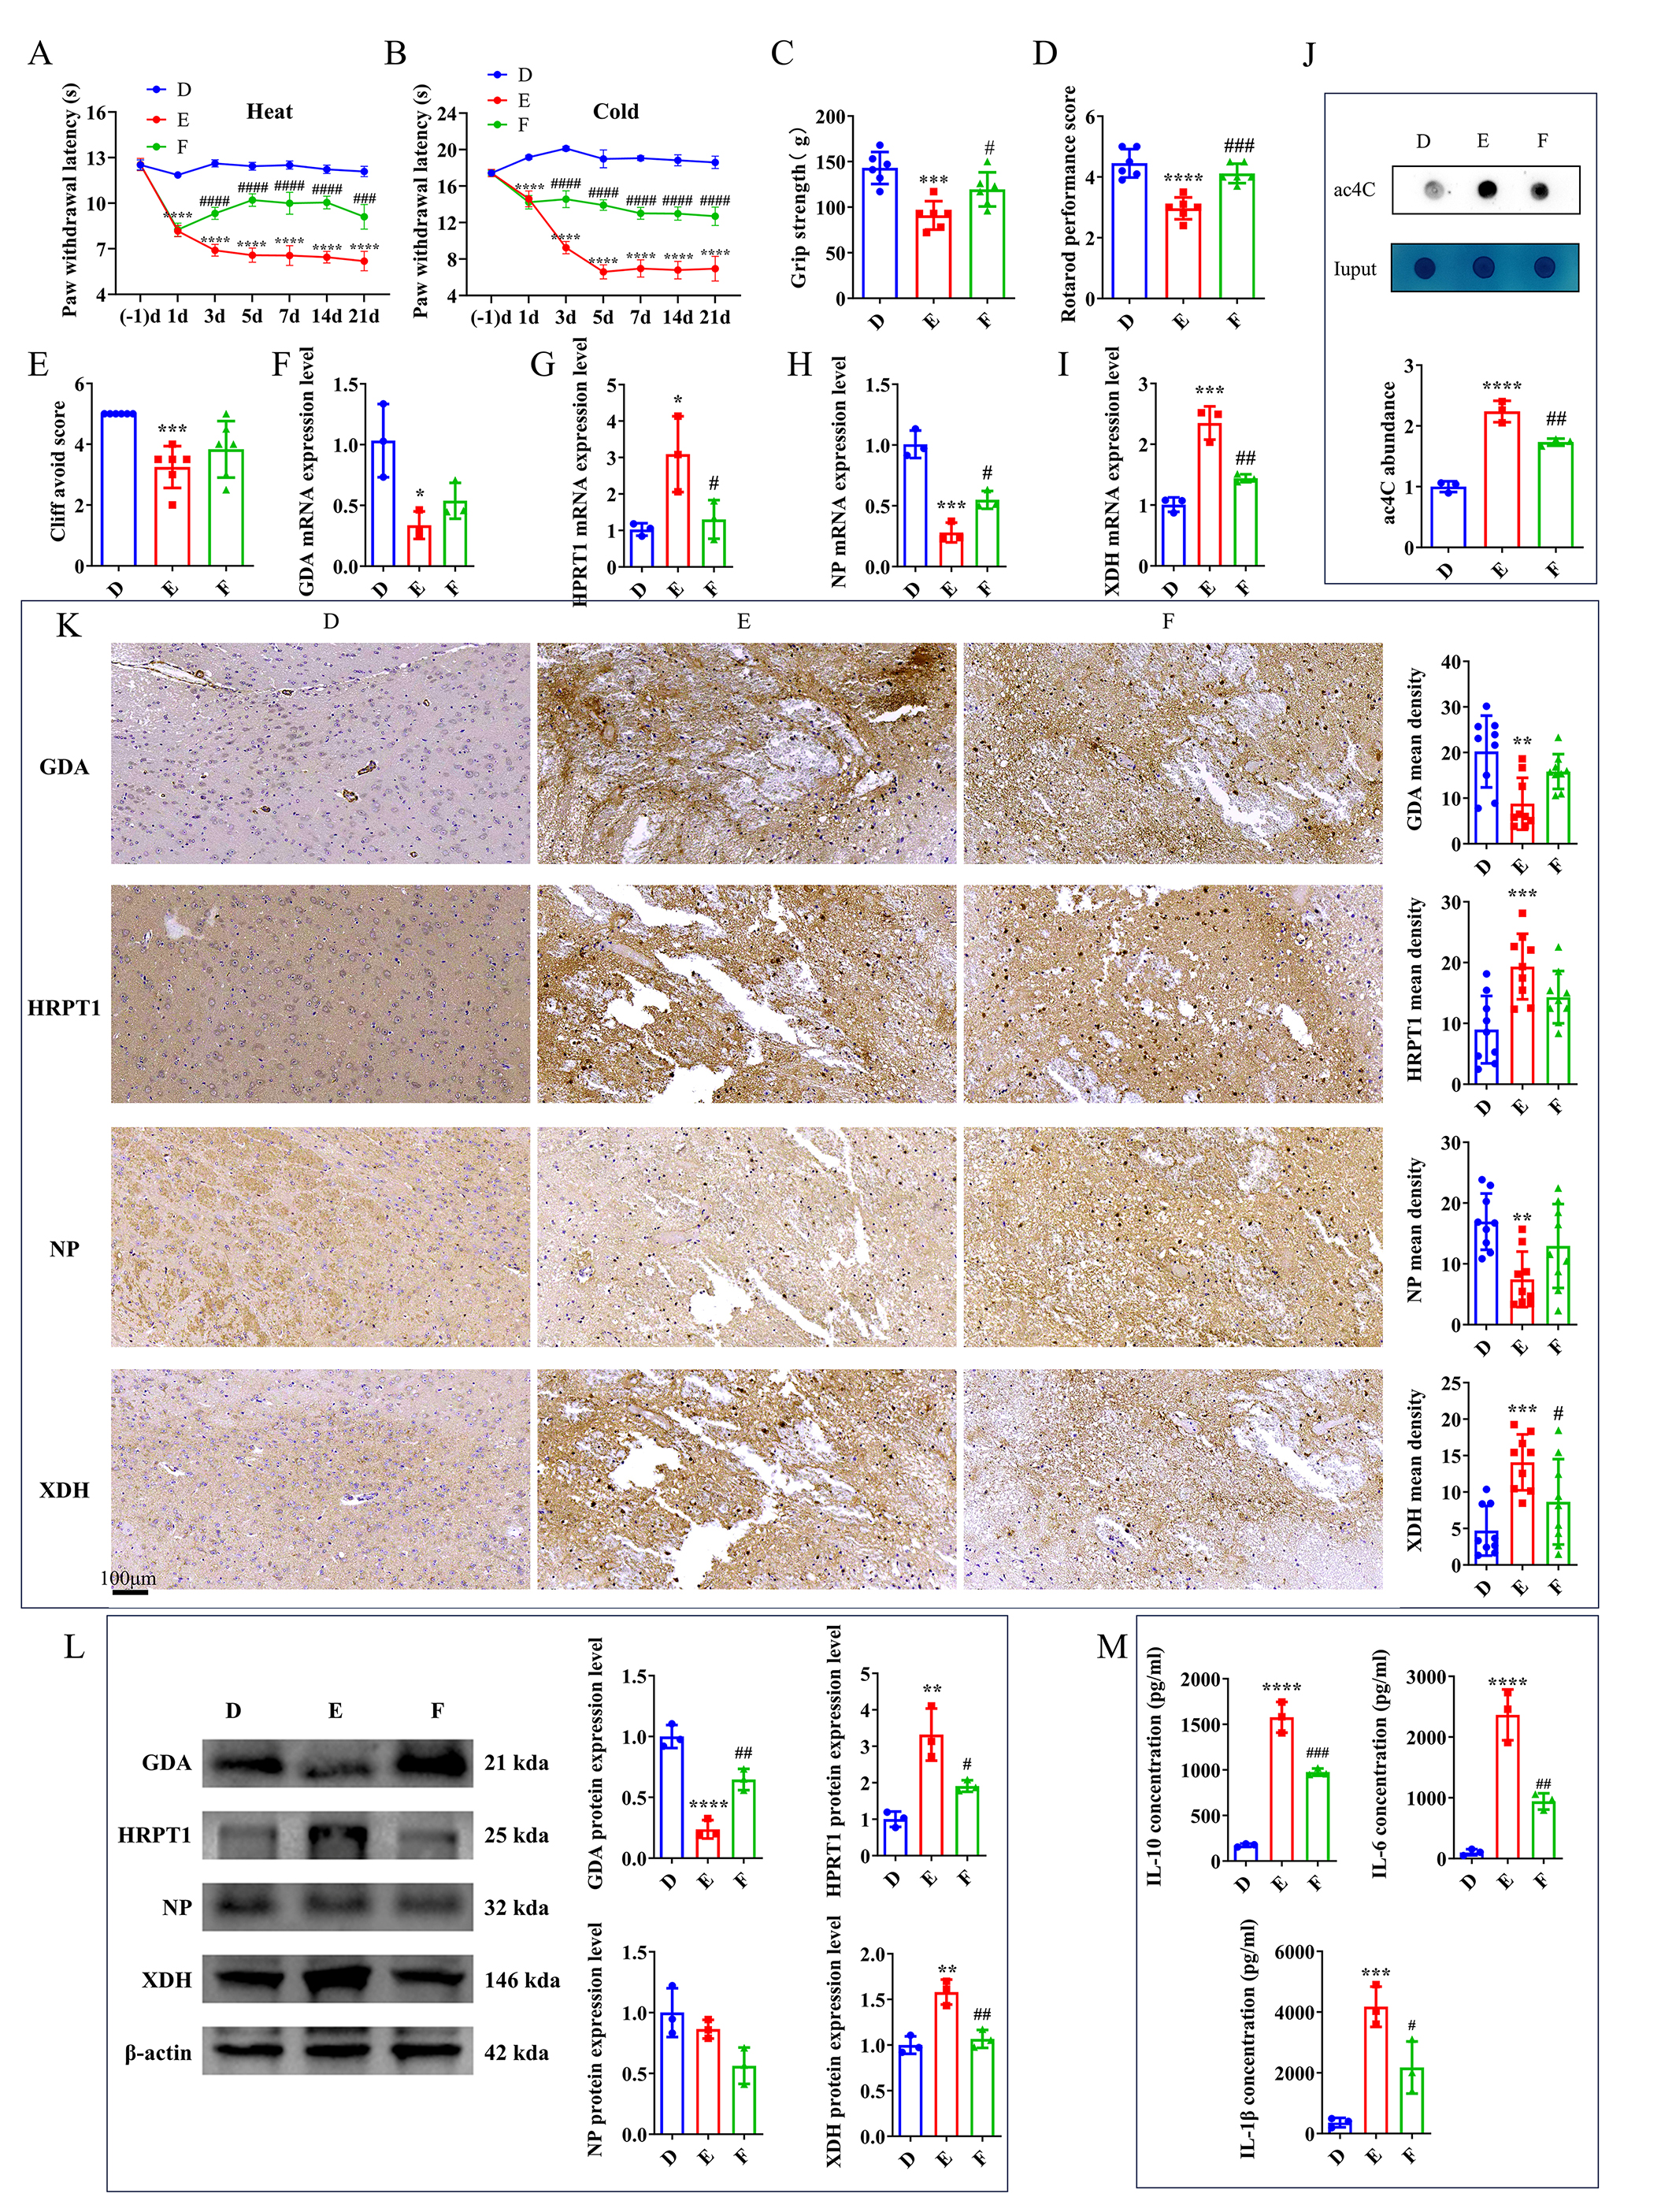 Fig. 6.
FBX alleviates clinical symptoms of TH in mice. (A) Effects of
heat pain stimulation. (B) Effects of cold pain stimulation. (C) Assessment of
forelimb grip strength. (D) Results of the plane righting test. (E) Outcomes of
the cliff avoidance test. mRNA levels of (F) GDA, (G) HPRT1,
(H) NP, and (I) XDH in the mouse brain on day 21
post-intervention. (J) Analysis of ac4C expression level by dot blot in the mouse
brain on day 21 post-intervention. (K) IHC (scale bars: 100 μm) and (L) WB of GDA,
HPRT1, NP, and XDH in the mouse brain on day 21
post-intervention. (M) ELISA of IL-6, IL-10, and IL-1
Gene expression analysis via RT-qPCR in groups D, E, and F revealed significant
differences in the levels of key genes, including XDH, NP,
HPRT1, and GDA between groups D and E. After FBX intervention,
XDH and HPRT1 expression levels in group F were significantly
lower than those in group E, while NP expression level was significantly
higher (Fig. 6F–I). Compared to group D, group E exhibited a significant
increase in ac4C-modified mRNA level, while a decrease in ac4C expression level
was found in group F relative to group E (Fig. 6J). IHC further confirmed these
differences. Group E exhibited significantly altered expression levels of all
four key genes compared with group D. This was largely restored in group F,
although only XDH exhibited a statistically significant difference (Fig. 6K). Western blot analysis showed that XDH, HPRT1, and GDA exhibited consistent expression patterns across the three
experimental groups, aligning with the IHC results (Fig. 6L,
Supplementary Fig. 5). ELISA of inflammatory cytokines (IL-10, IL-6, and
IL-1
CPSP is a debilitating complication that frequently follows TH, characterized by persistent neuropathic pain that profoundly impacts patients’ quality of life. Despite the severity of CPSP, effective treatments remain limited, largely due to the complex pathophysiology and a lack of targeted therapeutic approaches [2, 26]. In addition to chronic pain, TH mainly results in motor and sensory deficits, as well as cognitive impairments. Our recent study demonstrated that the NAT10-specific inhibitor, Remodelin, alleviated brain damage and significantly reduced TH-induced CPSP.
To further investigate the role of NAT10 in TH, integrative multi-omics analyses were employed. Multi-omics approaches possess notable advantages for biomedical research by providing a holistic view of biological systems, integrating diverse layers, such as genomics, transcriptomics, proteomics, metabolomics, and microbiomics. This comprehensive strategy promotes a deeper understanding of disease complexity, the identification of novel biomarkers, and the elucidation of underlying mechanisms that drive pathological processes [17]. By leveraging this approach, we aim to unravel the molecular pathways through which NAT10 contributes to TH and CPSP, paving the way for more effective therapeutic interventions.
A key finding of the present study was the identification of xanthine as a central hub metabolite, which was closely associated with 35 hub genes and 28 hub microorganisms. Xanthine, a byproduct of purine degradation, is produced in the brain through the conversion of hypoxanthine by XO, subsequently converting xanthine into uric acid (UA) [27, 28]. However, the direct role of xanthine in CPSP has not yet been investigated.
The pathogenesis of CPSP involves multiple processes, including oxidative stress. Previous research indicated that neuronal pyroptosis plays a significant role in neuropathic pain, including CPSP, and microglial NOD-like receptor pyrin domain-containing protein 3 (NLRP3) inflammasome-mediated pyroptosis can exacerbate neuroinflammation. Reactive oxygen species (ROS) can promote pyroptosis via the NLRP3 inflammasome; thus, inhibiting ROS generation can alleviate neuronal pyroptosis following ischemic stroke [29]. This study identified xanthine as a key factor promoting oxidative stress through the production of UA and ROS, in which this process is closely linked to post-stroke pathological changes. Although a higher UA level is correlated with superior outcomes in intracerebral hemorrhage (ICH) patients, the elevated serum XO level is associated with the increased stroke risk and poorer prognosis. Moreover, excessive XO activity is a marker of severity in both ICH and traumatic brain injury (TBI). These findings highlight the dual role of xanthine metabolism in post-stroke pathology, demonstrating that balancing XO activity may be crucial for improving outcomes in thalamic hemorrhage-induced CPSP [30, 31, 32, 33]. Notably, NAT10 has been reported to enhance the expression levels of antioxidant genes (e.g., solute carrier family 7 member 11 (SLC7A11) and glutamate-cysteine ligase catalytic subunit (GCLC)) through ac4C modification, thereby reducing ROS levels and maintaining cellular redox homeostasis [34, 35, 36]. Based on this evidence, NAT10 may indirectly regulate xanthine metabolism through modulation of oxidative stress, providing a plausible molecular link between NAT10 activity and the pathogenesis of CPSP.
In the context of neuropathic pain, the elevated xanthine level has been linked to pain progression. Singh et al. [37] demonstrated that inhibiting guanine metabolism, blocking its conversion into xanthine, reduced mechanical pain following spinal cord injury. Additionally, febuxostat, an XO inhibitor, has been shown to preserve blood-brain barrier integrity and alleviate behavioral abnormalities in mice following ICH [38]. Similarly, allopurinol, another XO inhibitor, reduced neuroinflammation and produced antinociceptive effects on a sciatic nerve injury model [39]. These findings suggest that targeting xanthine metabolism may provide therapeutic relief for neuropathic pain.
Furthermore, Xanthine derivatives have been explored for their therapeutic
potential. For instance, KMUP-1, a xanthine derivative, has been shown to reduce
inflammation and hyperalgesia in a chronic constriction injury model by
inhibiting the mitogen-activated protein kinase (MAPK) and NF-
Previous studies have demonstrated the multifaceted cytoprotective effects of
FBX on ICH models. FBX has been shown to alleviate neuronal injury and apoptosis
by suppressing inflammatory responses, mitigating endoplasmic reticulum and
mitochondrial stress, preserving blood-brain barrier integrity, and improving
energy metabolism [44]. In a mouse model of ICH, FBX could improve neurological
dysfunction and limit brain damage by reducing neuronal degeneration and
apoptosis, decreasing levels of pro-inflammatory cytokines (TNF-
Notably, this study is the first to demonstrate a strong connection among g_Rikenellaceae_RC9_gut_group, Masp2, and xanthine, revealing novel mechanisms involved in CPSP development. However, a limitation of this study is that, although significant correlations were identified among key genes, metabolites, and microorganisms in CPSP, the precise mechanisms by which Remodelin may exert its therapeutic effects through these pathways remain to be explored.
The integrative multi-omics analysis identified differentially expressed microbiota, metabolites, genes, and pathways associated with TH and CPSP. Xanthine emerged as a notable molecular factor in CPSP, providing new insights into the therapeutic potential of NAT10 inhibitors, such as Remodelin, for managing TH-induced complications. While this study provided valuable information on the molecular mechanisms underlying CPSP, further clinical and experimental validation is required to translate these findings into practical therapeutic applications.
TH, Thalamic Hemorrhage; NAT10, N-acetyltransferase 10; ac4C, N4-acetylcytidine; CPSP, Central Post-Stroke Pain; Coll IV, Collagenase IV; PBS, Phosphate-Buffered Saline; IHC, Immunohistochemistry; WB, Western blot; ELISA, Enzyme-Linked Immunosorbent Assay; 16S rDNA, 16S ribosomal DNA; ITS2, Internal Transcribed Spacer 2; PCR, Polymerase Chain Reaction; LC-MS, Liquid Chromatography–Mass Spectrometry; UPLC, Ultra-Performance Liquid Chromatography; IDA, Information Dependent Acquisition; QC, Quality Control; ASVs, Amplicon Sequence Variants; PCoA, Principal Coordinate Analysis; LEfSe, Linear Discriminant Analysis Effect Size; PCA, Principal Component Analysis; OPLS-DA, Orthogonal Partial Least Squares Discriminant Analysis; VIP, Variable Importance in Projection; KEGG, Kyoto Encyclopedia of Genes and Genomes; DEGs, Differentially Expressed Genes; GO, Gene Ontology; LASSO, Least Absolute Shrinkage and Selection Operator; FBX, Febuxostat; RT-qPCR, Quantitative Reverse Transcription Polymerase Chain Reaction; GAPDH, Glyceraldehyde-3-Phosphate Dehydrogenase; XO, Xanthine Oxidase; UA, Uric Acid; ROS, Reactive Oxygen Species; ICH, Intracerebral Hemorrhage; MAPK, Mitogen-Activated Protein Kinase; NF-
Transcriptomic data have been deposited in the GEO database under accession number of GSE275066 (https://www.ncbi.nlm.nih.gov/geo/query/acc.cgi?acc=GSE275066). The 16S rDNA sequencing data are available in NCBI’s SRA under BioProject number of PRJNA1189080 (https://www.ncbi.nlm.nih.gov/bioproject/?term=PRJNA1189080). Metabolomic data have been deposited in the MetaboLights database under accession number of MTBLS11752 (https://www.ebi.ac.uk/metabolights/editor/MTBLS11752/descriptors).
YL: conceptualization, methodology, experiments, software, funding acquisition, and formal analysis. JG: validation and formal analysis. YX: formal analysis, and writing — experiments, software, review & editing, and resources. TH: writing — review & editing, visualization, project administration, and funding acquisition. All authors contributed to editorial changes in the manuscript. All authors read and approved the final manuscript. All authors have participated sufficiently in the work and agreed to be accountable for all aspects of the work.
This research was approved by the Animal Care and Use Committee of the Medical College of Yangzhou University (Yangzhou, China; Approval No. 202303874). All animal experiments were performed in strict accordance with the National Institutes of Health Guide for the Care and Use of Laboratory Animals.
Not applicable.
This study was supported by the National Natural Science Foundation of China (Grant Nos. 82001170), the Class A Medical Technology Expertise Fund (Grant No. JSGG13), the Research Grant of Northern Jiangsu People’s Hospital (grant Nos. YJJ230056), lv Yang Jin Feng program (grant Nos. LYJF00048), Yangzhou Natural Science Foundation (grant Nos. YZ2024159), Yangzhou Talent Program Project (grant Nos. YCJH00021), Jiangsu Province Traditional Chinese Medicine Science and Technology Development Plan - Young Talent Program (grant Nos. QN202423), and Yangzhou Basic Research Program (Joint Project) - Health and Medicine Category (grant Nos. 2025-3-01).
The authors declare no conflict of interest.
Supplementary material associated with this article can be found, in the online version, at https://doi.org/10.31083/JIN44643.
References
Publisher’s Note: IMR Press stays neutral with regard to jurisdictional claims in published maps and institutional affiliations.