
- Academic Editors
Background: Methamphetamine (METH) is a highly addictive drug that directly affects the central nervous system. METH use not only harms the user’s health but also poses risks and costs to society. Prolonged METH dependence has been shown to impair cognition, which may be the primary factor in impulsive drug-seeking behaviors and high relapse rates. However, the molecular mechanisms underlying METH addiction and METH-induced cognitive decline remain poorly understood. Methods: To illuminate the potential molecular mechanisms underpinning METH addiction, we compared serum protein expression levels between 12 long-term METH users and 12 healthy controls using label-free quantitative proteomics. Bioinformatic analyses were conducted to determine functional networks and protein-protein interactions. Results: In total, 23 differentially expressed proteins were identified between the two groups. The differentially expressed proteins were related to cognitive dysfunction, neuroinflammation, immune impairment, metabolic disturbances, and calcium binding and regulation. Conclusions: These 23 proteins may underpin the multi-system damage induced by chronic METH exposure. Our findings provide novel insights into the molecular basis of METH addiction and inform potential prevention and treatment strategies for individuals with METH dependence.
Methamphetamine (METH) is a highly addictive psychostimulant drug that causes euphoria and arousal. Originally used as an anti-fatigue and diet aid, METH is now recognized to have dependence-forming properties and is classified as a Schedule II controlled substance by the USA Food and Drug Administration (Scheduling of Controlled Substances: Placement of Methamphetamine into Schedule II. Federal Register) [1]. Due to easy access to its components and simple manufacturing process, alongside its strong rewarding effects, METH is used as an illicit drug globally, causing substantial individual and societal harm [2]. It is noteworthy that due to the highly addictive nature of METH, prolonged use of this substance significantly increases the likelihood of developing an addiction. Therefore, in this manuscript, the terms ‘METH addiction’ and ‘prolonged/long-term METH use/dependence’ are employed interchangeably for the sake of conceptual coherence and effective paraphrasing.
Prolonged METH use damages both health and cognition [3]. The chronic effects of METH elicit hyperactivity in the central nervous system (CNS) by elevating extracellular dopamine, serotonin, and norepinephrine [4]. Long-term METH exposure may result in significant cognitive impairments [3]. A meta-analysis found that individuals addicted to METH have significant deficits in impulsive behavior, reward processing, and social cognition processes [3]. Attention, executive function, speech, learning, memory, visual memory, and working memory processes are also mildly impaired [3]. A comprehensive review incorporating numerous neuroimaging studies revealed that individuals with METH dependence exhibit various abnormalities in brain activity. These abnormalities are primarily observed in the prefrontal cortex and striatum, areas that are essential for cognitive flexibility, inhibitory control, and decision-making [5]. Those cognitive deficits likely contribute to the impulsive drug-seeking behavior of METH users. Due to the legal prohibition of METH use in many countries, such as China, testing cognitive function in active METH users raises significant ethical concerns. Consequently, most studies exploring the molecular mechanisms underlying METH-induced cognitive dysfunction have predominantly utilized animal models. Rodent studies have shown that chronic METH exposure damages brain structure and function by disrupting the blood-brain barrier, eliciting neuroinflammation, impairing neuron formation and differentiation [6], and altering gene expression [7, 8].
Prolonged METH exposure also enhances amyloid precursor protein (APP) expression, indicative of the neurodegenerative changes observed in Alzheimer’s disease (AD) and Parkinson’s disease (PD) [9, 10]. In rats, chronic METH exposure leads to emotional disorders and impulsive drug-seeking behavior associated with prefrontal cortical dopamine depletion and decreased striatal dopamine transporters [10]. Dopaminergic deficits persist even after prolonged withdrawal, suggesting potential long-term impacts on cognitive function [10].
Given the significant impact of the dopaminergic system in METH-induced
cognitive effects, it is crucial to recognize METH’s extensive influence on a
broader spectrum of biological pathways [11]. An illustrative example of this is
the damage that METH inflicts on midbrain dopamine neurons, leading to the
release of neuroinflammatory agents like nuclear factor
kappa-light-chain-enhancer of activated B cells (NF-
Proteomic approaches, especially the label-free technique, offer an expansive framework for elucidating METH’s complex mechanisms. This sophisticated method facilitates in-depth analysis of proteomic changes associated with METH use, potentially uncovering diverse biological pathways that contribute to cognitive deterioration and the development of addictive behaviors [11]. The central hypothesis of this study is that prolonged METH exposure leads to substantial alterations in serum proteomic profiles, reflecting not only disruptions in neurotransmitter function but also a range of biological processes integral to the pathophysiology of addiction and cognitive impairment.
Although the dopamine reward system appears to mediate METH addiction in part, the specific mechanisms underpinning addiction remain unclear [16, 17]. Proteomic analyses enable exploration of the mechanisms of drug dependence. Label-free proteomics quantitatively analyzes differences in protein expression between samples and has been widely used in neuroscientific research. Compared with labeling techniques, this technology is more cost-effective, sensitive, and accurate.
Thus, in the present study, we used label-free proteomics to compare serum protein profiles between long-term METH users and healthy controls. This systems-level analysis aimed to investigate the potential molecular mechanisms of METH addiction and the associated cognitive decline. Our findings shed light on the molecular underpinnings of METH dependence, revealing a comprehensive profile of serum proteins that are differentially expressed in individuals with METH dependence. In addition, these results offer novel insight into the multi-systemic nature of METH’s adverse effects and may guide the design of comprehensive treatment strategies that address both the addiction and its widespread health implications.
This study was approved by the Ethics Committee of Shanghai University of Sport (No. 102772019RT044) and conducted in accordance with the Helsinki Declaration of 1975. All participant information remained confidential and all patients provided written informed consent. Twelve individuals with METH dependence were recruited from compulsory detoxification programs in Zhejiang province, China. Twelve control subjects were recruited from the community within Changhai Street, Yangpu District, Shanghai. These participants were selected according to the following criteria: (1) men aged 18–45 years; (2) with long-term use of METH (2 or more years); (3) confirmed to meet the criteria for methamphetamine dependence as outlined in the DSM-V (Diagnostic and Statistical Manual of Mental Disorders, Fifth Edition) based on the Structured Diagnostic Interview [18]; (4) without a serious infectious disease, autoimmune disease, severe mental illness, neurological disease, Human Immunodeficiency Virus (HIV) infection, obvious disease that would affect organ quality, hypertension, hyperlipidemia, diabetes, tumor, or other disease; (5) without use of nonamphetamine-type drugs; and (6) without consumption of pharmaceutical drugs, cocaine-like substances, alcohol, or tobacco within 2 weeks of serum sampling. The METH-dependent group had a mean age of 29.83 years (standard deviation [SD] = 5.80 years), an average duration of drug use spanning 4.18 years (SD = 1.40 years), a typical weekly drug usage frequency of 2.21 times (SD = 1.94 times), and a mean quantity of 0.265 g per drug consumption event (SD = 0.11 g). Participants in the control group were 12 healthy men (mean age 32.58 years, SD = 6.32 years) who met the same criteria as the METH-dependent group, except without history of drug misuse. The 12 control participants were randomly assigned to one of three subgroups (A, B, or C), with four participants in each subgroup. Similarly, the 12 participants with METH dependence were randomly assigned to one of three subgroups (D, E, or F), with four participants in each subgroup.
Fasting venous blood
samples (5 mL) were drawn from the 24 participants and clotted at 4 °C for 30 min.
The samples were then centrifuged at 1000
Sodium dodecyl sulfate–polyacrylamide gel electrophoresis was used to separate the proteins in the serum sample (40 µg/sample). The gels were cut and the pieces were washed twice with double-distilled water. Silver dye decolorizer (equal volumes of 100 mmol/L sodium thiosulfate (Thermo Fisher Scientific, Fair Lawn, NJ, USA) and 30 mmol/L potassium ferricyanide (Thermo Fisher Scientific, Fair Lawn, NJ, USA)) was used to destain the gel, which was then washed twice with water. Acetonitrile was used to dehydrate the gel fractions. The reducing reagent (dithiothreitol, I1149-25G, 10 mmol/L, SIGMA, Saint Louis, MO, USA) was allowed to react for 1 h at 37 °C with the gel fractions, which were then dehydrated with acetonitrile. A cysteine blocking reagent (iodoacetamide, 25 mmol/L, Thermo Fisher Scientific, Fair Lawn, NJ, USA) was added and reacted with the gel fractions for 30 min at room temperature in the dark. The fractions were washed twice and dehydrated. The gel pieces were then digested using trypsin (V5113, Promega, Madison, WI, USA) overnight at 37 °C. An acetonitrile (50%) and trifluoroacetic acid (0.1%) solution (400 µL) was added and incubated at 37 °C for 30 min. This step was repeated twice. Finally, the eluates from each respective sample were combined, and the peptides were desalted and freeze dried.
The peptides were analyzed using an Orbitrap Fusion Lumos Tribrid (Thermo Fisher Scientific, San Jose, CA, USA) mass spectrometer using a chromatographic column (ChromXP, C18, 3 µm, 120 Å; catalog No. 805-00120, SCIEX, Framingham, MA, USA). A binary solvent system composed of water containing buffer A (0.1% formic acid and 2% acetonitrile in water) and buffer B (98% acetonitrile and 0.1% formic acid) was used for liquid chromatography. The peptides were separated by a gradient of buffer B (5% B, 0–5 min; linearly increasing concentrations of 5%–40% B within 100 min; increased to 80% B in 1 min and washed for 5 min; decreased to 5% B in 1 min and isocratic at 5% B for 13 min). The solvent system flow rate was 300 nL/min. The mass spectrometer was operated in the scan range of 300–1400 m/z, with a spray voltage at 2500 V and a dynamic exclusion time of 12 s. All data were acquired using “high-low” mode, in which during a maximum 3-s cycle time, the most abundant multiply-charged parent ions were selected with high resolution (120,000 at m/z 200) from the full scan for higher-energy collisional dissociation fragmentation. Precursor ions with singly charged and charge states over 7 were excluded. The target value for the second mass spectrometry (MS2) spectra was set at 5000 (the automated gain control was enabled with a maximum injection time of 35 ms), the isolation window was set to 1.6 m/z, and 35% was used for the normalized collision energy. Data were acquired using Xcalibur software 4.1 (Thermo Fisher Scientific, Waltham, MA, USA) [19].
All mass-spectrometric data were analyzed using MaxQuant 1.5.2.8 (University of Halle-Wittenberg, Halle, Germany; https://www.maxquant.org) [20] against the human UniProt FASTA database (https://www.uniprot.org/proteomes/UP000005640). Carbamidomethyl cysteine was searched as a fixed modification, and oxidized methionine and protein N-terminal acetylation as variable modifications. Enzyme specificity was set to trypsin/P. Two missing cleavage sites were allowed. For mass spectrometry and tandem mass spectrometry, the tolerance of the main search for peptides was set at 7 ppm and 20 ppm, respectively. The peptide, protein, and site false discovery rates were fixed at a significance level not greater than 0.01. Label-free protein quantitation was performed with a minimum ratio count of 2.
Quantitative data for the detected proteins were analyzed using MetaboAnalyst software 5.0 (McGill University, Montreal, Canada; https://www.metaboanalyst.ca) [21]. Proteins were removed from further analysis if the detection values were missing in more than 50% of the samples from either the METH-dependent or control group or if the quantitative values were consistent across all samples.
For proteins with missing quantitative values, missing values were imputed as one-half the minimum positive value in the original data using the minimum fill method. To obtain normalized protein abundance data for subsequent analyses, the summed intensity values for all proteins measured in each sample were calculated, and individual protein intensities within a sample were divided by the sample’s total intensity value. Hierarchical clustering analysis and visualization of the acquired protein profiles for all samples and genes were performed using Multiple Array Viewer software 4.9.0 (Agilent Technologies, Santa Clara, CA, USA; https://webmev.tm4.org) [22]. Principal component analysis of the proteins was carried out using MATLAB software R2019b (MathWorks, Natick, MA, USA; https://www.mathworks.com) [23]. The orthogonal partial least squares discriminant analysis was performed using SIMCA software 14.1 (Umetrics, Umeå, Sweden; https://www.sartorius.com/en/products/process-analytical-technology/data-analytics-software/mvda-software/simca) [24].
To identify proteins with significantly different expression between
METH-dependent and control groups, Statistical Package for the Social Sciences
(SPSS, 24.0) (International Business Machines Corporation, Armonk, NY, USA;
https://www.ibm.com/products/spss-statistics) software [25] was utilized. A
threshold filter requiring at least a two-fold change in the protein ratio
between groups and a p-value
A total of 459 proteins were identified by proteomic workflow, and 308 proteins with quantitative information were finally obtained using MetaboAnalyst software analysis (Supplementary Table 1). We used the Multiple Array Viewer software to perform hierarchical clustering analysis at both the sample- and gene-levels of those 308 proteins (Fig. 1). The clustering results indicated that the protein expression profiles of the METH-dependent group samples (D, E, and F) exhibited a high degree of resemblance, suggesting that these samples share a closely related pattern of protein expression. Similarly, the protein expression profiles within the control group samples (A, B, and C) displayed a substantial similarity, reflecting a consistent pattern of expression distinct from the METH-dependent group. This similarity, as evidenced by the proximity of the samples to one another on the dendrogram and the homogeneity in expression levels represented by the color coding on the heat map, underscores the comparative analysis of gene expression levels within each group. Significant differences in the protein expression profiles were observed between the two sets of groups. Correlation analysis of the samples showed high intragroup correlation but low intergroup correlation between the METH-dependent and control groups (Fig. 2).
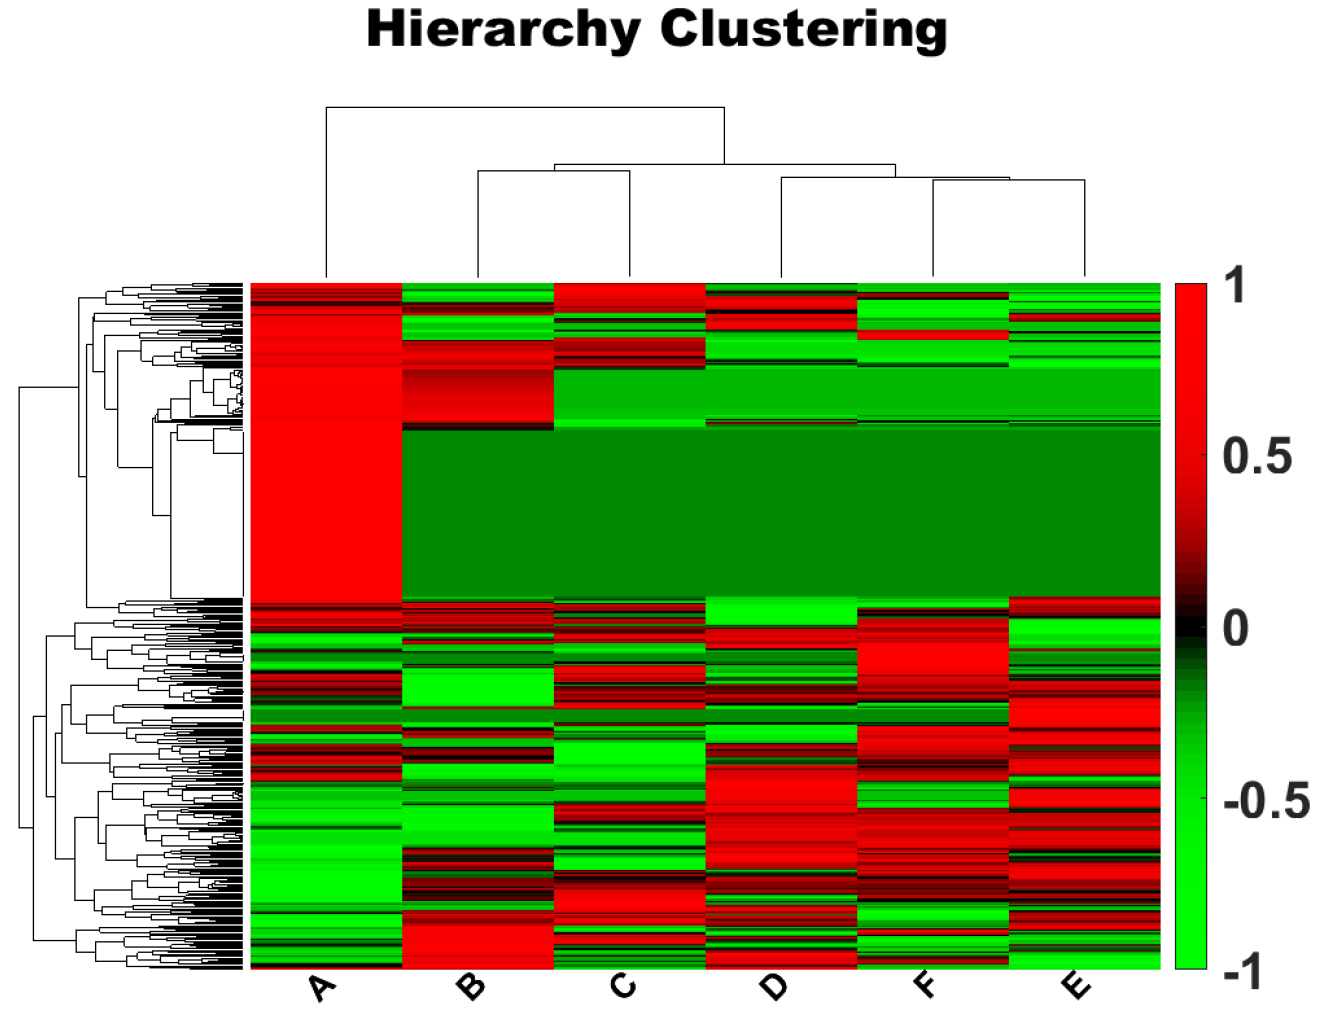 Fig. 1.
Hierarchical clustering analysis of genes. Each column represents a sample and each row represents a gene. The tree structure above the colored area represents the clustering of similarity between samples, and the tree structure on the left represents the clustering of similarity between genes. Red indicates a high level of expression, and green indicates a low level of expression. Letters along the x-axis indicate the participant group. Along the y-axis, positive numbers indicate upregulation and negative numbers indicate downregulation.
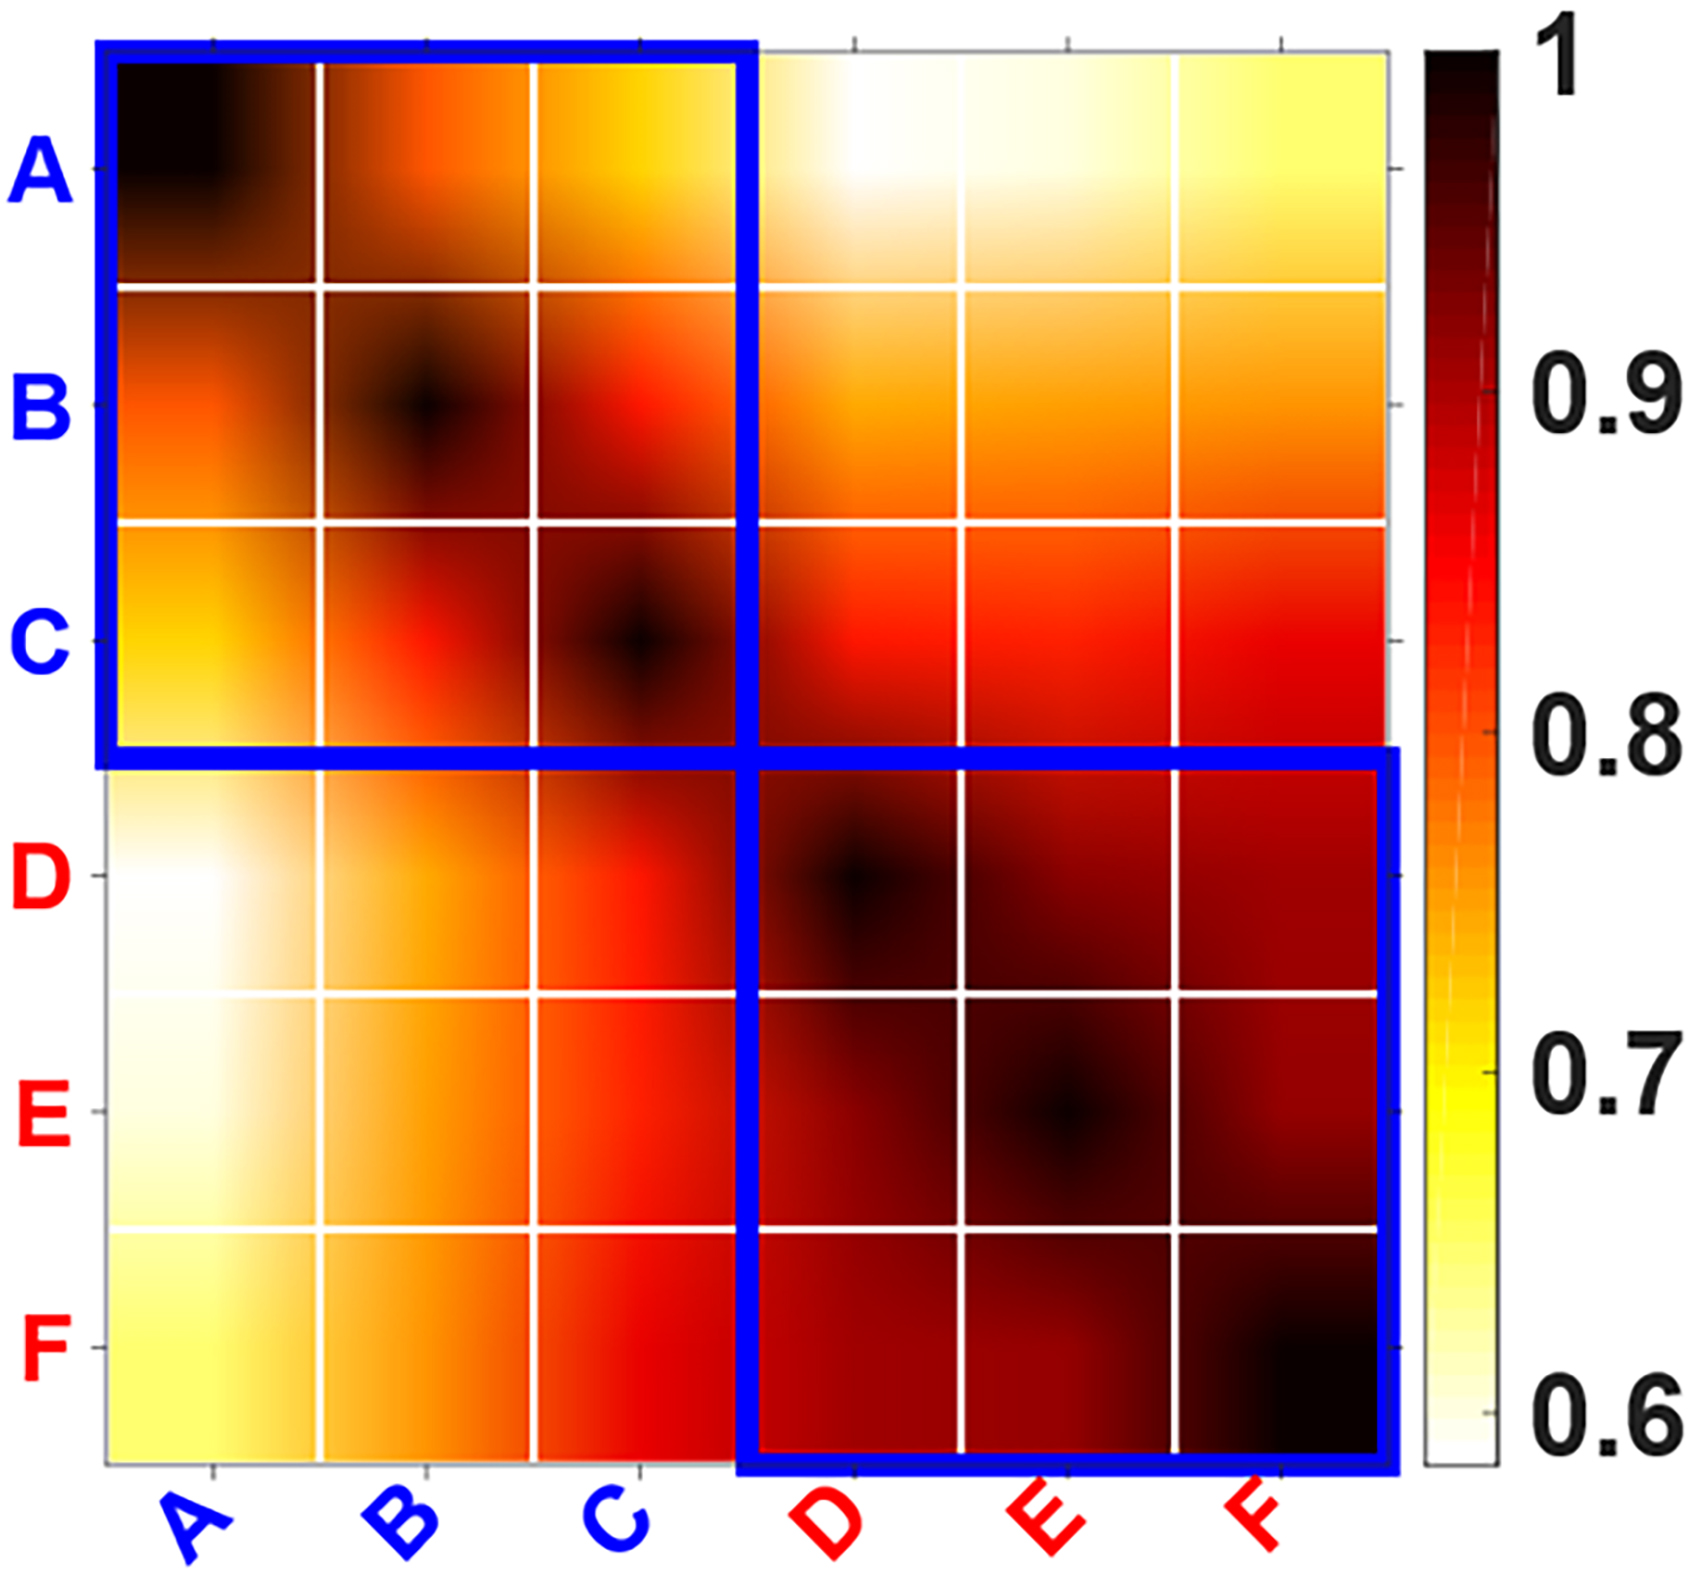 Fig. 2.
Correlation analysis of the samples. The ordinate and abscissa represent the six samples: A, B, C, D, E, and F. The color depth represents the degree of correlation between the samples as indicated in the color bar.
We used MATLAB software to perform two- and three-dimensional principal component analyses of the 308 proteins (Fig. 3) and completed the orthogonal partial least squares discriminant (OPLS) analysis using SIMCA software (Fig. 4). Both the principal component analysis and OPLS results indicated close clustering of samples within the same group and a clear separation between METH-dependent and control groups based on protein expression levels.
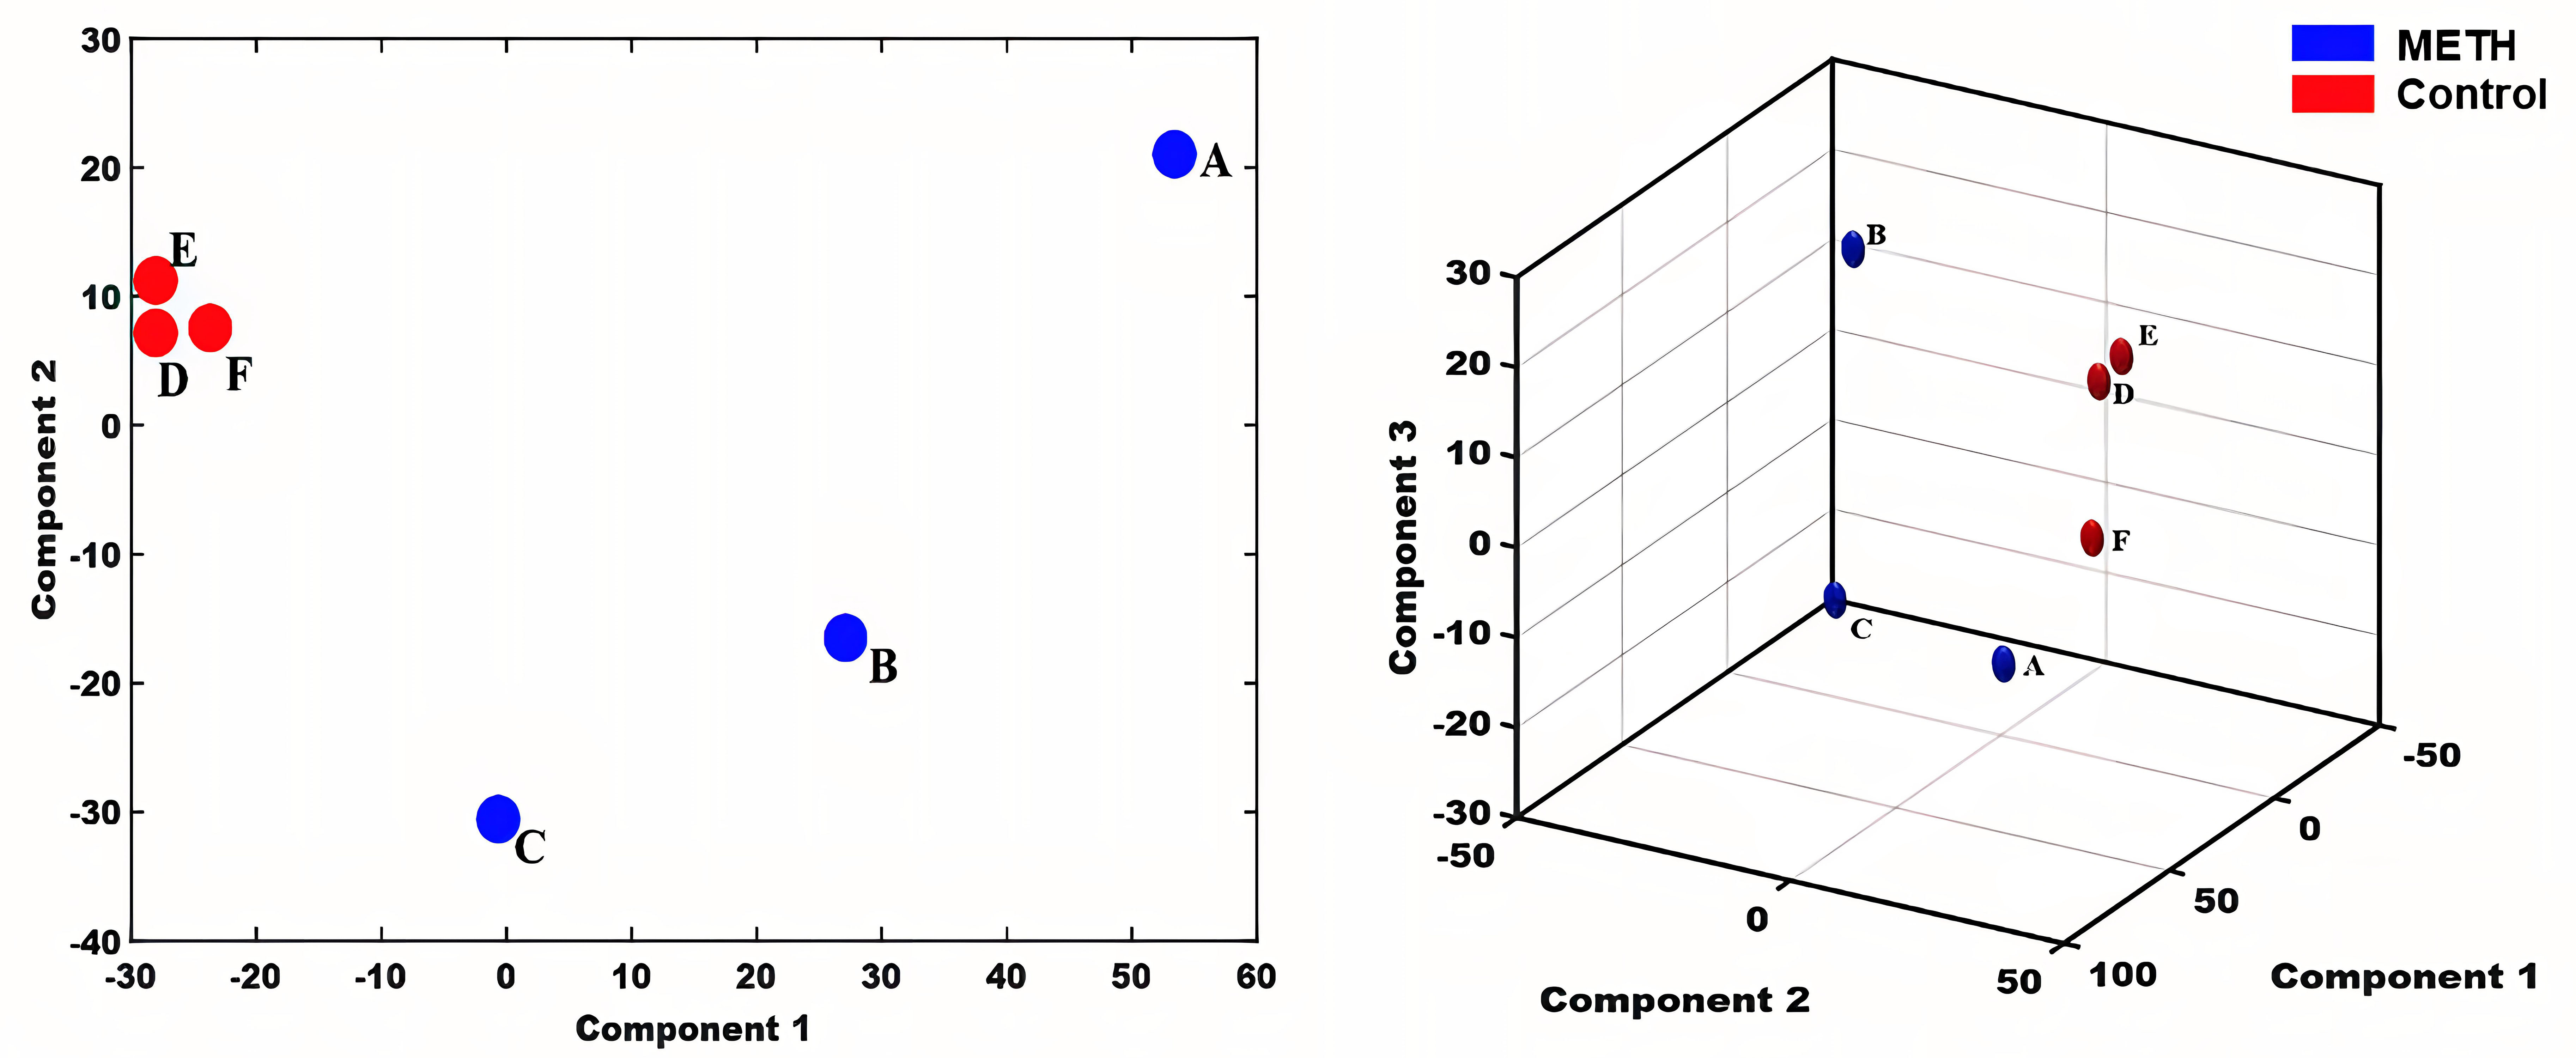 Fig. 3.
Principal Component Analysis. Letters indicate the participant group, with A, B, and C representing samples from healthy individuals and D, E, and F representing samples from individuals with methamphetamine dependence. METH, methamphetamine.
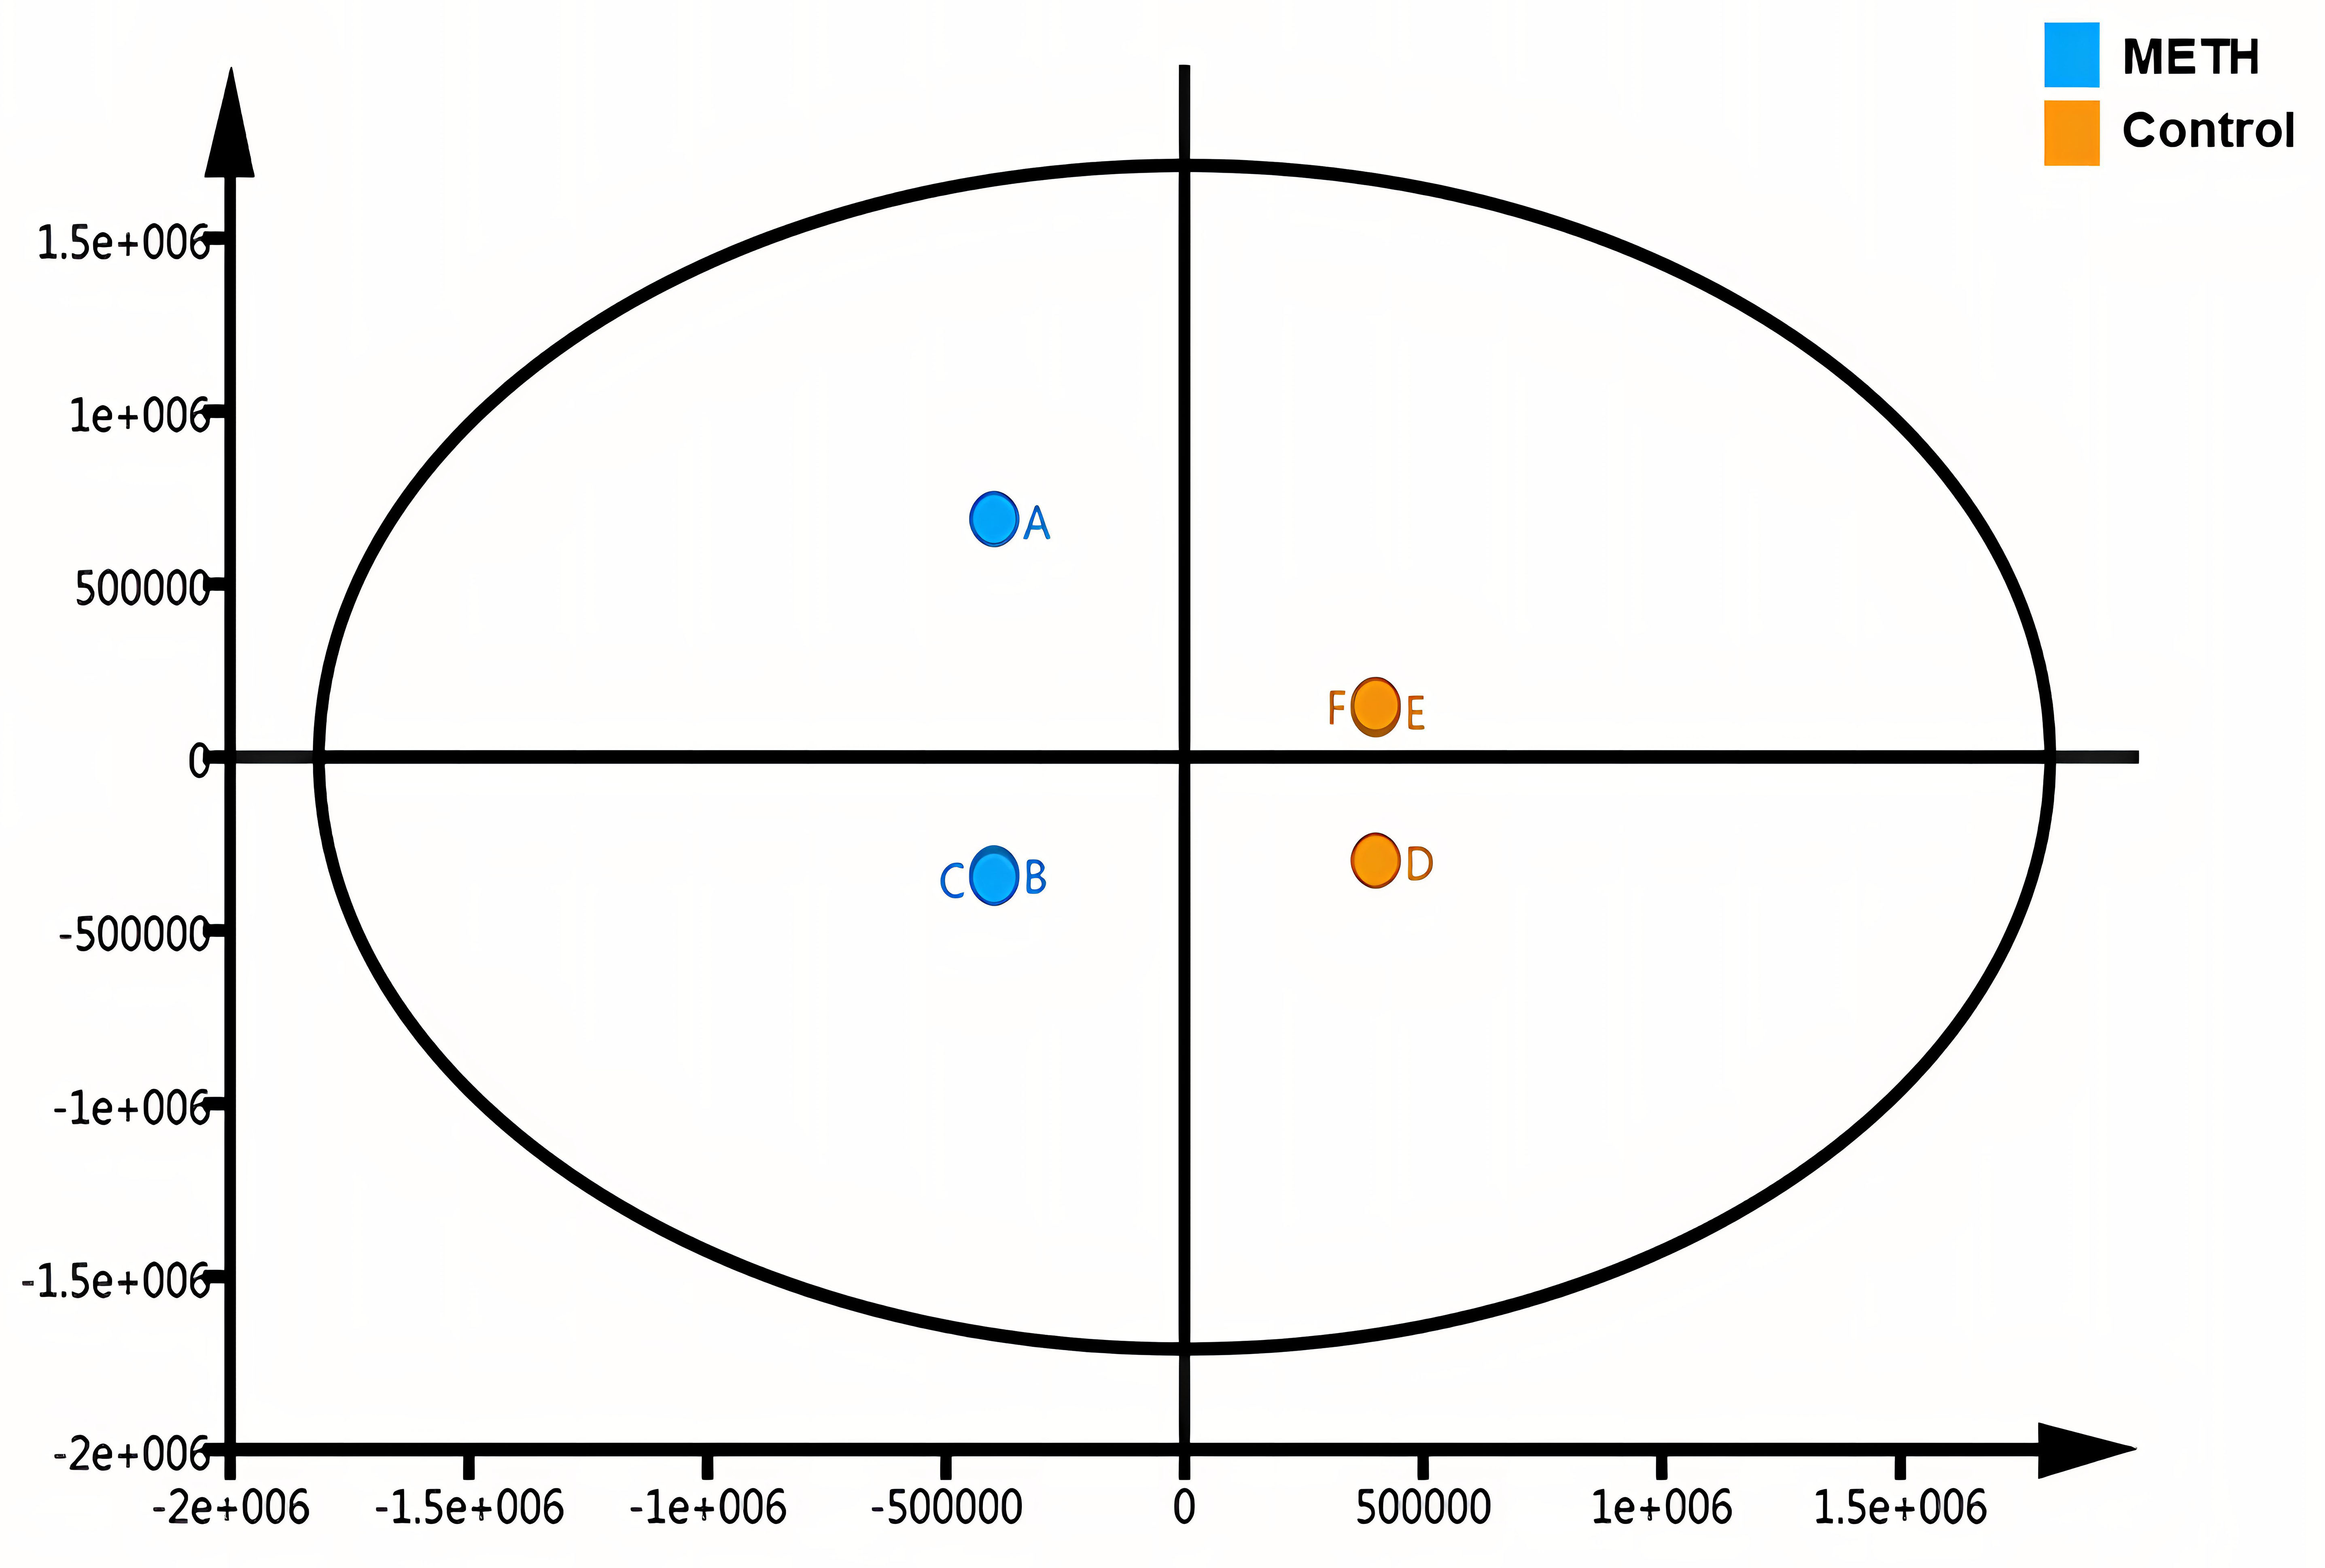 Fig. 4.
Orthogonal partial least squares discriminant analysis. Letters indicate the participant group, with A, B, and C representing samples from healthy individuals and D, E, and F representing samples from individuals with methamphetamine dependence.
To identify differentially expressed proteins (DEPs) between the METH-dependent
and control groups, a threshold filter requiring at least a two-fold change in
expression ratio and a value of p
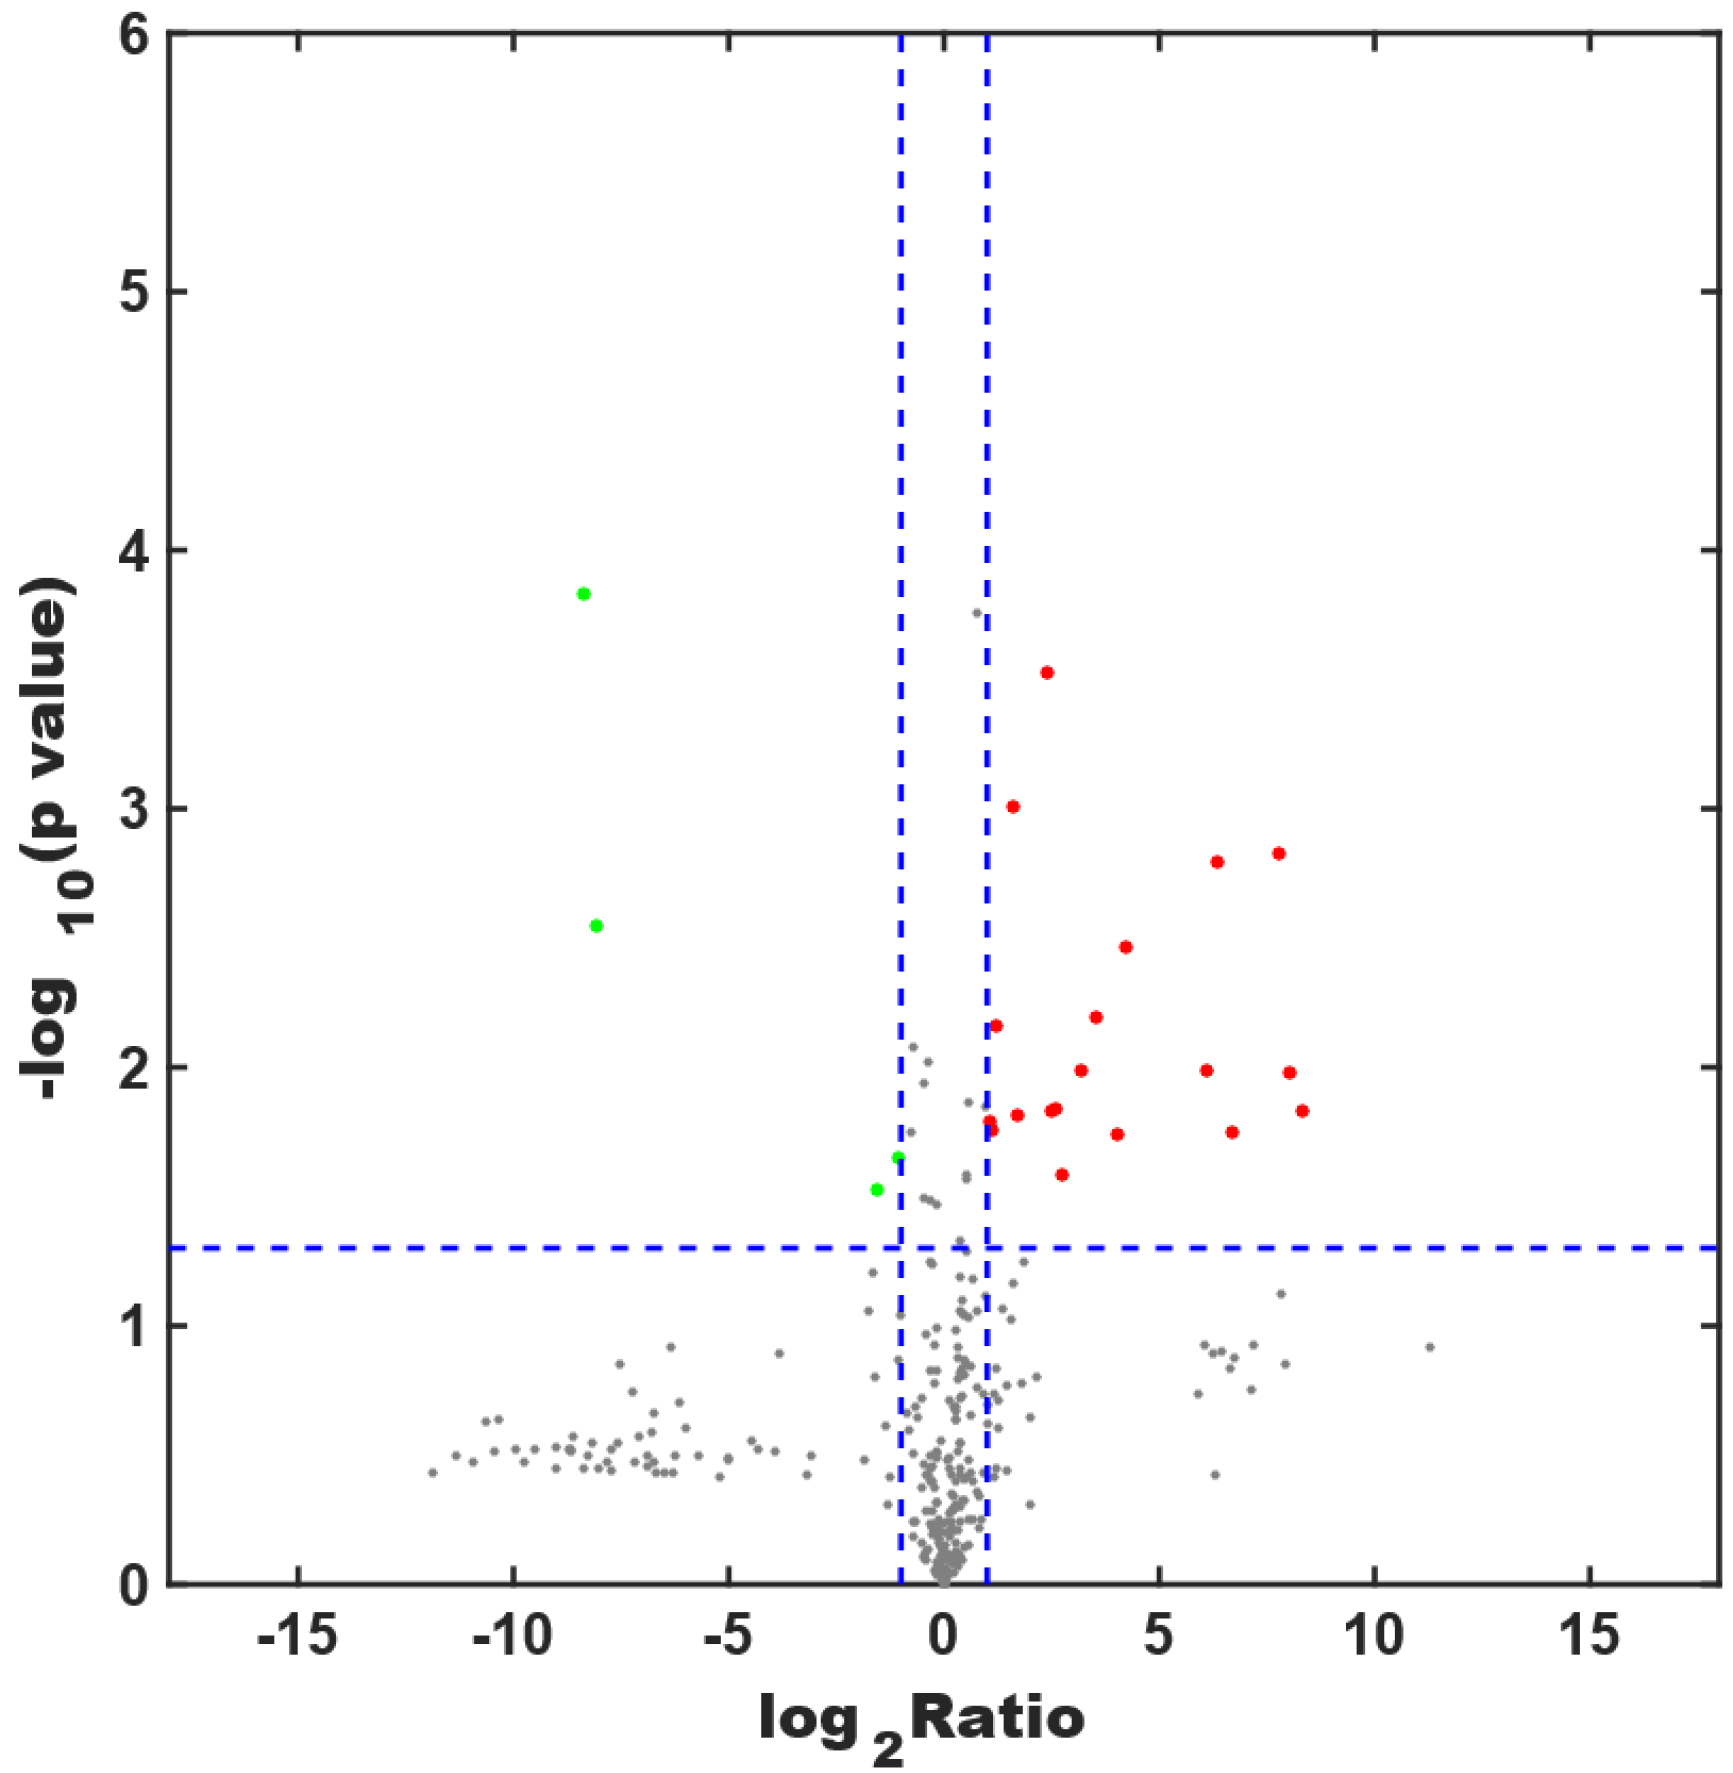 Fig. 5.
Screening for differentially expressed proteins. The x-axis shows the logarithm of the ratio of protein expression between the METH-dependent and control groups, and the y-axis shows the p value. Each dot in the figure represents a protein. A red dot is a highly expressed protein, whereas a green dot is a protein with low expression. Gray dots represent proteins with expression levels that do not differ between the two groups.
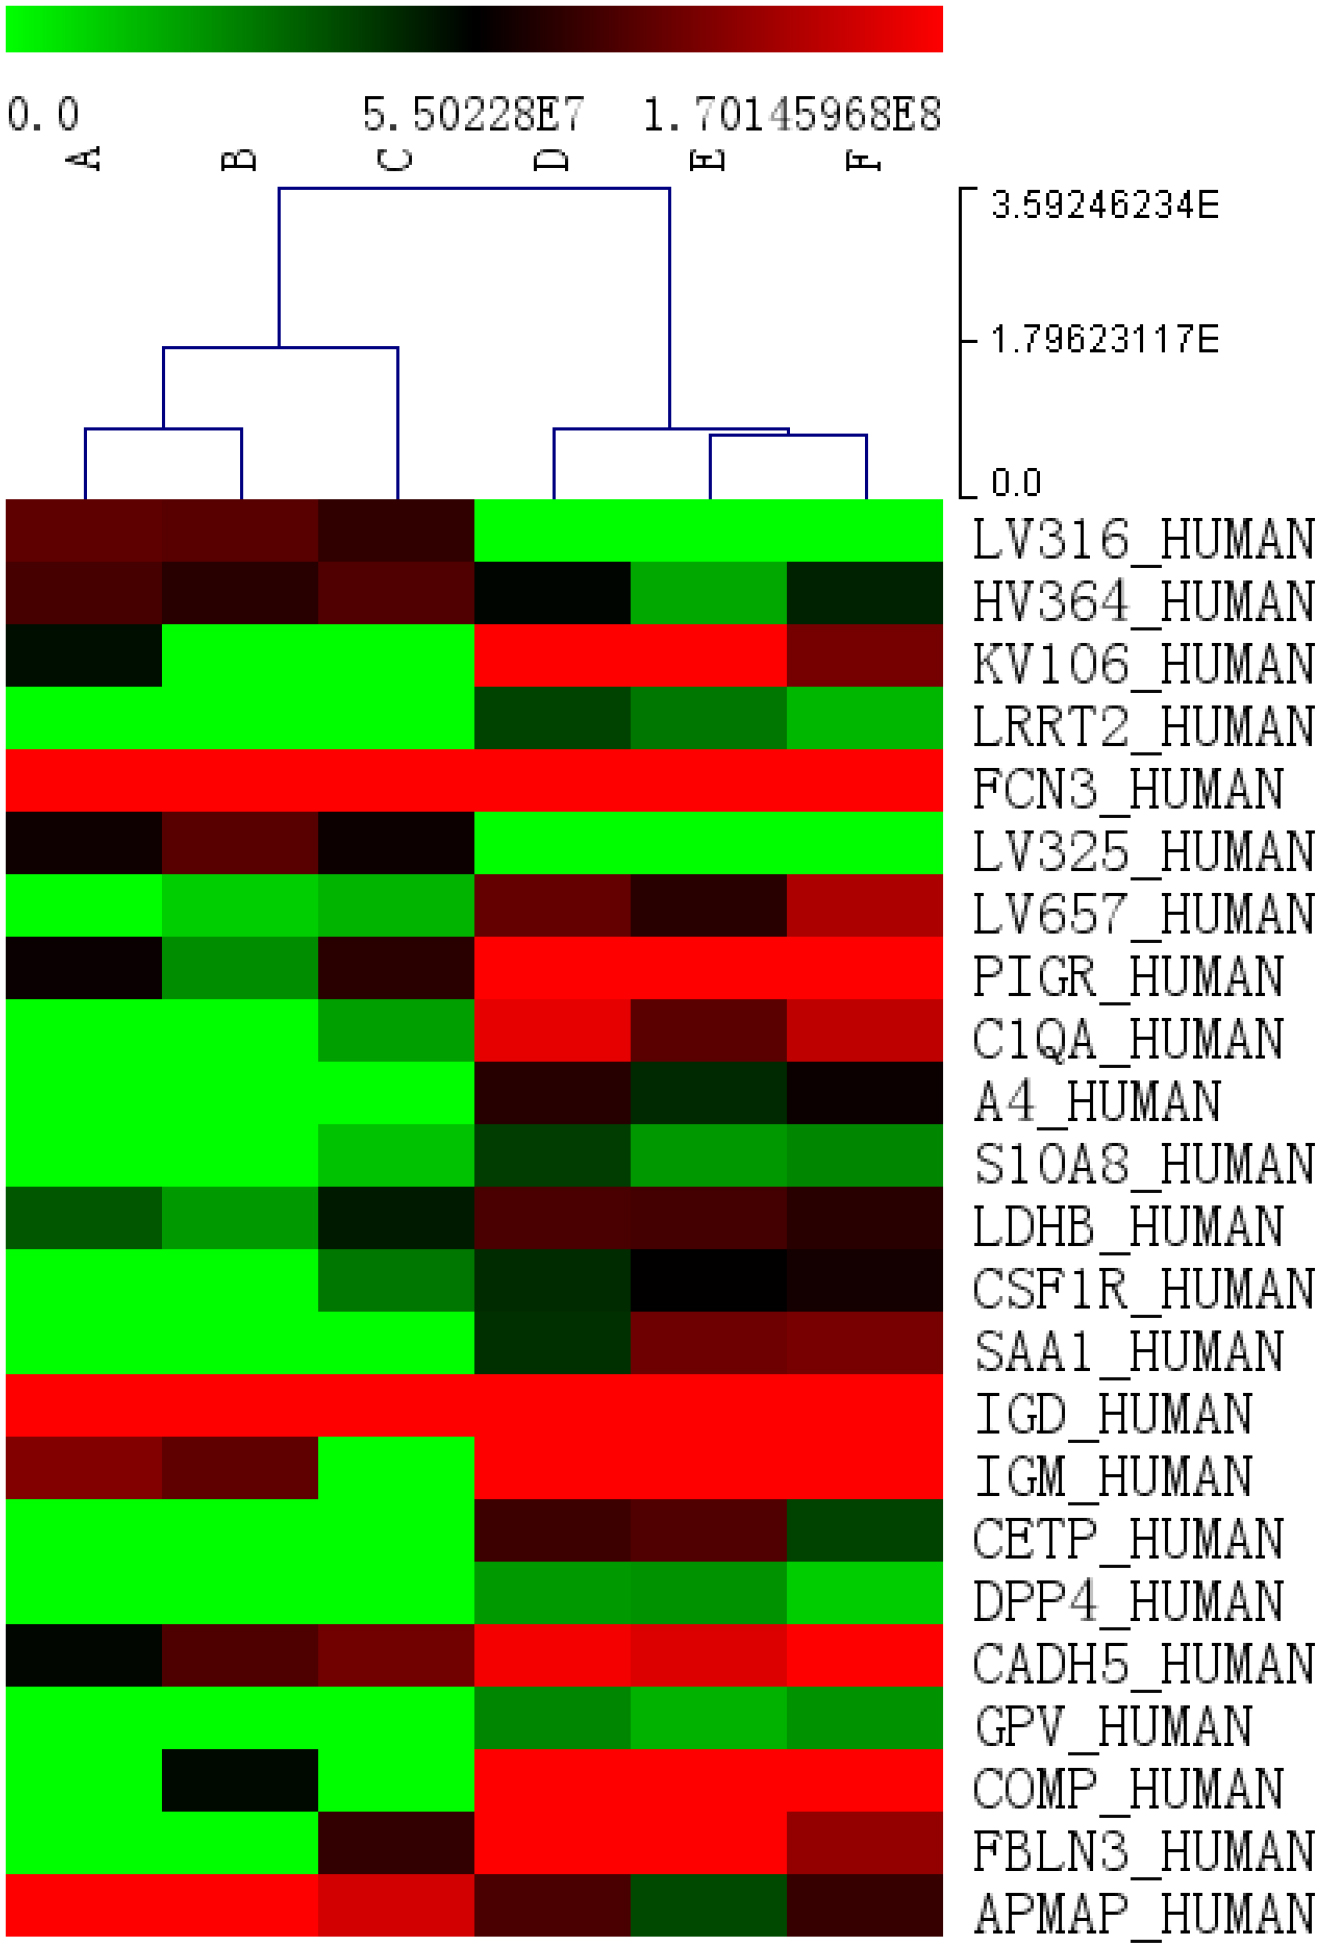 Fig. 6.
Cluster analysis of differentially expressed proteins. Each column represents a sample and each row represents a named gene. The tree structure above the colored area represents the clustering of similarity between samples. Red indicates a high level of expression, whereas green indicates a low level of expression.
| Entry | Entry name | Gene name | Ratio (METH/Control) | Log2 (Ratio) | p value | Sig (METH/Control) |
| A0A075B6K0 | LV316_HUMAN | IGLV3-16 | 0.003025 | −8.36868 | 0.000149 | −1 |
| A0A075B6Q | HV364_HUMAN | IGHV3-64 | 0.476451 | −1.0696 | 0.022344 | −1 |
| A0A0C4DH72 | KV106_HUMAN | IGKV1-6 | 9.177759 | 3.198142 | 0.010307 | 1 |
| O43300 | LRRT2_HUMAN | LRRTM2, KIAA0416, LRRN2 | 104.4256 | 6.706332 | 0.017745 | 1 |
| O75636 | Ficolin-3_HUMAN | Ficolin-3, FCNH, HAKA1 | 2.058334 | 1.041477 | 0.01615 | 1 |
| P01717 | LV325_HUMAN | IGLV3-25 | 0.003759 | –8.05539 | 0.002862 | −1 |
| P01721 | LV657_HUMAN | IGLV6-57 | 11.47183 | 3.520024 | 0.006416 | 1 |
| P01833 | PIGR_HUMAN | PIGR | 5.182036 | 2.373519 | 0.000298 | 1 |
| P02745 | C1QA_HUMAN | C1qA | 18.68545 | 4.223843 | 0.003406 | 1 |
| P05067 | A4_HUMAN | APP, A4, AD1 | 219.4922 | 7.778026 | 0.00148 | 1 |
| P05109 | S10A8_HUMAN | S100A8, CAGA, CFAG, MRP8 | 6.596966 | 2.721803 | 0.025996 | 1 |
| P07195 | LDHB_HUMAN | LDHB | 2.318441 | 1.213155 | 0.006908 | 1 |
| P07333 | CSF1R_HUMAN | CSF1R, FMS | 5.604841 | 2.486673 | 0.014825 | 1 |
| P0DJI8 | SAA1_HUMAN | SAA1 | 316.1776 | 8.304592 | 0.014613 | 1 |
| P0DOX3 | IGD_HUMAN | 3.064636 | 1.615716 | 0.000975 | 1 | |
| P0DOX6 | IGM_HUMAN | 3.263239 | 1.706304 | 0.015359 | 1 | |
| P11597 | CETP_HUMAN | CETP | 263.3256 | 8.040704 | 0.010555 | 1 |
| P27487 | DPP4_HUMAN | DPP4, ADCP2, CD26 | 67.86644 | 6.084626 | 0.010224 | 1 |
| P33151 | CADH5_HUMAN | CDH5 | 2.13414 | 1.093655 | 0.017554 | 1 |
| P40197 | GPV_HUMAN | GP5 | 80.28949 | 6.327139 | 0.001601 | 1 |
| P49747 | COMP_HUMAN | COMP | 16.36481 | 4.032525 | 0.018041 | 1 |
| Q12805 | FBLN3_HUMAN | EFEMP1, FBLN3, FBNL | 6.012555 | 2.587978 | 0.014533 | 1 |
| Q9HDC9 | APMAP_HUMAN | APMAP, C20orf3, UNQ1869/PRO4305 | 0.34513 | −1.53479 | 0.029935 | −1 |
METH indicates methamphetamine; Sig indicates differential protein expression between the control (A, B, and C) and METH (D, E, and F) group samples, with sig = 1 representing an upregulated protein and sig = –1 representing a downregulated protein. For the full names of the differentially expressed proteins, please refer to the supplementary information.
GO analysis provides a standardized system for functional characterization of genes and gene products using controlled vocabulary terms. A GO analysis consists of three structured ontologies that describe cellular components (location), molecular functions, and biological processes. We performed a GO analysis for DEPs between the METH-dependent and control groups. The results indicated the predominant subcellular localizations (Fig. 7A), molecular functions (Fig. 7B), and biological processes (Fig. 7C) associated with the DEPs. In brief, the majority of DEPs localized to eight cellular components, performed seven key molecular functions, and participated in 10 major biological processes.
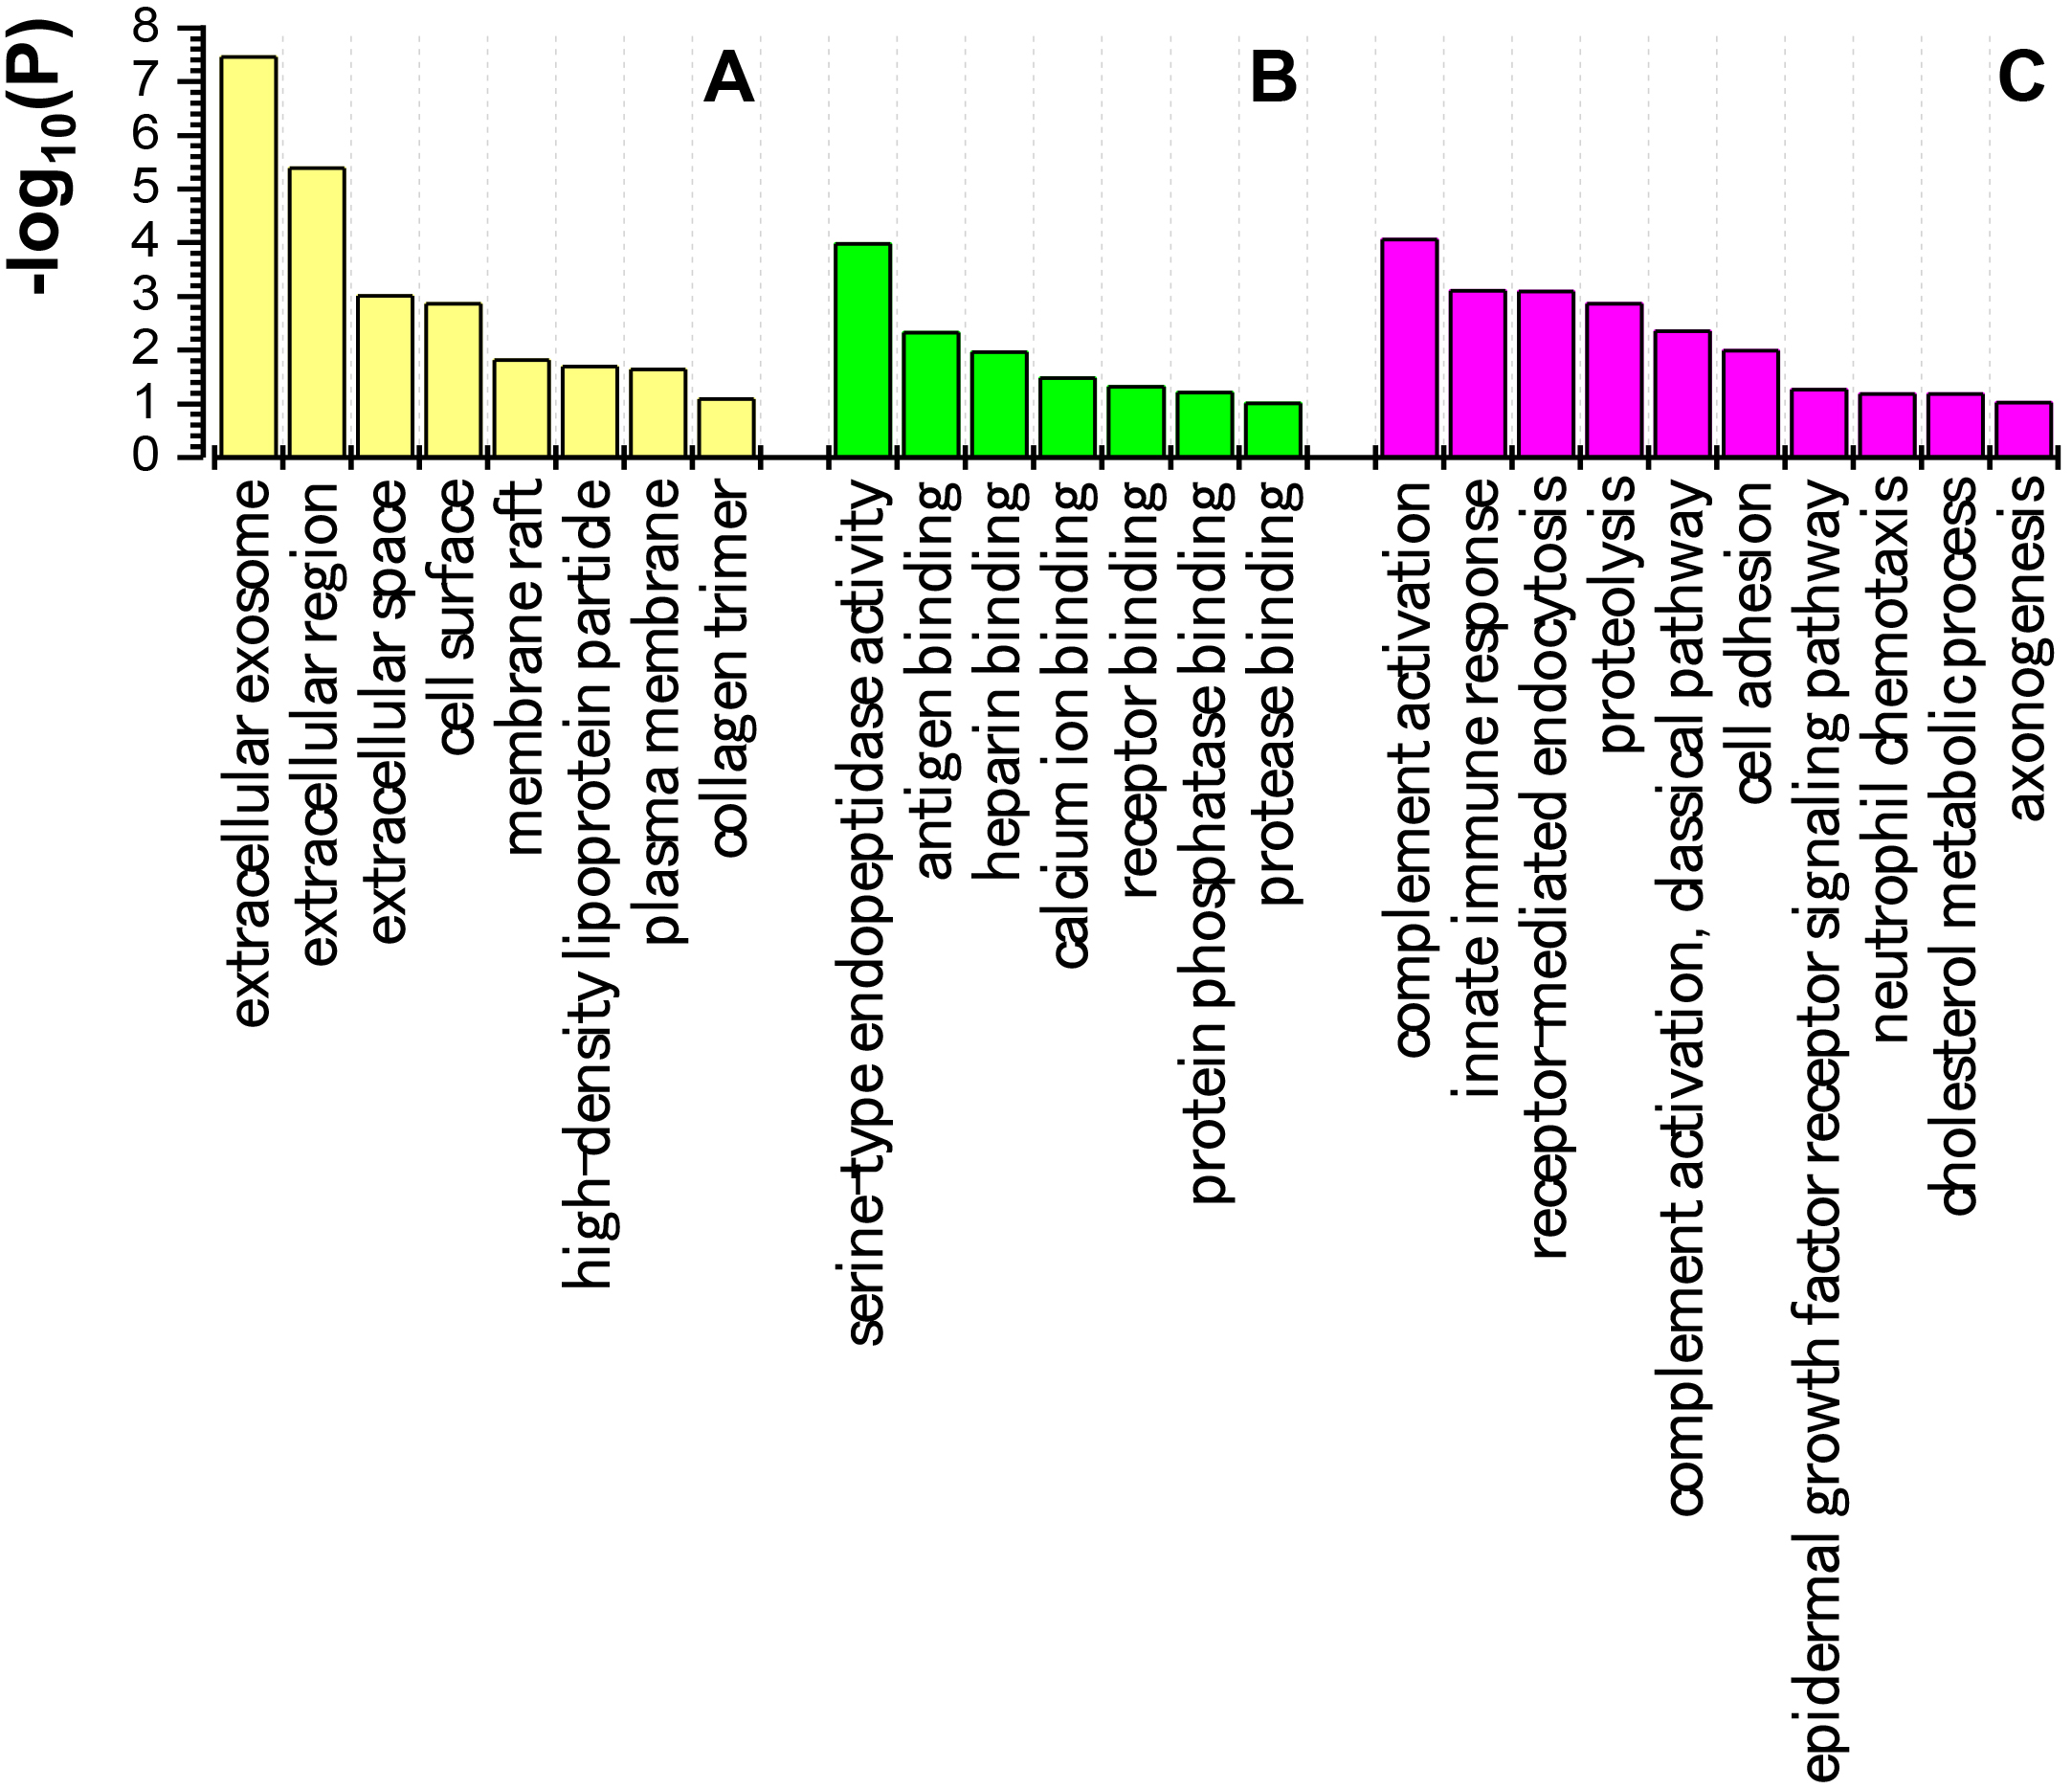 Fig. 7.
Gene ontology analysis of proteins differentially expressed between methamphetamine-dependent and healthy control individuals. (A) Locations of differentially expressed proteins. (B) Molecular functions of the differentially expressed proteins. (C) Biological processes that the differentially expressed proteins participate in. The ordinate (P) represents the degree of enrichment.
A KEGG pathway analysis was conducted to analyze enriched metabolic and signaling pathways among the DEPs. The results showed that the top two metabolic pathways were the extracellular matrix (ECM)–receptor interaction pathway (Fig. 8, Ref. [27]) and the hematopoietic cell lineage signaling pathway (Fig. 9, Ref. [27]). The ECM–receptor interaction pathway was enriched in DEPs that included platelet glycoprotein V and cartilage oligomeric matrix protein thrombospondin. The hematopoietic cell lineage pathway contained colony stimulating factor 1 receptor (CSF1R) CD115 and the platelet glycoprotein V (CD42) DEPs.
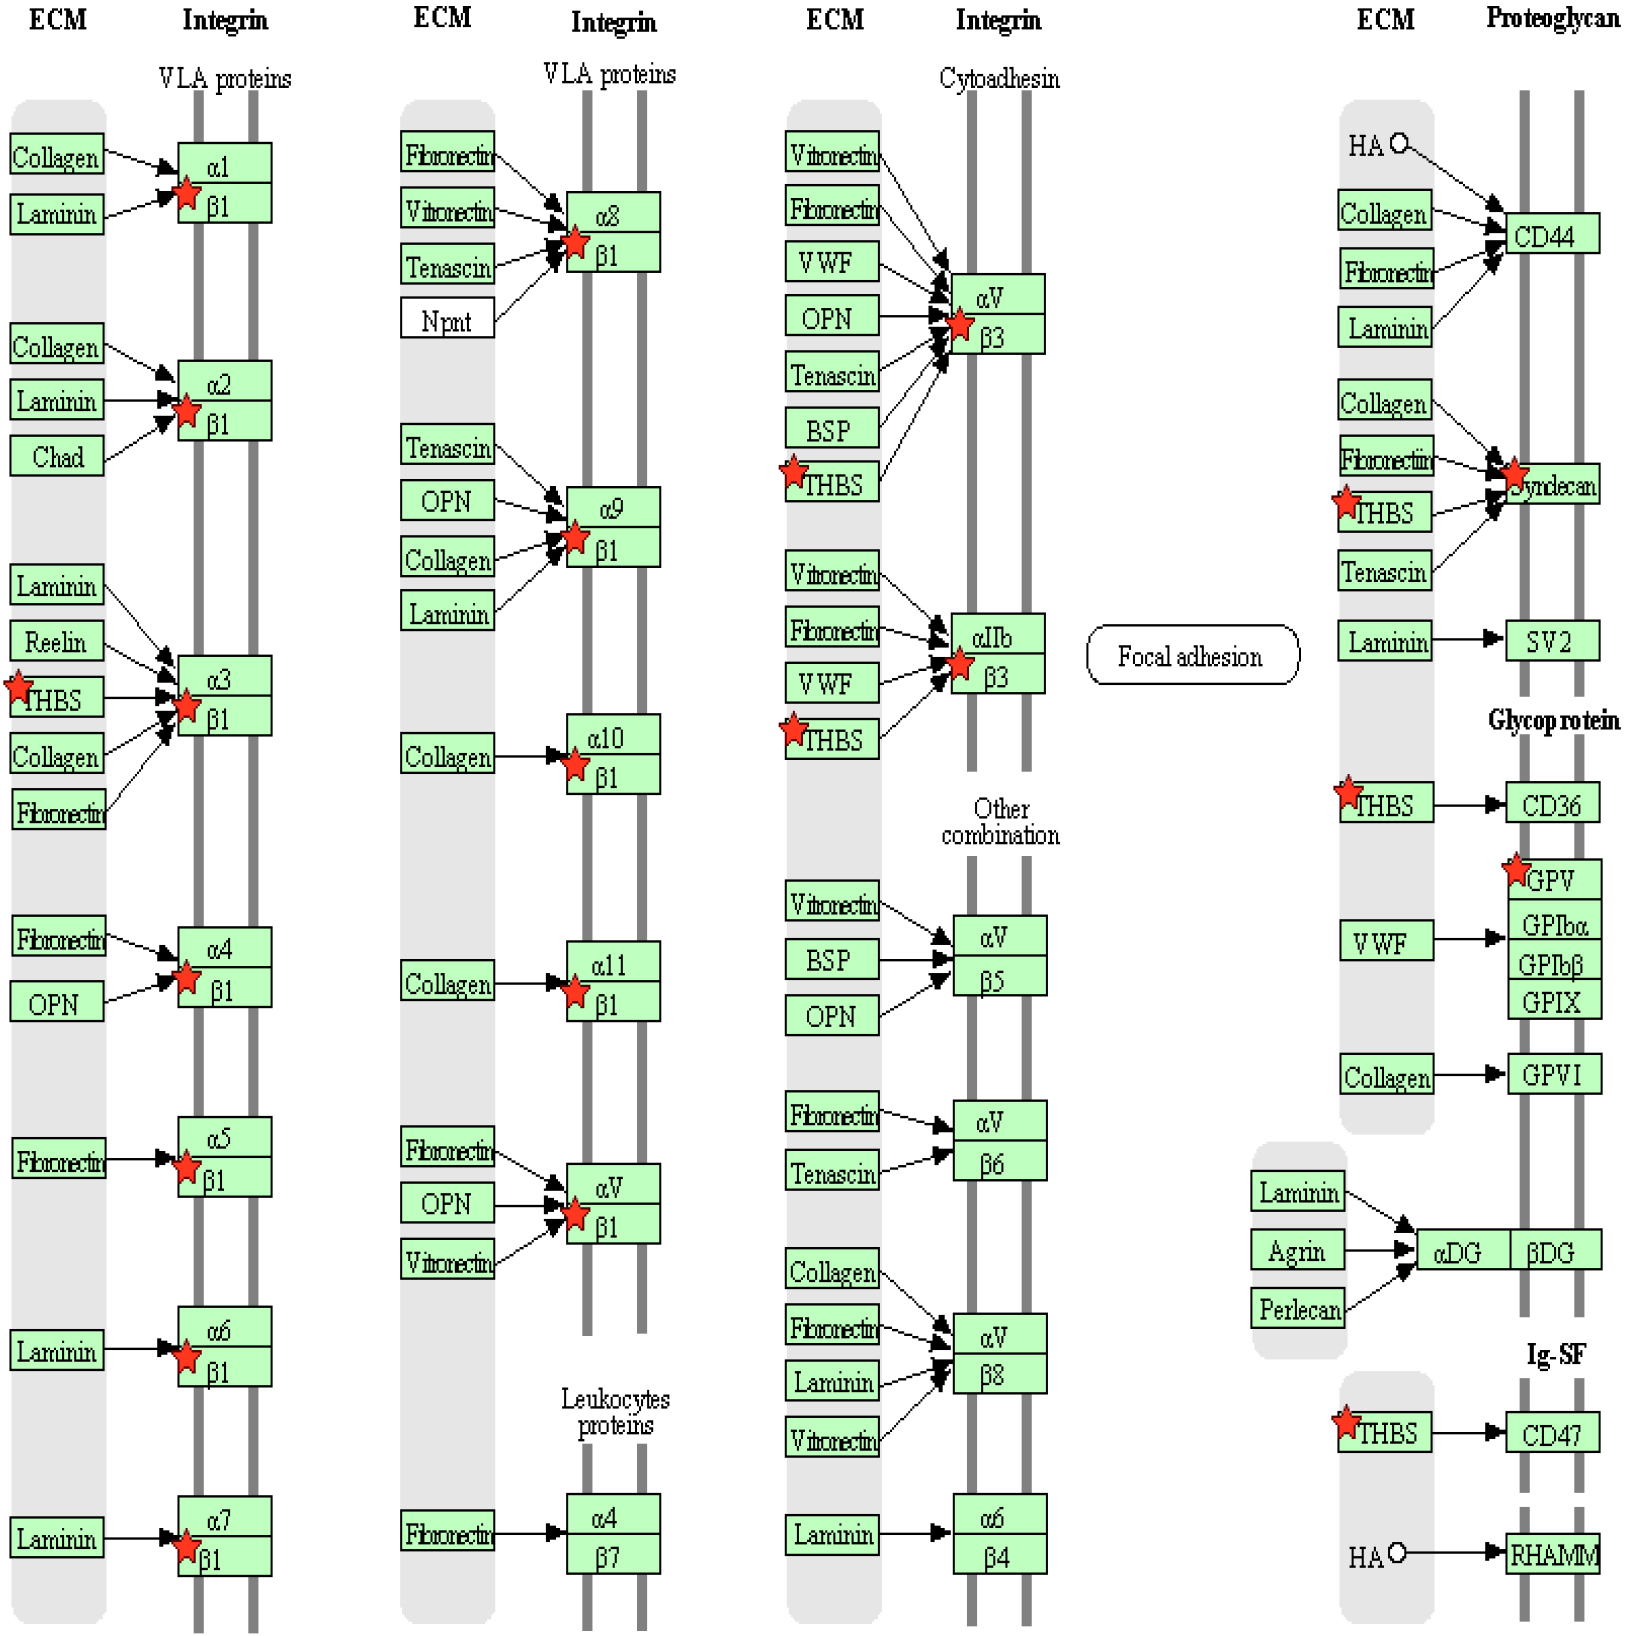 Fig. 8.
Differentially expressed proteins are involved in the extracellular matrix (ECM)-receptor interaction pathway. Red stars represent the identified differentially expressed proteins. GPV, platelet glycoprotein V; HA, hemagglutinin; THBS, thrombospondin; VLA, very late antigen. The information about all abbreviations can be found at: https://www.genome.jp/pathway/hsa04512 [27].
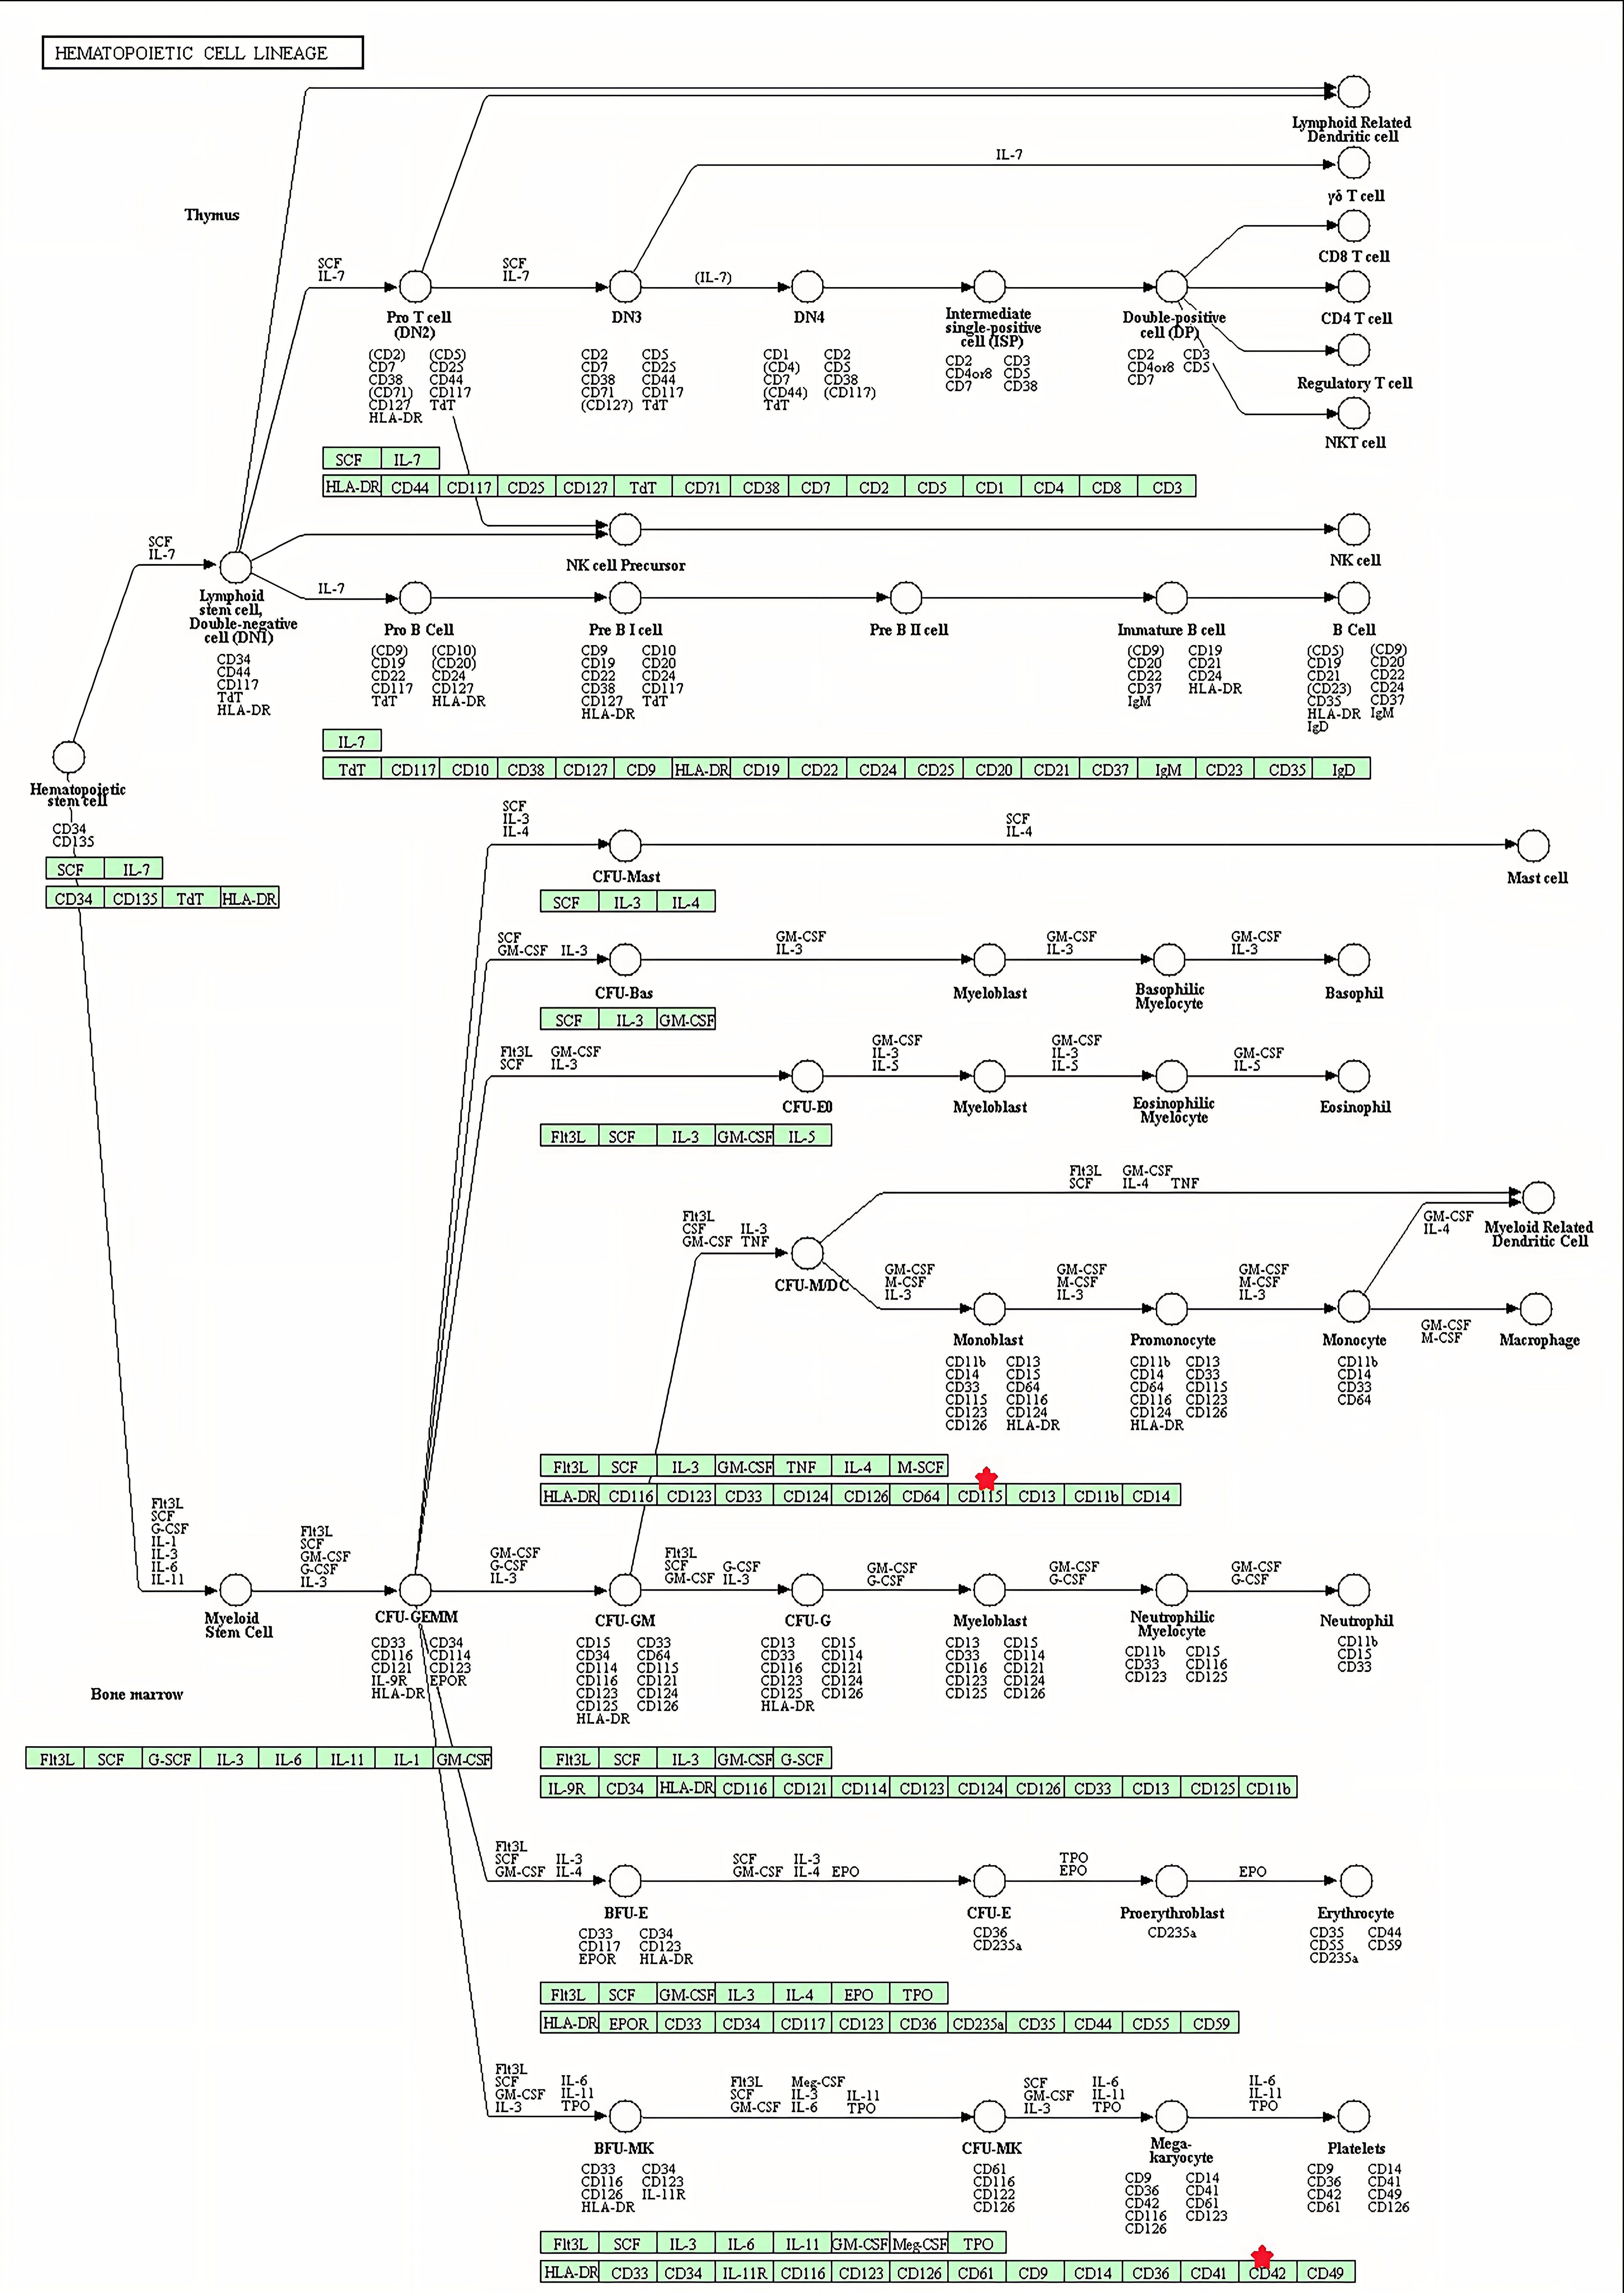 Fig. 9.
Differentially expressed proteins are involved in the hematopoietic cell lineage pathway. Red stars represent the proteins identified as differentially expressed between the methamphetamine-dependent and control individuals. The information about all abbreviations can be found at: https://www.genome.jp/pathway/hsa04640 [27].
IPA provides a comprehensive analysis of proteomic data to elucidate protein expression mechanisms and related biological processes, such as post-translational modifications, signaling pathways, protein interactions, and differential protein signatures.
Significant pathway enrichment analysis using IPA identified key metabolic and signaling pathways enriched with the DEPs between the METH-dependent and control groups (Fig. 10). Major DEPs involved in those pathways were serum amyloid A-1 (SAA1), S100A8, cholesterol ester transfer protein (CETP), dipeptidyl peptidase 4 (DPP4), APP, L-lactate dehydrogenase B chain (LDHB), colony-stimulating factor 1 receptor (CSF1R), and C1q subcomponent subunit A (C1qA).
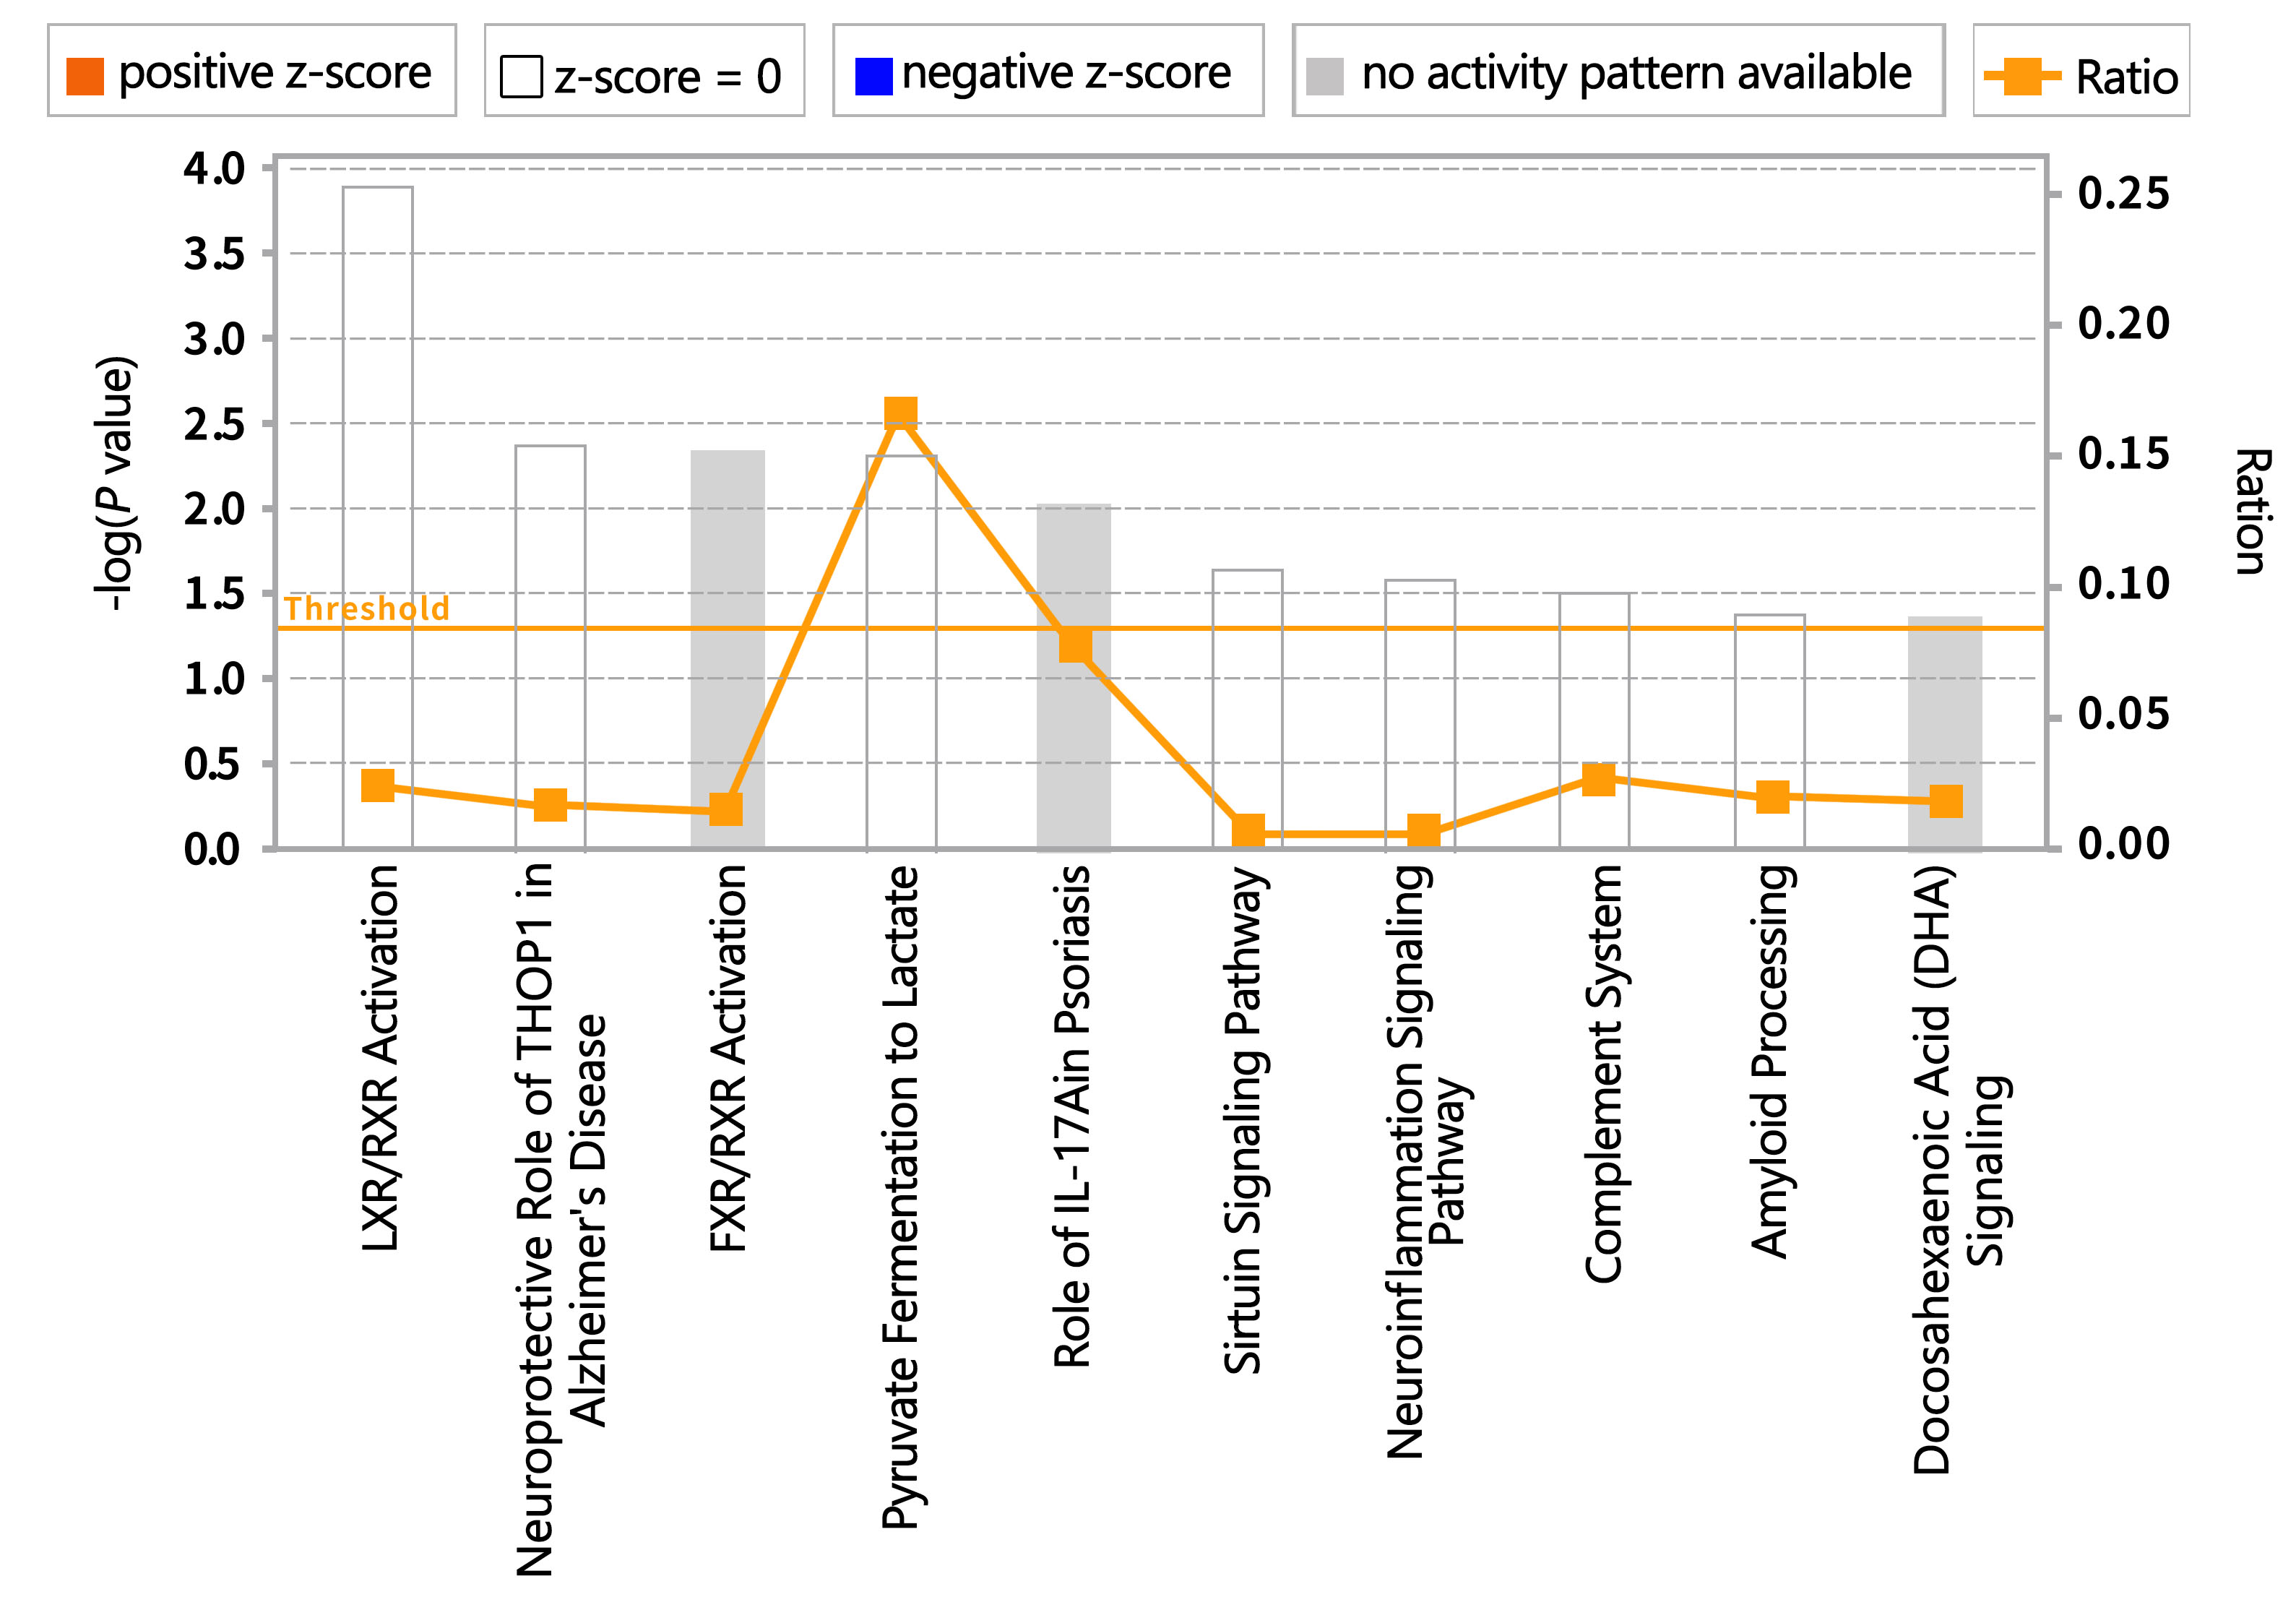 Fig. 10.
Pathways enriched with proteins differentially expressed between methamphetamine-dependent and healthy individuals. FXR, farnesoid X receptor; IL, interleukin; LXR, liver X receptor; RXR, retinoid X receptor; THOP1, Thimet Oligopeptidase 1.
We used IPA software and the Ingenuity Knowledge Base to perform biological function and disease analyses (Fig. 11A) as well as toxicological analysis (Fig. 11B) for the DEPs. The results demonstrated that the DEPs were predominantly associated with cellular movement, immunity, inflammatory response, the blood system, cell assembly and tissue, cell morphology, neurological diseases, intercellular signals and interactions, connective tissue diseases, and cardiovascular system development and function.
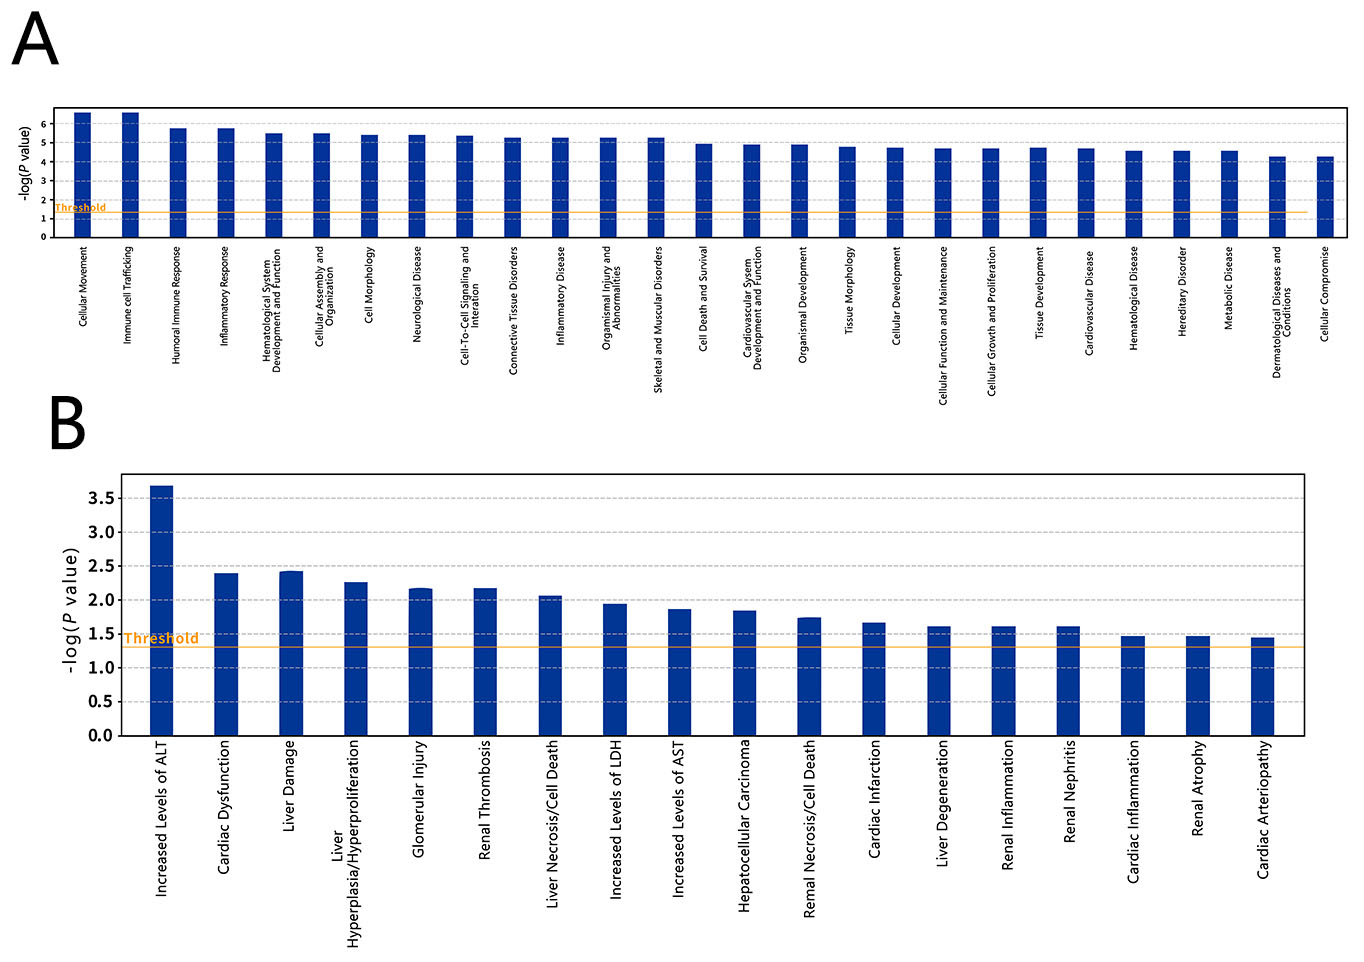 Fig. 11.
Differential expressed protein enrichment results. (A) Biological functions and diseases enriched in the differentially expressed proteins between methamphetamine-dependent and healthy control individuals. (B) Toxicological types enriched in the differentially expressed proteins.
The IPA showed that the DEPs were enriched in five protein interaction networks (Fig. 12). The network shown in Fig. 12A that is related to cellular assembly/organization, metabolic disease, and cellular movement contained DEPs, APP, SAA1, DPP4, leucine-rich repeat transmembrane neuronal protein 2 (LRRTM2), cartilage oligomeric matrix protein (COMP), calcium-binding protein S100A8, polymeric immunoglobulin receptor (PIGR), macrophage CSF1R, LDHB, and cadherin-5 (CDH5). The network shown in Fig. 12B that is associated with lipid metabolism, molecular transport, and small molecule biochemistry included DEPs, CETP and complement C1qA. The network shown in Fig. 12C that is linked to immune response, inflammatory response, and cardiovascular disease involved the DEP ficolin-3. DEP glycoprotein V (GP5) is part of the network shown in Fig. 12D, which is related to connective tissue disorders, hematological disease, and organismal injury and abnormalities. Epidermal growth factor-containing fibulin-like extracellular matrix protein 1 (EFEMP1) was the DEP involved in the network shown in Fig. 12E, which was associated with cellular growth, proliferation, cancer, and organismal injury and abnormalities.
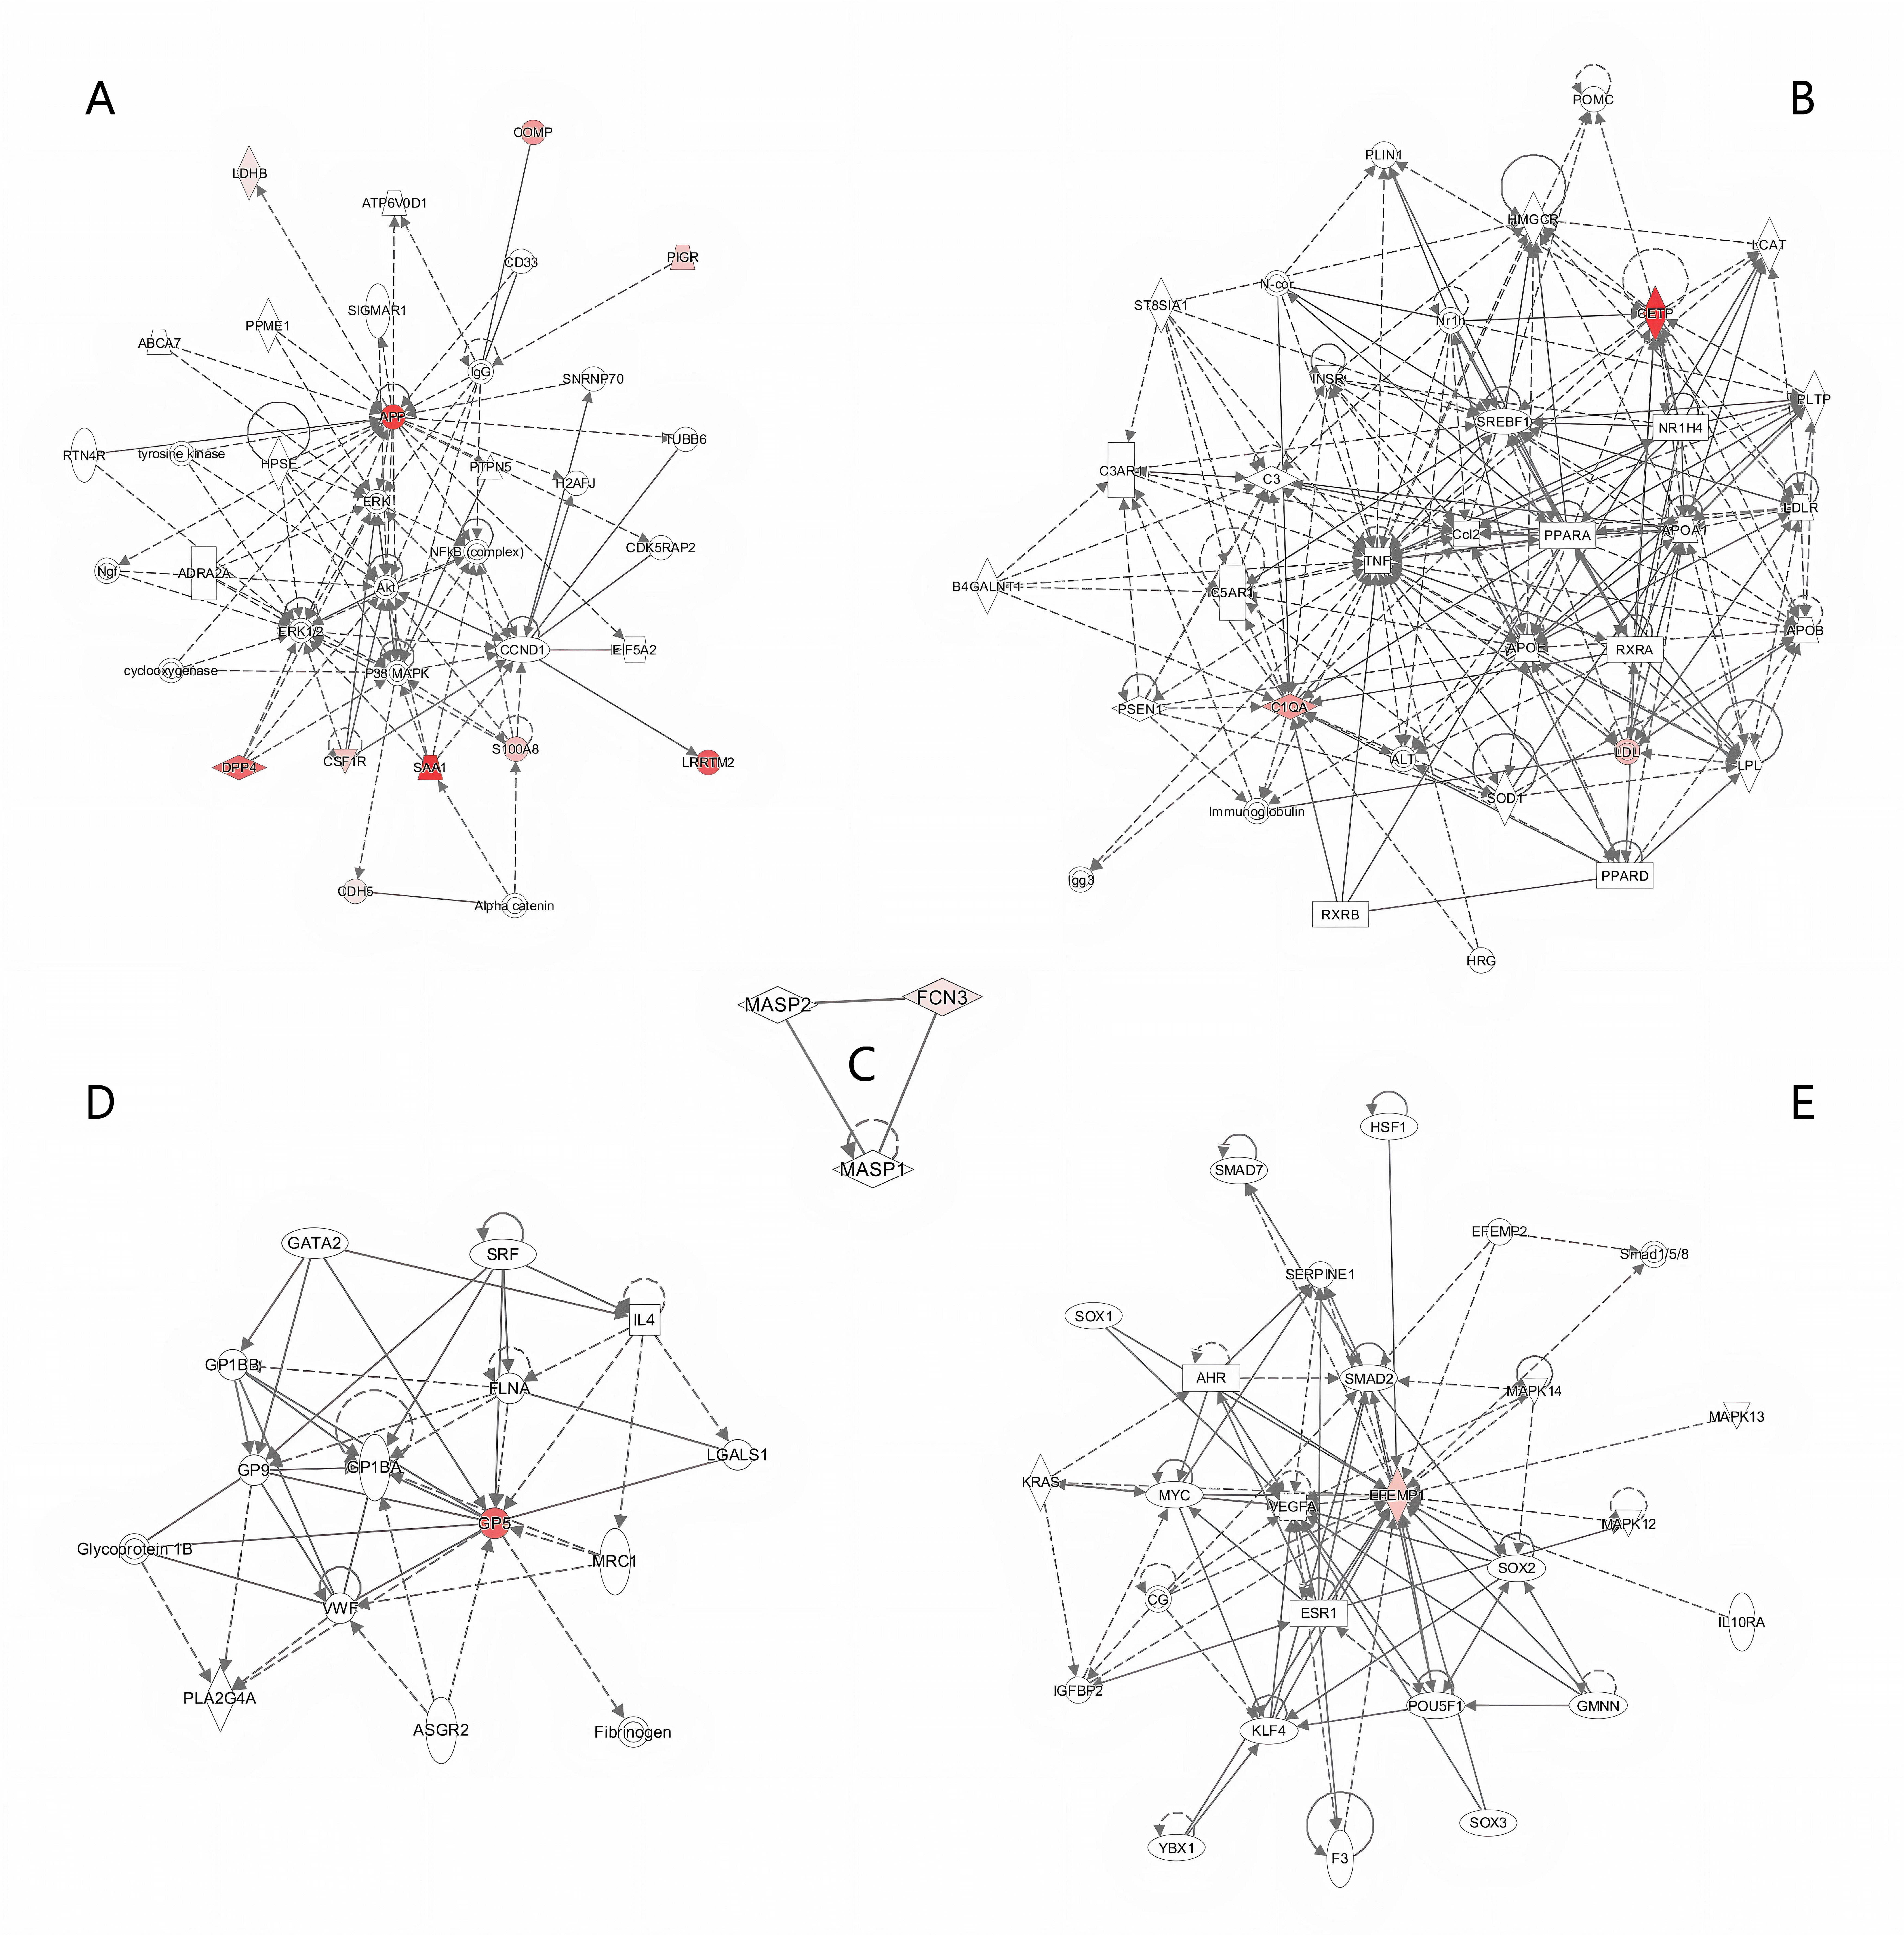 Fig. 12.
Five protein interaction networks identified by Ingenuity Pathway Analysis. (A) Protein interaction network related to cellular assembly/organization, metabolic disease, and cellular movement. (B) Protein interaction network related to lipid metabolism, molecular transport, and small molecule biochemistry. (C) Protein interaction network related to immune response, inflammatory response, and cardiovascular disease. (D) Protein interaction network related to connective tissue disorders, hematological disease, and organismal injury and abnormalities. (E) Protein interaction network related to cellular growth, proliferation, cancer, and organismal injury and abnormalities. Colors identify differentially expressed proteins, with color saturation representing the level of protein expression: dark red indicates higher expression, light pink represents lower expression.
METH is a potent CNS stimulant that elicits euphoria and pleasure through activation of the brain’s reward pathway [3]. However, chronic use leads to dependence, addiction, and adverse health effects, including of the nervous, cardiovascular, cerebrovascular, and immune systems [4, 5].
The present study utilized a proteomics approach to identify differentially expressed serum proteins between individuals with METH dependence and healthy control individuals. In total, 23 proteins were significantly altered, with four downregulated and 19 upregulated proteins in the METH-dependent group compared with the control group. In-depth bioinformatic analyses indicated that these DEPs participated in pathways and processes related to cognitive disorder, neuron impairment, immune response, energy metabolism, and calcium binding or regulation. This proteomics profile provides insights into the biological impact at the protein level of METH addiction and misuse.
The misuse of METH has been associated with cognitive impairment, including AD
[28], a neurodegenerative disorder characterized by amyloid beta (A
APP is a single transmembrane neuronal protein widely
distributed in tissues and concentrated at neuronal synapses [30]. APP can be
cleaved into different fragments by
CETP promotes cholesterol transfer from high-density
lipoprotein to low-density lipoprotein or very low-density lipoprotein, which may
be associated with atherosclerosis. Intracellular cholesterol accumulation also
stimulates A
APMAP is a membrane protein ubiquitously expressed in various tissues and
organs, where it promotes pre-adipocyte differentiation into mature adipocytes to
maintain normal physiological metabolism of fat cells. Studies have shown that
inhibition of APMAP expression destabilizes APP and increases A
Collectively, our findings indicate that METH misuse modulates the expression of
proteins such as CETP and APMAP, implicating cardiovascular function and
neurodegenerative pathways. The upregulation of CETP is suggestive of an
augmented risk for cardiovascular pathology and A
Prolonged stimulation of the nervous system by METH impairs dopaminergic nerve
endings and induces neuronal necrosis [37], potentially contributing to the
development of PD [10]. Microglia are important neuroimmune
cells in the CNS. Following nervous system damage, microglia become activated,
releasing neurotrophic factors to repair tissue, engulfing damaged neurons, and
promoting repair, thus acting in a neuroprotective capacity [38].
However, in neurodegenerative diseases,
overactivated microglia trigger inflammation and release neuroinflammatory
factors, such as nitric oxide, interleukins 6 and 1
The present study also found significantly elevated expression of DPP4 and CSF1R
in the METH group compared with the healthy control group. CSF1R regulates
microglial proliferation and differentiation [40]. DPP4, also known as CD26, is a
cell surface serine protease that activates the extracellular
signal-regulated kinase 1/2 (ERK1/2)–NF-
We also observed increased serum LRRTM2 and EFEMP1 protein expression in the METH group. LRRTM2, a neural cell adhesion molecule containing leucine-rich repeats, is involved in neurodevelopmental processes, including axon growth, synapse formation, and axon bundling [42, 43]. EFEMP1, an extracellular matrix glycoprotein containing epidermal growth factor-like domains, regulates glial cell development, migration, differentiation, and synaptic proliferation, suggesting roles in nervous system development, learning, and memory [44, 45]. While we did not examine the functional effects of elevated LRRTM2 and EFEMP1 in chronic METH users, it is still reasonable to suspect that these two proteins may contribute to METH-induced neurological changes. These results provide new potential molecular targets for exploring cognitive deficiency in METH users.
Prolonged METH use compromises both the innate and adaptive arms of the immune system, increasing susceptibility to viral and bacterial infections, indicating adverse effects on immune function [46]. Multiple mechanisms likely contribute to METH-induced immunosuppression. First, METH elevates synaptic dopamine, which is metabolized by monoamine oxidase into reactive oxygen species (ROS). This oxidative stress damages DNA, lipids, and proteins, directly impairing immune cell viability [47]. Second, METH inhibits the function of innate immune cells, such as natural killer cells, dendritic cells, monocytes, macrophages, and granulocytes, thereby suppressing frontline defenses against pathogens [48, 49]. We found several differentially expressed immune-related proteins in METH users that may represent compensatory responses to counteract immunosuppression. Immunoglobulin lambda variable 3 (IGLV3)-16, IGLV3-25, and immunoglobulin heavy variable 3-64 showed decreased expression, suggesting impaired antibody production. Meanwhile, immunoglobulin kappa variable 1-6, IGLV6-57, PIGR, C1qA, and ficolin-3 were upregulated, suggesting attempts to boost humoral immunity.
Immunoglobulins are antigen-binding antibody proteins composed of two light chains and two heavy chains. As immune complexes, immunoglobulins can activate the complement cascade. The complement system is an enzymatic cascade that amplifies immunity through classic, alternative, and lectin pathways [50]. Complement activation on pathogen surfaces mediates cell lysis, while split products interact with adaptive immunity [51]. PIGR is a crucial transmembrane glycoprotein receptor that transports immunoglobulins across mucosal epithelial cells into secretions [52]. Each immunoglobulin molecule requires one PIGR molecule for secretion; therefore, PIGR deficiency reduces antibody levels on the mucosal surface. C1q, part of the complement C1 complex, binds immunoglobulin (Immunoglobulin G [IgG] or Immunoglobulin M [IgM]) complexes to trigger the classic pathway. Elevated C1qA in the brain of individuals with AD suggests a pathogenic role [53, 54]. Ficolin-3 is a pattern recognition receptor that activates the lectin complement pathway through its collagen-like and fibrinogen-like domains, contributing to innate pathogen sensing [53, 55]. The differential expression of these immune-related proteins indicates that METH-induced dysfunction provokes compensatory responses to bolster both innate and adaptive immunity against infections. However, more research is needed to fully elucidate the mechanisms of METH-induced immunosuppression and compensatory immune protein expression. Additionally, the discovery of differentially expressed immune-related proteins in METH users may inform the creation of targeted immunomodulatory treatments. Such therapies would aim to recalibrate the immune equilibrium, mitigating the increased vulnerability to infectious diseases observed among individuals with METH dependence.
METH directly enters neuronal mitochondria through its lipophilic properties, impairing the respiratory chain and disrupting cellular energy metabolism. Brain function maintenance requires substantial energy input, and therefore METH-induced energy deficits can promote neuronal death and neurodegenerative diseases [56, 57].
Lactate dehydrogenase (LDH) interconverts pyruvate and lactate, participating in
cellular anaerobic respiration [58]. In AD models, early stage neuronal lactate
dehydrogenase (LDHA) upregulation reduces mitochondrial activity and ROS
production, conferring A
Calcium is a key intracellular messenger regulating neuronal functions such as long-term potentiation, neuronal perception, synaptic plasticity, and cell proliferation [60]. Calcium dysregulation can promote neurodegeneration [61, 62]. The calcium-binding protein S100A8 mediates inflammatory/oxidative stress responses. Its expression in immune cells is stimulated by nerve injury, eliciting neuroinflammation [63]. Cadherin-5 (CDH5) is a calcium-dependent cell adhesion glycoprotein involved in cell recognition, migration, and tissue morphogenesis. Cadherin expression is developmentally regulated, including N-cadherin enrichment in developing neurons [64]. We found that S100A8 and CDH5 were upregulated in the METH-dependent group. This may represent adaptive responses, with S100A8 counteracting drug-induced calcium perturbations and neuroinflammation, while CDH5 promotes structural plasticity repairing neuronal damage.
It is worth mentioning that, unlike in rodent models, serum represents a minimally invasive human sample. The association between changes in serum proteins and cognitive impairments suggests that the systemic effects of METH extend beyond the blood-brain barrier, manifesting as peripheral biomarkers that may reflect concurrent changes in the CNS [65]. This implies that METH’s systemic impact transcends the blood-brain barrier. Serum proteins can be utilized for the early detection and monitoring of the progression of neurodegenerative diseases associated with METH abuse. For instance, the observed increase in serum levels of APP in this study potentially signals an elevated risk of amyloid plaque formation. Similarly, changes in serum levels of proteins such as CETP and APMAP may indicate underlying neuropathological processes. The differential expression of these genes in serum likely indicates a systemic response to METH’s neurotoxicity.
While the sample size of this study may appear small, it is noteworthy that previous investigations employing the same label-free proteomics methodology have similarly focused on selected subpopulations, such as individuals with schizophrenia or cancer. In such prior studies, the sample sizes for the specialized groups were often lower than 20 [66, 67, 68], yet they yielded statistically significant findings regarding alterations in serum protein expression. Consequently, the inclusion of 12 participants with METH dependence in our present study can be deemed sufficient to substantiate our research findings. In addition, the functions of the proteins exhibiting differential expression in individuals with METH dependence have been discussed herein. Nevertheless, owing to the limited number of participants in this study, it is imperative to validate the findings on a broader scale by recruiting a larger cohort of individuals with METH addiction.
In summary, our serum proteomic analysis revealed numerous DEPs between individuals with METH dependence and health individuals. The identified proteins were involved in cognitive dysfunction, nervous system inflammation and disease, immune response, energy metabolism, and calcium binding and regulation. These expression changes likely reflect molecular adaptions underlying METH-induced damage to the nervous, immune, and metabolic systems. Further exploration of the functional roles of these DEPs will provide insights into the molecular mechanisms of METH dependence. Elucidating the involvement of these proteins in the brain’s response to chronic METH exposure will also reveal novel targets for the prevention and treatment of METH addiction. Thus, overall, this proteomic profile highlights candidate mediators of the systemic effects of long-term METH use, pointing toward new avenues for understanding the biological basis of dependence and for developing targeted therapeutics.
The data sets generated and analyzed during the current study are available in the ProteomeXchange Consortium (http://proteomecentral.proteomexchange.org) via the iProX partner repository with the dataset identifier PXD040112.
YW, CZ and CL were responsible for the study concept and design. CZ is responsible for Funding acquisition. YZ contributed to the collection of participate serum and data curation. YL performed the proteomics analysis. LL contributed to conducting the literature searches. XW contributed to interpreting the data. Furthermore, both LL and XW were involved in drafting the manuscript, with XW providing the final approval for the version to be published. HW was responsible for designing and editing images and tables for this article. YW, CZ and CL provided critical revision of the manuscript for important intellectual content. All authors contributed to editorial changes in the manuscript. All authors read and approved the final manuscript. All authors have participated sufficiently in the work and agreed to be accountable for all aspects of the work.
This study was approved by the Ethics Committee of Shanghai University of Sport (No. 102772019RT044) and conducted in accordance with the Helsinki Declaration of 1975. All participant information remained confidential, and all patients provided written informed consent.
We thank the Shiliping Compulsory Isolation Detoxification Center in Zhejiang Province for collecting basic information and serum samples.
This work was supported by the National Social Science Fund of China (No. 17ZDA330).
The authors declare no conflict of interest.
Publisher’s Note: IMR Press stays neutral with regard to jurisdictional claims in published maps and institutional affiliations.