
- Academic Editor
Background: The accuracy of decoding fine motor imagery (MI) tasks remains relatively low due to the dense distribution of active areas in the cerebral cortex. Methods: To enhance the decoding of unilateral fine MI activity in the brain, a weight-optimized EEGNet model is introduced that recognizes six types of MI for the right upper limb, namely elbow flexion/extension, wrist pronation/supination and hand opening/grasping. The model is trained with augmented electroencephalography (EEG) data to learn deep features for MI classification. To address the sensitivity issue of the initial model weights to classification performance, a genetic algorithm (GA) is employed to determine the convolution kernel parameters for each layer of the EEGNet network, followed by optimization of the network weights through backpropagation. Results: The algorithm’s performance on the three joint classification is validated through experiment, achieving an average accuracy of 87.97%. The binary classification recognition rates for elbow joint, wrist joint, and hand joint are respectively 93.92%, 90.2%, and 94.64%. Thus, the product of the two-step accuracy value is obtained as the overall capability to distinguish the six types of MI, reaching an average accuracy of 81.74%. Compared to commonly used neural networks and traditional algorithms, the proposed method outperforms and significantly reduces the average error of different subjects. Conclusions: Overall, this algorithm effectively addresses the sensitivity of network parameters to initial weights, enhances algorithm robustness and improves the overall performance of MI task classification. Moreover, the method is applicable to other EEG classification tasks; for example, emotion and object recognition.
Brain-computer interface (BCI) technology provides a new paradigm of human-computer interaction with the evolving integration of brain science and computer technology. BCI establishes a communication path between human users and external entities through brain activity, primarily scalp electroencephalography (EEG) [1]. Motor imagery (MI) EEG signals are elicited by subjective motor imagery tasks. Different MI tasks produce specific EEG rhythm changes at different positions across the cerebral cortex. Compared with steady-state evoked potential (SSVEP) or P300, MI-based BCI systems provide more natural and intuitive communication between the user and external devices. MI signals are highly useful in assisting motor function and significant progress has been achieved in pattern recognition research for MI tasks.
Currently, most MI-based BCI systems are only capable of distinguishing a limited number of MI tasks and decoding a few MI patterns from specific brain areas to function as control commands. The most used MI-based BCI systems rely on hand, foot and tongue MI tasks, which anatomically are physically distant from each other in the brain [2]. Interestingly, there is limited research on unilateral joint MI tasks. Compared to left and right-hand movements, recognizing MI movements in the different joints and directions of unilateral movement is more refined and practical. It is easily evident that performing a series of actions with one joint, such as the hand, can significantly assist in completing a task when mapping MI movements. However, different motor imagery tasks involving the same limb have similar spatial representations in the motor cortex area [3, 4] and unilateral movement is often accompanied by additional and redundant noise. Further, individual differences and variations in experimental paradigms can lead to poor signal discrimination. Therefore, it is essential to develop an effective methodology for classifying MI EEG signals to improve the recognition accuracy of the BCI system.
Event-related desynchronization (ERD)/event related synchronization (ERS) phenomena refer to the occurrence of ERD potential in the contralateral brain region and ERS potential in the ipsilateral brain region during unilateral limb movement or imaginary movement. During the process of motor imagination, changes in ERD/ERS phenomena are caused, through which different states of the brain can be distinguished. The recognition of different MI tasks by the same limb has been pursued in several studies. For three temporal features, an autoregressive model, waveform length and root mean square with optimal support vector machine, were proposed to decode the rest state and two MI tasks (hand and elbow), reaching an average accuracy of 74.2% [5]. Additionally, time-domain features from specific low-frequency band EEG are utilized to decode motor execution and imagery for six types of single upper limb movements. The classification accuracy for motor execution was approximately 55% [6]. Cho et al. [7], instructed subjects to perform five tasks of left-hand extension, right-hand fist, left rotation, right rotation and rest state. The MI tasks including both the left and right hand, collected EEG signals and task decoding was perform with a decoding accuracy of 51.01%. Furthermore, it is widely recognized that the classification accuracy decreases significantly as the complexity and diversity of MI task categories increase.
Given the low spatial resolution and weak signal-to-noise ratio of MI-EEG signals, an effective signal processing method is required [8]. Traditional feature extraction methods are insufficient for optimizing the efficiency of decoding fine MI movements of the upper limbs. In contrast, deep learning methods, which have shown unique advantages in fields such as computer vision and character recognition [9], hold great potential. In many applications, end-to-end EEG signal decoding using automatic feature extraction improves the robustness of signal classification. Numerous studies have applied deep learning to EEG signal analysis [10], including a multi-level weighted feature fusion architecture based on a convolutional neural network (CNN) proposed for EEG MI classification [11] and the success of Deep Belief Networks in classifying smaller data sets [12]. In 2018, Lawhern et al. [13] proposed a compact convolutional network called EEGNet, which used deep convolution and separable convolution instead of standard convolution. Results showed that EEGNet achieved relatively high classification performance with limited training data and demonstrated good paradigm generalization. Heilmeyer et al. [14] evaluated different deep learning frameworks, including Braindecode Deep4 ConvNet, Braindecode Shallow ConvNet and two other versions of EEGNet and found that Braindecode Deep4 and EEGNet performed the best. Compared to such previously proposed networks, EEGNet has a more compact structure, resulting in faster training while maintaining the same accuracy.
The initial parameters of the network are randomly generated and different parameters have a strong impact on model capability. Inappropriate or suboptimal parameters cause a network find a local minimum, resulting in low classification accuracy and slow network convergence speed [15]. Additionally, large individual differences may lead to an unstable global classification ability. To address this issue, the genetic algorithm (GA), an optimization algorithm, simulates biological evolution in nature, demonstrating great adaptability to complex problems such as non-linearity [16]. GAs have been used in many fields due to their strong generalization ability, robustness and ease of operation [17, 18]. Recent studies have employed GAs to optimize deep learning models, where it was used as a search engine to extract features in [19, 20] and appropriate parameters were obtained for CNN through GA in [21, 22]. Previous studies have shown that genetic algorithm support vector machines (GA-SVM) identifies optimal SVM parameters. Moreover, the GA-backpropagation (BP) model, that optimizes a BP neural network by GA, can effectively prevent entrapment in a local minimum [23]. Based on these findings, here an approach to combining GA with deep learning is proposed. Specifically, by using EEGNet and a GA together, the aim is to achieve global optimization of initial network parameters to decode motor imagery of joints and corresponding directions. Additionally, by augmenting the data with balanced noise, the accuracy of models can be improved. Overall, the proposed approach may provide a viable solution to the challenge of decoding unilateral MI.
Five college students (three males, two females, 23–27 years old) were recruited for this experiment. All participants were healthy, free of neurological diseases and provided informed consent. The protocol was standard for development of wearable electronic devices within the electrical and hardware field, with no involvement of human biological or clinical factors. It causes no harm to the subjects and no personal information was collected for analysis. EEG data was collected using the UE-16B amplifier and an EEG cap (Beijing Xintuo Company, Beijing, China). The cap contained 16 AgCl electrodes following the international 10-20 system. Before the cap was fitted, the electrodes were inserted into gel to reduce skin resistance. The amplifier sampling frequency was 500 Hz, with a low-pass filter (cut-off frequency range 15–120 Hz, with a 50 Hz frequency notch module). The forehead electrode was set as a ground electrode and the reference electrodes were the eardrum electrodes (A1 and A2). According to the ERD/ERS phenomenon generated during the MI process [24], the EEG band was mainly concentrated in the range of 8–30 Hz. Among them, ERD and ERS respectively refer to the phenomenon of decreasing or increasing of the amplitude of the 8–30 Hz EEG signals activated during exercise. The low-pass cutoff frequency of the EEG amplifier was set to 100 Hz. All 16-channels of data were analyzed.
The experiment included six types of unilateral upper limb MI movements: elbow flexion/extension, wrist pronation/supination and hand grasping/opening. Each subject performed 50 trials for each type of MI task, resulting in a total of 300 trials per subject. Data was collected using the experimental paradigm illustrated in Fig. 1. For simplicity, elbow flexion/extension is referred as M1, wrist pronation/supination as M2 and hand grasping/opening as M3. Visual stimulation in the form of video was provided to the subjects during the experiment for better comprehension. To reduce the effect of visual stimulation on the EEG record, artifacts of eye trace and others irrelevant signals were eliminated during pre-processing.
 Fig. 1.
MI experiment paradigm. MI, motor imagery.
The procedure for a single trial was: During the experiment preparation stage, an indication picture appeared on a screen for two seconds to remind the subject to prepare for the MI task. At the time stamp of that duration, the corresponding MI prompt video, four seconds, appeared on the screen and the subject performed the MI task according to the actions in the video. At the time point of six seconds, a specified image appeared on the screen, indicating to the subject to take a momentary break prior to the next trial.
To address the issue of low recognition rates in upper limb multi-joint MI tasks, a GA weight optimization-based EEGNet classification method is proposed. Firstly, the original data are preprocessed using band-pass filters and discrete wavelet transform. The sample size is then expanded by adding Gaussian noise. Finally, GA_EEGNet is used for feature extraction and MI task classification. After data augmentation, 80% of the data is used to train the EEGNet network model, with 10% reserved for model verification and another 10% for testing. All experiments were conducted using Keras API (Keras 2.7.4, Google, Mountain View, CA, USA) on Tensorflow (Tensorflow 2.0, Google), configured with NVIDIA (Version 417.23 GeForce GT 1030, NVIDIA, Santa Clara, CA, USA) i5-4210M CPU @2.60GHz. The detailed signal processing flow is illustrated in Fig. 2 and is explained further in subsequent sections.
 Fig. 2.
Signal processing flow chart. ELU, exponential linear unit; DWT, discrete wavelet transform; BN, batch normalization; DP, dropout; GA, genetic algorithm.
Due to external noise and physiological artifacts that interfere with EEG signals, data cleaning is necessary. The brain produces specific ERD and ERS phenomena during MI tasks [25], with the sensorimotor rhythm in the motor cortex being the primary oscillation investigated in MI-based BCI. This rhythm includes the alpha/mu (8–13 Hz) and beta (13–30 Hz) bands. Collected data is first down-sampled to 128 Hz and then fifth-order Butterworth filtered between 8–30 Hz. Subsequently, discrete wavelet transform is utilized to denoise the signal. Using DB6 as the mother wavelet, the EEG signal is decomposed into three wavelet layers, from which three high-frequency coefficients and three low-frequency coefficients are obtained, then reconstructed according to the characteristics of the EEG signal.
Due to the high demand for parameter tuning in neural networks, a large number of data samples are required for training models, particularly in the case of MI EEG signals. However, obtaining a sufficient number of labeled samples is time-consuming, making data augmentation strategies necessary. In image processing, two basic augmentation tactics are used: geometric transformation and noise addition [26]. Geometric transformation involves techniques such as rotation, scaling and color enhancement. However, these methods cannot be applied to EEG signals as they are continuous time-dependent signals and their time-domain features will be destroyed if the EEG signal is rotated or scaled. The data augmentation methods for EEG signals include Gaussian noise addition [27], empirical mode decomposition [28] and deep generative adversarial nets [29, 30]. Considering factors such as algorithm complexity and training time, Gaussian noise is added to the EEG signal to increase the number of training samples. Since the experiment only collected data from five subjects, the amount of data is relatively small, so data augmentation is necessary. After augmentation, the separation of training and testing data is carried out to avoid data duplication in the training and testing processes, which generates false positive results.
where µ denotes the mean and
To investigate the impact of various levels of data augmentation and standard deviation of added Gaussian white noise on EEG signal classification performance, values are varied between 0.001 and 0.5 and six different data augmentation multiples (m = 0,…, 5) are used, where, the data enhancement multiple represents the standard deviation of the added Gaussian white noise. When m = 0, no data expansion is applied. These parameters will be assessed in subsequent comparative experiments.
EEGNet is a condensed CNN model used for classifying and visualizing EEG signals. This model stands out from other network structures due to its reduced training parameters and faster training speed. However, one of its weaknesses is its high sensitivity to initial weights [31], making it less robust. To address this issue, it is proposed here to combine it with GA optimization.
(1) EEGNet
The network structure diagram of EEGNet (Fig. 2), makes use of both depthwise and separable convolution. The latter consists of two steps: depthwise convolution and pointwise convolution [32]. By only connecting the depthwise convolution layer to a subset of the feature map from the previous layer, the extent of computational resources required for convolution is significantly reduced.
The network structure parameters of the EEGNet model are presented in Table 1.
Conv2D and DepthwiseConv2D respectively represent the two-dimensional convolution
layer and the depthwise convolution layer. SeparableConv2D is the separable
convolution layer and pool denotes the pooling layer, while C gives the
number of signal channels and T the number of time points,
F
| Layer | Layer type | Kernel | Params | Output |
| 1 | Input | (C, T) | ||
| Conv2D | F |
64 * F |
(F | |
| BatchNorm | 2 * F |
(F | ||
| DepthwiseConv2D | D * F |
C * D * F |
(D * F | |
| BatchNorm | 2 * D * F |
(D * F | ||
| Activation | (D * F | |||
| Pool | (D * F | |||
| 2 | SeparableConv2D | F |
8 * D * F |
(F |
| BatchNorm | 2 * F |
(F | ||
| Activation | (F | |||
| Pool | (1, 8) | (F | ||
| Flatten | (F | |||
| Classifier | Softmax | N * (F |
N |
EEG, electroencephalography.
Time-domain convolution and spatial convolution are performed sequentially in
the first layer. Due to the time domain characteristics of the signal and the
independence of each channel signal, a one-dimensional convolution kernel is used
in the time domain convolution layer, with the length of the filter set to half
the sampling rate. Time-domain convolution is performed by F
In the second layer, deep separable convolution is applied. First, a spatial
filter of size (1, 8) is used for depthwise convolution, this is followed by a
F
EEGNet networks with different architectures can be obtained by changing the
number of time domain (F
(2) EEGNet optimized by GA
In multi-class MI classification, the choice of initialization weights greatly impacts the performance of EEGNet, which results in significant differences in classification accuracy across different training samples. To address this issue, a GA is proposed to pre-train the network to avoid getting attracted to local minima, followed by fine-tuning the parameters with a BP algorithm.
GA is an optimization method that simulates the biological evolution of nature and is highly adaptable to complex problems such as nonlinearity [33]. The essence of GA is an aggressive optimization search. First, a randomly initialized population is created, individual genes in the population are then selected, crossed and mutated at each iterative step. Offspring are then screened through a customized individual fitness function and optimal individuals are finally retained after several generations of population reproduction and evolution.
During the weight optimization of EEGNet with the GA, the network structure remains unchanged. Firstly, the GA is used to conduct preliminary training on the convolution kernel parameters of EEGNet, completing global optimization in the weight solution space. Next, a set of convolution kernel parameters with high fitness are selected and the weights are modified twice using the BP algorithm. The final weights of EEGNet are then obtained based on the error minimization criterion. The GA flow chart is given in Fig. 3.
 Fig. 3.
GA-based EEGNet weight optimization flow chart. BP, backpropagation; Y, yes; N, no.
The steps of EEGNet network initial weights training are as follows:
Step 1: As the weight values of EEGNet are non-integer decimals, decimas are
used to encode parameter values in this experiment. The convolution kernel
parameters are randomly initialized using numbers within the range of [–0.2,
0.2], mean zero, with a small interval between them. These parameter values are
treated individually as members of the initial population, expressed as
Step 2: The classification accuracy of EEGNet is calculated for each weight parameter, which is then considered as the individual fitness for each member of the population.
Step 3: The roulette wheel selection method, also known as the proportional selection method, is combined with an optimal individual preservation strategy to select individuals from the population [34, 35].
An optimal strategy for individual preservation involves comparing the maximum fitness value of individuals in the current population with the highest historical value in each iteration. The genes of fitter individuals in both groups should be preserved. Finally, the gene with the highest individual fitness value is accepted once the iteration is complete.
The proportional selection method, is based on the assumption that the fitness
value of an individual is proportional to its survival probability. The
calculation process is as follows: First, the fitness of all individuals in the
contemporary population and the retention probability of each individual in the
next generation are obtained and the cumulative probability q
Step 4: Individual crossover. According to the crossover probability p
where p
Step 5: To ensure diversity within the population genes, individual mutations are necessary. This entails randomly changing the genes of individuals, with a specific mutation probability. However, to prevent a decrease in the algorithm’s stability or the emergence of a local optimal solution, an adaptive mutation probability is calculated by Eqn. 3.
where p
Step 6: Algorithm termination. When the maximum number of iterations is reached, the algorithm stops running and outputs all individuals in the final generation of the population, otherwise steps 2–5 are repeated.
The maximum number of iterations is set to 50. According to the literature [29],
the value range of the crossover probability is 0.4~0.9. In this
experiment, the initial crossover probability p
In this experiment, a hierarchical classification strategy is applied [36]. Firstly, the three joints of the upper limb are classified and the two movement directions of each joint are then identified. Based on a combination of information about the motion of the three joints and the movement direction of each joint, the complete decoding of upper limb MI movements is realized. To enhance the generalization ability and robustness of the EEGNet network model, data augmentation and noise addition were utilized. However, excessive data or improper noise standard differences may impede valid sample creation and network convergence. Furthermore, proper parameter selection is crucial for accurate classification performance of the three joints. Refer to Table 2 for experimental results.
| m | 0 | 1 | 2 | 3 | 4 | 5 |
| σ | ||||||
| 0.001 | 58.6 | 64.8 | 67.8 | 80.6 | 73.3 | 72.2 |
| 0.01 | 58.6 | 66.7 | 68.4 | 73.3 | 70.4 | 74.1 |
| 0.1 | 58.6 | 67.6 | 81.5 | 85.2 | 75.4 | 80.6 |
| 0.2 | 58.6 | 69.4 | 77.8 | 75.2 | 80.6 | 76.9 |
| 0.5 | 58.6 | 63.9 | 80.6 | 79.6 | 74.6 | 78.7 |
| Mean |
58.6 |
66.5 |
75.2 |
78.8 |
74.9 |
76.5 |
STD, standard deviation.
In Table 2 and Fig. 4, when m = 0, the average accuracy of three joint classifications without data augmentation is only 58.6%. However, after doubling the training sample size, the classification accuracy improves significantly to more than 65%, indicating that data augmentation substantially enhances EEGNet performance in the three-joint MI task. As m is increased from one to three, the overall classification accuracy for the three joints gradually increases. But with further increases in m, classification accuracy begins to decrease. When m = 3 and the standard deviation of Gaussian white noise is set to 0.1, the classification accuracy reaches its highest point at 85.2%, which is a 26.6% improvement compared to results without data enhancement. These findings confirm that data augmentation effectively solves the problem of insufficient learning with small sample training sets in EEGNet, resulting in significant improvements of classification accuracy. Therefore, the multiple of data amplification is set to three, and the standard deviation of added Gaussian noise is set to 0.1.
 Fig. 4.
Average classification accuracy of three joints under different data augmentation multiples and noise standard.
However, while the data augmentation step effectively expands the data set, it
also brings the potential of data leakage. After data enhancement by adding
noise, there is a chance that the data will be divided into the training set and
the test set, which will lead to the hidden danger of data leakage [37, 38].
Specifically, in the data enhancement, sample
To verify the effectiveness of the proposed algorithm, the classification performance of EEGNet and EEGNet combined with GA (GA_EEGNet) is firstly compared in the three joint classification of five subjects (Table 3).
| Subject | 1 | 2 | 3 | 4 | 5 | Mean |
| EEGNet | 85.83 | 86.67 | 90.13 | 84.11 | 72.67 | 83.88 |
| GA_EEGNet | 88.30 | 89.81 | 92.13 | 87.50 | 82.11 | 87.97 |
The original average classification accuracy of EEGNet in the three joint classifications is 83.88%, while that with the combined genetic algorithm is 87.97%, showing an improvement of about 4.90%. The classification results of all five subjects are improved after combining GA, which shows that GA effectively improves the classification effect of three joint MI. The comparison of the experiment results between EEGNet and GA_EEGNet in M1, M2 and M3 tasks are given in Table 4.
| Subject | M1 | M2 | M3 | |||
| EEGNet | GA_EEGNet | EEGNet | GA_EEGNet | EEGNet | GA_EEGNet | |
| 1 | 75.3 | 87.5 | 77.2 | 85.8 | 87.5 | 89.3 |
| 2 | 91.4 | 96.8 | 81.5 | 93.3 | 95.3 | 96.8 |
| 3 | 93.9 | 97.5 | 89.6 | 94.8 | 81.5 | 97.5 |
| 4 | 85.0 | 92.5 | 87.5 | 92.5 | 93.9 | 94.8 |
| 5 | 79.5 | 95.3 | 83.3 | 84.6 | 91.4 | 94.8 |
| Mean | 85.0 | 93.92 | 83.8 | 90.2 | 89.9 | 94.6 |
For M1, M2 and M3 tasks, after combining with GA, the classification performance is greatly improved. Among them, the improvement of the M1 task is the most significant, with an increase of 8.9%, while the average classification accuracy of M2 and M3 tasks is improved by 6.38% and 4.72%, respectively. For all three tasks, the classification results of the five subjects under GA_EEGNet are higher than that of EEGNet alone, which further demonstrates the validity of the algorithm here. From Tables 3,4, the product of the two-step strategy can be used to distinguish the six-types of MI to achieve an overall accuracy of 81.74% by inclusion of GA optimization. In comparison, the overall accuracy is only 72.33% when using EEGNet alone.
The average classification accuracy and standard deviation of five subjects in three joint classifications (M1, M2 and M3) are given in Fig. 5, indicating that GA_EEGNet exhibits a significant improvement in classification performance for the M1 task compared to all other tasks. Additionally, GA_EEGNet significantly reduces the classification standard deviation for each task in comparison to EEGNet, highlighting its effectiveness in decreasing the impact of different initial parameters on classification results. Consequently, this modification reduces subject differences and enhances overall classification performance.
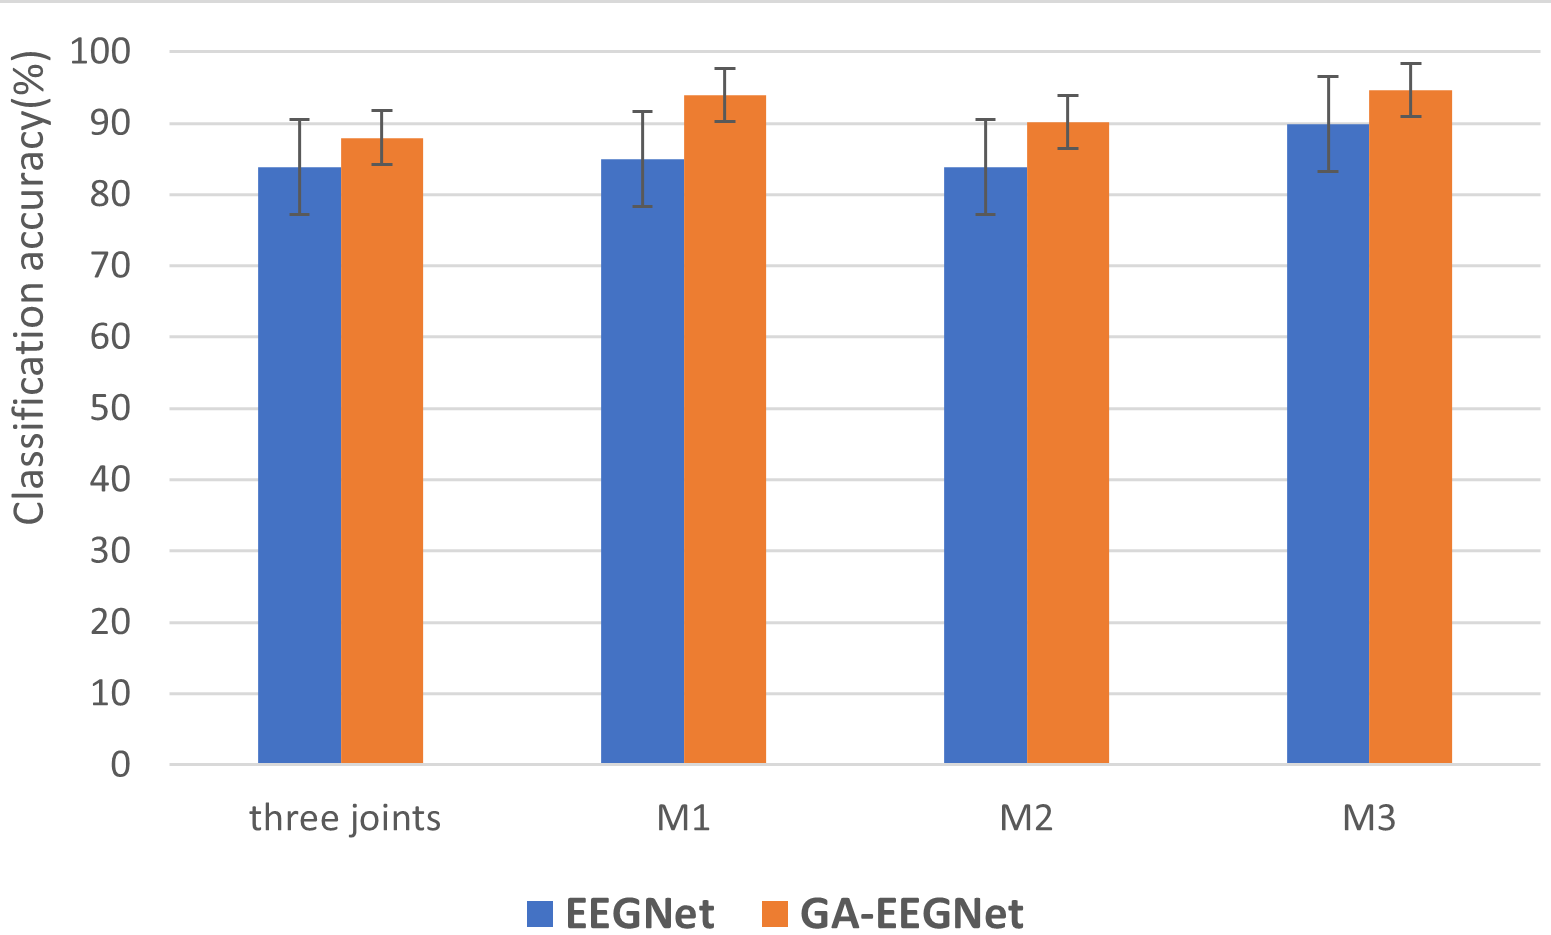 Fig. 5.
Average classification accuracy and standard deviation of three joints and single joints. M1 task is to distinguish elbow flexion and extension, M2 task is to distinguish wrist pronation and supination, M3 task is to distinguish hand grasp and open.
The confusion matrix of the three joint classification and the loss value curve of the validation set in the M1, M2 and M3 task classifications are given in Fig. 6. From the confusion matrix, it can be seen that the best classification effect of the three joints is hand movement, with a classification accuracy reaching 93.6%, followed by the elbow classification at 87.5%. Because hand movements are easier to imagine and elbow movements have a greater M1 range, these two types of joint movements are easier to distinguish. From the loss function curve of M1, M2 and M3 task training models, it can be seen that the loss value of the M2 task classification model is the largest, while the M1 task has the best classification with the smallest loss value. The motor imagery task of elbow flexion and extension in M1 is well executed and easily discriminable, whereas the imagery task of wrist movement in M2 is more challenging, resulting in lower accuracy compared to the other two categories.
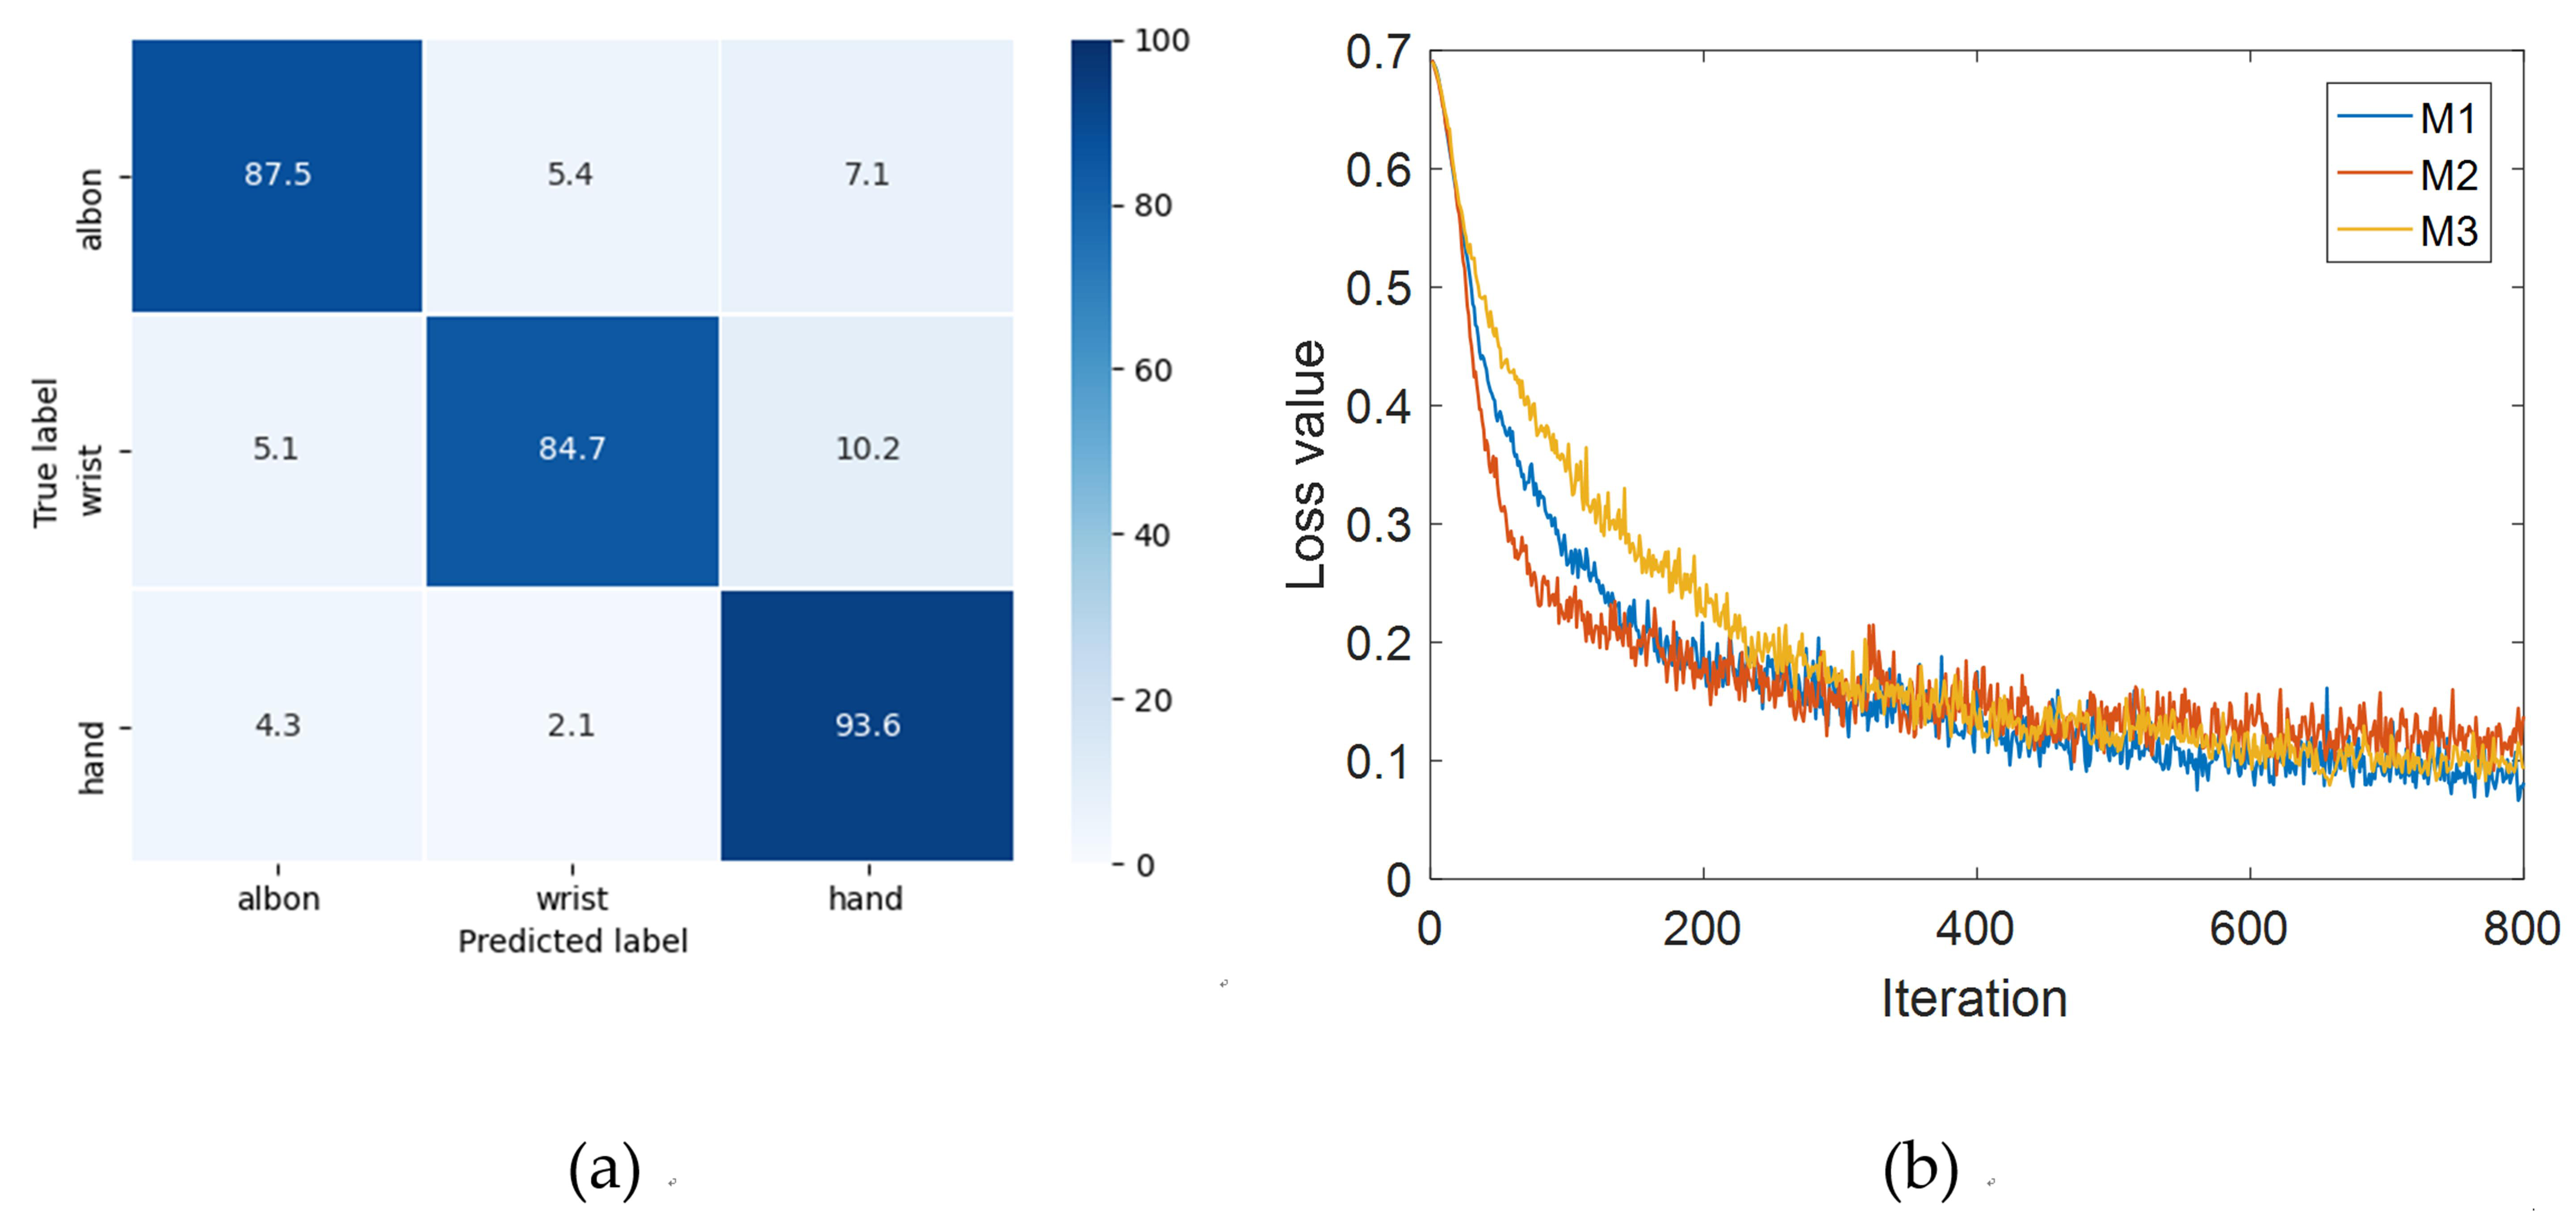 Fig. 6.
Confusion matrix and loss value curve of the validation set of the three joint classification. (a) Three-joint classification confusion matrix. (b) Loss value curve of M1, M2, M3 task classification. M1 task is to distinguish elbow flexion and extension, M2 task is to distinguish wrist pronation and supination, M3 task is to distinguish hand grasp and open.
To further verify the effectiveness of the proposed GA_EEGNet algorithm, a comparison experiment was performed with two other types of neural network, Deep ConvNet and Shallow ConvNet [40]. There are four convolutional layers with Deep ConvNet, which also used batch normalization and dropout techniques, with a final dense softmax classification layer. The first layer was divided into two parts, first for time-domain convolution, then for spatial convolution in the channel dimension, finally for maximum pooling. Each of the remaining three layers consists of a standard convolution layer and a maximum pooling layer. ELU is the nonlinear activation function used in the network. In addition to the shallow ConvNet’s time-domain and spatial convolutional layers, there is also a square nonlinear activation and average pooling layer, culminating in a dense classification layer. Alongside the deep learning method, this experiment compared results with a traditional manual feature extraction algorithm. Spatial and frequency domain features were extracted using common spatial pattern (CSP) and local characteristic-scale decomposition (LCD) algorithms, followed by classifiers using spectral regression discriminant analysis. Results of the experimental comparison for three joint classifications and M1, M2, M3 task classification are illustrated in Fig. 7.
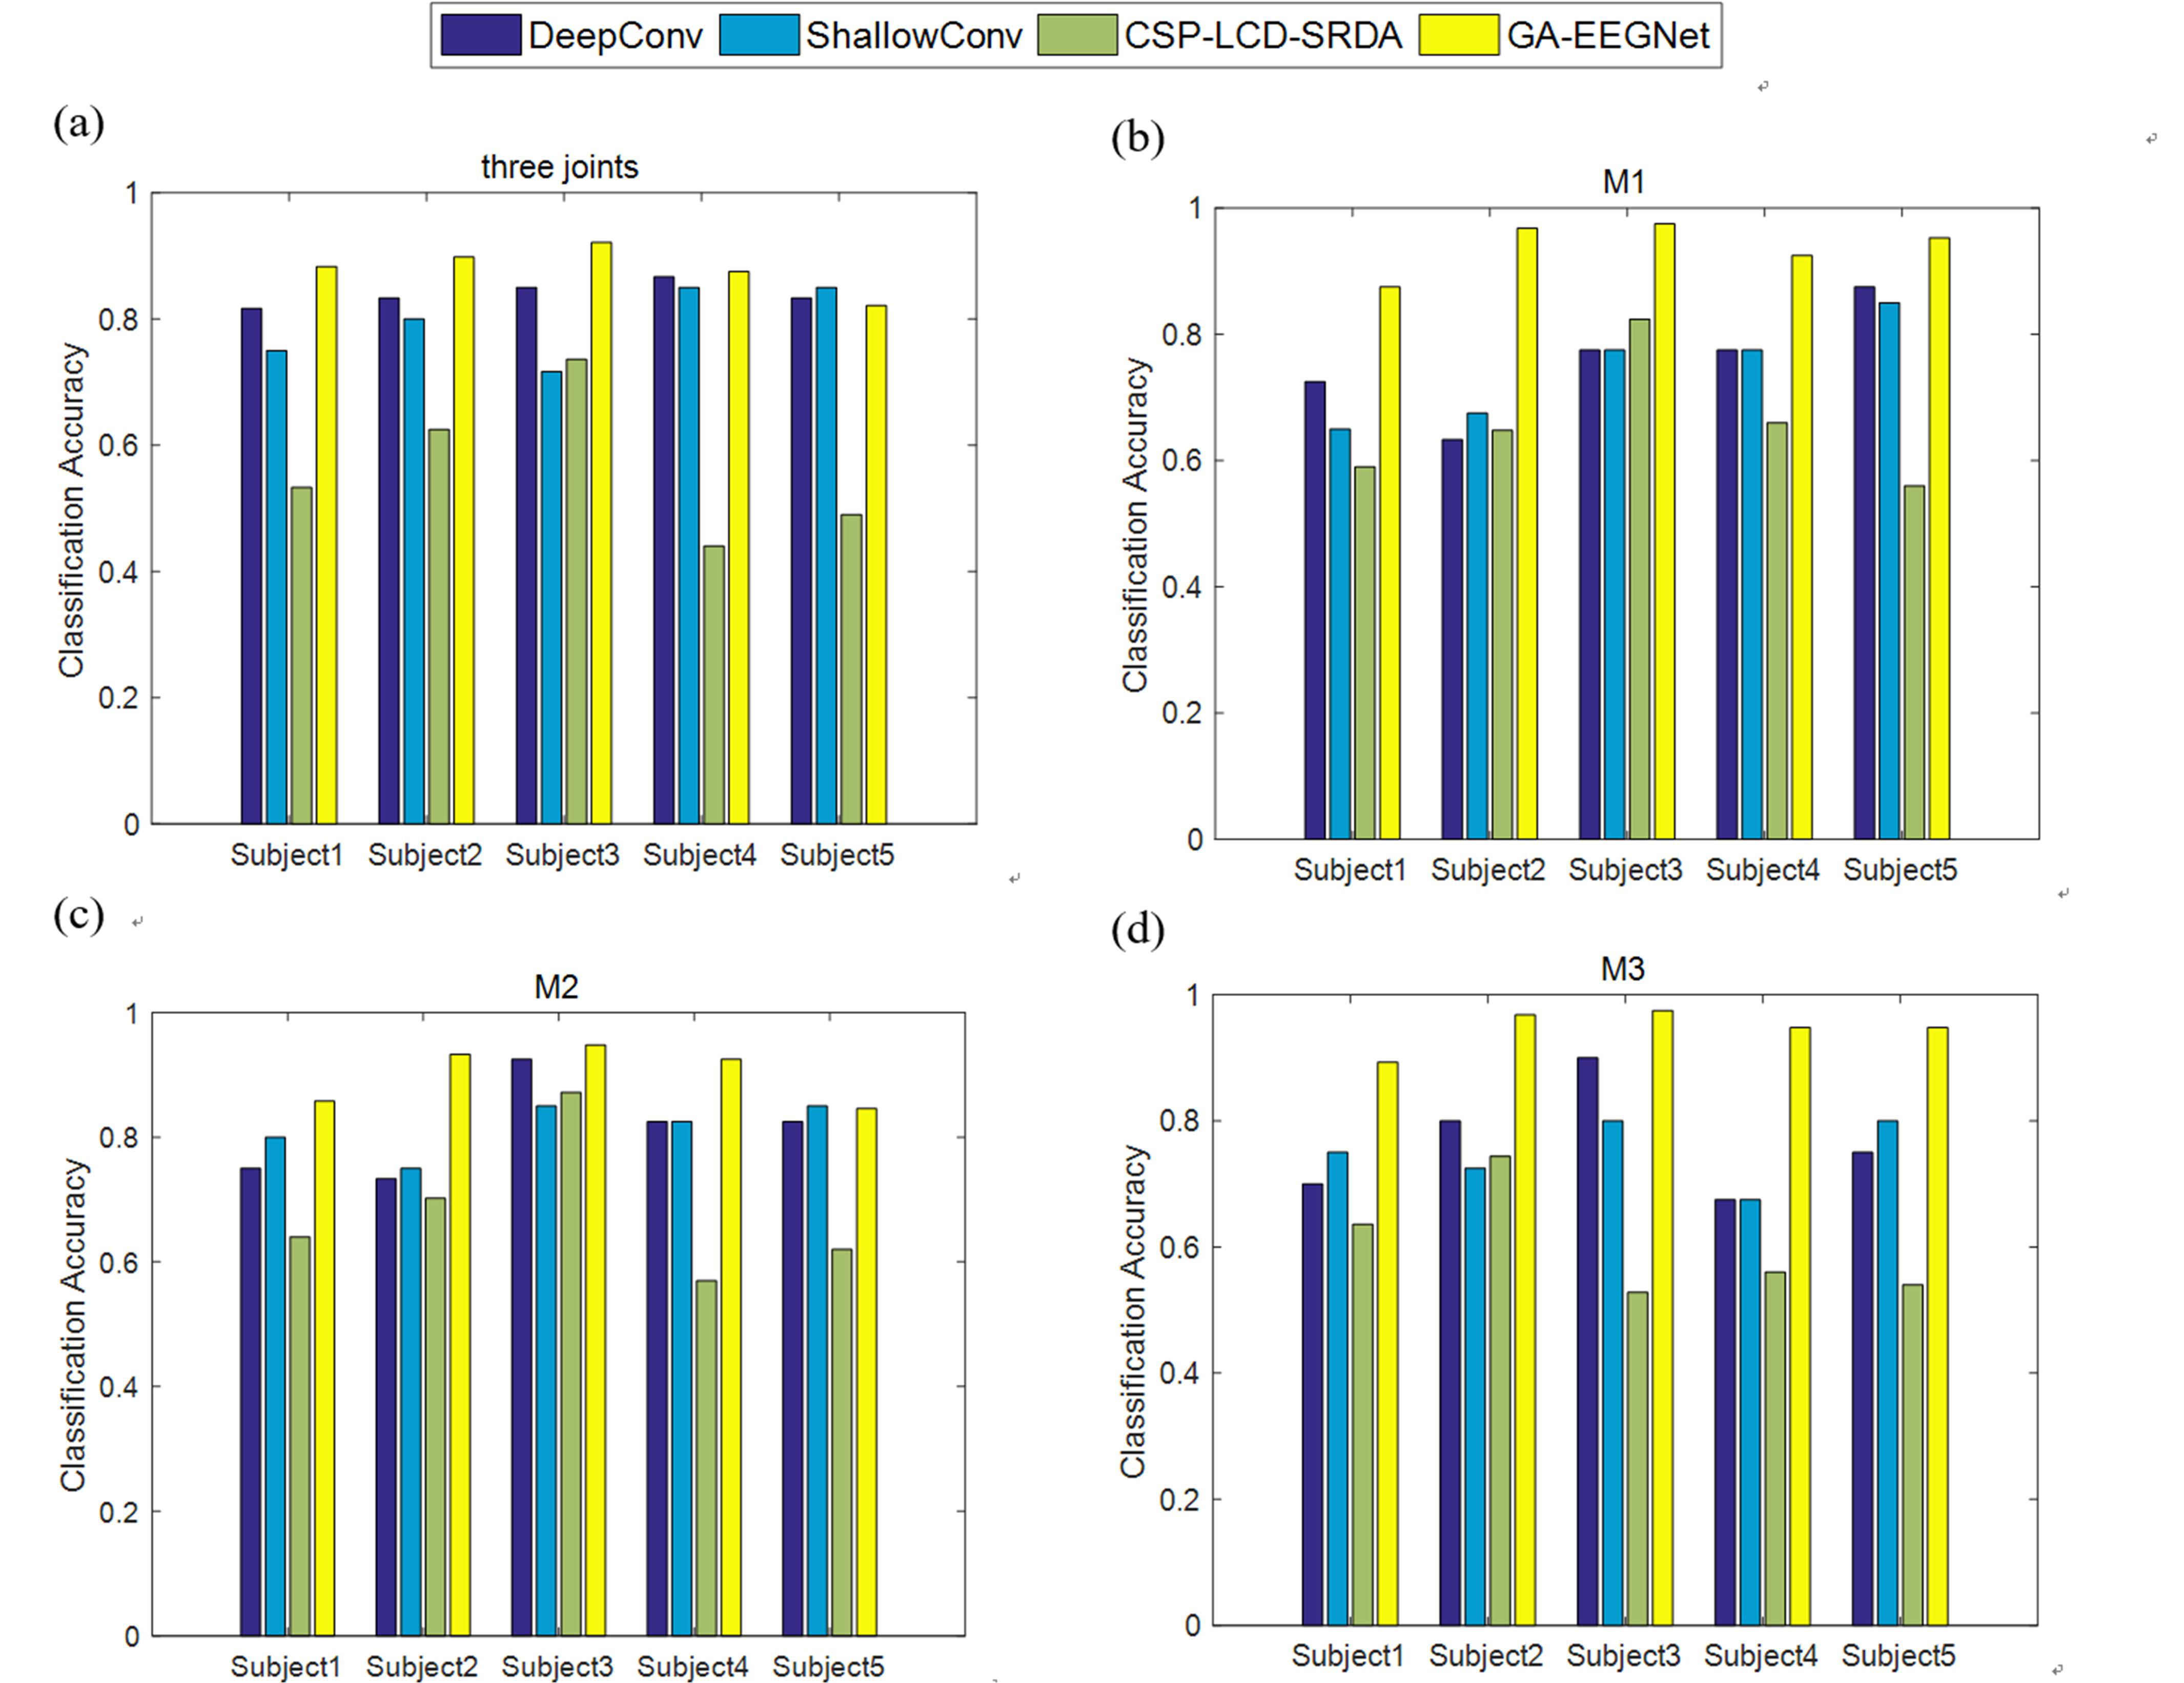 Fig. 7.
Comparison experiment results of three joint and M1, M2, M3 classification. (a) Classification results of three joints. (b) Classification results of M1. (c) Classification results of M2. (d) Classification results of M3. The M1 task is to distinguish elbow flexion and extension, M2 task is to distinguish wrist pronation and supination, M3 task is to distinguish hand grasping and opening. CSP, common spatial pattern; LCD, local characteristic-scale decomposition; SRDA, spectral regression discriminant analysis.
The comparison results of three-joint classification given in Fig. 6, indicate that the proposed algorithm outperforms the other algorithms with an exception for Subject 5. The traditional feature classification method (common spatial pattern_local characteristic-scale decomposition_spectral regression discriminant analysis, CSP_LCD_SRDA) has the lowest average classification accuracy (56.5%), while the GA_EEGNet algorithm achieves the highest average accuracy (87.97%) among the four types of algorithms examined. The proposed algorithm performs particularly well in M1 and M3 tasks, with an average classification accuracy 18.52% and 18.14% higher, respectively, than the second-highest performing algorithm, Deep ConvNet. In the M2 task, in addition to Subject 5, the algorithm employed here also achieves the best results for the other four subjects. Compared with Deep and Shallow ConvNets, EEGNet combines deep convolution and separable convolution, separates regional features from channel features and effectively decouples the relationship within and across feature maps. The proposed algorithm has more prominent classification advantages when compared to the traditional CSP_LCD_SRDA algorithm. Manual feature extraction algorithms struggle to extract detailed and comprehensive information for fine motor imagery on the same side of the upper limbs. EEGNet enables end-to-end EEG signal decoding with high robustness while automatically extracting depth features. The algorithm proposed here achieves the best results in both the three-joint classification and M1, M2, M3 two-class classification tasks, demonstrating excellent performance in decoding the multi-joint motor imagery of upper limbs. It is an algorithm that has potential applications in rehabilitating stroke patient upper limbs.
The high-precision classification of MI tasks is of great significance to rehabilitation training. The neurocognitive relationship between motor imagery and cortical activity provides theoretical guidance for rehabilitation training of patients with nerve injury. Sensorimotor processing has been shown to specifically affect psychosomatic representations [41]. Through transcranial magnetic stimulation combined with EEG technology, the rehabilitation mechanism of motor function reconstruction and neural remodeling of patients after stroke is analyzed, which can reveal the function of the cerebral cortex network at a deeper level [42]. Moreover, understanding the function of the cerebral cortex network provides a theoretical basis for the high-precision classification of MI tasks. Transcranial direct current stimulation has been shown to modulate cortical plasticity, enhance motor learning and induce upper limb motor recovery after stroke. It has also been shown to boost the activation of BCI in stroke patients. The MI-BCI task improves motor function in patients with moderate to severe injury in chronic stroke patients with stroke patients. Moreover, it has been shown by transcranial direct current stimulation experiments that contralateral M1 may play a role in stroke recovery in patients with more severe involvement [43]. Therefore, the neurocognitive relationship between MI task and cortical activity is of great significance for rehabilitation training. In this work, it was only classification of M1 tasks that was attempted with high accuracy. In follow-up work, it is planned to establish an understanding of the neurocognitive relationship between motor imagery and cortical activities by means of near-infrared and traceability analysis and assist MI task classification from the perspective of the cerebral cortex network. The aim is to achieve higher classification accuracy and provide feasible technical means for identification of cerebral cortex cognitive function.
Here, a novel algorithm has been proposed for the analysis of MI EEG signals to allow recognition of fine motor EEG imagery obtained during upper limb activity. EEGNet, based on deep and separable convolution and optimized with GA, is employed to tackle the issue of MI task recognition. The algorithm achieves an average classification accuracy of 87.97% for three joint classifications, with classification accuracies of 93.92%, 90.2% and 94.64% for M1, M2 and M3 tasks, respectively. Compared with other commonly used neural networks and algorithms, the algorithm introduced here effectively learns the distinguishing features in MI signals and significantly improves the decoding performance. It substantially overcomes the negative interference of initial weights on network model performance. It facilitates a machine learning application for a brain computer interface, which may contribute to furthering efficient interaction between human and machine.
The experiment data used to support the findings of this study are available from the corresponding author upon request.
QC, CL and AC designed the research study. QC, CL conducted experiments. CL conceived the idea. QC and AC analyzed the data and wrote the draft. All authors contributed to editorial changes in the manuscript. All authors read and approved the final manuscript. All authors have participated sufficiently in the work and agreed to be accountable for all aspects of the work.
All subjects gave their informed consent for inclusion before they participated in the study. The study was conducted in accordance with the Declaration of Helsinki, and the protocol was approved by the Ethics Committee of Wuhan University of Technology (approval number: XXXY-E-05).
The author would like to appreciate the Yunnan Zhongheng Construction Co., ltd. This institution provides the cooperation infrastructure for this research with the university. QC and CL are both affiliated the this company as well to boost the university-enterprise cooperation research and development, which will continue in the future.
This research received no external funding.
The authors declare no conflict of interest. QC, CL are with the Yunnan Zhongheng Construction Co., ltd., which declare the academic paper has no conflict with the commercial company. This company is in the information technology device and service area.
Publisher’s Note: IMR Press stays neutral with regard to jurisdictional claims in published maps and institutional affiliations.