


 , Jian Song 2,3,*
1 Department of Neurosurgery, The Second Affiliated Hospital of Fujian Medical University, 362000 Quanzhou, Fujian, China
2 The First School of Clinical Medicine, Southern Medical University, 510515 Guangzhou, Guangdong, China
3 Department of Neurosurgery, The General Hospital of Chinese PLA Central Theater Command, 430070 Wuhan, Hubei, China
†These authors contributed equally.
Abstract
Background: Repetitive mild traumatic brain injury (rmTBI) often occurs in individuals engaged in contact sports, particularly boxing. This study aimed to elucidate the effects of rmTBI on phase-locking value (PLV)-based graph theory and functional network architecture in individuals with boxing-related injuries in five frequency bands by employing resting-state electroencephalography (EEG). Methods: Twenty-fore professional boxers and 25 matched healthy controls were recruited to perform a resting-state task, and their noninvasive scalp EEG data were collected simultaneously. Based on the construction of PLV matrices for boxers and controls, phase synchronization and graph-theoretic characteristics were identified in each frequency band. The significance of the calculated functional brain networks between the two populations was analyzed using a network-based statistical (NBS) approach. Results: Compared to controls, boxers exhibited an increasing trend in PLV synchronization and notable differences in the distribution of functional centers, especially in the gamma frequency band. Additionally, attenuated nodal network parameters and decreased small-world measures were observed in the theta, beta, and gamma bands, suggesting that the functional network efficiency and small-world characteristics were significantly weakened in boxers. NBS analysis revealed that boxers exhibited a significant increase in network connectivity strength compared to controls in the theta, beta, and gamma frequency bands. The functional connectivity of the significance subnetworks exhibited an asymmetric distribution between the bilateral hemispheres, indicating that the optimized organization of information integration and segregation for the resting-state networks was imbalanced and disarranged for boxers. Conclusions: This is the first study to investigate the underlying deficits in PLV-based graph-theoretic characteristics and NBS-based functional networks in patients with rmTBI from the perspective of whole-brain resting-state EEG. Joint analyses of distinctive graph-theoretic representations and asymmetrically hyperconnected subnetworks in specific frequency bands may serve as an effective method to assess the underlying deficiencies in resting-state network processing in patients with sports-related rmTBI.
Keywords
- repetitive mild traumatic brain injury
- electroencephalography
- neurocognitive processing
- network-based statistic
- resting-state functional networks
Mild traumatic brain injury (mTBI) often occurs in athletes who participate in competitive sports [1, 2], which may result in persistent cognitive dysfunction in some patients with mTBI [3, 4]. The severity of sports-related mTBI is based on evidence that athletes with a history of mTBI are more likely to have greater susceptibility to subsequent repetitive mTBI (rmTBI) [5], which are more likely to occur in individuals participating in contact and collision sports [2, 6]. Previous studies have shown that cognitive impairment caused by sports-related rmTBI is even more pronounced than is impairment caused by mTBI [7, 8]. Boxing, as a quintessential contact sport, has a much greater probability of causing rmTBI in both amateur and professional boxers and can result in a unique type of sports-related mTBI. Although the repeated blows experienced by boxers are sub-concussive and less severe than most mTBIs, the cumulative effects may result in noticeably detrimental consequences, with the condition of many participants progressing to chronic traumatic encephalopathy [9]. Moreover, the condition of some active boxers deteriorates to the point that they develop dementia pugilistica or Parkinson’s disease, which are late sequelae associated with repetitive blows to the brain [10, 11]. Therefore, the adverse effects of chronic cumulative consequences associated with rmTBI on the neurocognitive processing of professional boxers with active exposure warrant further exploration.
The consequences of cognitive dysfunction caused by exposure to sports-related head impact encompass many aspects, including executive dysfunction, attentional problems, working memory impairment, and information processing deficits [12, 13, 14], which are closely associated with repetitive neurotrauma, increasing age, and cognitive reserve [7, 15, 16]. However, traditional inspection methods such as physical examination, neuropsychological screening, and computed tomography (CT) are unlikely to yield positive results in patients with mTBI who have mild symptoms of cognitive dysfunction. Fortunately, the increasing application of electroencephalography (EEG) and functional magnetic resonance imaging (fMRI) has shown that these techniques can effectively reveal the mechanisms underlying neurocognitive deficits caused by sports-related head-impact exposure [13, 17].
EEG provides a non-invasive neuro-electrophysiological method to effectively evaluate neurological function with high-precision temporal resolution in milliseconds by detecting electrophysiological information associated with cognitive processing [18]. Therefore, EEG is particularly applicable for research on cognitive processing dysfunction caused by mTBI. However, one of the pivotal characteristics of mTBI is high variability in the mechanism, pathology, and consequences of injury among different individuals [19, 20], suggesting the significance of integrated functional analysis from the perspective of whole-brain functional topology and neural networks in exploring the impact of mTBI [21, 22]. In a recent study, while cognitive functions were comparable, a greater EEG functional network dysregulation was suggested in patients with mTBI during the early post-injury phase than during the later phase [23]. Furthermore, aberrant changes were detected in resting-state functional brain networks in the non-acute phase in individuals affected by sports-related mTBI [24]. Nevertheless, regardless of the phase of injury, previous research on functional brain network for mTBI has reported significantly enhanced functional connectivity or ‘hyperconnectivity’ as a consistent features. This phenomenon is thought to be a consequence of the tradeoff between network metabolic cost and information communication efficiency after mTBI [25]. The hyperconnectivity of the functional brain network has also been demonstrated through characteristic changes in resting-state EEG information flow and effective connectivity patterns in adolescents with mTBI [26]. Moreover, hyperconnectivity and complex reorganization of brain network connectivity in the mTBI population have been detected by fMRI studies, which are considered to be the optimal allocation of maximum information flow and the compensation mechanism of neuro-electrophysiological disturbances to support individuals with well-adjusted cognitive performance [27, 28]. Therefore, previous studies have indicated that the hyperconnectivity of functional brain networks can be considered a characteristic connectivity change for individuals with mTBI; however, to date, few studies have investigated the impact of rmTBI on whole-brain functional topology and neural networks with resting-state EEG technology, especially in all five frequency bands.
Based on previous conclusions regarding whole-brain topology and network connectivity, the primary purpose of this study was to evaluate the cumulative effects of boxing-related rmTBI on phase synchronization and the functional network architecture of boxers with rmTBI in each frequency band by employing resting-state EEG analyses. Thus, we employed the phase-locking value (PLV) to compute phase synchronization for resting-state EEG signals. The functional network connectivity was then constructed based on the calculated PLV matrices. This approach efficiently discerns instantaneous changes in functional brain networks without considering the influence of voltage amplitude fluctuation [29]. Based on the computed binary connectivity matrices, both the graph-theoretic parameters representing the functional network efficiency and the small-world properties of brain networks can be successfully realized for boxers and controls. Moreover, based on the analyses of the calculated nodal degree centrality, we distinguished the rearrangement in the distribution of functional centers to investigate the consequences of reconstruction in pivotal functional network components for boxers. Crucially, the use of a network-based statistical (NBS) analysis allowed us to verify whether there were significant differences in functional network connectivity between the boxers and controls. By comparing the boxers with controls, we could effectively explore whether there were significant changes in subnetworks within specific frequency bands. This approach aimed to investigate the cumulative consequences of repeated head impact exposure on whole-brain resting-state functional networks.
A total of 24 active boxers were recruited from Wuhan Sports University, and 25 control participants were recruited from surrounding universities. Eligible boxers were required to meet the following criteria: (1) more than one year of professional boxing experience; (2) experience participating in provincial and national championships; and (3) between 17 to 25 years of age. Boxers were excluded if they met any of the following criteria: (1) a medical history of neurological or psychiatric disease; (2) moderate or severe traumatic brain injury or mTBI not caused by boxing (e.g., caused by traffic accidents, falling down, or explosions); and (3) comorbidities and/or chronic conditions, such as chronic liver or renal dysfunction or diabetes, known to deteriorate neurocognitive function. The same exclusion criteria were also applied to the control participants, except that the controls had no history of rmTBI, boxing, or other combat sport-related experiences.
All the boxers and controls had normal or corrected-to-normal visual acuity, hearing, and color vision. The research protocol was approved by the Ethical Committee of the General Hospital of Chinese PLA Central Theater Command (Wuhan School of Clinical Medicine, Southern Medical University, China) (approved number: [2020]041-1). All participants provided informed consent prior to the procedure.
The study procedure was performed in a quiet, temperature-controlled, well-ventilated room. The demographic questionnaire was completed at least two days prior to the study start, and all participants were instructed to abstain from caffeine for 12 h prior to the procedure. Before EEG acquisition, each participant completed the Mini-Mental State Examination (MMSE) to exclude those with significant cognitive deficits, and Raven’s Standard Progressive Matrices (RSPM) were used to assess the intelligence quotient (IQ). Additionally, the self-rating scales Beck Depression Inventory–Second Edition (BDI-II) and Fatigue Severity Scale (FSS) were used to assess the severity of depression and fatigue symptoms in each subject in both groups.
Before recording EEG signals, participants were instructed to sit comfortably on
a wooden chair with a backrest and confirm the absence of any particular
discomfort with the environment to minimize the likelihood of abnormal EEG
activity. EEG signals were recorded through a flexible cap fitted with 64-channel
Ag/AgCl electrodes using an eegoTM amplifier (EE-224, ANT Neuro, Berlin,
Germany), and the electrode distribution was arranged based on the international
10/20 system. Online EEG signals were bandpass-filtered at 0.01‒100 Hz and
collected at a sampling rate of 500 Hz. During the recording of offline signals,
the AFz electrode served as the ground electrode, and the reference electrode was
positioned at CPz. The impedances of the electrodes were maintained below 5
k
The EEG signals were preprocessed using the EEGLAB toolbox (EEGLAB 13.0, https://sccn.ucsd.edu/eeglab). The bandpass filters of the data were set to 0.5 Hz for the
high-pass filter and 50 Hz for the low-pass filter, and a notch filter of 49–51
Hz was used to eliminate interference from the utility power (50 Hz). The offline
EEG data for all channels were re-referenced to the mean value of the bilateral
mastoids. Continuous resting-state signals were segmented into epochs of 2000
milliseconds. Visual inspection was performed to identify abnormal sensors with
uncorrectable artifacts (unusable channels). Each unusable channel was
spherically interpolated with circumjacent channels, and a 10% interpolated
ceiling (six channels) was conducted for each set of EEG data. Subsequently, eye
blinks, muscle signals, and other artifacts were removed using independent
component analysis (ICA) within EEGLAB. The range of extreme values were set to
Neural oscillations are an essential phenomenon in the field of neuroscience, serving as an imperative way to discern the neural processing mechanisms within the human brain [30]. Exploring neuro-electrophysiological synchronizations based on neural oscillations can effectively reveal the cognitive processing processes of individuals [31, 32]. Importantly, EEG functional connectivity can be constructed using instantaneous phase synchronization, which has been successfully used to distinguish individual changes in functional brain networks, regardless of potential amplitude fluctuations [29, 33, 34]. The PLV was introduced by Lachaux et al. [35] as a method to compute phase synchronization for EEG signals based on its excellent temporal resolution and distinguished characteristics that could reveal the correlation between different real time series, which has served extensively to investigate EEG functional networks under various conditions [36, 37]. The PLV was calculated using the following formula:
where N indicates the length of the EEG time series, and
In the present study, based on the predefined delta (1–3), theta (4–7), alpha (8–12), beta (13–30), and gamma (30–45) bands, the PLV was calculated separately to construct a functional network connectivity map by employing resting-state EEG signals of all channels for boxers and controls. Additionally, before calculating the PLV, the current source density (CSD) was calculated for each resting-state EEG dataset to minimize the interference of volume conduction and eliminate unveracious synchronous connectivity [38].
The significance of each functional component (network node) in the activities of functional brain networks is not equivalent; only a small number of nodes exhibit characteristics of a functional center in information processing. Nodal degree centrality is an appropriate measure for characterizing the functional center. It is defined as the overall weight of the network nodes connected to a specific node within the network [36, 39]. The weight is calculated using the PLVs and realized by the GRETNA toolbox (GRETNA 1.2, http://www.nitrc.org/projects/gretna/) in the present study. The network nodes were first ranked based on the values of nodal degree centrality, and the top 5% was determined as the primary weight for each participant. Then, the accumulated ranking weights were calculated for all the subjects in each group, and the top 10% was selected as the functional center for each specified frequency [36].
Graph theory-based analysis is a critical method for exploring the topological characteristics of EEG functional networks. This method can deepen our understanding of the interrelationship between the integration and segregation of functional neural clusters, offering a suitable approach to quantify differences in electrophysiological processes within the brain network [40, 41, 42]. The small-world architecture of the human brain, a pivotal feature of graph theory discovered in neuroscience research, is characterized by maintaining a balance between minimizing resource costs and maximizing information flow among network components, which can facilitate the efficient communication between network components [43, 44]. In the actual calculation process, the construction of the brain network depends on the functional connection matrix (the edge of the network) constructed with functional components as nodes. For the initial step of the present study, the PLV with specific connection values for each edge was used to construct the functional connection matrices (primary matrices) for predefined frequencies. Next, the binary matrices were realized based on the primary matrices by employing the network sparsity method. Network sparsity is defined as the ratio of the actual number of functional connections to the theoretically largest number of functional connections, serving as a threshold for the network sparsity. Eventually, a series of thresholds that start at 0.1 and end at 0.5 with a step size of 0.05 was adopted to construct the binary matrices and finally realize the functional networks. The analyses based on graph theory for all participants were calculated using the GRETNA toolbox [45]. The characteristic indicators include global efficiency, local efficiency, average clustering coefficient, average shortest path length, normalized clustering coefficient (gamma), normalized shortest path length (lambda), and sigma (the ratio of gamma to lambda) [41, 45].
The functional brain network can be constituted by large-scale functional connectivity constructed using the PLV matrices, and the comparison between different network connections involves corrections for multiple univariate significance tests. In the present study, the NBS method was employed to address the correction issues of multiple comparisons between networks. Derived from the calculated underpinnings of the cluster-based thresholding method for the statistical parametric map, and as a successful way to control the family-wise error rate (FWER) when multiple univariate tests are conducted for different networks [46], the NBS method is appropriate for the present research to identify the difference in functional network connectivity between boxers and controls.
GRETNA software was employed to realize the network matrix calculations and
facilitate analyses related to NBS. These analyses compared each pairwise
association of the connectivity matrices, testing the hypothesis of boxers
For the functional network-related NBS analysis, we conducted a bilateral
evaluation of the connectivity matrices for boxers
A total of 49 male participants were included in the present study, including 24 boxers and 25 matched healthy controls. The demographic and general characteristics of both groups are illustrated in Table 1. No significant differences were found in the distribution of age and education between the boxers and controls. For the neuropsychological assessments, no significant differences were noted in the MMSE and RSPM scores between the two populations, which suggests that the homogeneity of general cognitive functions and estimated IQ for both groups was suitable for classification and further analysis. In addition, the results of the BDI-II and FSS indicate that boxers exhibit levels of depression and fatigue symptoms comparable to those of the controls.
| Parameters | Boxers (n = 24) | Controls (n = 25) | p value |
| Age (yrs) | 20.63 |
20.84 |
0.603 |
| Participation time (yrs) | 5.04 |
—— | —— |
| Education (yrs) | 13.29 |
13.36 |
0.797 |
| Height (cm) | 178.71 |
176.60 |
0.115 |
| Weight (kg) | 74.71 |
71.52 |
0.374 |
| BMI | 23.24 |
22.92 |
0.738 |
| Gender (M/F) | 24/0 | 25/0 | —— |
| MMSE | 29.04 |
29.28 |
0.207 |
| BDI-II | 9.13 |
7.60 |
0.108 |
| FSS | 18.46 |
16.96 |
0.271 |
| RSPM | 86.46 |
87.40 |
0.665 |
Note: BDI-II, Beck Depression Inventory–Second Edition; BMI, body mass index; M, male; F, female; FSS, fatigue severity scale; MMSE, mini-mental state examination; RSPM, raven’s standard progressive matrices.
For the comparison of phase synchronization between boxers and controls, we constructed data matrices based on the average PLV values in each sensor on each frequency band for both groups, and the differences in the PLV connectivity matrices between the two populations (controls minus boxers) are displayed in Fig. 1. Fig. 1 illustrates an upward trend in the PLV synchronization between pairwise associations in the boxer group for most frequencies (delta, theta, beta, and gamma), particularly for the gamma frequency band. Notably, the results showed a comparable value of phase synchronization for the alpha frequency band. Furthermore, we compared the inter-hemispheric differences in PLV synchronization between boxers and controls. Fig. 2 shows the results of the analysis, which indicated an increasing trend in PLV values in the boxers across all five frequency bands in both hemispheres compared to the controls; however, the statistical results suggested that the difference was only significant in the left hemisphere of the gamma band with marginal significance in the left hemisphere of the theta band.
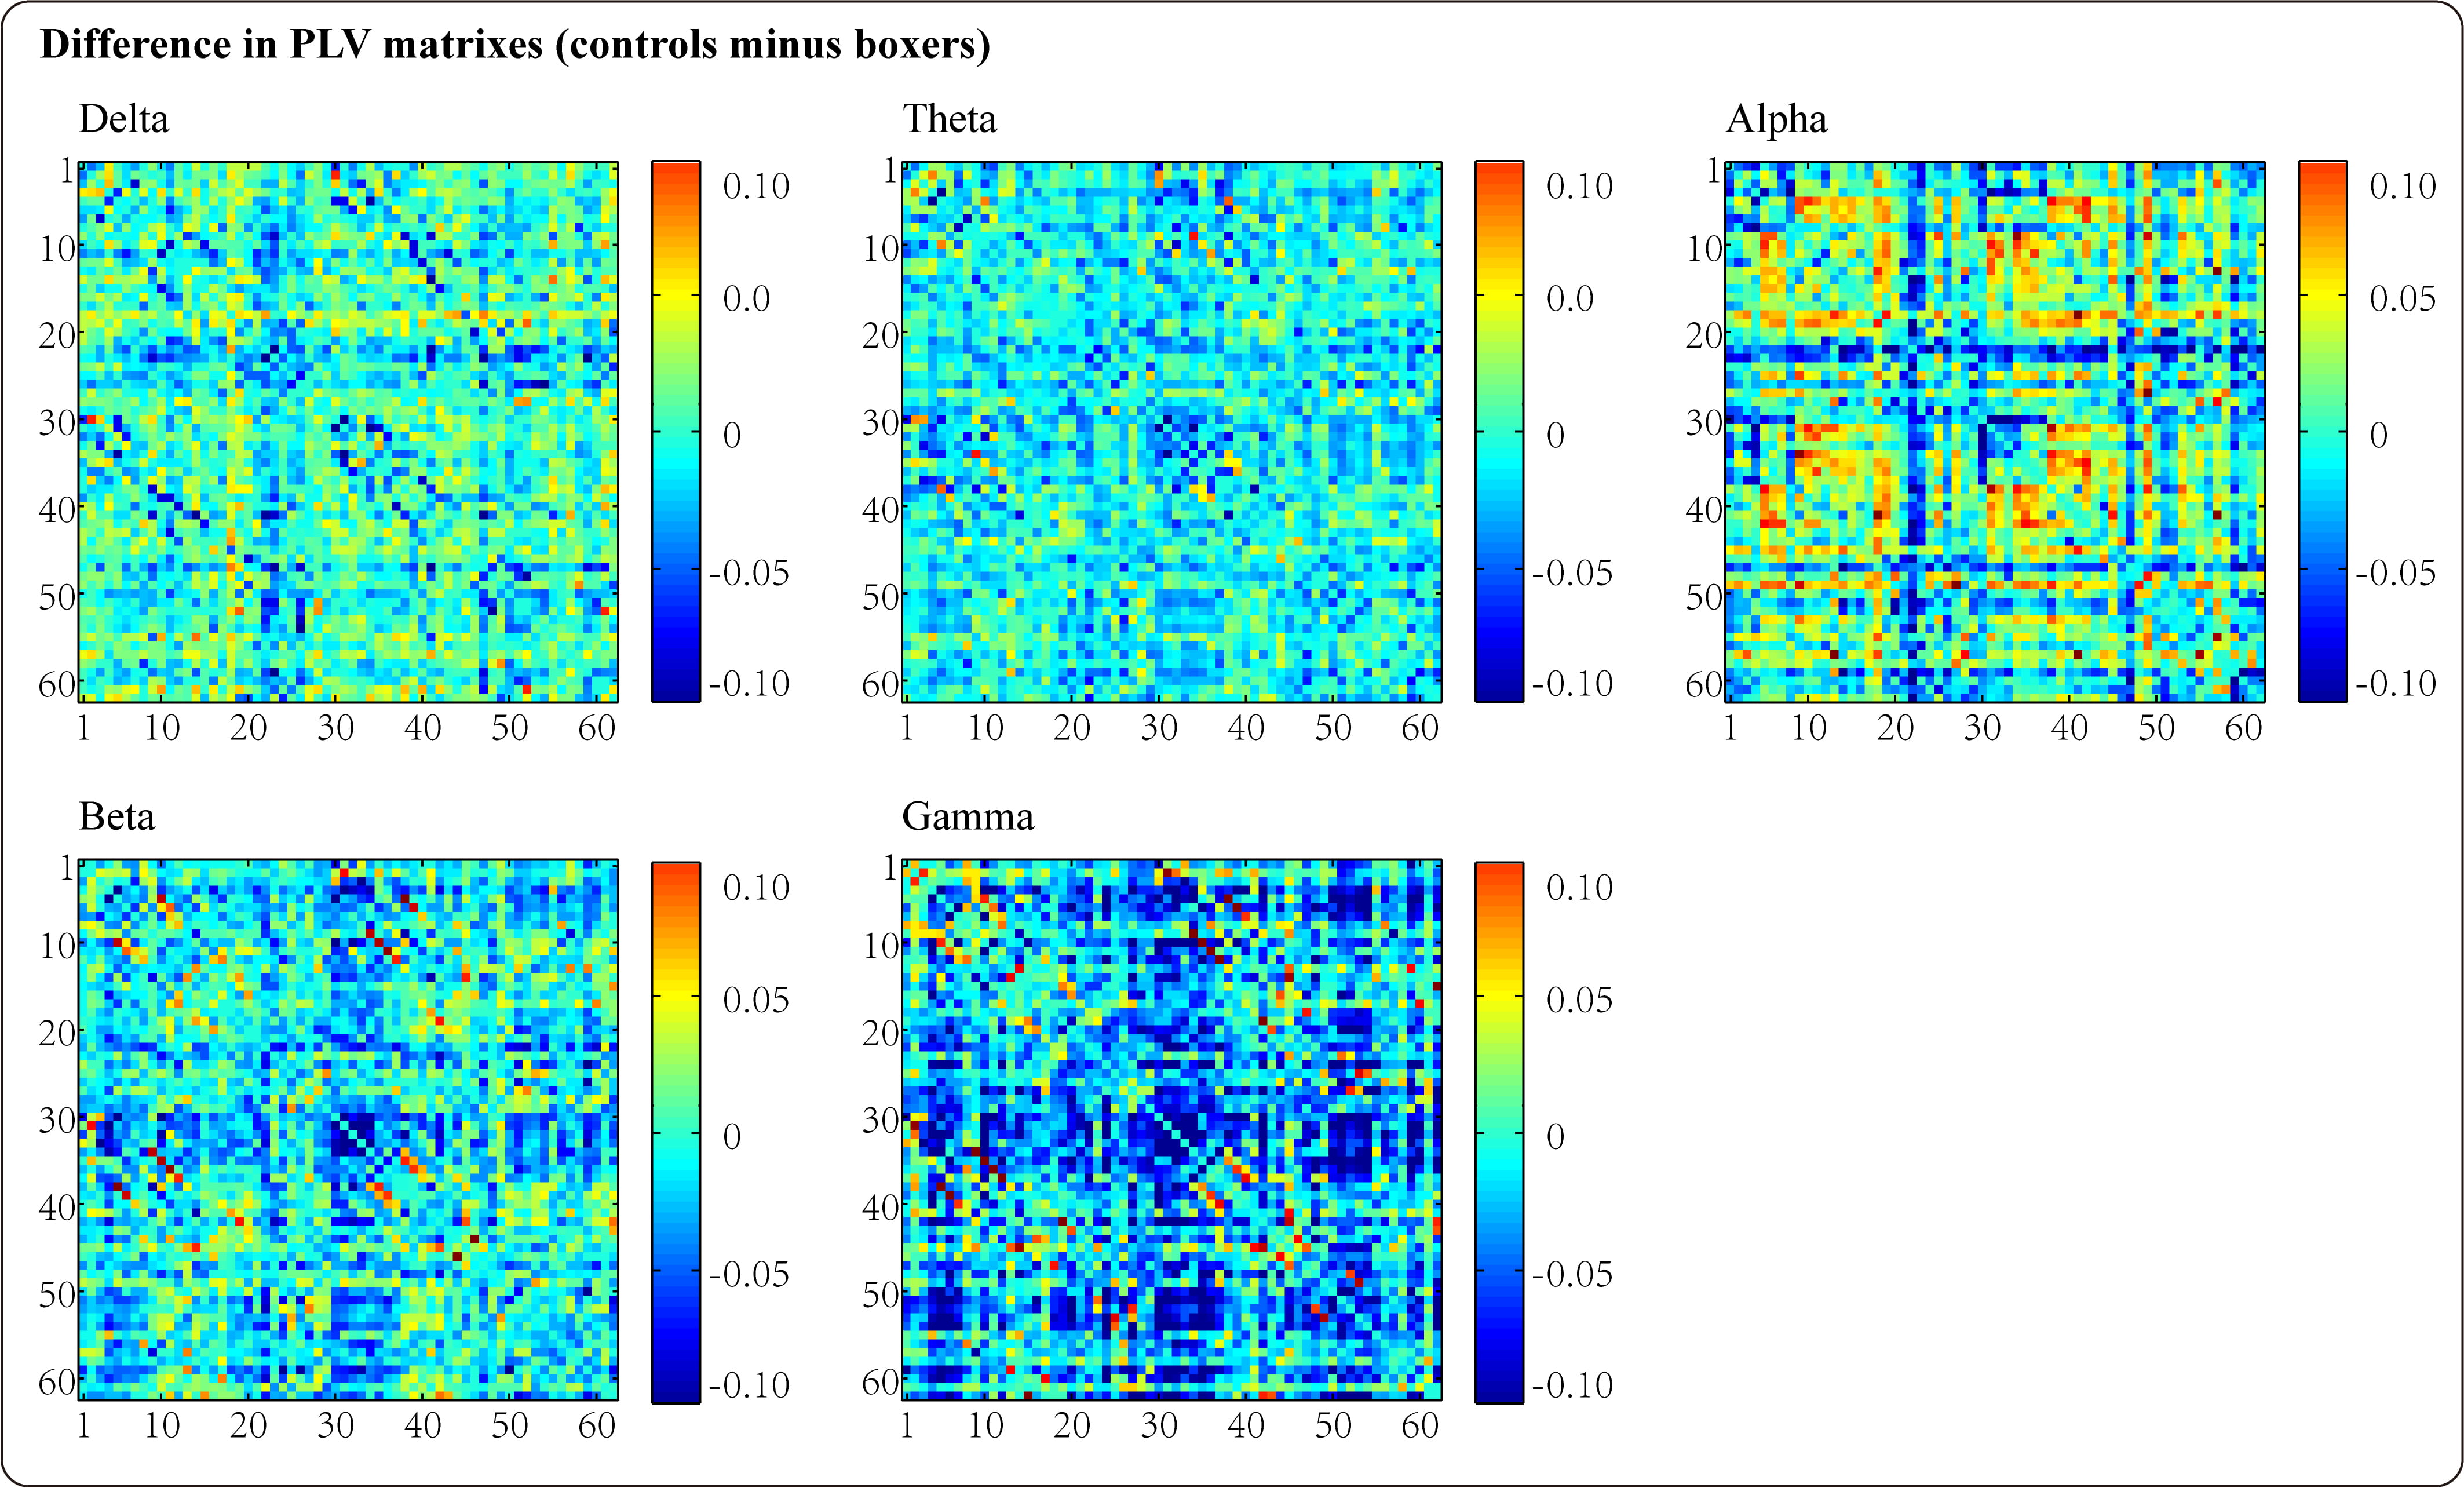 Fig. 1.
The differences of the phase locking value (PLV) connectivity matrixes between boxers and controls in delta, theta, alpha, beta, and gamma frequency bands (controls minus boxers).
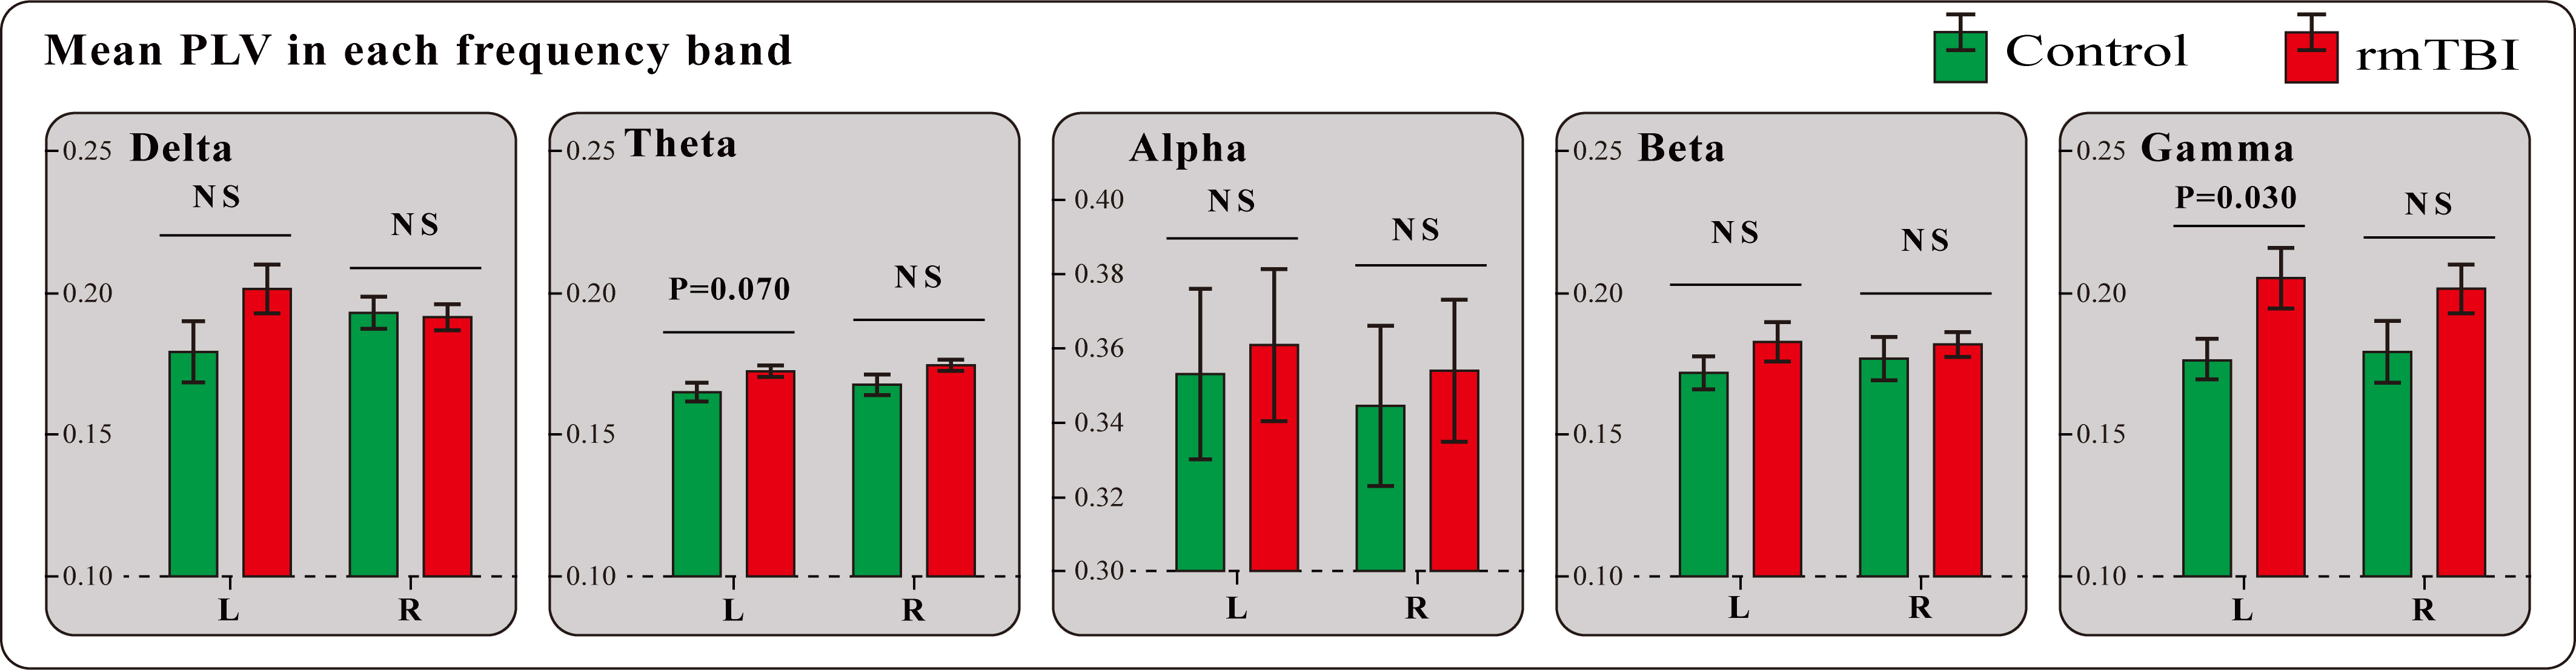 Fig. 2.
The inter-hemispheric differences in PLV synchronization between boxers and controls in each frequency band. Error bars represent the standard error. rmTBI, repetitive mild traumatic brain injury; NS, no significant difference.
Regarding the functional centrality results, the distributions of the functional centers that were calculated based on the nodal degree centrality for all five frequency bands are presented in Fig. 3. Although most of the functional centers were distributed in the parietooccipital regions of the brain in both populations, a noticeable difference was observed between the two groups. In comparison to the controls, the functional centers in boxers were distributed more proximally to the occipital region of the brain. In addition, some overlap was noted in the distribution of functional centers for each frequency band between the two populations; notably, the gamma frequency band showed the least amount of overlap, and the most pronounced difference between the two groups was observed in the gamma band. The functional centers of boxers tended to be distributed in the right parietal region, while in controls, they tended to cluster in the left temporal region. Furthermore, both groups demonstrated asymmetry in the distribution of functional centers, revealing striking differences between the two groups. Specifically, boxers’ functional centers were mainly located in the left hemisphere for the beta frequency band and in the right hemisphere for the gamma band, as compared with controls.
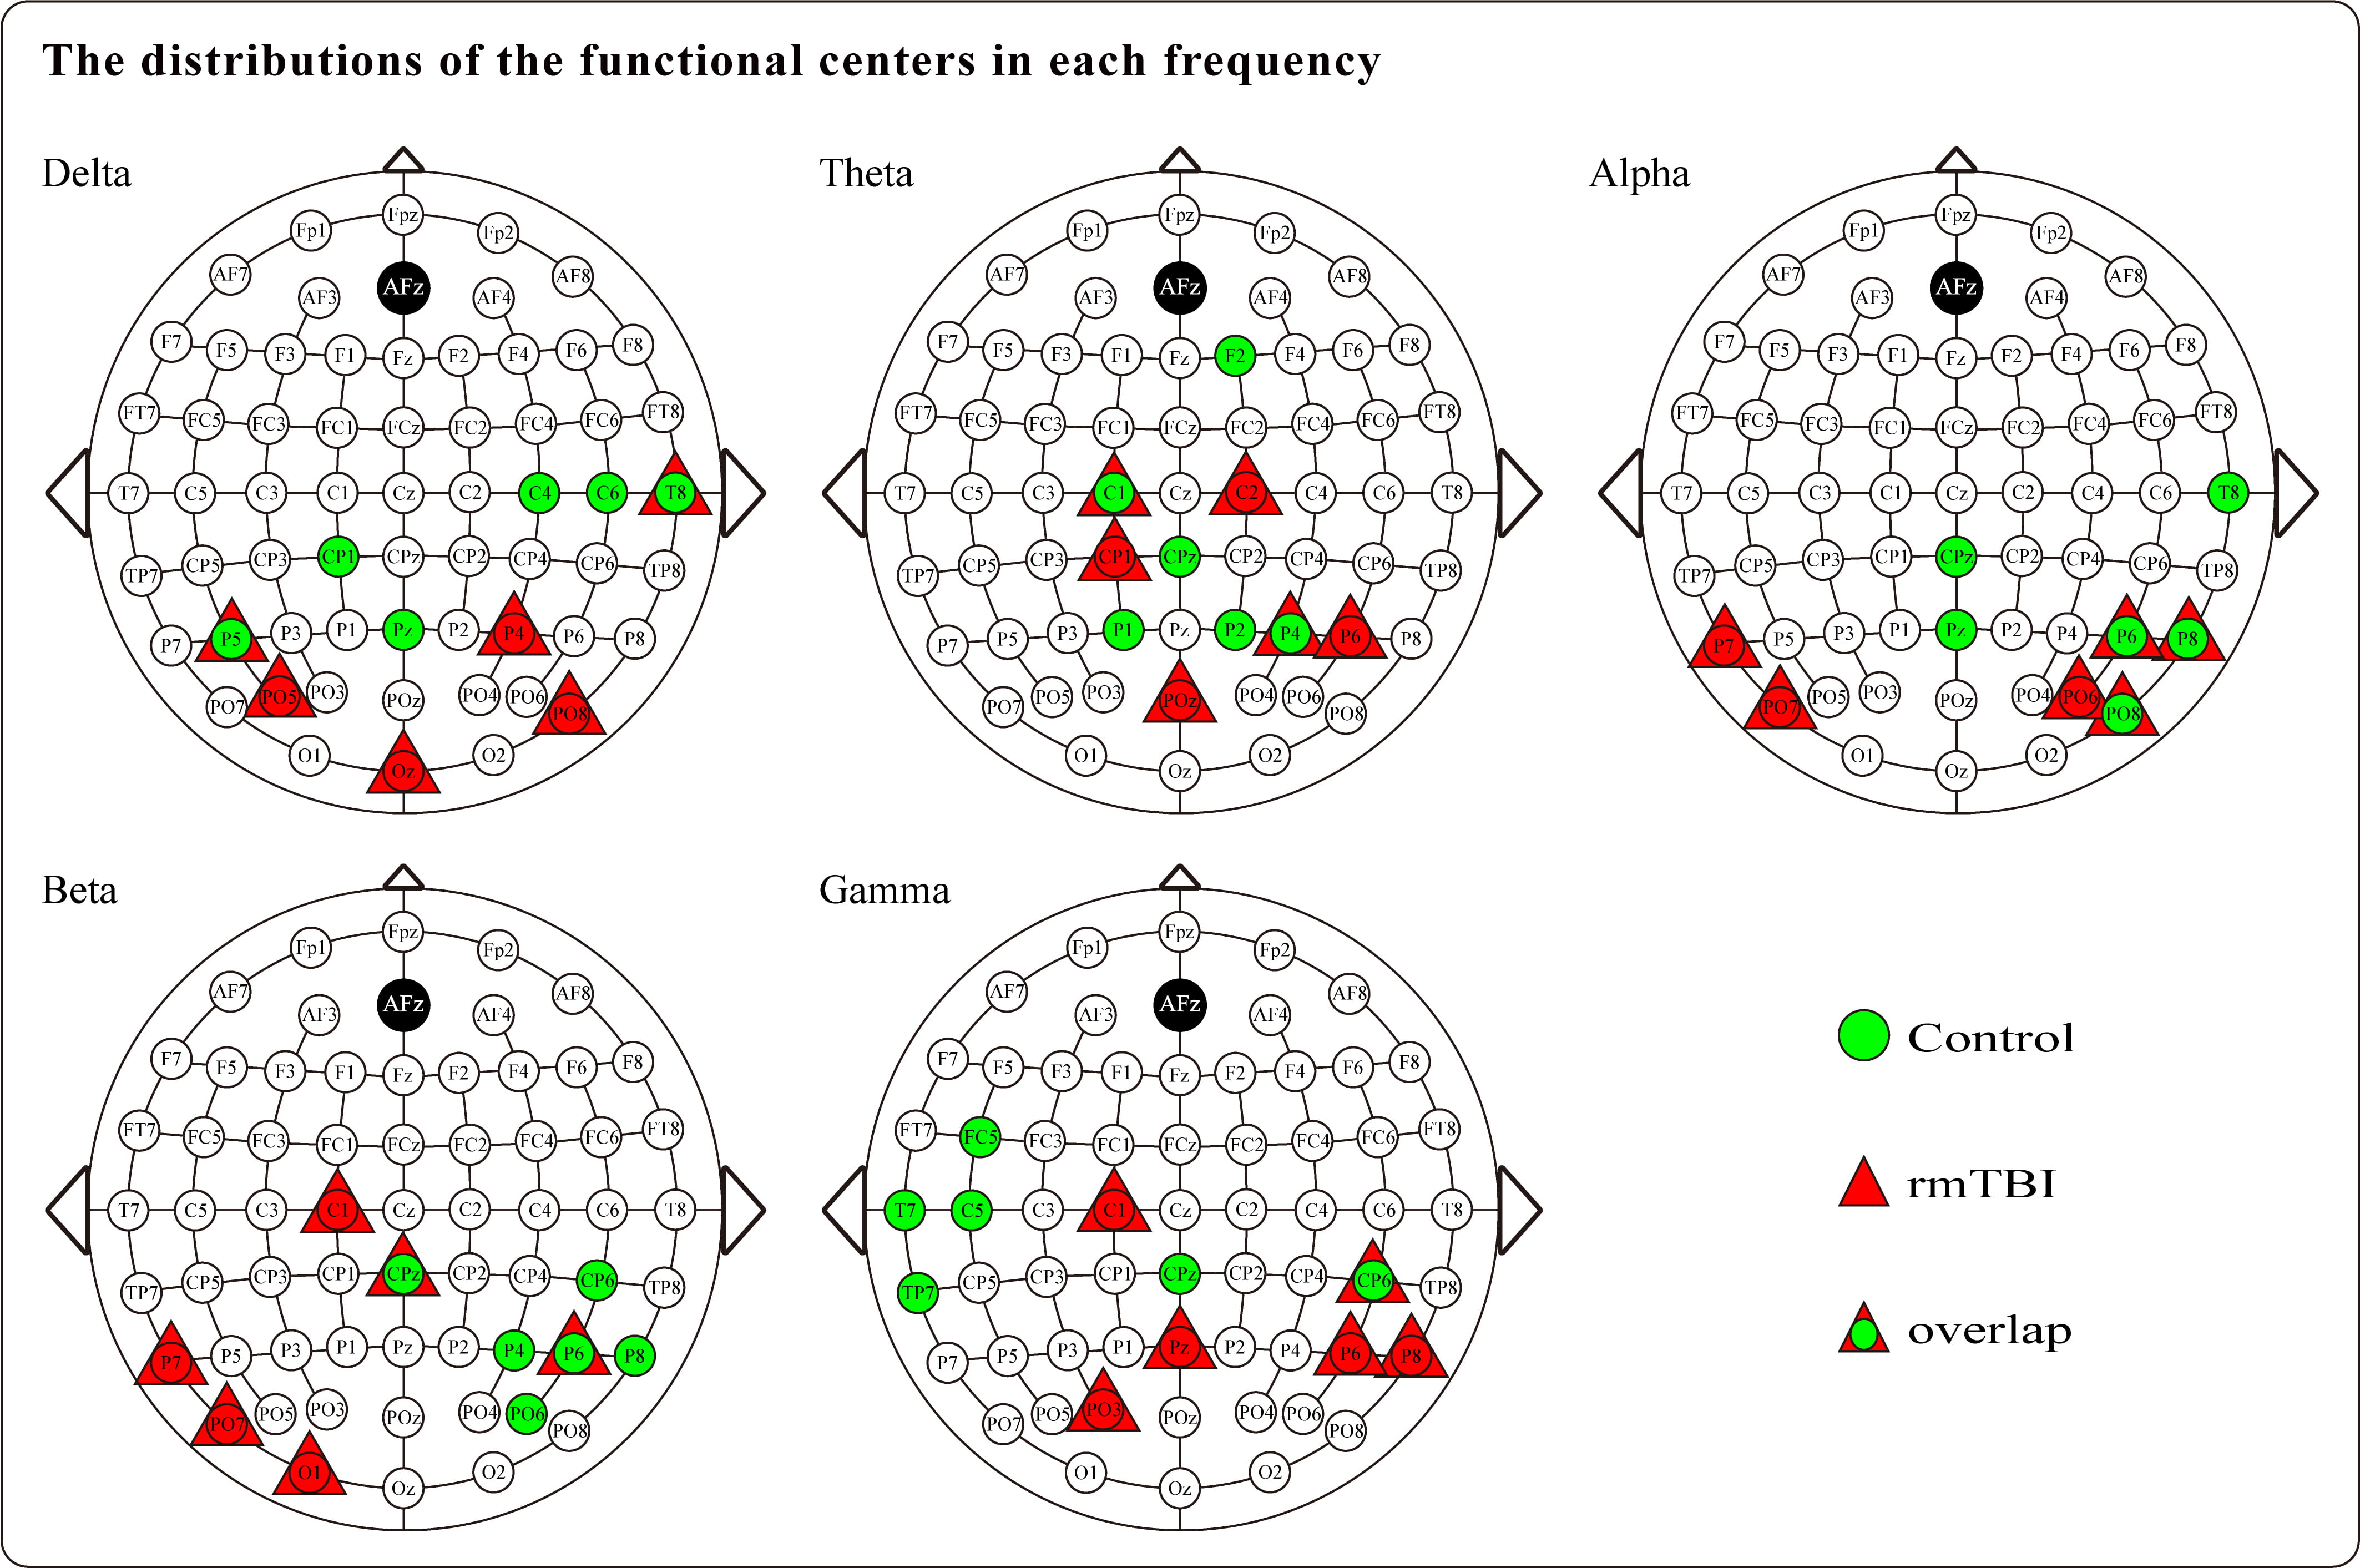 Fig. 3.
The distributions of the functional centers that calculated based on the nodal degree centrality for boxers and controls in each frequency band.
A functional network was constructed based on the calculated PLV matrices using the network sparsity method to analyze the targeted graph-theoretic characteristics for each frequency band. The comparative results of the topological measures are presented in Fig. 4. Regarding global efficiency, the boxers exhibited a significant reduction compared to controls for partial sparsity in the theta frequency band, while for local efficiency, the boxers exhibited a significant decrease compared to the controls in the beta and gamma frequency bands. For average clustering coefficients, the boxers showed a significant increase compared to the controls in the theta frequency band. Additionally, for the average shortest path length, the boxers exhibited a significant elongation compared to the controls within a certain sparsity range in the theta band.
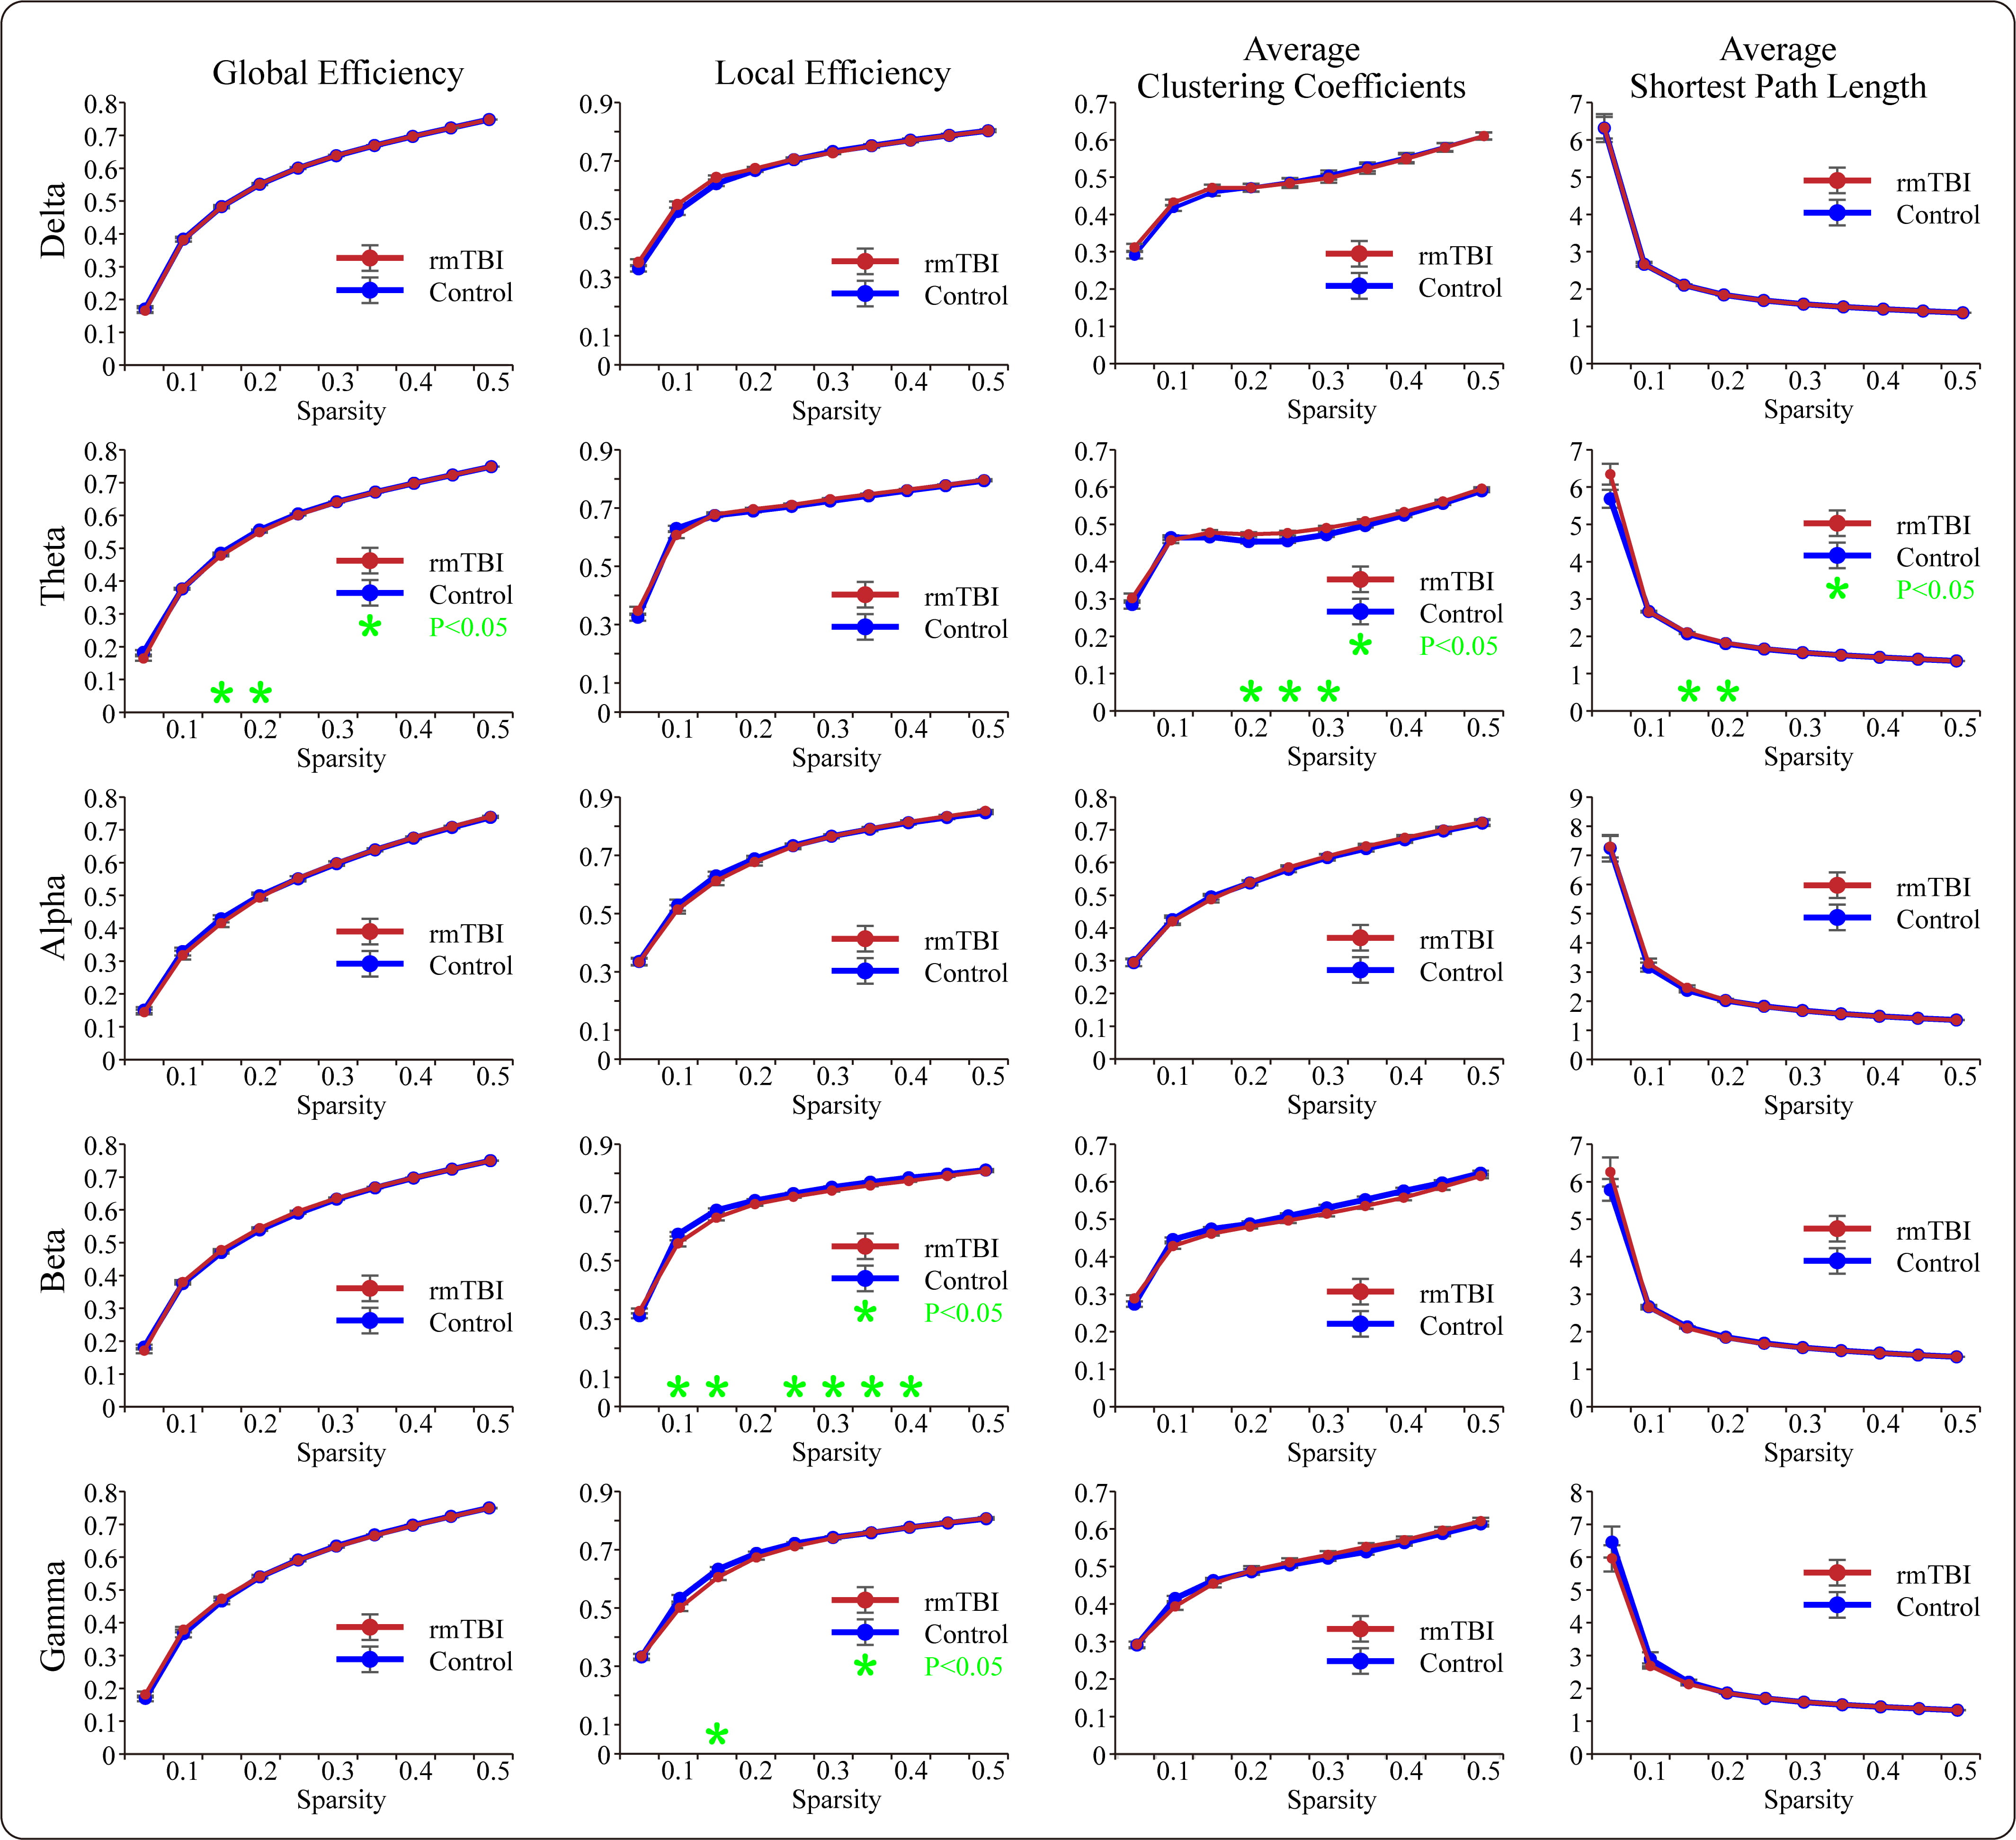 Fig. 4.
The comparisons of graph-theoretic parameters of the PLV-based
functional brain networks between boxers and controls in each frequency band.
The green asterisks suggest that the significant differences are found in
specific characteristic (*p
Furthermore, we explored the measures of small-world characteristics for the two
populations; the results are presented in Fig. 5. For the mean normalized
clustering coefficient gamma (
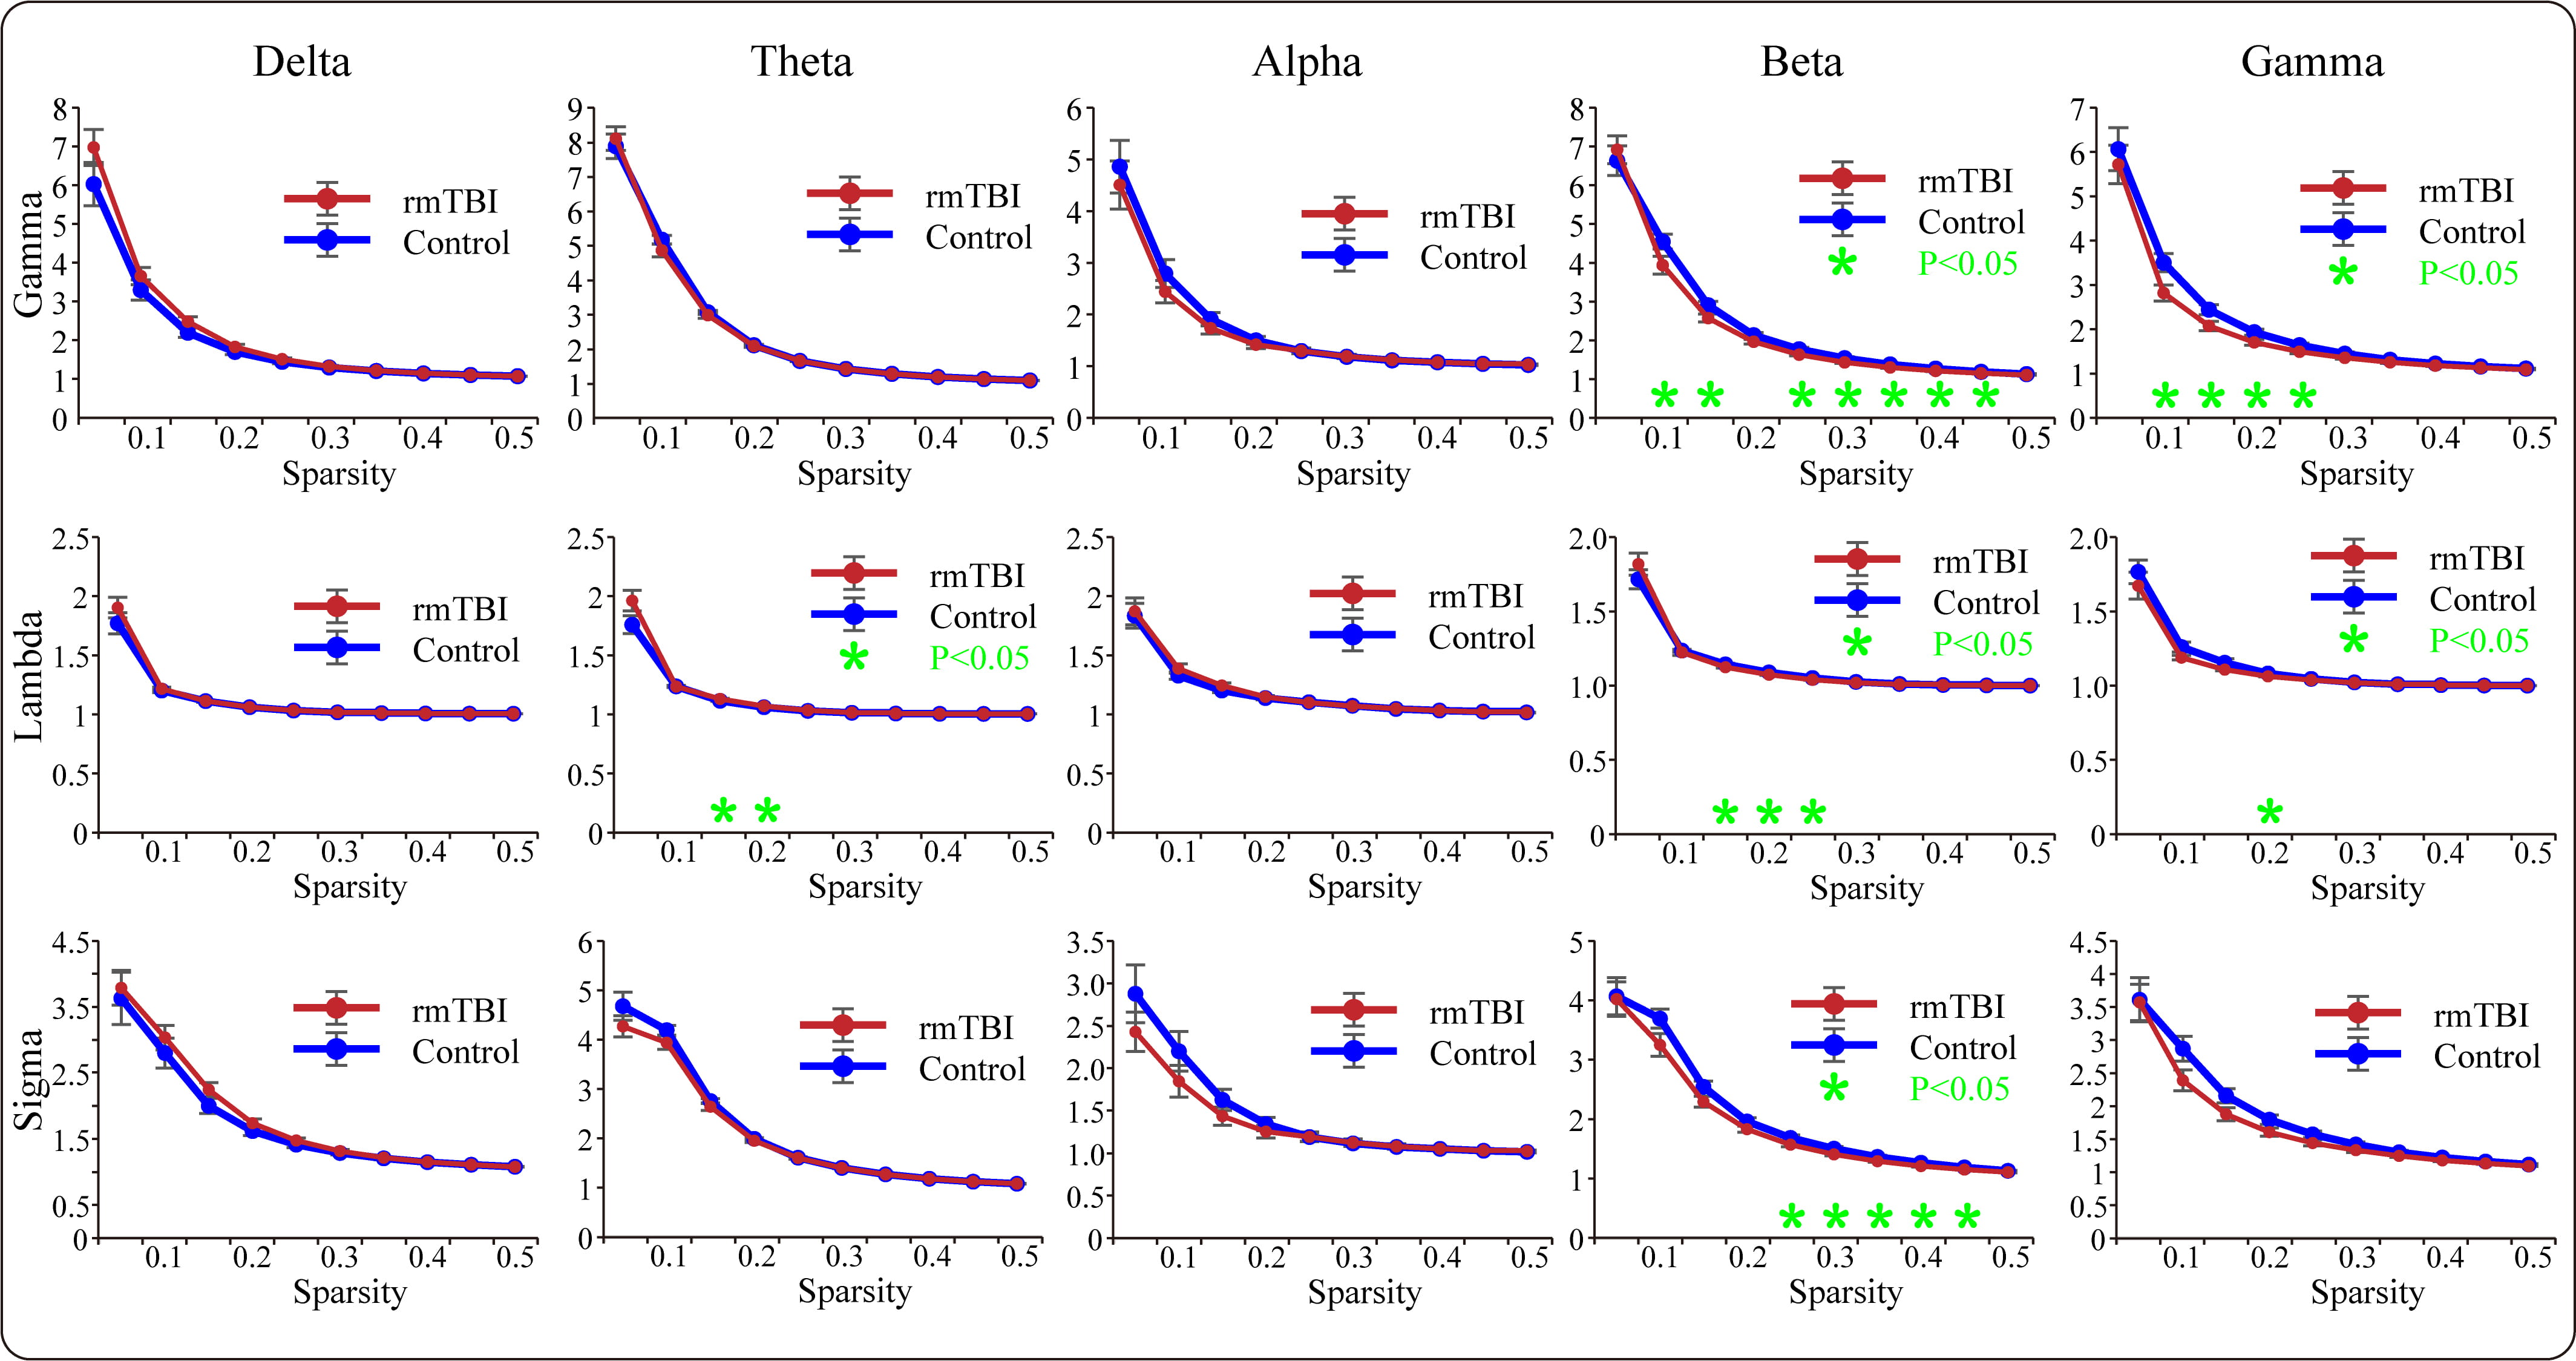 Fig. 5.
The comparisons of small-world characteristics of the PLV-based
functional brain networks between boxers and controls in each frequency band.
The green asterisks suggest that the significant differences are found in
specific characteristic (*p
By utilizing the NBS method within GRETNA software, we detected differences in
the functional network connectivity matrices between boxers and controls for each
frequency band, and the subnetworks with significant differences are presented in
Fig. 6. Although we conducted bilateral analyses of the network matrices for
boxers
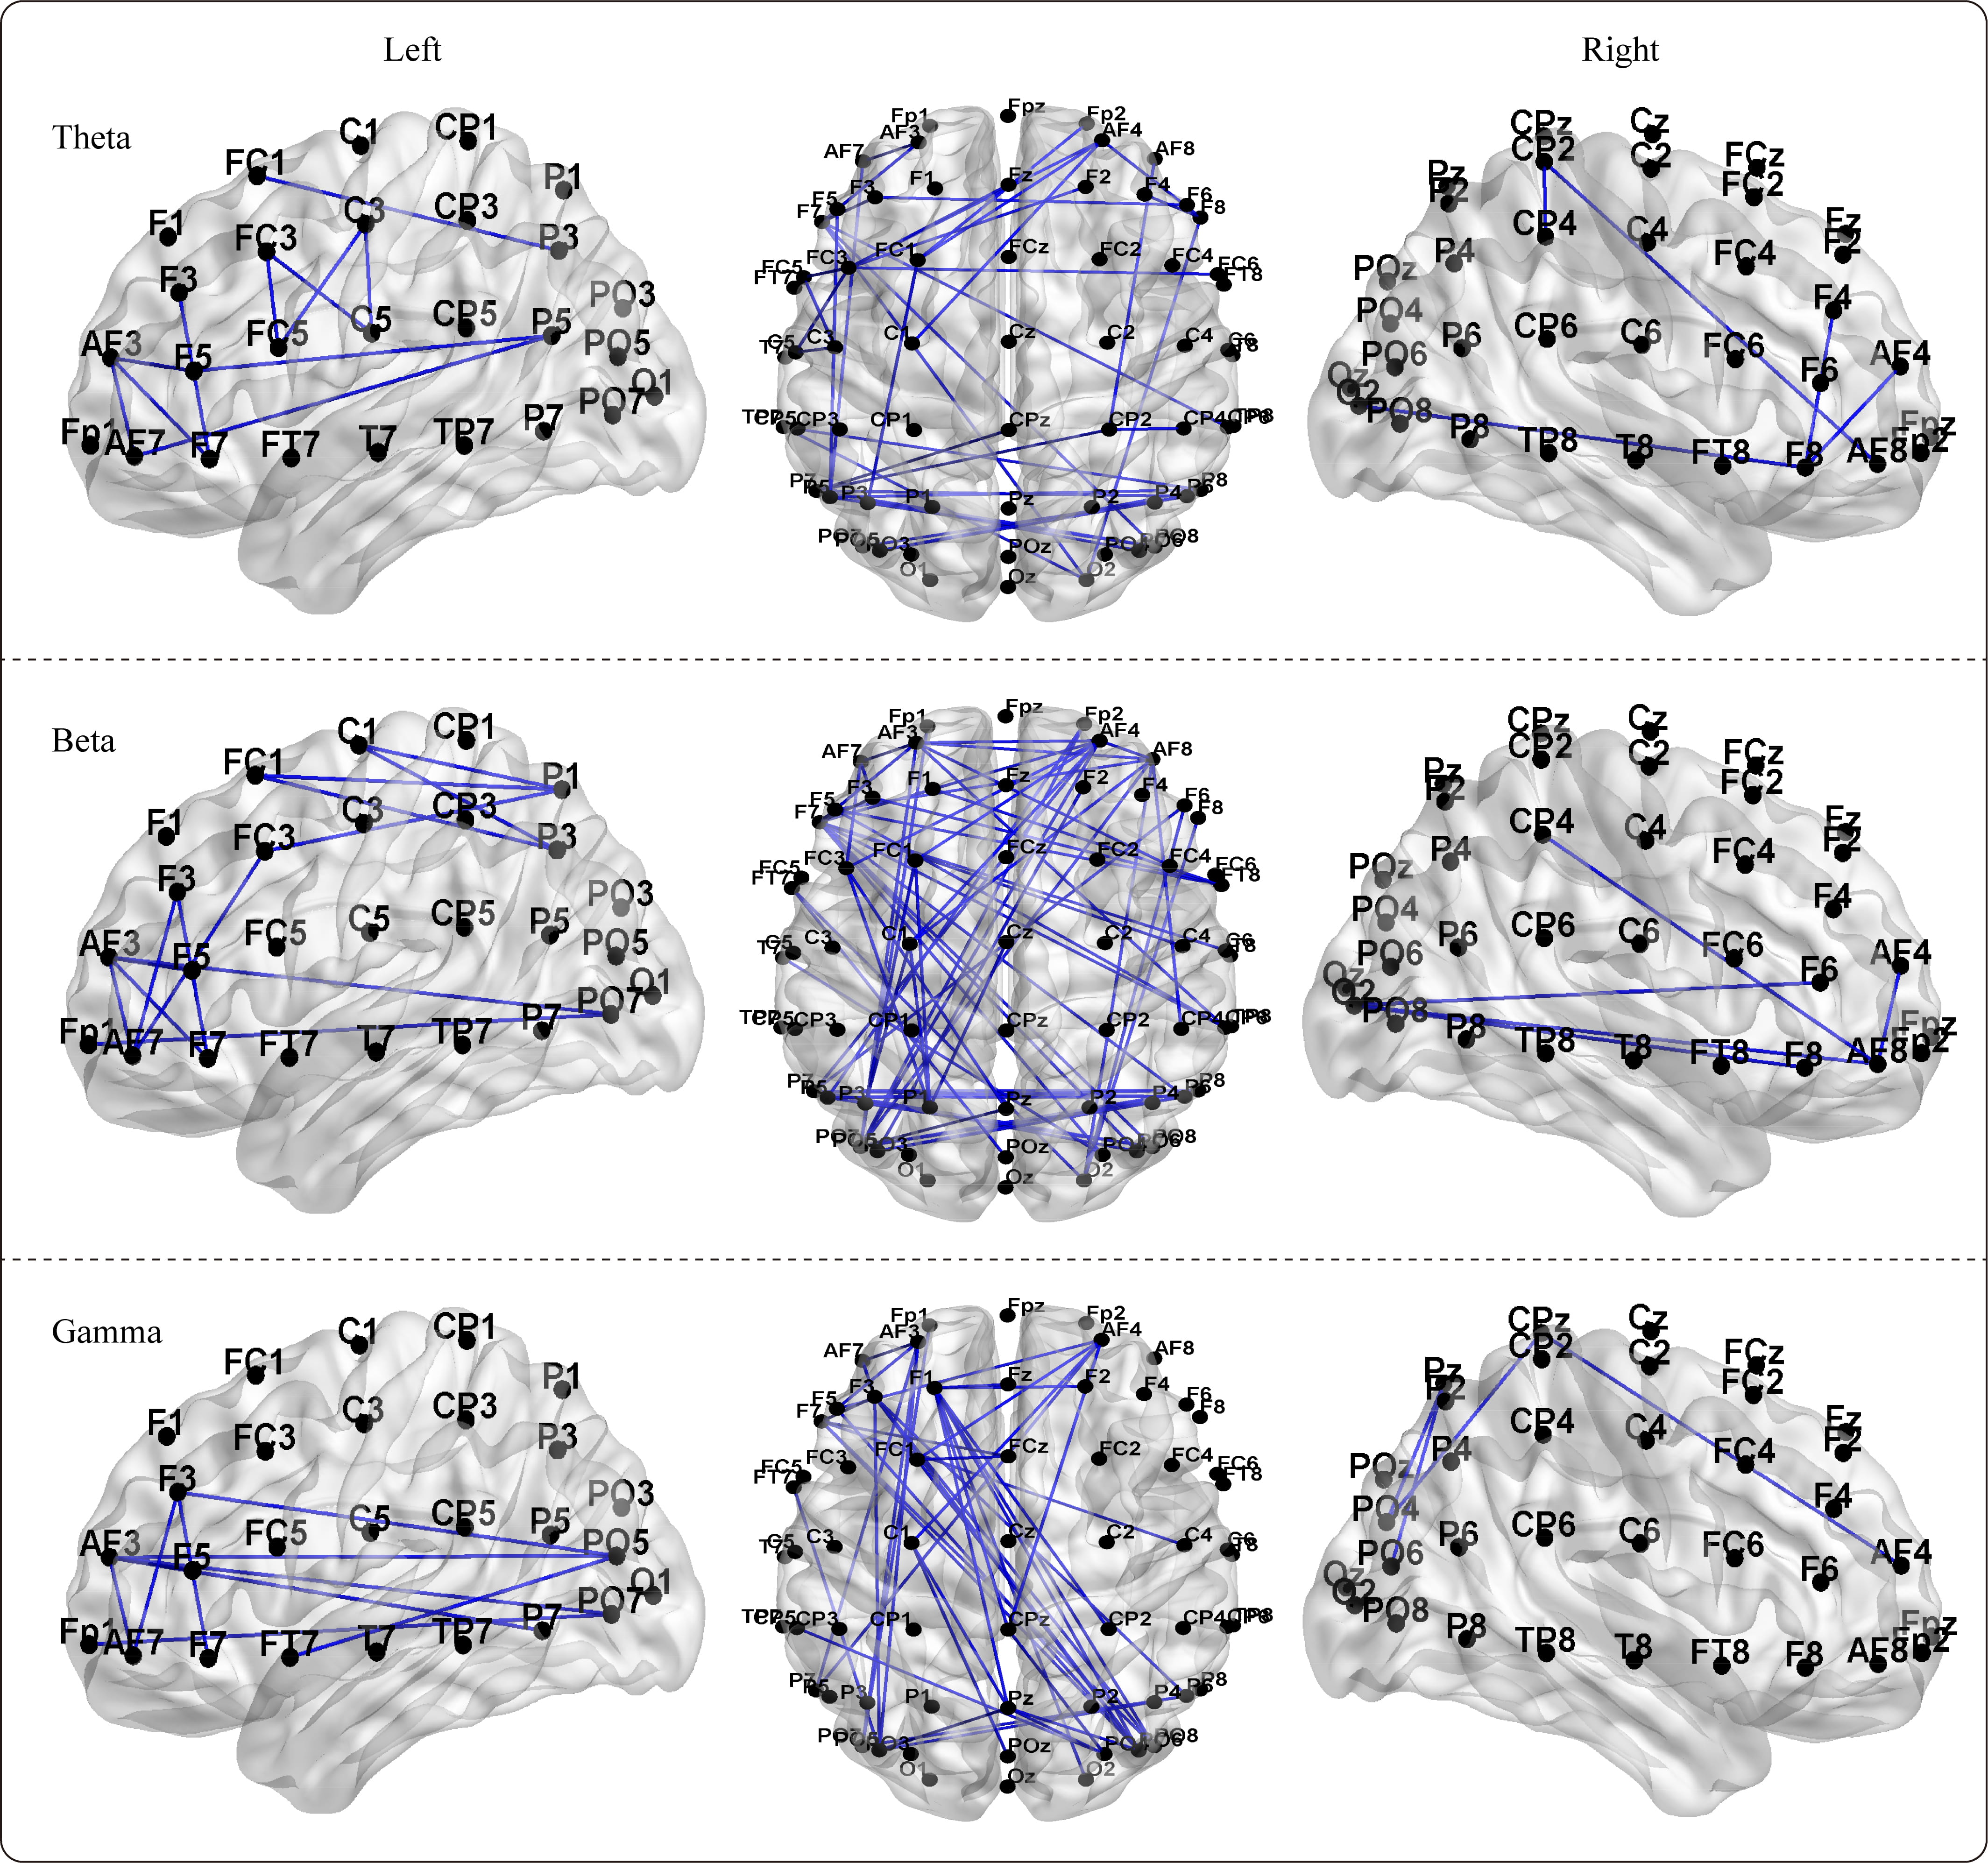 Fig. 6.
The significant differences of the NBS (network-based statistic)
-based functional brain networks between boxers and controls in theta, beta, and
gamma frequency bands. The significance subnetworks exhibit greater network
connectivity strength in boxers compared to controls (p
The initial aim of the present study was to evaluate the cumulative effect of
boxing-related rmTBI on PLV-based graph theory and functional network
architecture by employing resting-state EEG. Further, based on the calculated
connectivity matrices of PLV synchronization and related methods, this study
investigated the abnormalities in the distribution of functional hubs,
graph-theoretic characteristics, and functional network connectivity for boxers
in each frequency band. This exploratory investigation indicated that despite
showing comparable neuropsychological performance, boxers exhibited an increasing
trend in PLV synchronization across most frequencies compared to controls,
especially for the left hemisphere of the gamma frequency band. Striking
differences were found in the distribution of functional centers between boxers
and controls, particularly for the gamma frequency band. In the graph-theoretic
analysis, compared with controls, boxers exhibited attenuated nodal network
metrics and decreased small-world measures in the theta, beta, and gamma
frequency bands, suggesting that functional network efficiency and small-world
characteristics within specific frequency bands were significantly weakened in
boxers. For the functional brain network, by employing the NBS test framework,
the analysis demonstrated that significant differences in functional connectivity
between the two populations existed only in the contrast of boxers
The functional centrality represented by the functional centers is considered a pivotal characteristic within an interconnected network system, and serves as the integration hub of information flow in a specific functional brain network [48, 49]. Based on this characteristic, aberrant configurations of the functional centers would significantly affect related functional components that connect with it and would have extensive impacts on the functionality of the global network. Thus, the present study investigated the distributions of functional centers calculated by PLV-derived nodal degree centrality to characterize the network centrality for the boxer population and found that, compared with controls, boxers’ functional centers were distributed more closely to the occipital regions in all five frequency bands. Further the inter-hemispheric distribution of functional centers between the two populations showed striking differences in the beta and gamma frequency bands. Previous studies have demonstrated that the aberrant distribution of functional centers could negatively affect the efficient operation of brain network functions [39] and significantly weaken the cognitive processing of patients with TBI [49]. Therefore, the altered configuration of functional centers and specific distribution within certain frequency bands may provide insights into the neuro-electrophysiological consequences of rmTBI and inform potential pathophysiological indicators for clinical practice.
The dynamic functional connectivity of neural information flow in the brain exhibits the characteristic properties of small-world network organization, which presents an appropriate balance between functional segregation (local clustering connectivity among contiguous nodes denotes regional specialization) and functional integration (short path lengths among all nodes within the brain denote global integration) [50, 51]. Small-world architecture contributes to a systematic organization that can ensure efficient operation and economical communication at both regional and global levels of the functional brain network [43], and graph-theoretical measures could be considered an effective method to realize the small-world-related topological characteristics of resting-state brain networks [52, 53]. In fact, anomalous changes in graph-theoretical parameters have been detected in multiple conditions, which in turn affect neurological functions and cognitive processing for those affected [36, 53, 54, 55]. The results of the present study demonstrated that, compared with controls, boxers showed degenerated nodal network metrics and small-world measures in specific frequency bands, which may contribute to the negative effects of boxing-related rmTBI on cognitive processing.
The properties of global efficiency and local efficiency give rise to a
measurable organization with systematic intercommunication at both global and
local levels. The average shortest path length characterizes the optimal distance
consumption of a given information transmission system between different
functional nodes in the network. Thus, the combination of the aforementioned
indicators can effectively represent the transmission efficiency of neural
signals in the resting-state functional network [40, 41, 53]. In the present
study, the strikingly weakened changes in global and local efficiency combined
with prolonged average shortest path lengths demonstrated that the functional
network of the boxers was attenuated with high-consumption resting-state
functional connectivity. Consequently, the capability of neural signal
transmission and information processing would be degenerated at both global and
regional scales in the functional network of the boxing population.
Correspondingly, the significant reduction in functional network efficiency for
information transmission represented by the topological measurement parameters
was in line with the long-term functional consequences of graph-theoretical
analyses in individuals with mTBI [44] and the changes in the chronic phase for
individuals with more severe conditions [56]. Numerous studies have demonstrated
that the effects of mTBI can lead to a significant impairment in cognitive
processing capacity [4, 23, 28, 57]. Pertinently, as a distinctive type of mTBI,
rmTBI could give rise to cumulative effects of brain injury, which would
contribute to salient deterioration of cognitive function and senile-like neural
degeneration [10, 57, 58, 59]. In contrast, our results have demonstrated that the
resting-state network based on calculated PLV matrices for both two populations
exhibited small-world characteristics in each included frequency band; however,
some crucial small-world parameters of functional networks, including the
diminished mean normalized clustering coefficient
In a comparison of two intricate functional brain networks, no single edge or connection with significant differences could be explained independently. Instead, only the significant edges or connections that were detected and interconnected to construct an integrated subnetwork or a collective subcomponent could be explained scientifically. Fortunately, NBS has been shown to be an appropriate statistical approach to address the FWER issue for the comparison between different functional networks and to realize an interconnected and statistically significant subnetwork [46]. Based on the NBS approach, our analyses revealed that the boxers showed strikingly enhanced connectivity strength for the significance subnetworks compared to controls, and the consequences of enhanced functional network connectivity were demonstrated by previous studies in patients with mTBI and more serious conditions [26, 62]. In addition, the hyperconnectivity of the functional network in patients with mTBI was corroborated by findings of fMRI-based NBS analysis and resting-state magnetoencephalography studies [27, 63]. Pertinently, previous studies have revealed that mTBI could lead to diffuse damage to the white matter axonal fibers of the brain [64, 65], and identical damage to the white matter tracts has been detected in the brain of patients with boxing-related rmTBI [66, 67, 68]. This finding was confirmed to be associated with the enhancement of aggressive behaviors and anger dyscontrol [69, 70]. Additionally, this was consistent with the professional characteristics of boxing. Thus, the hyperconnectivity of functional networks may be regarded as a compensatory mechanism against the disruption of white matter structural integrity in individuals with rmTBI [27]. Moreover, the present study suggests that the significantly enhanced subnetworks of the boxer population were not symmetrically distributed. Instead, the hyperconnected subnetworks were dominated by the left hemisphere, and long-range connections were predominant, which is in line with the conclusions of previous research on individuals with mTBI [63]. The optimal performance of brain functions depends on the orchestrated operation of local and long-range functional areas by interconnected network components. This interplay can form a cohesive cognitive function and modulate the execution of an individual’s behavior [71]. The presence of asymmetrically hyperconnected subnetworks suggest that the optimized organization of integration and segregation for the functional brain networks was disarranged, negatively impacting the efficient communication of neural information in boxers. Furthermore, because an overwhelming majority of boxers are right-hand dominant, greater exposure to repeated head impacts on the left hemisphere may contribute to the asymmetry of the hyperconnected subnetworks to a certain extent [72].
The NBS analyses indicated that the boxers had greater connectivity strength for the significance subnetworks than did the controls in the theta, beta, and gamma frequency bands, especially the beta band. Specifically, the beta frequency band has been confirmed by previous studies to mainly originate from the cortical areas, basal ganglia, and cortico-basal ganglia network composed of interconnected white matter tracks [73, 74]. Moreover, the cortical areas and white matter microstructure of the brain are vulnerable and sensitive to the damage caused by both mTBI and rmTBI [67, 68, 75]. Therefore, we can conclude that the damage to the white matter tracks within cortico-basal ganglia network caused by rmTBI is the critical reason for the significant impact on beta frequency activities in this study, and significant enhancement of functional networks based on beta frequency oscillations may be a vital network characteristic of individuals with rmTBI. Cognitive functions represented by beta frequency oscillations had been demonstrated to be mainly involved in working memory and executive control [73, 76]. Meanwhile, our previous study confirmed that abnormal working memory retrieval processing caused by boxing-related rmTBI was significantly related to beta frequency activity [57]. Importantly, studies have shown that the significantly enhanced functional connectivity in the beta frequency band was also a crucial oscillatory feature of Parkinson’s disease [77, 78]. This underscores a potential causal relationship between boxing and Parkinson’s disease [11, 79]. Consequently, the current study confirmed the degenerative neurophysiological effects of boxing-related rmTBI on sufferers from the perspective of EEG functional networks, and this effect may potentially affect the sufferers’ cognitive function and long-term outcomes.
This study has some limitations. First, the spatial resolution provided by the 62-channel non-invasive resting-state EEG was limited; although the CSD method was employed to minimize the related interference, the combination of structural image of fMRI in future research may effectively deal with this issue. Second, the precise quantification of boxing-related rmTBI in individual boxers was deficient in this study, and insufficient quantification may attenuate the accumulated effects of boxing-related rmTBI to some extent, even though the years of engagement in boxing applied in this work were perceived as a general measure of injury in studies of the same population [72, 80]. Third, this study lacks diverse markers (e.g., blood biomarkers) that supporting the presence of neurodegenerative damage in boxers, which are critical for establishing causal associations between distinguished functional network and effects of rmTBI. Finally, the present study failed to include different populations with rmTBI, and the impacts on functional brain networks found in this study can only be attributed to the cumulative effects of boxing-related rmTBI, therefore, the interpretation and clinical application of the effects within the present study should be approached with caution, and we look forward to conducting studies using present method in diverse populations with rmTBI (e.g., football or rugby players) and patients with neurodegenerative diseases to confirm our conclusions. Hence, future studies should consider these limitations when conducting in-depth explorations of the correlations between boxing-related rmTBI and resting-state functional brain networks.
We used whole-brain resting-state EEG and innovatively investigated the cumulative effects of boxing-related rmTBI on PLV synchronization, graph-theoretic characteristics, and NBS-based functional networks in boxers in five frequency bands. We found that, compared to controls, the boxers exhibited an increasing trend in PLV synchronization and notable differences in the distribution of functional centers. Moreover, attenuated graph-theoretic metrics indicated that the boxers had significantly weakened functional network efficiency and small-world characteristics in specific frequency bands. Importantly, the hyperconnectivity and asymmetric distribution of the NBS-based subnetworks suggested that the information processing and optimal configuration of integration and segregation of the functional brain networks were disrupted in boxers. This may negatively affect the efficient communication and dynamic operation of neural information in the brains of boxers with rmTBI. Consequently, the distinctive graph-theoretic consequences and aberrant processing patterns of the resting-state functional network resulting from the cumulative effects of repeated brain impacts may serve as electrophysiological characteristics of patients with rmTBI.
BDI-II, Beck Depression Inventory–Second Edition; CT, computed tomography; EEG, electroencephalography; fMRI, functional magnetic resonance imaging; FSS, fatigue severity scale; MMSE, mini-mental state examination; MRI, magnetic resonance imaging; mTBI, mild traumatic brain injury; NBS, network-based statistic; PLV, phase-locking value; rmTBI, repetitive mild traumatic brain injury.
The datasets used and analyzed during the current study are available from the corresponding author on reasonable request.
SKW, JS, GZX, DKZ and FZ designed the research study. SKW, ZHF and SCW performed the research. SKW and SCW analyzed the EEG data. DKZ and WZQ provided help in improving the processing code. SKW and ZHF wrote the manuscript. All authors contributed to editorial changes in the manuscript. All authors read and approved the final manuscript. All authors have participated sufficiently in the work and agreed to be accountable for all aspects of the work.
The research protocol was approved by the Ethical Committee of the General Hospital of Chinese PLA Central Theater Command (Wuhan School of Clinical Medicine, Southern Medical University, China) (approved number: [2020]041-1). All participants provided informed consent prior to the procedure.
We thank the Department of Psychology, southern medical university, and the authors would like to express our gratitude to Wuhan Sports University and Prof Jun Tu for contributions to participant recruitment.
This research was supported by the doctoral startup fund of the second affiliated hospital of Fujian medical university (BS202316), and the Chinese PLA technology innovation project (CLB18J042).
The authors declare no conflict of interest.
References
Publisher’s Note: IMR Press stays neutral with regard to jurisdictional claims in published maps and institutional affiliations.