
- Academic Editor
Objective: The alterations of the functional network (FN) in
anti-N-methyl-Daspartate receptor (NMDAR) encephalitis have been recognized by
functional magnetic resonance imaging studies. However, few studies using the
electroencephalogram (EEG) have been performed to explore the possible FN changes
in anti-NMDAR encephalitis. In this study, the aim was to explore any FN changes
in patients with anti-NMDAR encephalitis. Methods: Twenty-nine
anti-NMDAR encephalitis patients and 29 age- and gender-matched healthy controls
(HC) were assessed using 19-channel EEG examination. For each participant, five
10-second epochs of resting state EEG with eyes closed were extracted. The
cortical source signals of 84 Brodmann areas were calculated using the exact low
resolution brain electromagnetic tomography (eLORETA) inverse solution by
LORETA-KEY. Phase Lag Index (PLI) matrices were then obtained and graph and
relative band power (RBP) analyses were performed. Results: Compared
with healthy controls, functional connectivity (FC) in the delta, theta, beta 1
and beta 2 bands significantly increased within the 84 cortical source signals of
anti-NMDAR encephalitis patients (p
Anti-N-methyl-Daspartate receptor (NMDAR) encephalitis is the most common type of autoimmune encephalitis (AIE) primarily occurring in women [1, 2] and features prominent neuropsychiatric symptoms and cognitive deficits [2, 3]. The pathogenesis of this disease involves the appearance of antibodies against the Glutamate receptor ionotropic 1 (GluN1) subunit of the NMDAR, the main excitatory receptors in the central nervous system and that have an impact on the normal function of the central nervous system [4, 5]. Many patients with anti-NMDAR encephalitis show a normal structure Magnetic Resonance Imaging (MRI) pattern, however, the formidable brain functional connectivity (FC) of these patients changed. This included decreased hippocampal FC, dissociation of the medial temporal and the default-mode network FC and changed large-scale network FC [6]. The latest studies using functional MRI have identified that these changes in FC are correlated with neuropsychiatric pathology or cognitive variables [7, 8]. They support the notion that the functional network (FN) in anti-NMDAR encephalitis patients are indeed changed. However, few studies using electroencephalogram (EEG) have been performed to explore the possible FN changes in anti-NMDAR encephalitis.
Previous studies have found that the EEG of anti-NMDAR encephalitis patients exhibits extreme delta brush [9]. However, this is found only in a small part of anti-NMDAR encephalitis patients [10]. Besides extreme delta brush, in clinical practice, slowing background rhythms overlaying beta activity are commonly found in these patients [10, 11]. Such EEG changes may be related to clinical traits and treatment responses [11]. Resting-state EEG is a non-invasive neurophysiological technique with a high (millisecond) temporal resolution, mainly used to monitor electrical activity and identify rapidly changing patterns of brain activity [12]. Some studies have found that quantitative EEG analysis of slow waves may be correlated with neural plasticity [13] and can be employed as a prediction tool in suspected anti-NMDAR encephalitis [14]. Additionally, increased delta and theta FC and decreased alpha FC has been found in AIE patients in a previous study by the current authors [15]. Therefore, it is biologically meaningful to explore more characteristic changes in anti-NMDAR encephalitis using EEG analysis methods.
The scalp EEG directly records neural activity with a high temporal resolution, which enables the exploration of brain oscillation in different frequency bands that may depict physiological features of brain activity in both local regions and functional interactions at large-scale [16]. However, the traditional use of EEG largely ignores the spatial components of the signals and may result in misinterpretations due to volume conductance effects [17]. The combination of EEG and source localization analyses reveals more informative features derived from EEG and are more practical for exploration of the FC across different regions during resting or task states [16, 18].
Among the numerous source-space analysis methods, low resolution brain electromagnetic tomography (LORETA) introduced in 1994 by Pascual and co-workers [19], is an excellent solution to the inverse problem of scalp EEG. Using their tool LORETA-KEY (https://www.uzh.ch/), a distributed source reconstruction is obtained from scalp EEG for cortical gray matter. The validity and reliability of this method has been identified by many previous studies [20, 21, 22]. The Phase Lag Index (PLI) is a powerful tool in depicting FC with EEG data. The PLI is designed to eliminate the artifacts of volume conduction effects and is not sensitive to signal noise [23, 24]. Another widely used technique, graph theory analysis, has been applied in many previous studies. One study using graph analysis with functional MRI data found a decreased clustering coefficient and local efficiency in left insula in patients with anti-NMDAR encephalitis [25]. The current authors have also found decreased global efficiency, clustering coefficients and local efficiency of the alpha band in AIE patients [15]. Relative Band Power (RBP) is a commonly used classical method for evaluating energy in different frequency bands of EEG [26].
To date, most studies have focused on the FC changes with functional magnetic resonance imaging (fMRI) data to understand the possible network mechanisms of AIE or anti-NMDAR encephalitis patients. No studies have combined use of the above methods to detect changes in brain networks of anti-NMDAR encephalitis patients, although a previous study by the current authors has found FC changes in AIE patients [15]. The next step is to explore the alteration of brain FNs in anti-NMDAR encephalitis patients based on the electrical source localization of FC and its relationship with clinical traits.
Twenty-nine acute anti-NMDAR encephalitis patients were enrolled in the department of neurology at the affiliated hospital of Southwest Medical University from June 2018 to May 2023. The inclusion criteria were defined in accordance with established diagnostic standards for anti-NMDAR encephalitis as previously published [27] and reported in a previous study by the authors [15]. The immunoglobulin G anti-neuronal antibodies (Abs) were tested in serum and/or cerebrospinal fluid. Auto-Abs including NMDAR, alpha-amino-3-hydroxyl-5-methyl-4-isoxazole-propionate receptor, contactin-associated protein-like 2, Leucine-rich glioma-inactivated 1, alpha-amino-3-hydroxyl-5-methyl-4-isoxazole-propionate receptor and aminobutyric acid receptor Abs as well as anti-onconeural Abs (Abs anti-Hu) in serum and/or cerebrospinal fluid were screened. Only acute AIE patients (onset time less than one month) with single positive Abs NMDAR outcomes were included. All included participants were right-handed. Exclusion criteria encompassed individuals with a prior history of severe neuropsychiatric diseases, presence of EEG artifacts, negative antibody outcomes, or those with multiple Abs positive outcome. The Modified Rankin Scale (mRS), Mini-mental State Examination (MMSE) and clinical traits were assessed for all patients. The control group was matched from our EEG database including healthy participants. For the matching criteria, we used a MATLAB function Age_gender_match (Luki, 2023, https://www.mathworks.com/matlabcentral/fileexchange/66984-age_gender_match-year_gap-group1-group2). In this function, the age and sex from healthy control (HC) group were matched randomly for 10,000 times. Thus, the matching-priority was calculated. Then, the best matched subjects were selected as control group. These sex and age matched right-handed healthy participants without neurological or mental disorders and drug addiction were included as the HC group.
This step was performed in a semi-isolated room. Before EEG acquisition,
participants were required to keep their hair clean and dry. A 19-channel analog
recorder (Galileo EB Neuro, Florence, Italy) was used and the leads were assigned
in the scalp using a quantified ruler following the International 10–20 system
released by the American Clinical Neurophysiology Society. The impedance of each
electrode was reduced to lower than 10 K
The EEG preprocessing steps were performed using a self-writing MATLAB (R2014a MathWorks, Natick, MA, USA) pipeline based on EEGlab (v14.1.1, http://sccn.ucsd.edu/) and are similar to a previous study [28]. The original data obtained from each participant was exported into the European Data Format. EEG data was filtered with a bandpass of 1–70 Hz. Eye movement and electromyography artifacts were removed automatically using an EEGlab plugin-in artifact removal tool (http://germangh.com). The tool employed a blind source separation method with a fast independent component analysis algorithm that automatically eliminated artifacts. Subsequently, data were re-referenced to the average lead. Bad channels were interpolated and the number of bad electrodes was limited to a single channel. Channels were then re-referenced to the average lead. Previous studies have found that EEG analysis parameters are stable and can be robustly estimated when the length of resting-state EEG for each participant is longer than 30 s [29]. EEG data with a 50 s duration for each participant gives relatively stable results. Thus, five 10-second epochs of data for each participant with eyes closed, awake were extracted and used in the follow-up analysis.
Regions of Interest (ROIs) were defined according to 84 Brodmann areas (BAs) that were divided into areas according to their structural location in Montreal Neurological Institute (MNI) space [30] (Supplementary Table 1) Source signals of ROIs were extracted using the exact LORETA (eLORETA) method with LORETA-KEY (v20190226, https://www.uzh.ch/). The eLORETA method has been described and applied in many previous reports [28, 31, 32] and at the website of Roberto D. Pascual-Marqui (https://www.uzh.ch/keyinst/loreta). In brief, eLORETA is a non-linear method and a true inverse solution for source localization with exact and zero localization errors [33]. The scalp EEG data were transformed to eLORETA files with a transformation matrix created by using the electrode location file. The signal for each ROI was then calculated using the eLORETA files and the ROI coordinates.
PLI was used to construct the FC matrix of the ROIs with the obtained signals in
different bands. PLI was first described by Stam and colleagues [23]. The central
idea is to discard phase locking, centered around 0 and every
The sign here indicates the signum function. The PLI varies between 0 and 1, where 0 indicates the absence of coupling due to volume conduction and 1 indicates true, delayed interaction. One PLI matrix was constructed for each participant in each frequency band of the six frequency bands: delta (1–4 Hz), theta (4–8 Hz), alpha (8–13 Hz), beta 1 (13–30 Hz), beta 2 (30–45 Hz) and gamma (45–70 Hz).
Using the PLI matrices, graph parameters including small world index (sigma), global efficiency, local efficiency, clustering coefficient and shortest path length were calculated. The detailed algorithms for these parameters have been described in previous studies [35, 36]. Functional brain differentiation can be measured by the clustering coefficient and local efficiency, whereas the overall processing and transfer capacity of information, as well as the level of network integration can be assessed by the shortest path length and global efficiency. These graph parameters were obtained using a function embedded in the MATLAB based tool: Brain Connectivity Toolbox [37] (https://sites.google.com/site/bctnet/).
The power spectra for each frequency within 1–70 Hz were estimated using the toolbox EEGlab (v14.1.1). The six frequency bands were then defined as in the above FC analysis. The power in each frequency band and total power were calculated. Finally, the RBP in each band were calculated with:
Where Band_Power indicates the frequency band power. Total_Power means the total power of the six frequency bands.
A generalized linear model was used to eliminate possible sex and age artifacts
Two sample tests with false discovery rate (FDR) correction were used to compare
the differences in FC and graph parameters between patients and HCs and subgroups
within patients. Pearson’s correlation coefficient was calculated to detect any
relations between EEG parameters and clinical scales. The effect size was
estimated using Cohen’s d value. A p
Twenty-nine anti-NMDAR encephalitis patients aged 29.79
| AIE (n = 29) | HC (n = 29) | p | ||
| Sex (male/female) # | 10/19 | 6/23 | 1.381 | 0.240 |
| Age (years, mean |
29.79 |
24.58 |
1.61 | 0.111 |
| MMSE (score, mean |
20.57 |
– | – | – |
| Admission mRS (score, mean |
2.93 |
– | – | – |
| Discharge mRS (score, mean |
2.00 |
– | – | – |
| No. of involuntary movements (cases) | 6 | |||
| No. of psychiatric symptoms (cases) | 2 |
# Chi-square test, ## two sample t-test; mRS, Modified Rankin Scale; MMSE, Mini-mental State Examination; anti-NMDAR, anti-N-methyl-Daspartate receptor; AIE, Autoimmune anti-NMDAR encephalitis; HC, Healthy control; SD, standard deviation.
| Anti-NMDAR encephalitis patients (n = 29) | ||
| Clinical traits | Cases | |
| IP | ||
| IP (70–180 mm H |
25 | |
| IP ( |
4 | |
| EEG pattern | ||
| Slowing rhythm | 22 | |
| Normal EEG | 7 | |
| Slowing rhythm + excessive beta | 8 | |
| Delta brush | 5 | |
| Epileptiform discharge | 4 | |
| MRI pattern | ||
| Focal hyperintense | 10 | |
| Normal MRI | 19 | |
IP, Intracranial pressure; anti-NMDAR, anti-N-methyl-Daspartate receptor; EEG, electroencephalogram; MRI, Magnetic Resonance Imaging.
The large-scale FC was compared between anti-NMDAR encephalitis patients and HCs based on the 84 brodmann area (BA) ROIs. Few edges in delta and theta bands showed increased FC and a large number of edges in beta 1 and beta 2 bands showed increased FC in patients having anti-NMDAR encephalitis (Fig. 1). For other frequency bands, no significant differences in FC were found between the two groups. No decrease in FC was observed in participants, compared with HC.
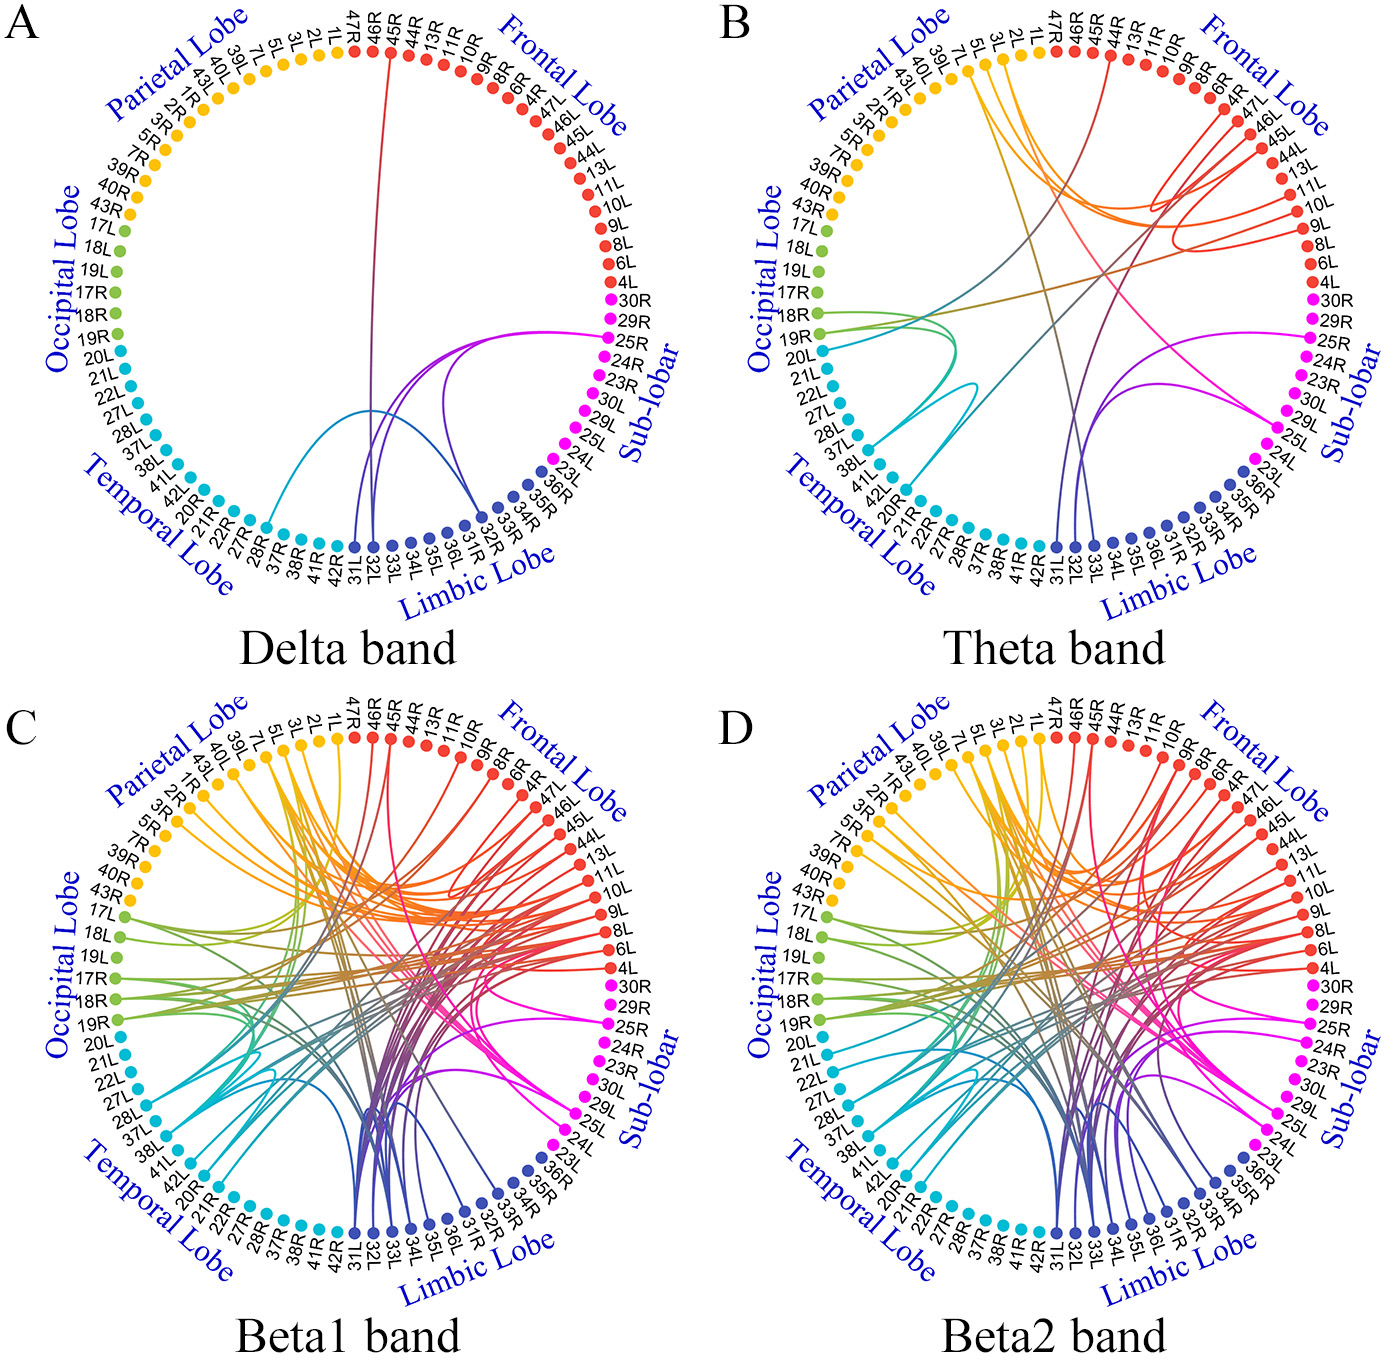 Fig. 1.
Comparison of large-scale networks between anti-NMDAR
encephalitis and HC groups
However, results showed some differences when the FC based on scalp EEG channels were compared. The FC mainly involving frontal-parietal in alpha and beta 1 bands decreased in patients, compared with those of HCs. Few edges in theta and beta 2 bands had increased FC in patients (Supplementary Fig. 1).
Compared with the HC group, local efficiency and the clustering coefficient in
delta, theta, beta 1 and beta 2 bands increased in anti-NMDAR encephalitis
patients (p
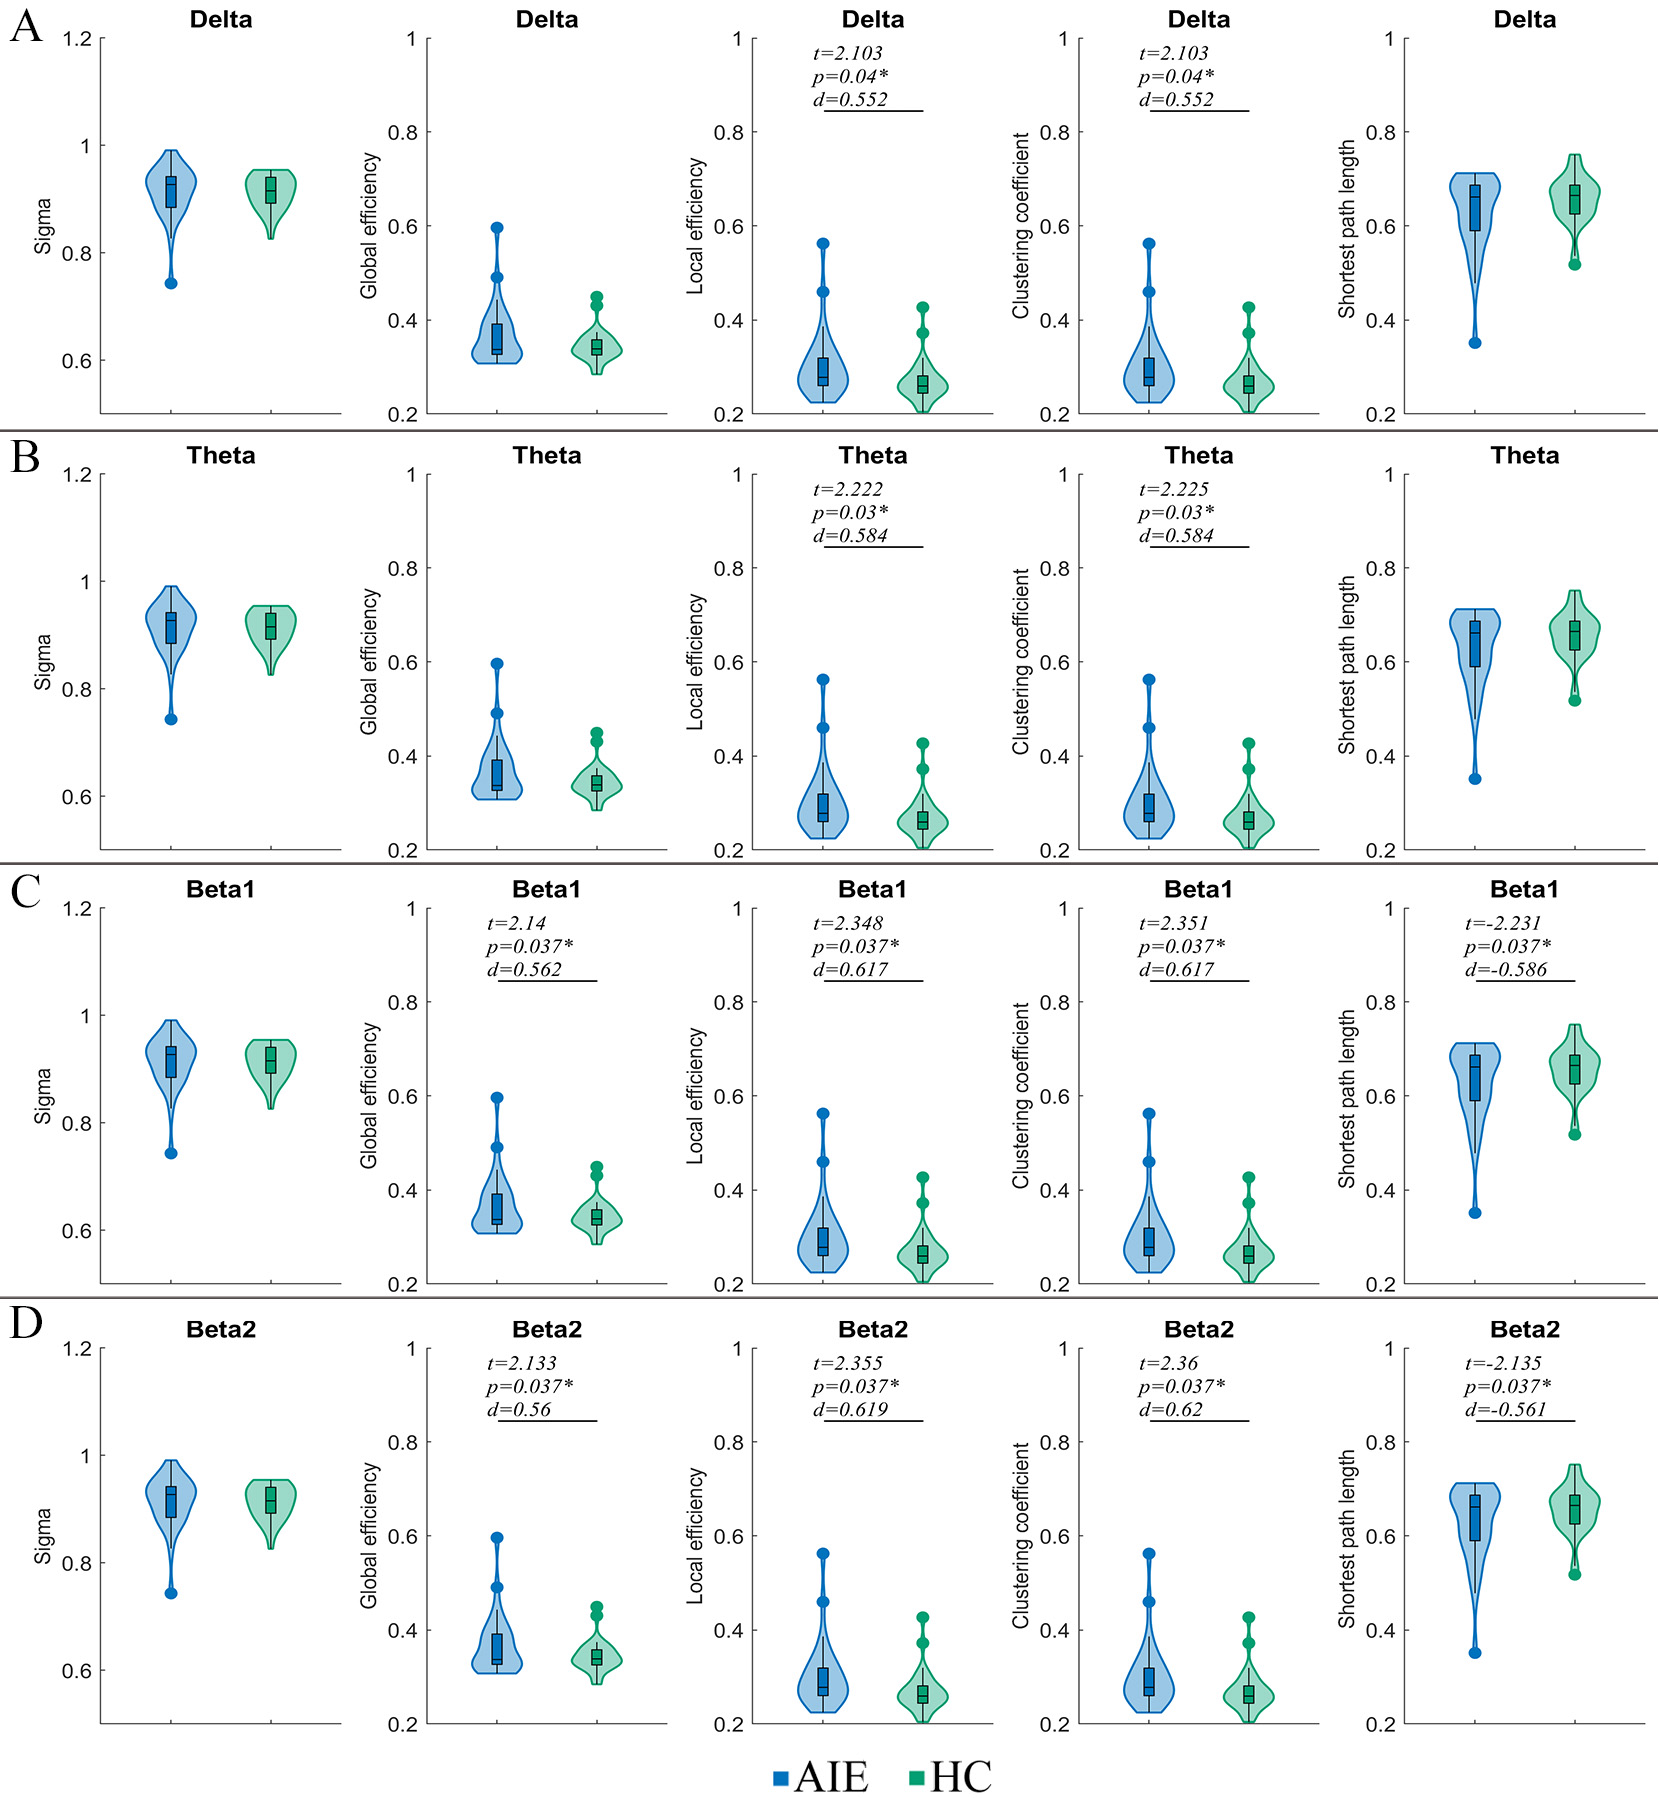 Fig. 2.
Comparison of graph theory parameters between AIE and HC
groups
When these parameters were analyzed based on the scalp 19
Compared with the HC group, the AIE group showed increased delta and theta RBP in frontal, parietal, occipital, temporal and sub-lobar lobes. However, the RBP of alpha and beta 1 bands in parietal, occipital, temporal and sub-lobar lobes decreased in anti NMDAR encephalitis patients. Additionally, compared with the HC group, the theta band RBP increased while the alpha band RBP decreased in the limbic system of patients (Fig. 3).
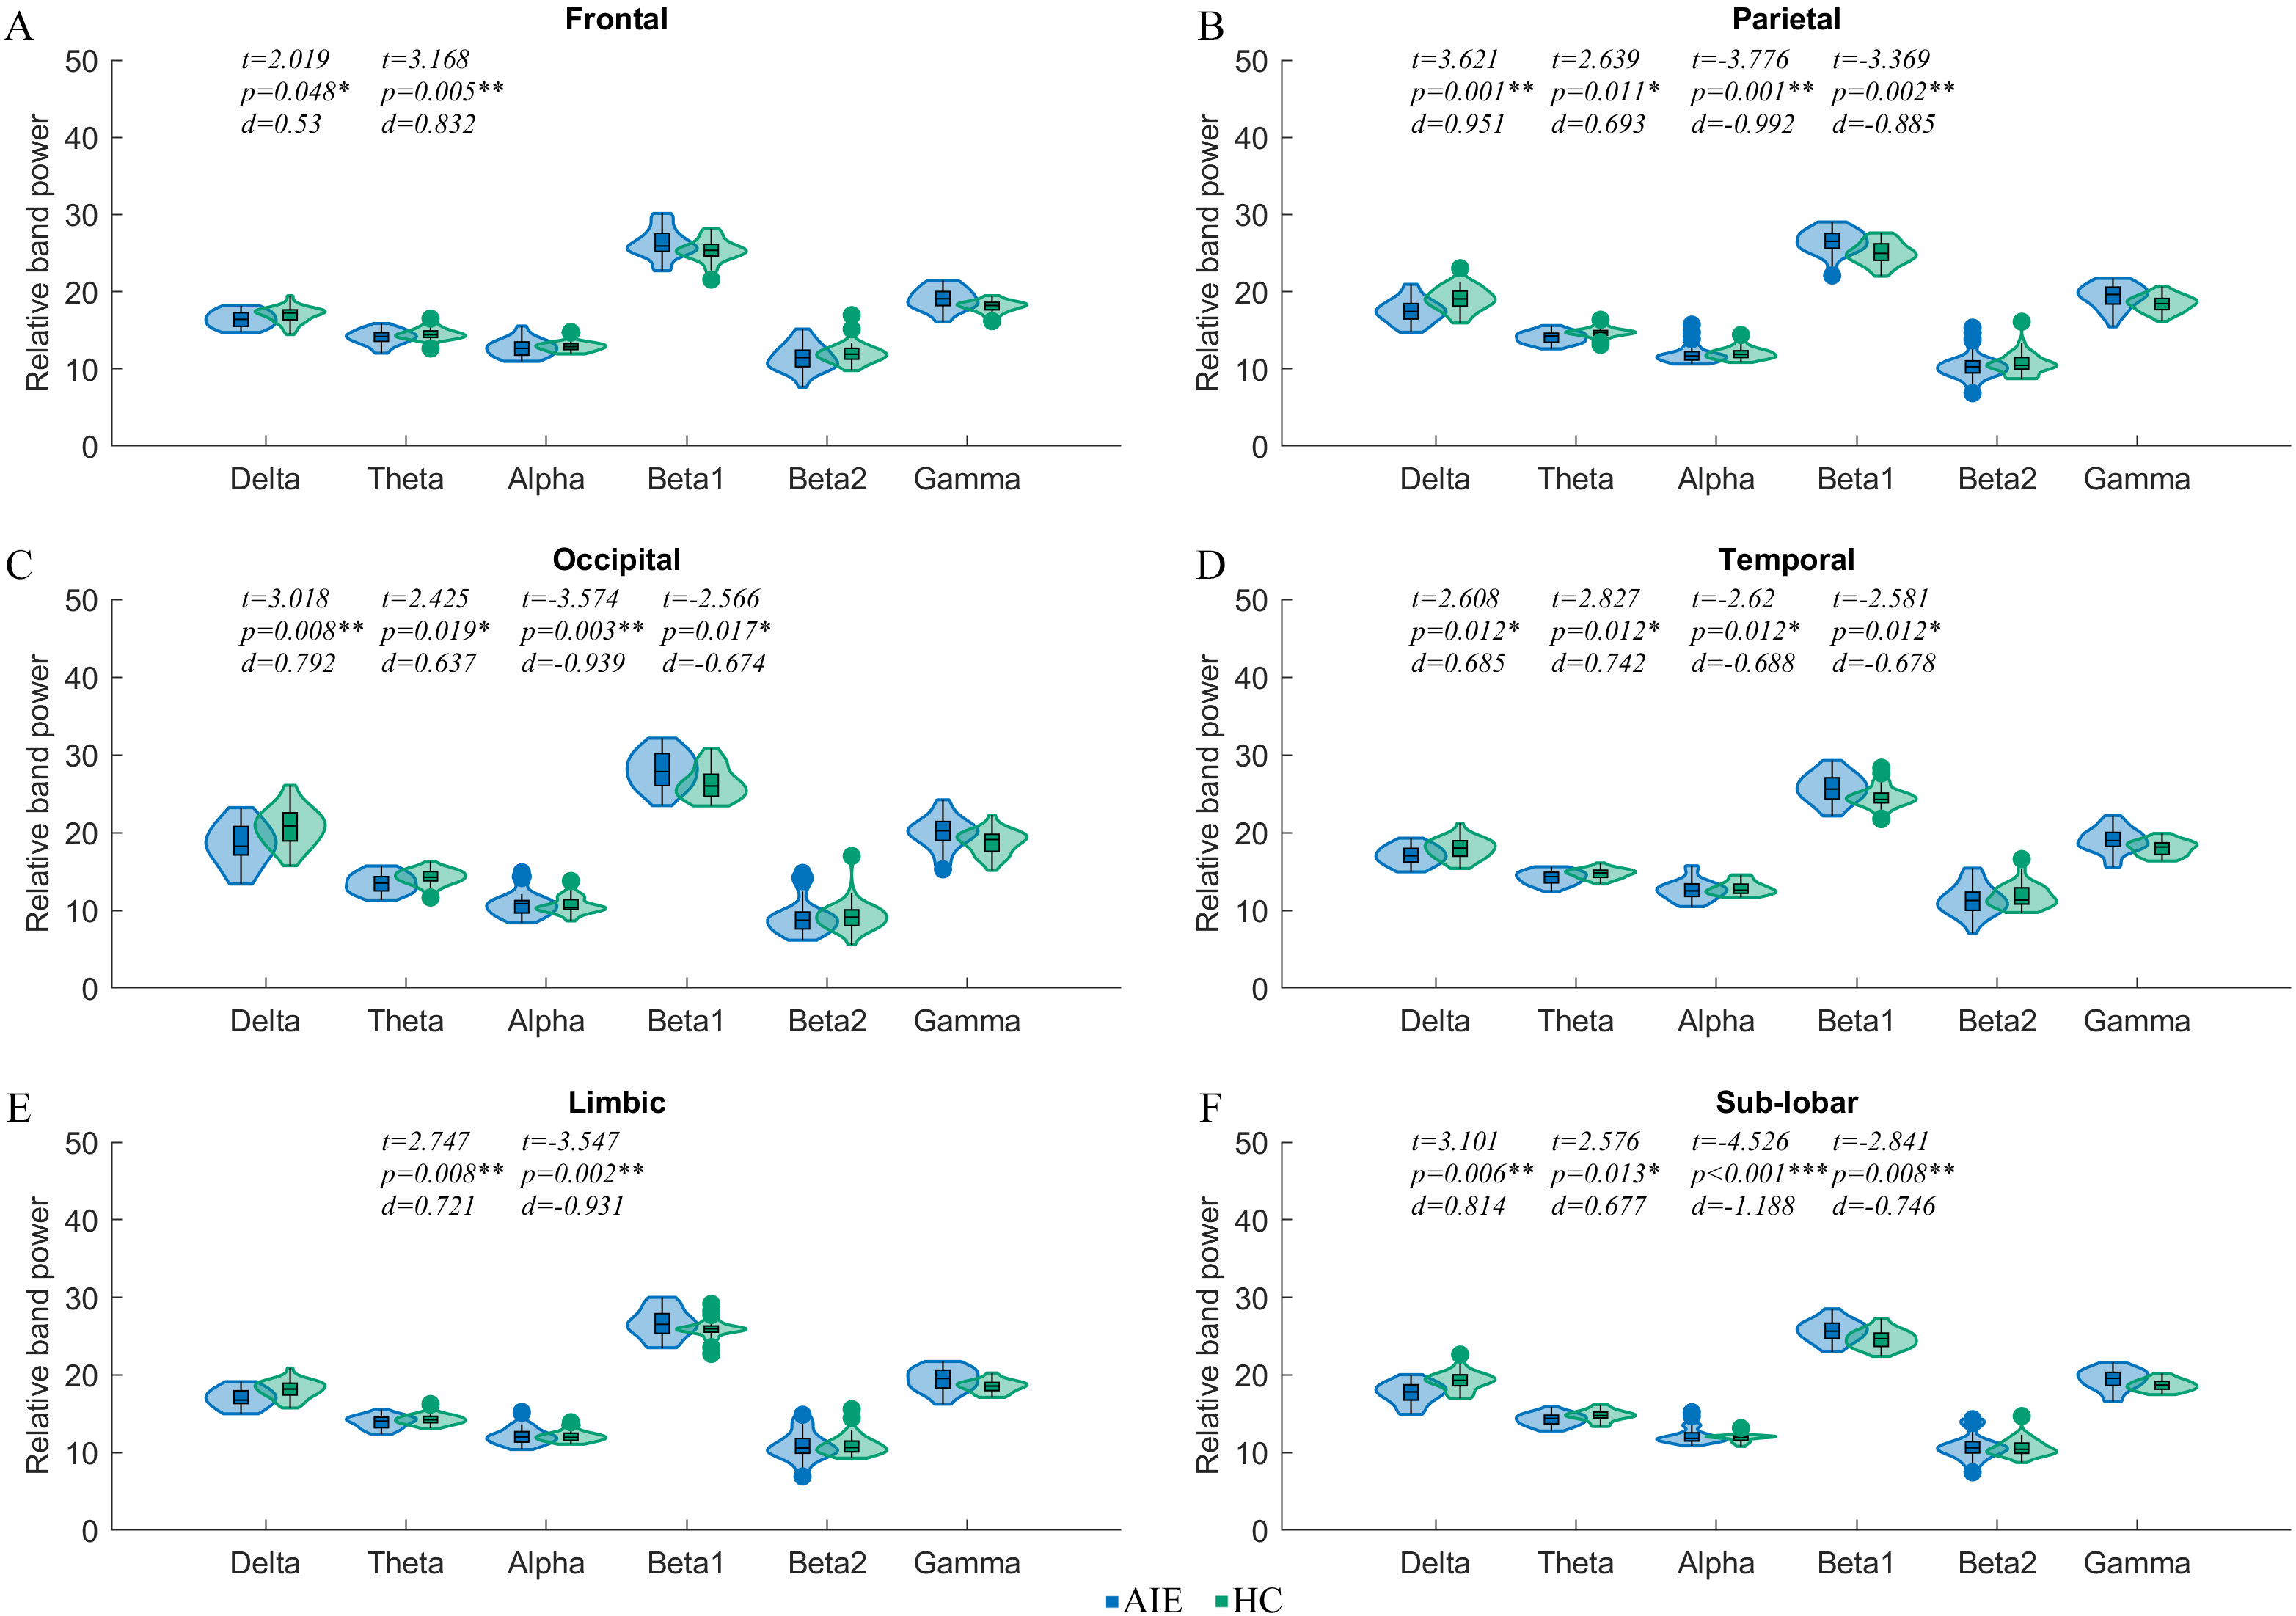 Fig. 3.
Comparison of relative band power of macro subnetworks between
AIE and HC groups
When sub-groups were partitioned by EEG pattern, MRI pattern and MMSE scores, significant differences were observed in the RBP of some brain areas. Comparing the AIE group with the normal EEG pattern, AIE participants with abnormal EEG pattern showed decreased alpha RBP in the whole brain. Additionally, those AIE participants with abnormal MRI showed significantly increased theta RBP in temporal, limbic and sub-lobar systems. The alpha RBP in limbic systems also increased significantly in these participants, compared with those with a normal MRI. Moreover, compared with those participants showing higher MMSE, those with a lower MMSE showed increased beta 1 RBP in the frontal lobe and limbic system (Fig. 4). Other parameters we did not mention including both source localization-based and scalp EEG-based graph parameters showed no significant differences in these subgroups.
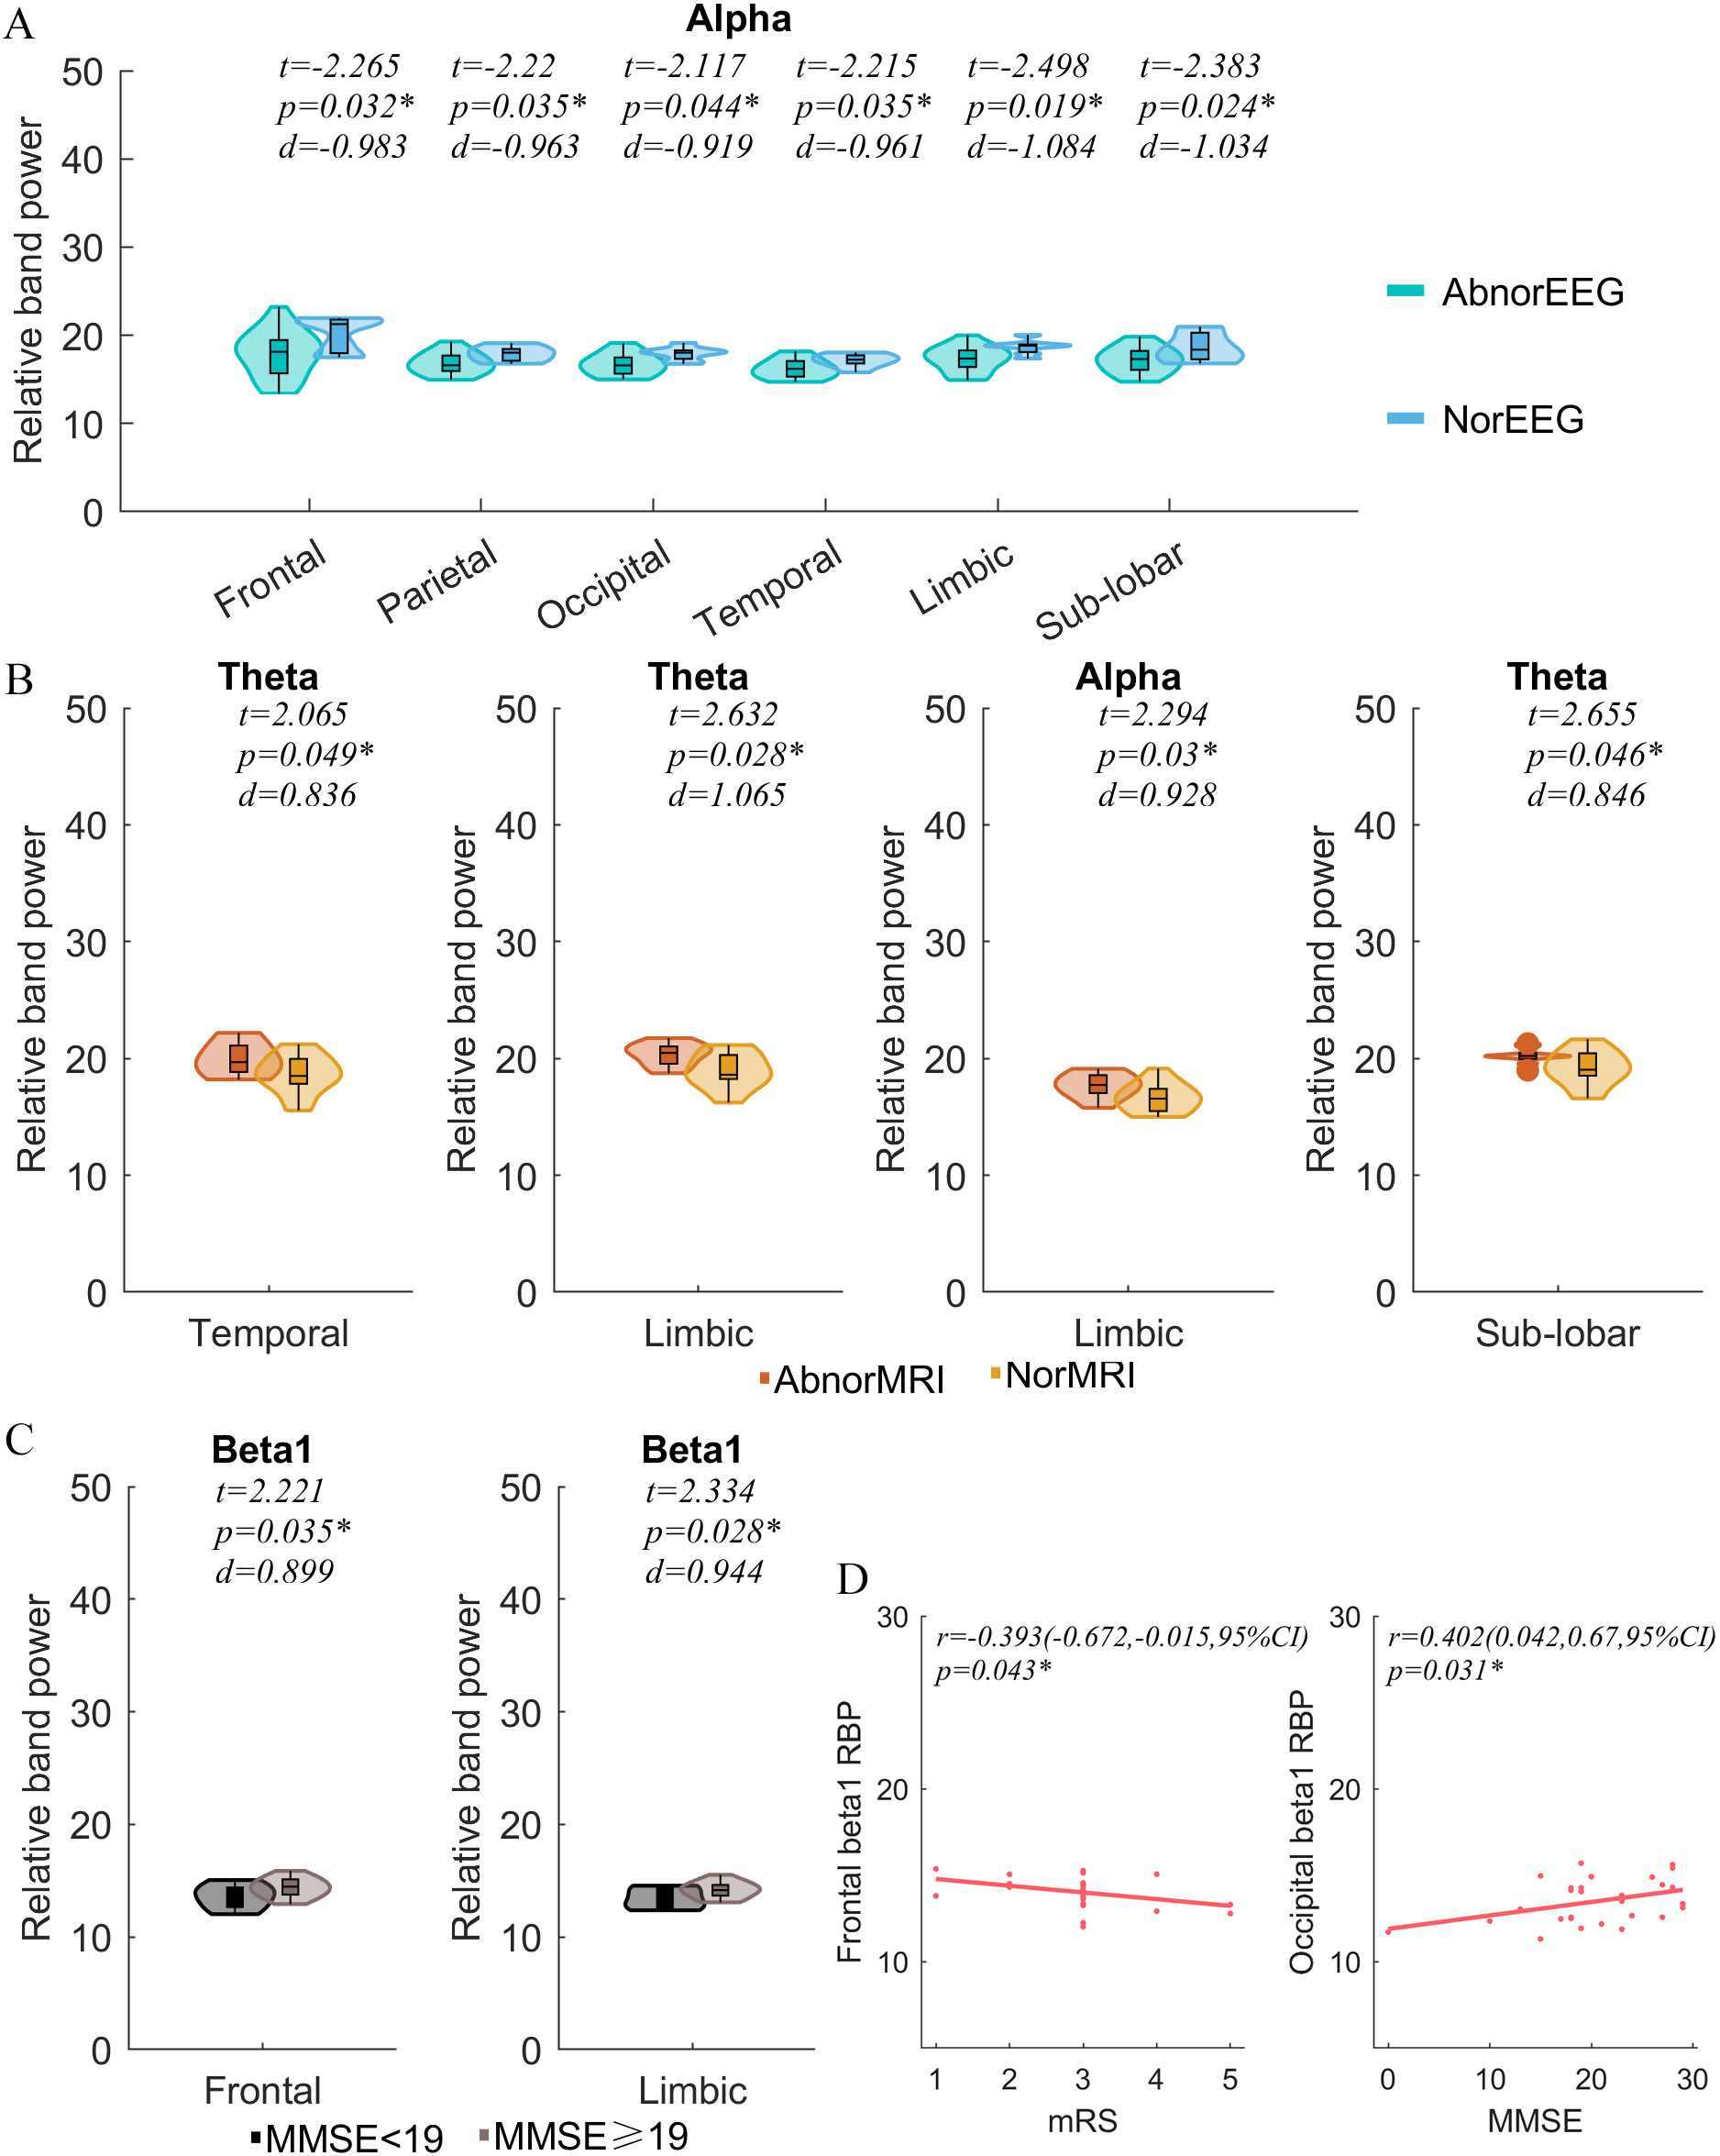 Fig. 4.
Subgroup comparisons and correlation analyses. RBP comparisons
of subgroups divided by (A) EEG pattern, (B) MRI pattern, (C) MMSE, and (D)
Correlation analysis between cortical RBP, mRS and MMSE. EEG,
electroencephalogram; AbnorEEG, Abnormal EEG pattern; NorEEG, Normal EEG pattern; MRI, Magnetic Resonance Imaging; AbnorMRI, Abnormal MRI pattern; NorMRI,
Normal MRI pattern; MMSE, Mini-mental State Examination; mRS, Modified Rankin
Scale; RBP, Relative band power; r, Pearson’s correlation coefficient;
CI, Confidential interval; d, Effect size (Cohen’s d); t value of two sample t test.
*p
Significant negative correlations were found between the beta 1 RBP in the frontal lobes and mRS scores (r = –0.393, p = 0.043). The beta 1 RBP in the occipital lobe was significantly positively correlated with MMSE (r = 0.402, p = 0.031, Fig. 4). Other parameters not mentioned showed no significant correlations with MMSE or mRS.
Few studies have focused on brain FN changes in anti-NMDAR encephalitis patients using EEG and source localization-based analyses. In the present study, PLI and graph analyses was applied to the cortical source signals derived from scalp EEG to detect possible changes in brain FNs in anti-NMDAR encephalitis patients. Results indicate that the changes in source FN mainly involved increased FC in beta 1 and beta 2 bands. Anti-NMDAR encephalitis patients showed higher local efficiency and clustering coefficient in all frequency bands. Analysis of RBP showed the slowing band RBP increased while the fast band RBP decreased in multiple- areas. And anti-NMDAR encephalitis with different clinical features may have different EEG characteristics. Some of these changes in RBP are correlated with mRS and MMSE in these participants.
One main finding in this study was that a large number of edges in beta 1 and
beta 2 bands showed increased source FC. This finding contradicts findings
reported in a previous fMRI study by Peer et al. [6], that the anti-NMDAR
encephalitis patients showed declined FC in formidable FNs. This contradiction
may be due to the different techniques used in the two studies; this study used
an EEG technique, while the previous study used fMRI techniques. The different
temporal and spatial scales of the two techniques may have caused the different
findings in FC. Previous studies have observed inconsistencies between MRI and
EEG where less than half of MRI in anti-NMDAR encephalitis show abnormalities
[38], while most (
Here, increased beta FC was found in the source localization-based FN analysis while decreased alpha FC was found in the 19 scalp EEG electrode-based FN analysis. These results update understanding of the FN mechanisms of anti-NMDAR encephalitis. Decreased alpha activity and increased beta activity are commonly observed in clinical EEG reports [11, 42]. According to the Scaffolding Theory [43, 44], it is supposed that decreased scalp alpha FC may indicate brain dysfunction while increased source beta FC may indicate a compensatory mechanism for brain function in anti-NMDAR encephalitis patients. RBP analyses showed decreased source alpha and beta activities and increased delta and theta activities in wide brain areas and the changes in RBP in frontal and occipital areas are correlated with clinical scales. These findings further support the assumption that changed FC in different bands may be a compensation for brain function.
Notably, the abnormal 84 ROIs-based FC changes depicted by graph parameters mainly involved increased local efficiency and clustering coefficients. Local efficiency is an assessment of the local average efficiency of information transfer and a clustering coefficient is used to describe the degree of node clustering in a graph. The changes in these parameters may suggest a decrease of function in the cognitive domain [45, 46]. Additionally, more changes in graph parameters were found in 84 ROIs-based FC than in 19 electrode-based FC, which suggests the effectiveness and necessity of using source localization-based FC analyses with EEG data.
This study had some limitations, including a relatively small sample size and a lack of exploration of the long-term effects of anti-NMDAR encephalitis on FC. Another limitation was that detailed cognitive domain assessments were absent and the correlations between FC changes and clinical traits were not investigated. Further, cognitive function in the HC group and the correlations between the changes in FC and clinical traits such as MMSE and mRS remain to be clarified, despite that potential correlations were found in the parameters of patients. Future studies aim to gather larger samples and detailed cognitive assessments to overcome these limitations.
In this study, source localization-based FC, graph and RBP analyses were combined to confirm the FC changes of brain network in the resting brain state of anti-NMDAR encephalitis patients. Changes in FNs were characterized by increased FC within the 84 BAs in beta 1 and beta 2 bands. The local efficiency and clustering coefficient increased in delta, theta and beta bands. Moreover, the anti-NMDAR encephalitis patients showed increased slow rhythm RBP and decreased fast rhythm RBP and some of these changes may correlate with clinical traits. The decreased scalp alpha FC may indicate brain dysfunction while increased source beta FC may indicate a compensatory mechanism for brain function in anti-NMDAR encephalitis patients. These findings add to understanding from a cortical point of view of how the brain functional network changes. Longitudinal studies with more samples are urgently needed to detect the extent to which clinical features describe the brain and help identify their potential value in the treatment of anti-NMDAR encephalitis.
The data that support the findings of this study are available upon reasonable request to corresponding author J Ruan (jianghai.ruan@swmu.edu.cn).
ZL and JR: Conceptualization, supervision, formal analysis, investigation, and review and editing of the manuscript. DZ: Conceptualization, supervision. XZ and FL: Data curation, Investigation, writing the original draft of the manuscript. HL, CC and SL: Data curation, Formal analysis and investigation. All authors contributed to editorial changes in the manuscript. All authors read and approved the final manuscript. All authors have participated sufficiently in the work and agreed to be accountable for all aspects of the work.
The study was approved by the Medical Ethics Committee of the First Affiliated Hospital of Southwest Medical University (KY2019233). Written informed consent was obtained from all participants.
Not applicable.
This work was supported by the Sichuan Science and Technology Program (2022YFS0613), Strategic Cooperation Project between Sichuan University and Luzhou Government (2021CDLZ-10).
The authors declare no conflict of interest.
Publisher’s Note: IMR Press stays neutral with regard to jurisdictional claims in published maps and institutional affiliations.