
- Academic Editor
†These authors contributed equally.
Objectives: In this study, we explored the effects of chiropractic
spinal adjustments on resting-state electroencephalography (EEG) recordings and
early somatosensory evoked potentials (SEPs) in Alzheimer’s and Parkinson’s
disease. Methods: In this randomized cross-over study, 14 adults with
Alzheimer’s disease (average age 67
Alzheimer’s and Parkinson’s disease are the two most prevalent neurodegenerative disorders worldwide [1]. Alzheimer’s is characterized as a dementia involving memory loss, confusion, and cognitive impairment [2], while Parkinson’s is a movement disorder involving tremors, rigidity, bradykinesia, and postural instability [3]. Although these disorders have distinct features, with Alzheimer’s primarily classified as dementia and Parkinson’s being a movement disorder, they share several commonalities. Both disorders have a multifactorial etiology, involve an abnormal accumulation and processing of damaged or mutant proteins in the brain, are increasingly prevalent in older age, involve permanent loss of neurons, and may be difficult to treat [1]. In addition, both Alzheimer’s and Parkinson’s disease involve altered sensorimotor processing in the central nervous system [2, 3]. In both Alzheimer’s and Parkinson’s disease, these alterations may manifest as functional impairments, including reduced gait speed, postural abnormalities, and musculoskeletal pain [2, 3, 4], which are potential targets for conservative therapies such as chiropractic spinal adjustments [5, 6, 7, 8, 9].
Previous research has shown that individuals with Alzheimer’s or Parkinson’s disease demonstrate several abnormalities in brain activity. Both diseases involve alterations in the prefrontal cortex as measured via somatosensory evoked potentials (SEPs) [10, 11, 12, 13]. These changes could be indicative of impaired sensorimotor integration and, in turn, relate to markers of disease severity and motor function [12, 13].
Resting-state electroencephalography (EEG) and SEPs are non-invasive tools used to measure brain activity and neuroplasticity [14]. While resting-state EEG measures brain activity at rest, SEPs are measured in response to neural stimuli and indicate activated neural structures in the somatosensory pathway [15]. SEPs have been used to examine changes in neural plasticity and somatosensory integration in central nervous system disorders [15]. In addition, SEPs have also provided a means to explore the effects of chiropractic spinal adjustments on the central nervous system [15].
Chiropractic spinal adjustments are a therapeutic procedure aimed at correcting vertebral subluxations or dysfunctions [16]. A vertebral subluxation refers to a vertebral motion segment that is dysfunctional and is characterised by abnormal intersegmental range of motion, tenderness to touch, and stiffness [17]. It is recognised in the International Statistical Classification of Diseases (ICD) and Related Health Problems (ICD-10-CM code M99.0, M99.1) and is referred to in many research publications and is recognized by the World Health Organization [16, 18, 19, 20, 21, 22, 23, 24]. Subluxations are described as persistent motor control problems affecting a joint, leading to improper movement and causing neural changes that hinder the central nervous system’s ability to regulate, organize, adapt, repair, and heal [23, 25]. Chiropractors assess the spine for vertebral subluxations using indicators for spinal dysfunction with manual palpation, manual intersegmental range of motion assessment, assessment for tenderness to touch, and alterations in texture, tone, and stiffness of each vertebral joint and surrounding muscles [17]. They then employ various manual techniques [26], with the most common being specific high-velocity, low-amplitude adjustments administered by hand to the affected spinal segment [23, 24, 27]. This hands-on therapy applied to the joints of the spine can be viewed within the broader concept of therapeutic touch, which encompasses any human touch-based intervention used in musculoskeletal care, involving affective and discriminatory components [28]. Evidence suggests that therapeutic touch may produce beneficial neurophysiological effects, while simultaneously helping establish a therapeutic alliance (e.g., a collaborative relationship) between the patient and clinician [28].
Previous research has shown that chiropractic spinal adjustments induce neural plastic changes in the central nervous system as observed via EEG and SEPs [23, 29]. While the findings of these studies vary, the most consistently observed effect is a reduction in the amplitude of the N30 SEP peak [30]. This peak is believed to originate from the prefrontal cortex [31], an area of the brain involved in sensorimotor function [29, 30, 31]. However, prior studies have typically examined these changes in healthy individuals or those with previous stroke [23, 30], rather than individuals with Alzheimer’s or Parkinson’s disease.
Previous case reports have described symptomatic improvements in pain and function in individuals with neurodegenerative diseases, including Alzheimer’s and Parkinson’s, following chiropractic spinal adjustments [5, 6, 7, 8, 9, 32]. However, beyond case reports, limited research has explored the effects of chiropractic spinal adjustments on individuals with neurodegenerative diseases. In fact, previous clinical trials examining spinal adjustments have typically excluded individuals with neurodegenerative diseases [33, 34]. Despite this, a recent systematic review highlighted that other non-pharmacological interventions, such as touch therapy, exercise, and music therapy, showed positive effects in alleviating symptoms of dementia [35]. In addition, some authors have proposed that hands-on techniques such as osteopathic manipulation could play a role in alleviating symptoms of neurodegenerative diseases [28, 36].
Given that many patients with Alzheimer’s and Parkinson’s disease suffer from central sensorimotor abnormalities, may benefit from hands on (therapeutic touch) techniques, and given that chiropractic adjustments have been shown to improve central sensorimotor integration, motor control and function in other populations, it is possible that Alzheimer’s and Parkinson’s disease patients could also benefit from chiropractic spinal adjustments. If this is the case, we would expect to observe changes in early central sensorimotor integration changes, as assessed by median nerve SEP peak amplitudes, and/or other resting state EEG parameters following a single session of chiropractic adjustments in participants with Alzheimer’s and Parkinson’s disease.
The present study used a randomised controlled cross-over design and was conducted at Railway General Hospital in Rawalpindi, Pakistan. The study was approved by the Riphah International University Research Ethics Committee, Pakistan (Riphah/RCRS/REC/000119). The study was also approved by the New Zealand College of Chiropractic Research Committee. The study was registered by the Australian New Zealand Clinical Trials Registry (registration numbers ACTRN12618001217291 and 12618001218280). The study was conducted in accordance with the Declaration of Helsinki.
Participants were eligible to participate if they were at least 18 years of age and had evidence of spinal dysfunction (i.e., presence of vertebral subluxation indicators identified by a chiropractor). The participants were ineligible to participate if they showed no evidence of spinal dysfunction, had absolute contraindications to spinal adjustments (e.g., spinal fracture, atlantoaxial instability, spinal infection, spinal tumor, or cauda equina syndrome), or previously experienced a serious adverse event following chiropractic spinal adjustments. Patients were required to have received a diagnosis of either Alzheimer’s or Parkinson’s disease by a neurologist at the Neurology Specialist Centre of the Railway General Hospital, and this diagnosis had to be confirmed at least eight weeks before they were enrolled in the study. The participants gave their written informed consent to participate in the study.
In random order, the participants took part in two interventions, chiropractic and control, separated by at least one week (Fig. 1). The balanced randomisation scheme was generated using Minimizer (Microsoft Corp. Redmond, WA, USA). The participants were not informed beforehand that one of the interventions would be a control intervention. Each session consisted of recording resting-state EEG, followed by SEPs evoked by electrical stimulation of the right median nerve at the wrist using surface electrodes (refer to 2.4.2.1 Median nerve stimulation below for more details). Both recordings were captured before and after each intervention. During each recording, participants were seated comfortably in a chair in front of a screen and were asked to keep their eyes open and relax to reduce the contamination of EEG signals. Participants were blinded to which intervention they received. Two separate researchers who collected and analysed the data were blinded by assigning random numbers and deidentified codes to each dataset (recording) of every participant.
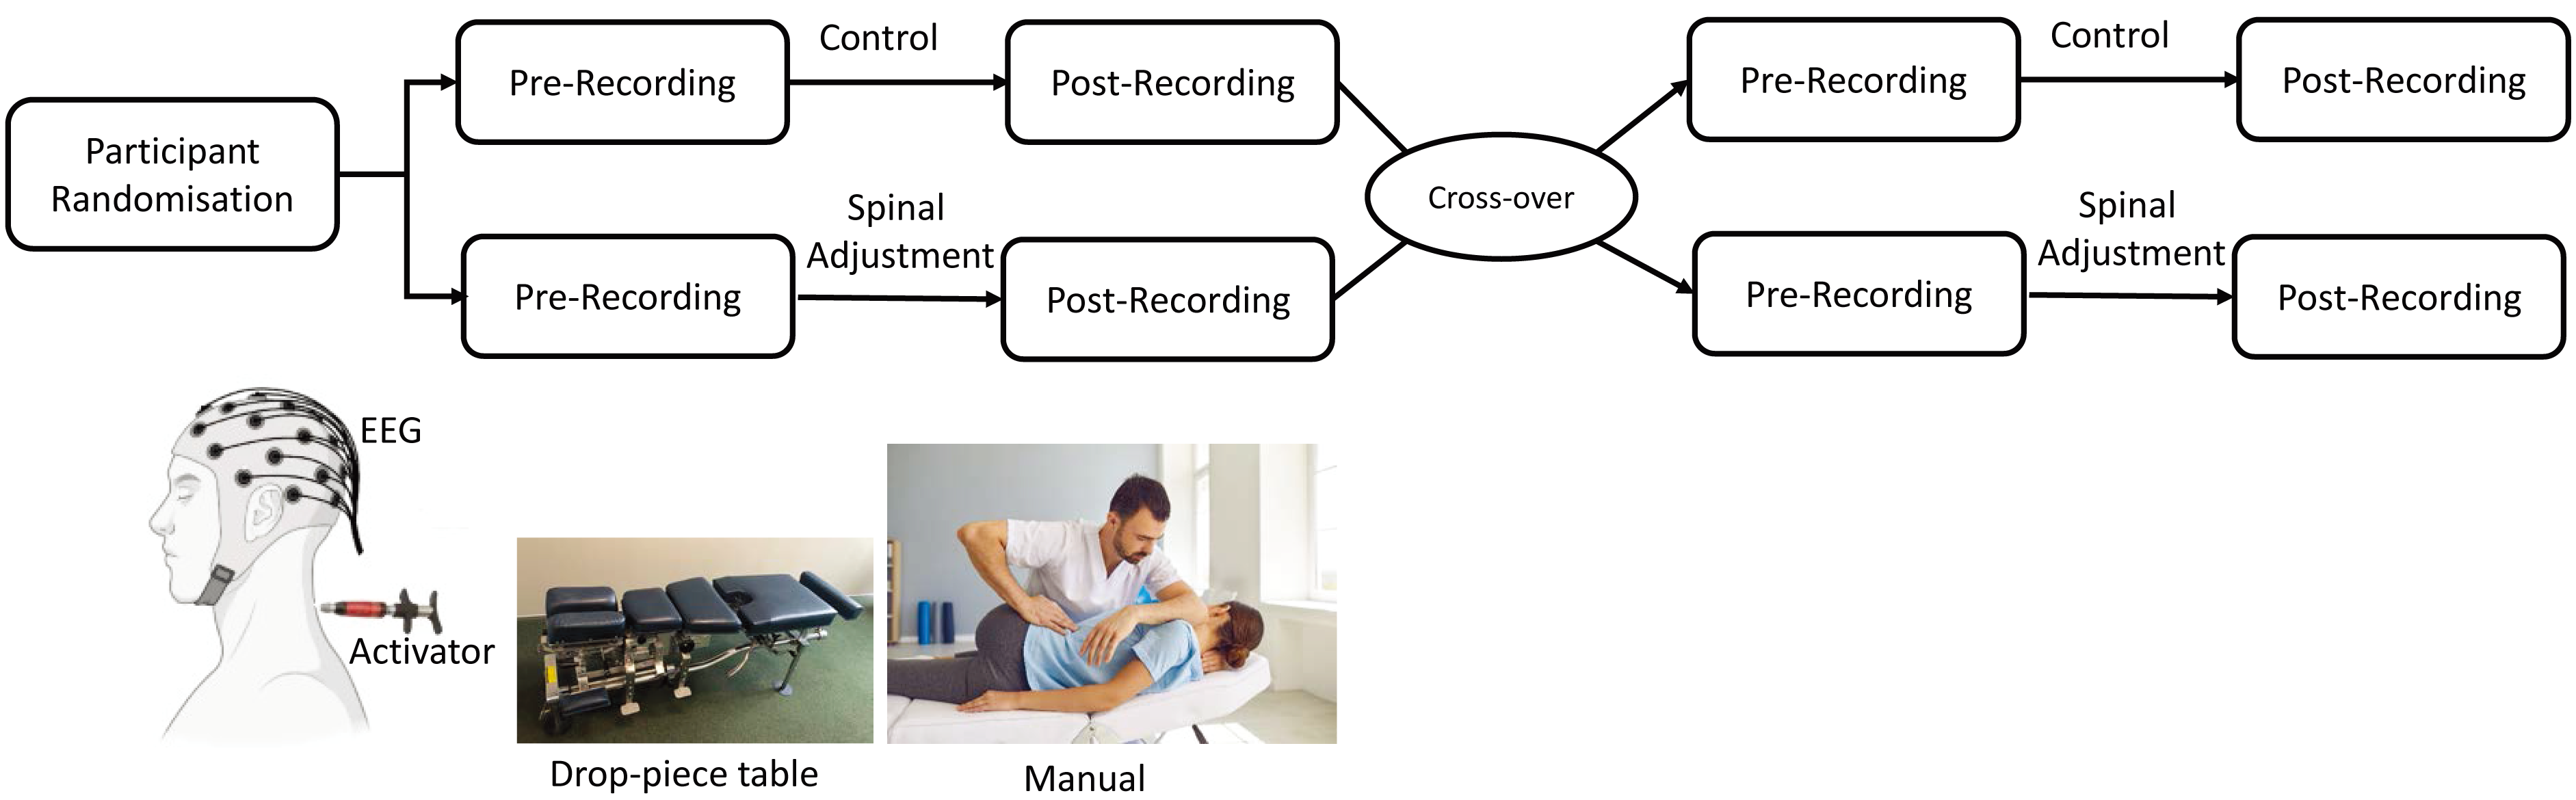 Fig. 1.
Study design and chiropractic intervention, encompassing the Activator instrument, drop-piece table, and manual High-Velocity Low-Amplitude (HVLA) techniques. EEG, electroencephalography.
The chiropractic spinal adjustments and control interventions were similar to those used in previous studies that investigated the neurophysiological effects of chiropractic spinal adjustments [19, 21, 30, 31, 37, 38, 39, 40]. The same chiropractor, a graduate of the New Zealand College of Chiropractic, with over five years’ experience, performed the experimental and control interventions. At the end of the second session, the participants were asked if they perceived that they had undergone active treatment (‘yes’ or ‘no’).
The chiropractor employed typical manual or instrument-assisted interventions that are common in the chiropractic profession (Fig. 1). The chiropractor performed either manual high-velocity, low-amplitude (HVLA) adjustments or instrument-assisted HVLA adjustments using an Activator instrument™ or a drop-piece table (Fig. 1) [41]. The Activator instrument™ (Activator Methods International, Ltd., Phoenix, AZ, USA) used was a hand-held device that delivers an HVLA thrust, which can be set at various pre-determined force levels, directed at dysfunctional spine or pelvic joints [26]. The activator instrument has previously been shown to activate a similar, but smaller, neural response as compared to a manual HVLA thrust, and is capable of also altering the median nerve N30 SEP peak amplitude in younger subclinical pain populations [24]. The drop-piece table, which is a purpose-built adjustment table, also enables a rapid movement to be induced at specific spinal segments. The patient is positioned prone, and the appropriate drop pieces are lifted where it sits elevated, until the thrust is delivered, allowing the drop piece to drop down, aiding in the HVLA thrust to allow rapid movement between a motion segment, such as between the sacral base and L5 motion segment [26]. The chiropractor selected the site(s) for the spinal adjustment based on routine clinical indicators [17], which included tenderness to palpation of the relevant joints, restricted intersegmental range of movement on manual palpation, palpable asymmetric intervertebral muscle tension, and any unusual or blocked joint play and end-feel of the joints. The chiropractor adjusted multiple levels of the spine and pelvis depending on each patient’s clinical findings. The segments adjusted for each participant are noted in Table 1.
| Participant number | Participants with Alzheimer’s disease | Participants with Parkinson’s disease |
| 1 | Right SI*, Sacrum P-A drop***, L1/L2, T8/T9, C2/3 | Sacrum P-A drop***, T12/L1 (A), T3/T4, C1/C2 |
| 2 | Right medial knee (A), left SI*, L5/S1 (A), T10/T11, T4/T5, C7/T1, C0/C1 | Sacrum P-A drop***, T12/L1 (A), C7/T1, C2/C3 |
| 3 | Right SI*, L3/L4, T12/L1 (A), T8/T9, T5/T6, C5/C6, C1/C2 | Right SI*, T11/T12, C1/C2 |
| 4 | Right SI*, L4/L5, T9/T10, C7/T1, C1/C2 | Right SI*, L4/L5, T8/T9, C1/C2, C7/T1 |
| 5 | Right SI*, T11/T12, C0/C1 | Left SI*, L5/S1, L2/L3, T8/T9, T5/T6, C6/C7, C2/C3 |
| 6 | Left SI*, L5/S1, T7/T8, C1/C2 | Sacrum P-A drop***, L4/L5, T12/L1 (A), T8/T9, T5/T6, C5/C6, C1/C2 |
| 7 | Right SI*, right SI (A), Sacrum P-A drop***, T8/T9, T3/T4, C7/T1, right C0/C1 (A on light setting), C1/C2 (A, on light setting) | Right medial knee (A), Sacrum P-A drop***, L4/L5, T9/T10, T7/T8, T3/T4, C6/C7, C1/C2 |
| 8 | Sacrum P-A drop***, L3/L4, T12/L1 (A), T8/T9, T5/T6, C5/C6, C0/C1 | Right SI*, right SI (A), Sacrum P-A drop***, T6/T7, T3/T4, C7/T1, right C0/C1 (A on light setting), C1/C2 (A, on light setting) |
| 9 | Sacrum P-A drop***, T12/L1 (A), C7/T1, C2/C3 | Right SI*, L4/L5, T12/L1 (A), T8/T9, T5/T6, C5/C6, C1/C2 |
| 10 | Right medial knee (A), Sacrum P-A drop***, L1/L2, T8/T9, T3/T4, C6/C7, C0/C1 | Left medial knee (A), right SI*, Left illium P-A (A), L5/S1 (A), T8/T9, T4/T5, C7/T1, C5/C6, C1/C2 |
| 11 | Sacrum P-A drop***, T12/L1 (A), C7/T1, C1/C2 | Sacrum P-A drop***, T12/L1 (A), C7/T1, C2/C3 |
| 12 | Right SI*, Sacrum P-A drop***, L2/L3, T8/T9, C2/3 | Right SI*, Sacrum P-A drop***, L4/5 (A), T9/T10, T5/T6, C6/C7, C0/C1 |
| 13 | Left SI*, L5/S1 (A), T10/T11, T4/T5, C7/T1, C0/C1 | Right SI*, L4/L5, L1/L2, T4/T5, T7/T8, C6/C7, C0/C1** |
| 14 | Right SI*, T11/T12, C0/C1 | Right SI*, L5/S1, T7/T8, C1/C2 |
Note in description that these are the specific motion segments the High-Velocity Low-Amplitude (HVLA) thrust was directed at, e.g., the joints between C2 and C3 are denoted C2/C3. If no Asterisk, the segment was adjusted with an HVLA manual thrust. SI, Sacroiliac joint; C0/C1, occiput to C1 joint; P-A drop, a posterior to anterior direction thrust was applied by hand with the addition of the drop piece on a drop piece table (described in the text under intervention). (A) = Activator HVLA adjustment was given (i.e., not manual). * SI, ** C0/C1 refers to the motion segment between occiput and C1, *** P-A drop, refers to applying a thrust to the sacrum base in a posterior to anterior direction, on a specially build adjustment table that has a drop piece.
The control intervention acted as a physiological control for possible changes occurring due to the cutaneous, muscular, or vestibular input that would have occurred with the movements involved in preparing a patient for chiropractic spinal adjustments. The chiropractor applied a sham spinal adjustment by passively moving the subject’s head, spine, and body into positions approaching those used in the chiropractic adjustment intervention group. However, the chiropractor took care to not provide a manipulative thrust/impulse or to take a spinal motion segment to the end-range tension.
The EEG was recorded at a sampling rate of 2048 Hz from 62 channels using a REFA
amplifier (TMSi, Twente, The Netherlands) according to the 10–20 electrode
system. The ground electrode was placed at AFz. The impedance of the electrodes
was kept below 10 k
The resting-state EEG was recorded for five minutes. For artifact detection and
correction, the preprocessed EEG was high-pass filtered using a Kaiser- windowed
finite impulse response (FIR) filter (
2.4.1.1 Spatio-spectral Power
The data was analysed using a Fourier basis and a 2-second Hanning window to calculate power spectra between 1 and 80 Hz. The average power of the five frequency bands (delta (1–4 Hz), theta (4.1–8 Hz), alpha (8.1–12 Hz), beta (12.1–32 Hz), and gamma (32.1–80 Hz)) was then computed.
2.4.1.2 Source Localization
The low-resolution brain electromagnetic tomography (LORETA-KEY) software (version: 20151222, University of Zürich, Zürich, Switzerland) was used to estimate the localization of electrical activity in the brain during rest [46]. To locate the source of brain activity, standardized low-resolution brain electromagnetic tomography (sLORETA) was used. This method is a linear inverse algorithm that estimates the distribution of cortical generators of the EEG in three dimensions. Compared to other linear inverse methods, it has the lowest localization error [46]. The implementation of sLORETA uses a reference brain from the Montreal Neurological Institute (MNI-152), with cortical grey matter divided into 6239 voxels at a 5 mm resolution [47].
Smooth power spectral density was obtained by segmenting the EEG into 8-second epochs for sLORETA analysis. For sessions with clean data that were longer than 2 minutes, we randomly chose 15 epochs to equalize data length across subjects and sessions. In the sLORETA, the cross-spectral matrices were computed for each subject in the frequency domain using the LORETA-KEY software. These matrices were calculated for the same five frequency bands as in the power spectral analysis mentioned above. Afterwards, the cross-spectral matrices were averaged for each subject and used as input for the sLORETA.
2.4.1.3 Functional Connectivity Analysis
Functional connectivity analysis involves measuring functional connectivity, which includes both linear and non-linear processes in the brain, and can be measured using phase lag index (PLI) applied to EEG signals [48]. PLI assesses non-linear relationships by quantifying the asymmetry of the distribution of phase differences between signals, focusing on true interactions and avoiding spurious correlations due to volume conduction effects [49]. PLI has been employed in attention-related studies, offering valuable insights into the communication between brain regions under varying levels of attention and cognition [50, 51]. Accordingly, these techniques are used to help understand the intricate dynamics of the brain’s functional connectivity during cognitive tasks.
PLI is a measure of connectivity that quantifies asymmetry based on the phase difference distribution between two signals, denoted as ‘x(t)’ and ‘y(t)’. We first calculated the average phase difference using Eqn. 1 to compute the PLI. This requires obtaining the phase information of the signal, which is derived from the ratio phase between the signal’s Hilbert transform and the signal itself.
The resulting phase difference can be positive, negative, or zero depending on the sign. The phase differences are evaluated across a specific window to determine the PLI, and the calculation is performed over N total samples contained within that window. This process enables us to quantify the extent of connectivity and asymmetry between the signals, providing valuable insights into the functional interactions of brain regions.
This study divided the data into narrow-band signals using a 4th-order
Butterworth filter before PLI computation. This step allowed us to extract
specific frequency bands: alpha (8–12.5 Hz), beta (12.5–30 Hz), and gamma
(30–40 Hz), based on the ranges reported previously [52]. The PLI computation
was performed between each pair of reconstructed EEG source signals. The PLI
result ranged from zero to one, with zero indicating no connectivity and one
indicating maximum connectivity. After the computation of PLI between every
source pair, the PLI data were stored in a connectivity matrix of dimension 14
| Brain regions | Abbreviations |
| Medial Orbitofrontal (Left) | L MOF |
| Medial Orbitofrontal (Right) | R MOF |
| Lateral Orbitofrontal (Left) | L LOF |
| Lateral Orbitofrontal (Right) | R LOF |
| Parahippocampal (Left) | L ParaH |
| Parahippocampal (Right) | R ParaH |
| Isthmus Cingulate Cortex (Left) | L ICC |
| Isthmus Cingulate Cortex (Right) | R ICC |
| Precuneus (Left) | L Precun |
| Precuneus (Right) | R Precun |
| Posterior Cingulate Cortex (Left) | L PCC |
| Posterior Cingulate Cortex (Right) | R PCC |
| Rostral Anterior Cingulate Cortex (Left) | L RAC |
SEPs are electrical responses generated by the nervous system in response to sensory stimuli, typically involving the stimulation of peripheral nerves. These potentials are recorded through electrodes placed on the scalp or over specific regions of the body. SEPs provide valuable information about the integrity and functioning of somatosensory pathways in the nervous system. When a sensory stimulus, such as electrical or tactile stimulation, is applied to a specific part of the body, the resulting electrical signals can be measured and analyzed. The primary components of SEPs include N20, P25, N30, and P45, each corresponding to different stages of sensory processing along the neural pathway. Various peripheral nerves, including the median, ulnar, radial, tibial, peroneal, femoral, sural, and superficial radial nerves, can be stimulated to evoke somatosensory evoked potentials, enabling a comprehensive assessment of sensory pathways in both upper and lower limbs.
2.4.2.1 Median Nerve Stimulation
The median nerve was stimulated using electrical pulses delivered by the electrical stimulator (Digitimer DS7AH, Digitimer Ltd, Hertfordshire, UK) to evoke SEPs. Median nerve SEPs were chosen for this first pilot study because previous research has shown that chiropractic adjustments alter the median nerve-induced N30 SEP peak in younger, healthier populations. [24, 31, 45, 54, 55]. The stimulation electrodes (Neuroline 700, AMBU A/S, Ballerup, Denmark) were placed at the wrist. The motor threshold was defined as the lowest current intensity which elicited a visible twitch of the thumb. Before and after each intervention, a total of 1000 electrical pulses were given to the right median nerve [30, 31, 45]. The stimulation pulse was monophasic with a width of 0.2 ms and a frequency of 2.3 Hz [30, 31, 45]. The parameters were set based on our team’s previous research [30, 31, 45].
2.4.2.2 SEPs Peaks Analysis
In this study, we also analysed the amplitudes of N30 SEP peaks using the EEG recorded during median nerve stimulation. For artifact detection and correction, the PREPed EEG was high-pass filtered using a with a cutoff frequency of 1 Hz. The epochs were extracted from 100 ms before the stimulus to 150 ms after the stimulus and baseline was corrected using the pre-stimulus period. For each subject, the number of epochs in each session was equalized to the session with a minimum number of epochs (for that subject), by randomly removing clean excess epochs. Finally, the epochs were averaged.
The N30 amplitude was calculated from the frontal electrode, as done previously [31]. The greatest positive (P22) and negative (N30) peaks concerning the stimulus were identified in the time window of 15–25 ms and 25–45 ms, respectively. Afterwards, a manual inspection was performed, and an expert in SEP analysis verified the identified peaks. The N30 amplitude was defined as the absolute difference in the amplitudes of these peaks.
2.4.2.3 Source Localisation
Brain Electrical Source Analysis software (BESA) (BESA Research 5.3; MEGIS Software, Gräfelfing, Germany) was used to model brain sources in the 18–60 ms post-stimulus period. The first step involved calculating the potential distributions over the scalp using preset voltage dipoles within the brain. Next, the recorded and calculated field potentials were compared to assess their agreement. To proceed with further analysis, the residual variance (i.e., the percentage of data the model could not explain) was required to be less than 10%. To achieve this, a four-shell ellipsoidal model with a radius of 85 mm was used.
The initial models were based on pre-session grand averages to estimate source location and number. Individual pre-sessions were then analyzed with LORETA to guide source estimation. LORETA is a current density model that generates blurry source images, requires no prior constraints, and has high accuracy [56]. After placing the dipoles, their locations were fixed, and orientations were allowed to move freely to obtain the model fit. The model was then applied to the associated post-sessions. The brain source strengths for the N30 peak were calculated by determining the area under the curve (AUC) between 20 and 60 ms post-stimulus from the exported source activation waveforms in MATLAB.
The raw EEG was truncated to keep up to an additional 30 s of data at the beginning and end of the recordings to reduce filter artifacts. The early-stage EEG processing pipeline (PREP) [57] identified bad channels, removed line noise, and provided the average referenced data. For both resting-state EEG and SEPs, an epoch-based cleaning method was employed. Epochs for SEPs were extracted from 100 ms pre-stimulus to 150 ms post-stimulus. Baseline correction was applied using the pre-stimulus period. We also divided resting-state EEG into 0.5 s epochs. We marked epochs bad if, for any channel: (i) the amplitude was greater than 100 µV, (ii) peak-to-peak amplitude was more than 150 µV, (iii) the amplitude was greater than 100 µV in a step-function with a sliding window 200 ms wide with a step size of 50 ms, (iv) sample-to-sample difference was more than 50 µV, or (v) the amplitude was less than 1 µV for 150 ms (i.e., flat-lined data). All the epochs were also verified manually by visualisation to classify them as good or bad epochs. The step-like artifacts in the frontal channels, which were related to eye blinks and movements, were not removed [58].
The high-pass filtered EEG was down sampled to 512 Hz and epoched in a similar
way as described above. The bad epochs and bad channels (from PREP) were removed
from the data, and adaptive mixture independent component analysis was used to
decompose EEG signals into independent spatial and temporal components [59]. This
algorithm was chosen because it outperforms other independent component analysis
(ICA) algorithms [60]. The ICA weights obtained were applied to the EEG data
obtained after the PREP pipeline. A Kaiser-windowed FIR filter (
The data were excluded if: (i) the semi-automated epoch classification approach mentioned above failed due to high levels of noise, making it difficult for the automatic methods to mark epochs as bad (e.g., all epochs marked bad), and it was impossible to visually verify whether the epochs marked are correct or not, (ii) the number of good ICs was zero after ICA classification.
The data are presented as mean
Non-parametric cluster-based permutation tests [63] were used to evaluate the differences between interventions based on the global power spectrum of the resting state using a cluster threshold of 0.05. The clusters were identified as two or more channel-frequency pairs, each having a p-value of less than 0.05 from the paired t-test (two-tailed). The maximum of cluster-level statistics was determined by adding the t-values within each cluster. If the Monte Carlo probability for each tail exceeded the threshold of 0.025 compared to the reference distribution, which was approximated by the Monte Carlo method with 5000 permutations, the cluster was considered significant.
The LORETA-KEY software was used to perform a statistical procedure for source localization of resting-state EEG. Non-parametric mapping [64] was used, which utilized Fisher’s random permutation test with 5000 randomizations to control for the multiple comparison problem. A paired two-tailed t-test was used to find differences in the current sources across different frequency bands. The tests were used to identify differences between the pre-sessions, the post- and pre-chiropractic sessions, and the post- and pre-control sessions.
In this study, we employed GraphVar (Charité Universitätsmedizin,
Berlin, Germany), a toolbox by [65], to analyse 14
A mixed-effects model was used to identify the effects of the intervention on the SEPs, with intervention (control and chiropractic) and session (pre and post) as fixed effects and subjects as a random effect. The akaike information criterion corrected (AICc) values were used to evaluate the choice of the link function (identity or log). Based on the AICc values, we used a gamma distribution-based model with a log link for Alzheimer’s data and a linear model with an identity link for Parkinson’s data. The statistical procedure was performed in R software (version 4.0.4, Vienna, Austria) using lme4 package version 1.1.26 [67]. The contrasts were obtained using the emmeans package version 1.5.4 (https://CRAN.R-project.org/package=emmeans) [68], adjusted for multiple comparisons using Tukey’s honestly significant difference test (HSD).
Two-way repeated-measures analysis of variances (ANOVAs) were conducted, using intervention (control and chiropractic) and session (pre and post) as factors, to determine the effects of the treatment on brain source strengths. Pairwise comparisons were performed using Tukey’s HSD. The statistical analysis was conducted using MATLAB 2015b (The MathWorks, The MathWorks, Inc., Natick, MA, USA).
Eighteen individuals with Alzheimer’s disease and 17 individuals with
Parkinson’s disease were assessed for eligibility, of which 14 Alzheimer’s and 14
Parkinson’s participants met the eligibility criteria and were enrolled in the
study. Fourteen individuals with Alzheimer’s disease [age (mean
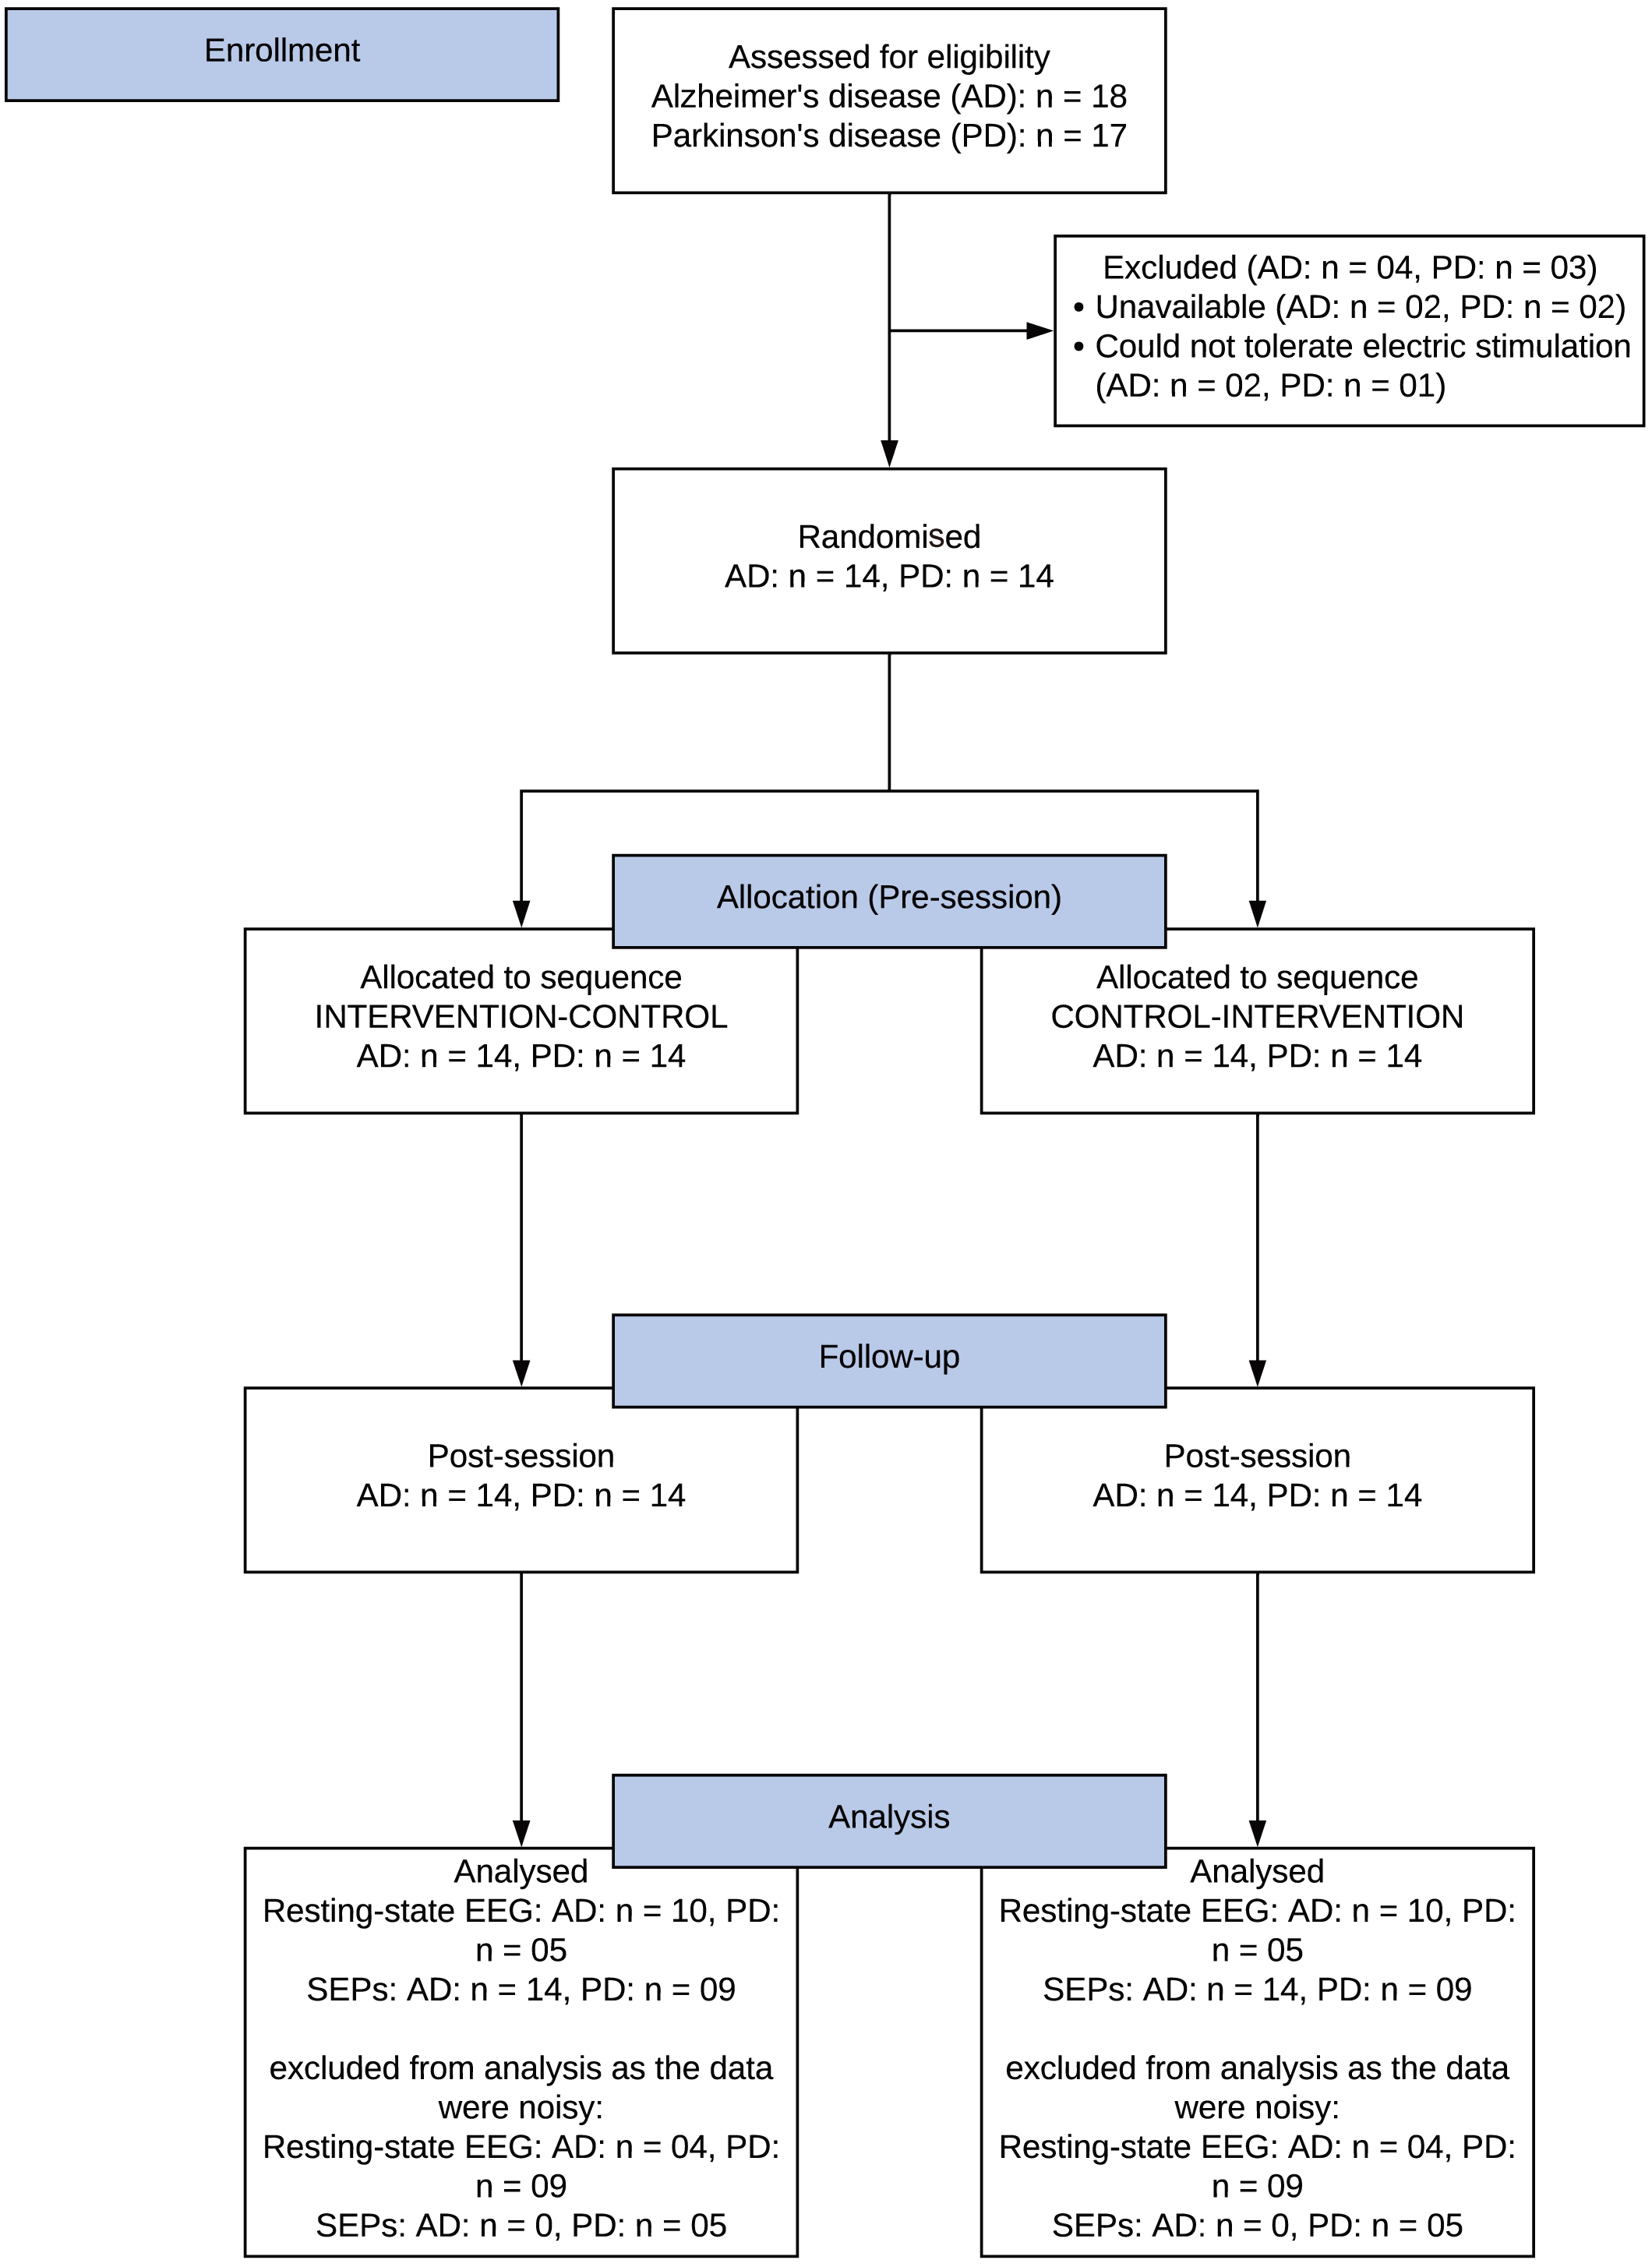 Fig. 2.
Consolidated Standards of Reporting Trials (CONSORT) study flow diagram. AD, Alzheimer’s disease; PD, Parkinson’s disease; EEG, electroencephalography; SEPs, somatosensory evoked potentials.
| Alzheimer’s disease | Parkinson’s disease | ||
| Age (mean |
67 |
62 | |
| Gender (F:M) | 2:12 | 1:13 | |
| Disease duration (years |
2 |
5.04 | |
| Baseline functional mobility and strength: | |||
| (1) Timed Up and Go Test (seconds |
(1) 9.76 |
(1) 9.70 | |
| (2) 10-Meter Walk test (metres per second |
(2) 5.33 |
(2) 5.47 | |
| (3) 5 Times Sit-to-Stand Test (seconds |
(3) 15.29 |
(3) 12.36 | |
| * n = 5 participants were unable to perform the tests | * n = 1 participant was unable to perform the tests | ||
Legend: F, Female; M, male; SD, standard deviation.
From the questions to evaluate the success of subject blinding, out of the 14 individuals with Alzheimer’s, only three felt that one of the sessions was not an active session, and one of these correctly identified the order of the interventions (chiropractic or control). Out of the 14 individuals with Parkinson’s, five felt that one of the sessions was not an active session, and two of these correctly identified the order of the interventions (chiropractic or control).
Alzheimer’s Disease: For all frequency bands, no significant differences in the power were seen between the pre-intervention sessions (one positive cluster p = 0.1170) (Fig. 3A), post- and pre-control intervention (no cluster) (Fig. 3B), and post- and pre-chiropractic spinal interventions (one negative cluster p = 0.1702) (Fig. 3C). Although not statistically significant, there was an increase in the grand-averaged absolute power across all frequency bands after the chiropractic intervention. After the control intervention, the absolute power was similar or lower in delta, beta, and gamma bands, and higher in theta and alpha bands, compared to baseline values. The difference between the two grand averages is shown in Fig. 3D.
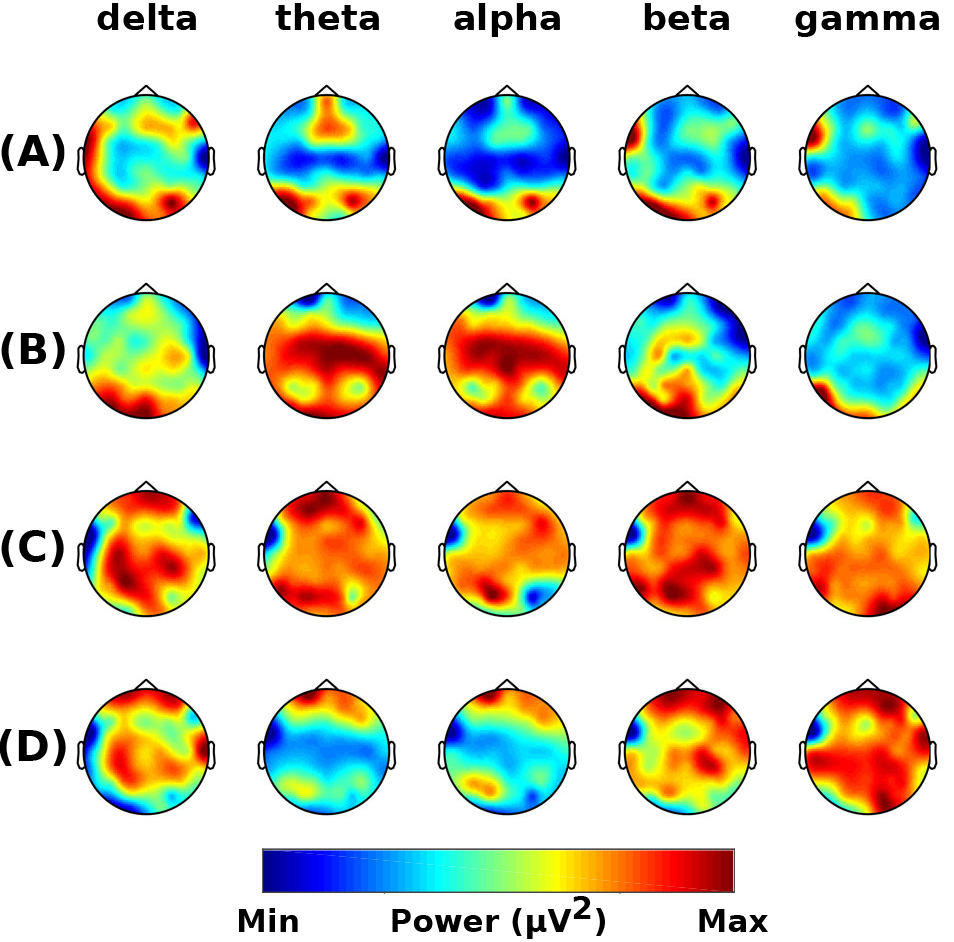 Fig. 3.
Resting-state frequency-domain analysis (Alzheimer’s Disease). Scalp topographies of the difference in grand-averaged power comparing (A) the pre-chiropractic intervention to the pre-control, (B) the post-control to the pre-control session, (C) the post-chiropractic to the pre-chiropractic session, and (D) the difference between interventions [(C) minus (B)]. Although the cluster-based permutation tests showed no significant differences in comparisons (A), (B), and (C), the absolute power in all frequency bands was found to be higher after the chiropractic intervention.
Parkinson’s Disease: For all frequency bands, no significant differences in power were seen between the pre-intervention sessions (no clusters) (Fig. 4A), post- and pre-control intervention (no cluster) (Fig. 4B), and post- and pre-chiropractic spinal interventions (no clusters) (Fig. 4C). Although not statistically significant, there was an increase in the grand-averaged absolute power across all frequency bands after the chiropractic intervention, while after the control intervention, the absolute power was similar or lower compared to baseline values. The difference between the two grand averages is shown in Fig. 4D.
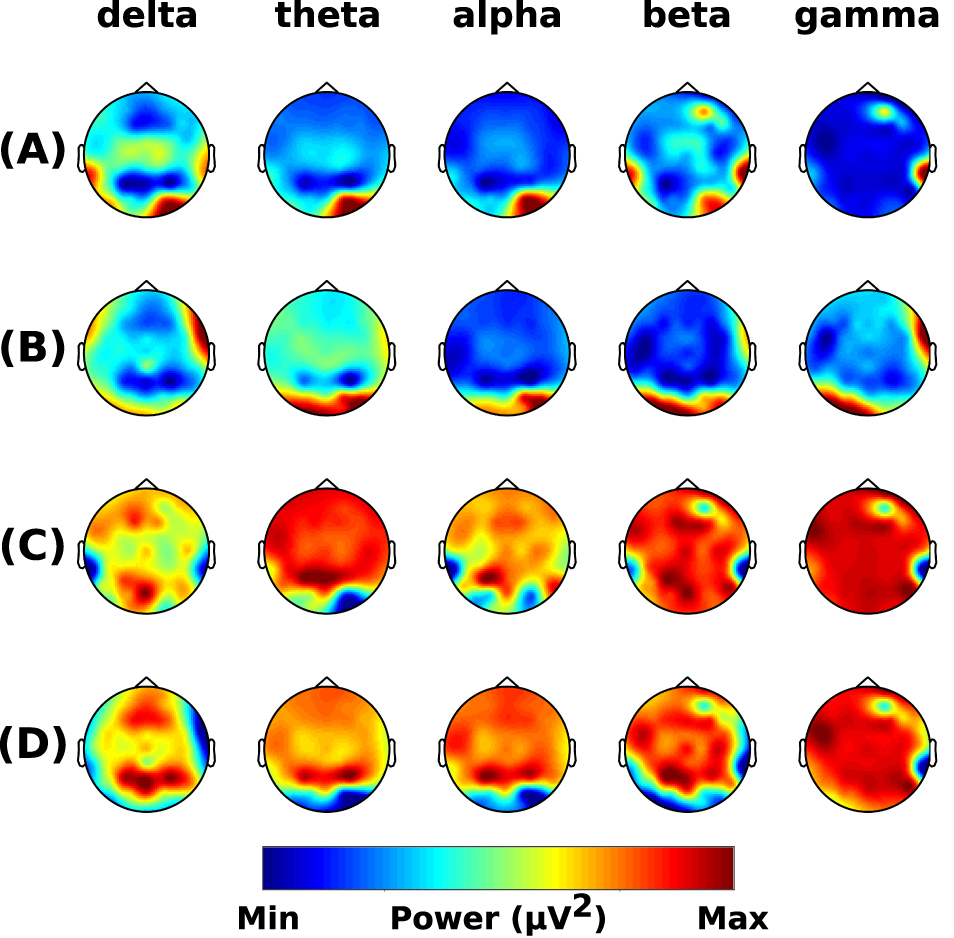 Fig. 4.
Resting-state frequency-domain analysis (Parkinson’s Disease). Scalp topographies of the difference in grand-averaged power comparing (A) the pre-chiropractic intervention to the pre-control, (B) the post-control to the pre-control session, (C) the post-chiropractic to the pre-chiropractic session, and (D) the difference between interventions [(C) minus (B)]. Although the cluster-based permutation tests showed no significant differences in comparisons (A), (B), and (C), the absolute power in all frequency bands was found to be higher after the chiropractic intervention.
In individuals with Alzheimer’s and Parkinson’s disease, the sLORETA analysis
showed that the pre-sessions were similar, and neither of the chiropractic and
control interventions had any significant effect on brain activity in any
frequency band (all p
The DMN
Alzheimer’s Disease: The findings revealed a notable enhancement in connectivity within the DMN at the alpha, beta, and theta frequency bands among individuals undergoing chiropractic treatment. Specifically, participants in this group exhibited increased connectivity among different regions of the DMN across these frequency bands (Table 4; Fig. 5). In contrast, when examining the control group’s data, a decrease in connectivity within the DMN was explicitly observed in the alpha band. However, in the analysis of beta and theta frequency bands within the control group, there was a marginal increase in connectivity, indicating some variability in network activity in these frequency range bands (Table 4; Fig. 5).
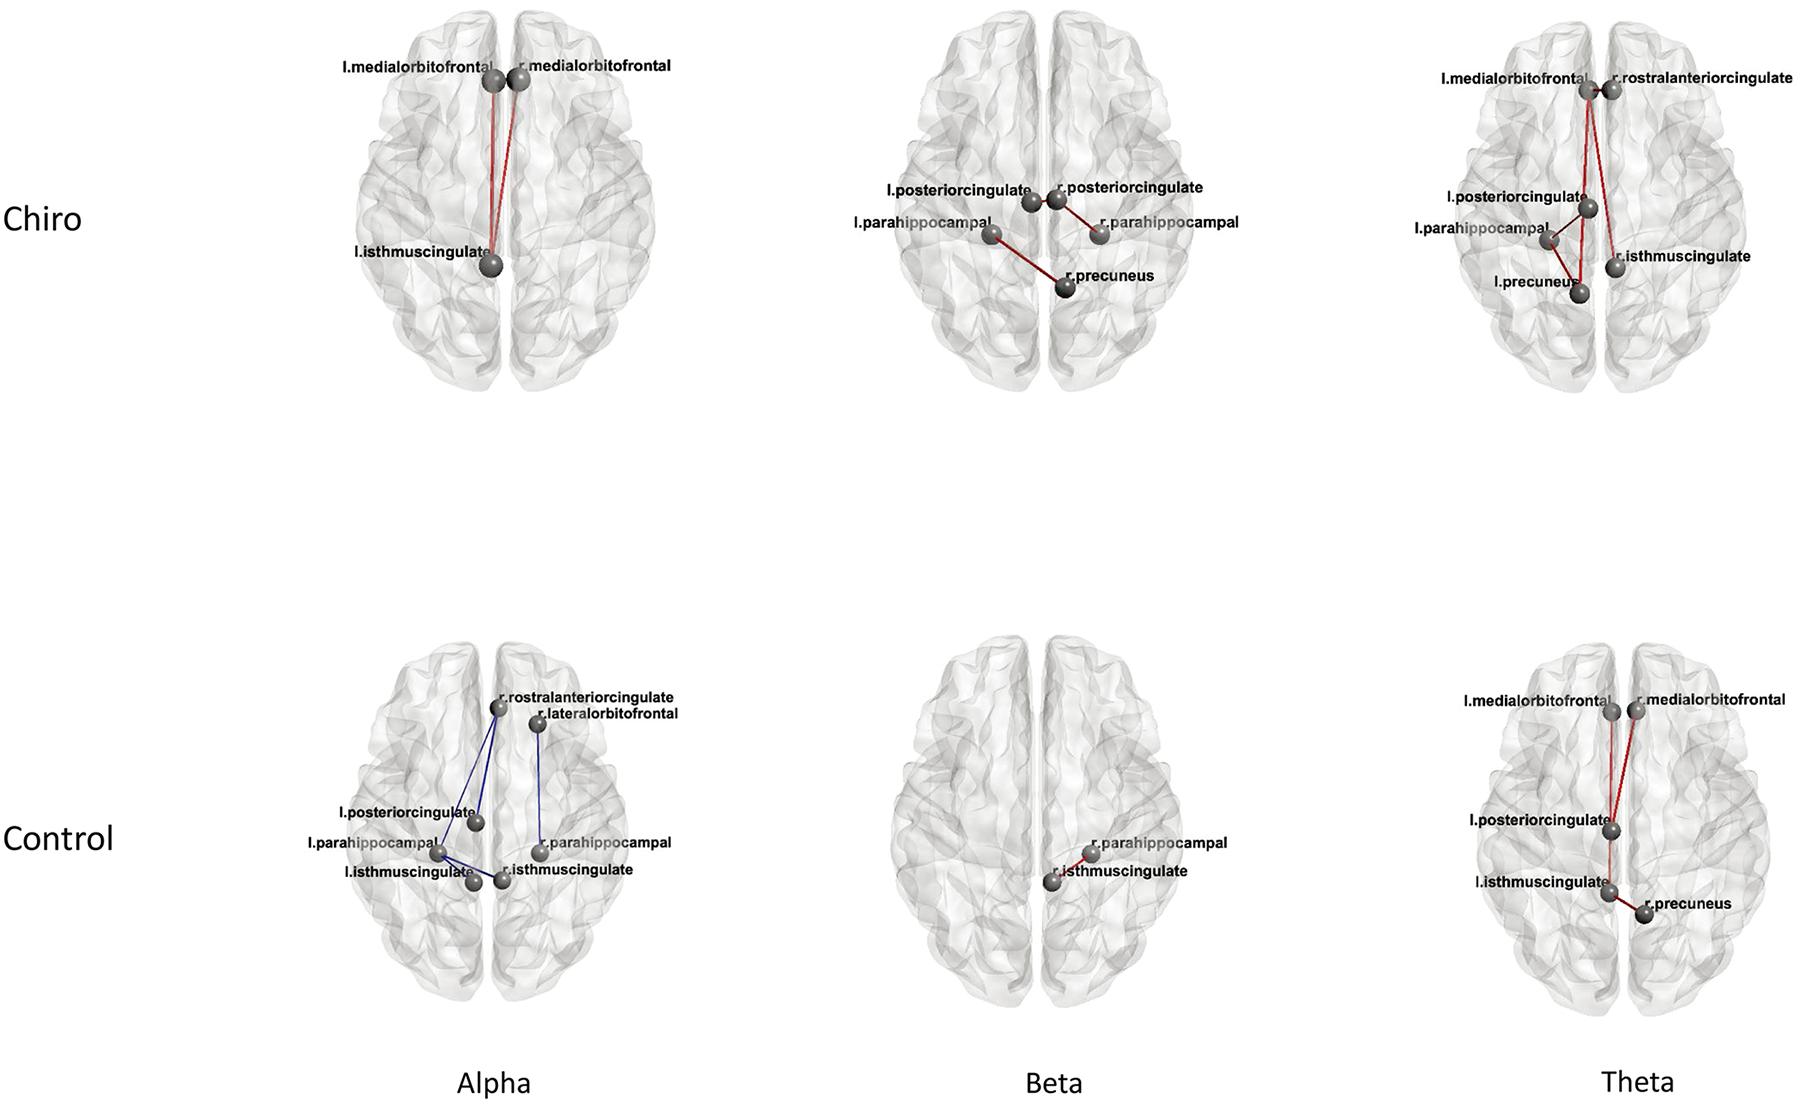 Fig. 5.
Connectivity with in DMN Alzheimer’s disease patients. DMN, default mode network.
| Group | Sessions | Frequency band | Regions | t-value | p-value | Mean difference PLI |
| Chiro | Post - Pre | Alpha | L MOF – L ICC | 2.7 | 0.02 | 0.018 |
| R MOF – L ICC | 2.3 | 0.04 | 0.017 | |||
| Beta | L ParaH – R Precun | 2.6 | 0.02 | 0.023 | ||
| R PCC – L ParaH | 2.3 | 0.04 | 0.023 | |||
| L PCC – L ParaH | 2.3 | 0.04 | 0.017 | |||
| Theta | L ParaH – L Precun | 2.6 | 0.02 | 0.009 | ||
| L PCC – L ParaH | 2.4 | 0.03 | 0.006 | |||
| L MOF – L Precun | 3.12 | 0.01 | 0.009 | |||
| L MOF – R ICC | 2.64 | 0.02 | 0.010 | |||
| L MOF – R RACC | 2.35 | 0.04 | 0.009 | |||
| Control | Post - Pre | Alpha | R LOF – R ParaH | –2.47 | 0.03 | –0.027 |
| R RACC – L ParaH | –2.42 | 0.03 | –0.010 | |||
| R RACC – L PCC | –3.39 | 0.007 | –0.018 | |||
| L ICC – L ParaH | –3.09 | 0.01 | –0.019 | |||
| R ICC – L ParaH | –6.22 | 0.0001 | –0.018 | |||
| L PCC – L ParaH | –3.44 | 0.007 | –0.015 | |||
| Beta | R ParaH – R ICC | 2.29 | 0.04 | 0.022 | ||
| Theta | R Precun – L ICC | 3.7 | 0.001 | 0.014 | ||
| L PCC – R MOF | 2.61 | 0.02 | 0.012 | |||
| L MOF – L ICC | 2.31 | 0.04 |
Legend: PLI, Phase Lag Index; L MOF, Medial Orbitofrontal (Left); R MOF, Medial Orbitofrontal (Right); R LOF, Lateral Orbitofrontal (Right); L ParaH, Parahippocampal (Left); R ParaH, Parahippocampal (Right); L ICC, Isthmus Cingulate Cortex (Left); R ICC, Isthmus Cingulate Cortex (Right); L Precun, Precuneus (Left); R Precun, Precuneus (Right); L PCC, Posterior Cingulate Cortex (Left); R PCC, Posterior Cingulate Cortex (Right); R RACC, Rostral Anterior Cingulate Cortex (Right).
Parkinson’s Disease: We examined DMN connectivity across five frequency bands and found no significant differences.
Alzheimer’s Disease: The mixed model (Table 5) showed a significant
effect of the chiropractic intervention for the N30 SEP peak amplitude
(p = 0.005). The post-hoc analysis showed that the N30 amplitude was
decreased by 15% after chiropractic spinal adjustment (post: 2.13
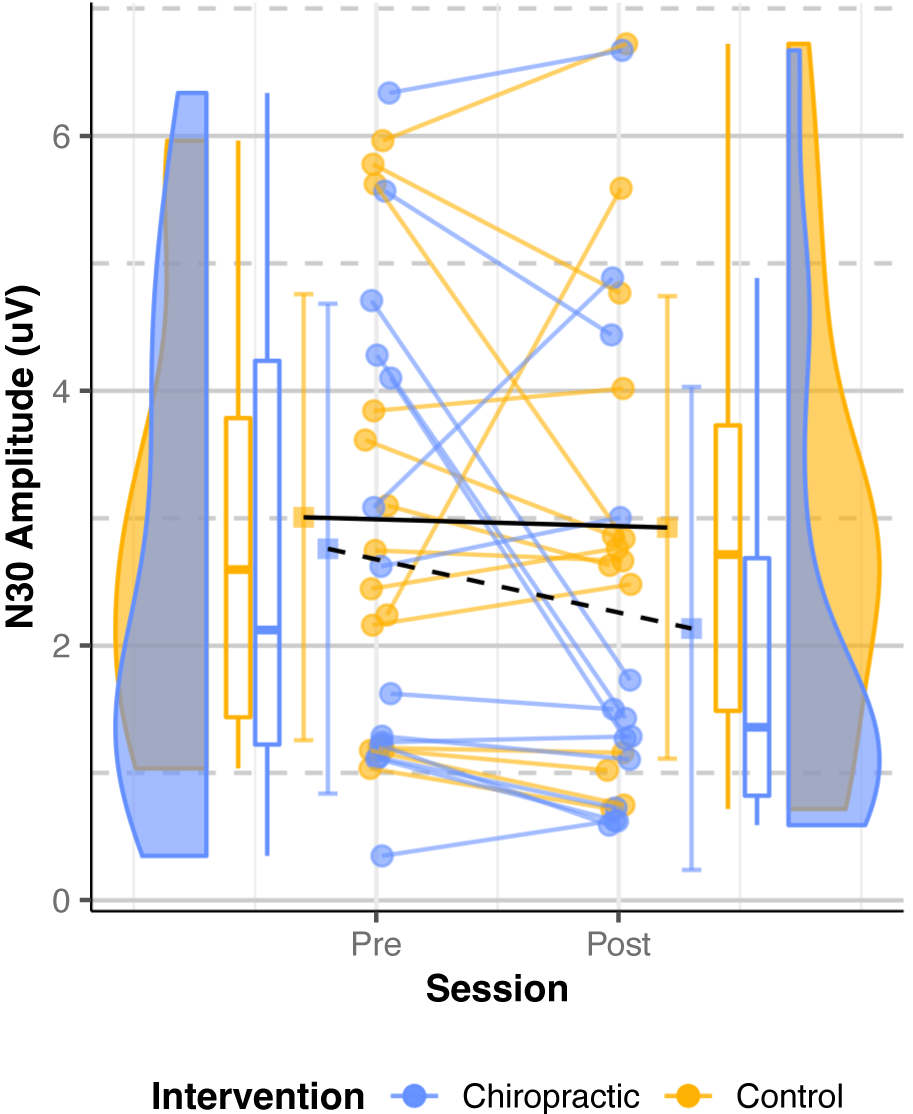 Fig. 6.
N30 SEPs amplitude (Alzheimer’s Disease). Dots represent the
N30 amplitudes from all the analyzed subjects, while the boxplots display the
median, 25th, and 75th percentiles. The error bars indicate the mean
| Predictor | Chisq | df | p-value |
| Intervention | 7.91 | 1 | 0.005 |
| Session | 3.07 | 1 | 0.079 |
| Intervention x session | 1.89 | 1 | 0.168 |
Parkinson’s Disease: Data from eight participants were analyzed as the N30 peak
for one participant could not be identified. The mixed model (Table 6) showed no
significant intervention effect and no main effects of intervention or session
for the N30 SEP peak amplitude (p
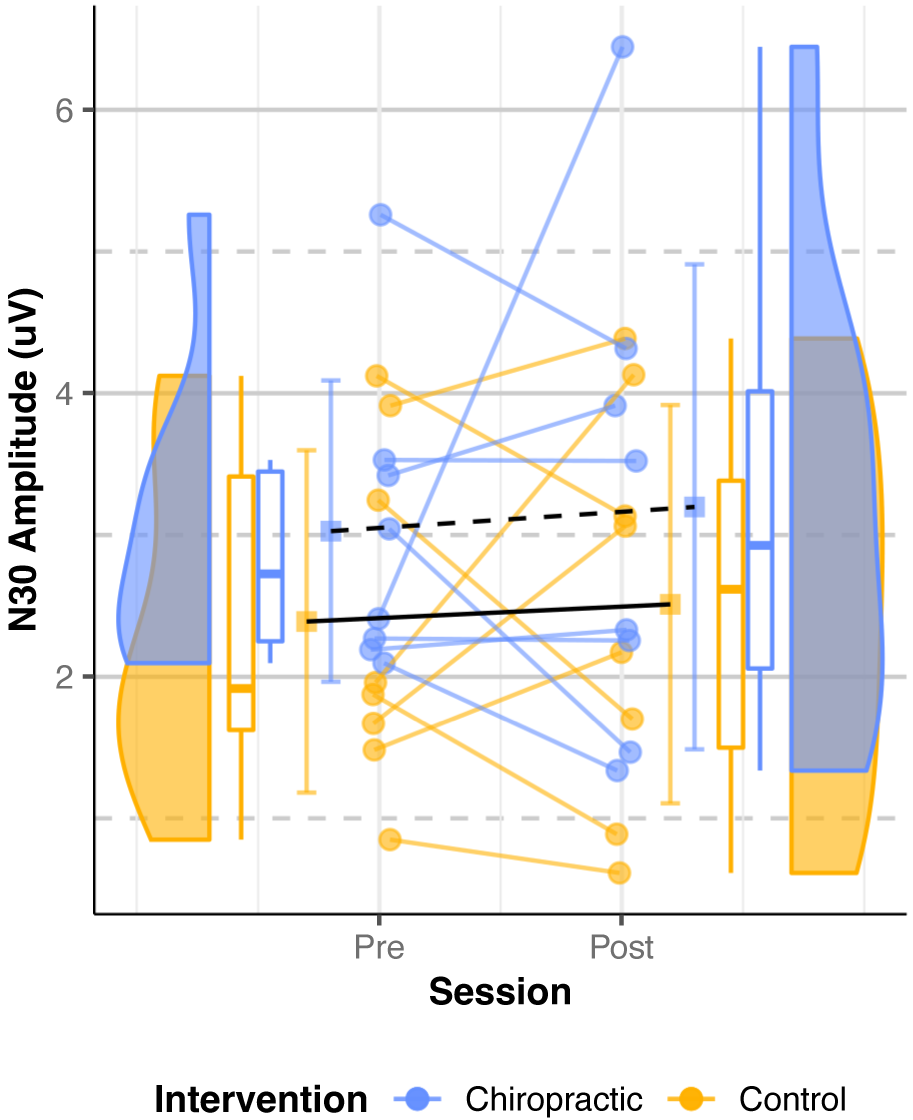 Fig. 7.
N30 SEPs amplitude (Parkinson’s Disease). Dots represent the
N30 amplitudes from all the analyzed subjects, while the boxplots display the
median, 25th, and 75th percentiles. The error bars indicate the mean
| Predictor | df_num | df_den | SS_num | SS_den | F | p-value |
| (Intercept) | 1 | 7 | 247.60 | 27.08 | 63.99 | 0.00 |
| Intervention | 1 | 7 | 3.51 | 9.44 | 2.60 | 0.151 |
| Session | 1 | 7 | 0.17 | 11.16 | 0.11 | 0.753 |
| Intervention x session | 1 | 7 | 0.00 | 4.79 | 0.01 | 0.935 |
Note. df_num indicates degrees of freedom numerator; df_den indicates degrees of freedom denominator; SS_num indicates sum of squares numerator; SS_den indicates sum of squares denominator. ANOVA, analysis of variance.
The results of the LORETA analysis showed the presence of five separate regions during the 20–60 ms time frame following the stimulus: the primary somatosensory cortex (SI) on the opposite side, prefrontal cortex, cingulate, and both secondary somatosensory cortices (SII). Based on these findings, it was assumed that there were five sources and the dipoles were placed accordingly in these regions.
Alzheimer’s Disease: Data from 13 participants were included as residual
variance for one participant was higher than the threshold (10%). The ANOVA
showed no interactions between the interventions and sessions for source
strengths (all p
Parkinson’s Disease: Data from eight participants were analyzed as N30 peak of
one participant could not be identified. The ANOVA showed no interactions between
the interventions and sessions for source strengths (all p
The current study identified no significant differences in resting-state EEG and source localization in individuals with Alzheimer’s and Parkinson’s disease. Although there was higher grand-averaged absolute power in all frequency bands after the chiropractic intervention in both groups, this finding did not reach statistical significance. While it is possible that chiropractic spinal adjustments do not alter these parameters in patients with Alzheimer’s or Parkinson’s disease, we suspect that limited sample size hindered our ability to detect significant changes in these outcomes. Previous studies have likewise shown increased grand average power in all frequency bands following chiropractic spinal adjustments in individuals with stroke as well as those with subclinical spinal disorders [30, 38]. Further research using a larger sample is needed to determine whether the observed changes are statistically significant and clinically relevant.
The current study identified no significant differences in resting-state EEG and source localization in individuals with Alzheimer’s and Parkinson’s disease. Although there was higher grand-averaged absolute power in all frequency bands after the chiropractic intervention in both groups, this finding did not reach statistical significance. While it is possible that chiropractic spinal adjustment do not alter these parameters in patients with Alzheimer’s or Parkinson’s disease, we suspect that limited sample size hindered our ability to detect significant changes in these outcomes. Previous studies have likewise shown increased grand average power in all frequency bands following chiropractic spinal adjustments in individuals with stroke as well as those with subclinical spinal disorders [30, 38]. Further research using a larger sample is needed to determine whether the observed changes are statistically significant and clinically relevant.
The current study found that the N30 amplitude of individuals with Alzheimer’s disease is reduced following chiropractic spinal adjustment, which is consistent with previous research conducted in healthy individuals or those with previous stroke. These prior studies likewise identified a reduction in the amplitude of the N30 SEP peak after chiropractic spinal adjustments [30]. As this peak likely relates to sensorimotor function [29, 30, 31], it is possible that the present findings highlight a potential mechanism for benefits of chiropractic spinal adjustments in patients with Alzheimer’s disease. Notably, two studies reported that the baseline amplitudes of N20 or N20-P25 are larger in individuals with Alzheimer’s disease [70, 71]. Accordingly, our findings could be consistent with a homeostatic mechanism of chiropractic spinal adjustments, whereby a potentially elevated SEP amplitude is decreased. However, as our study did not include a healthy control, it was not possible to determine if the pre-intervention N30 peaks were significantly elevated in our participants.
One case report described improvement of pain and sensorimotor function in a man with a rare variant of Alzheimer’s disease, posterior cortical atrophy [5]. The author suggested that improvements may have been related to neuromuscular sensory input which in turn affected the central nervous system, in turn, benefiting motor response patterns. While data on the effects of chiropractic spinal adjustments in Alzheimer’s disease is limited, our findings suggest that observed clinical benefits of spinal adjustments in these individuals could relate to a mechanism involving the sensorimotor cortex. Additional studies are needed to explore the central mechanisms underlying clinical improvements seen in neurodegenerative disease following spinal adjustments.
While the N30 SEP peak was greater in Parkinson’s disease participants after chiropractic spinal adjustments, this finding was non-significant due to exclusion of noisy data, leading to a smaller sample size. However, previous research has shown that the mean amplitude of N30 is lower in those with Parkinson’s disease compared to healthy controls [12], thus an increase in the N30 SEP peak could represent a beneficial balancing of aberrant brain activity. Although the current study could not confirm if these changes were significant, future studies using a larger sample size or different methodology may allow for verification of our preliminary findings.
In the current study, only changes in the N30 amplitude were noted. There are several explanations for a lack of significant findings in other parameters. Differences in neurodegenerative disease severity, brain function, and non-uniformity of the affected brain regions could explain a lack of pre-post changes. Several studies have reported that EEG findings correlate with the severity of Parkinson’s disease [12, 72, 73]. One study reported a significant negative correlation between the N30 amplitude and the Unified Parkinson’s Disease Rating Scale motor score [12]. Limited research also suggests that the severity of Alzheimer’s disease is associated with EEG findings [56]. Accordingly, the present study may have been confounded by variability in N30 amplitudes between participants. Future studies could therefore include a more homogenous population with respect to the severity and characteristics of neurodegenerative disease, or control for these variables using a statistical model.
In the present study, EEG recordings may have been too short in duration to capture sufficient clean data for analysis after cleaning and excluding noisy data. Longer resting-state EEG recordings (i.e., an additional two minutes) may have afforded sufficient clean data for analysis without limiting sample size. However, it is to be noted that longer recording sessions also cause fatigue, which reduces data quality.
This study was an exploratory study with a sample size of 14 per group. Due to excluding recordings with poor data quality, sample sizes were effectively reduced during analysis. Accordingly, the sample size may need to be increased to detect changes in resting-state EEG and N30 peak following spinal adjustments. Future studies that further explore the potential changes following chiropractic care for this population should consider increasing the sample size.
As patients acted as their own control in this study, it was not possible to determine changes in EEG/SEP recordings in relation to healthy participants. Such a study design would have allowed us to determine if the included patients with neurodegenerative disease had baseline EEG/SEP findings that are comparable to normative data. In addition, having a healthy control would allow us to compare the directionality of changes observed in SEP peaks to previous research. In particular, N30 peak amplitudes in Alzheimer’s disease are typically increased [70, 71], whereas N30 peak amplitudes in Parkinson’s disease are decreased [12] relative to healthy controls. If such baseline features were known in the current study, an N30 peak reduction in Alzheimer’s and augmentation in Parkinson’s disease could support a normalization of aberrant sensorimotor processing following spinal adjustments. Furthermore, clinical outcomes such as mobility, strength, and cognitive levels could also be considered in future studies to provide more clinically relevant insights.
Functional magnetic resonance imaging (fMRI) is a tool that is used to measure brain activity via changes in blood flow rather than neural activity as with EEG. Recently, studies have shown that it is feasible to obtain fMRI pre- and post-spinal adjustments to examine changes in brain connectivity [74, 75]. In addition, fMRI has also been used to examine dynamic changes in functional connectivity among patients with Alzheimer’s and Parkinson’s disease [76]. Accordingly, additional studies using fMRI could also be used to explore central neurophysiological changes following spinal adjustments in individuals with Alzheimer’s and Parkinson’s disease.
The current study highlights that resting-state EEG and SEP recordings may be feasibly obtained from individuals with Alzheimer’s and Parkinson’s disease receiving a randomized chiropractic adjustment and control intervention. The study findings provide limited evidence that a single session of chiropractic spinal adjustments reduces cortical activity related to the somatosensory evoked N30 potential in individuals with Alzheimer’s disease. Although other outcomes did not reach significance, this may have been a limitation imposed by a small sample size. Future studies could replicate the current study using a larger sample and longer EEG recordings to account for noisy data.
The numerical data supporting the conclusions of this article will be made available by the corresponding author upon request, however, the local ethics committee adhering to local data protection laws does not allow sharing of patient’s raw data.
Conceptualization: MSN, IKN, KH, HH, RJT; Literature Search: RJT, JD, IA, NK; Data Curation: MSN, IKN, KH, IA, UG, MS; Formal Analysis: MSN, UG, RJT; Funding Acquisition: HH; Investigation: MSN, IKN, KH, RBN, IA, MS; Methodology: MSN; Project Administration: MSN, IKN, HH, NK; Resources: IKN, IA, HH, UG; Software: MSN, UG; Supervision: IKN, HH; Validation: MSN, IKN, KH, UG; Visualization: MSN, MS, RJT, NK, JD; Writing – Original Draft Preparation: MSN, RJT; Writing – Review & Editing: MSN, IKN, KH, RBN, IA, MS, JD, RJT, NK, UG, HH. All authors read and approved the final manuscript. All authors have participated sufficiently in the work and agreed to be accountable for all aspects of the work.
The study was approved by the Riphah International University Research Ethics Committee, Pakistan (Riphah/RCRS/REC/000119). The study was also approved by the New Zealand College of Chiropractic Research Committee. The study was registered by the Australian New Zealand Clinical Trials Registry (registration number ACTRN12618001217291 and 12618001218280). The study was conducted in accordance with the Declaration of Helsinki. The participants gave their written informed consent to participate in the study.
We would like to acknowledge all the participants and hospital staff who helped us during the project.
This research received funding from Australian Spinal Research Foundation. This study also received co-funding from Hamblin Chiropractic Research Fund Trust and through donations to the Centre for Chiropractic Research Supporters Program at the New Zealand College of Chiropractic.
The authors declare no conflict of interest. Imran Khan Niazi is serving as one of the Editorial Board members/Guest editors of this journal. We declare that Imran Khan Niazi had no involvement in the peer review of this article and has no access to information regarding its peer review. Full responsibility for the editorial process for this article was delegated to Yoshihiro Noda.
Publisher’s Note: IMR Press stays neutral with regard to jurisdictional claims in published maps and institutional affiliations.