
- Academic Editor
†These authors contributed equally.
Background: To explore the time-frequency structure and cross-scale coupling of electroencephalography (EEG) signals during seizure in juvenile myoclonic epilepsy (JME), correlations between different leads, as well as dynamic evolution in epileptic discharge, progression and end of seizure were examined. Methods: EEG data were obtained for 10 subjects with JME and 10 normal controls and were decomposed using gauss continuous wavelet transform (CWT). The phase amplitude coupling (PAC) relationship between the 11th (4.57 Hz) and 17th (0.4 Hz) scale was investigated. Correlations were examined between the 11th and 17th scale EEG signals in different leads during seizure, using multi-scale cross correlation analysis. Results: The time-frequency structure of JME subjects showed strong rhythmic activity in the 11th and 17th scales and a close PAC was identified. Correlation analysis revealed that the ictal JME correlation first increased in the anterior head early in seizure and gradually expanded to the posterior head. Conclusion: PAC was exhibited between the 11th and 17th scales during JME seizure. The results revealed that the correlation in the anterior leads was higher than the posterior leads. In the perictal period, the 17th scale EEG signal preceded the 11th scale signal and remained for some time after a seizure. This suggests that the 17th scale signal may play an important role in JME seizure.
Juvenile myoclonic epilepsy (JME) is one of the most common types of idiopathic generalized epilepsy (IGE). The types of JME seizures include myoclonic seizures, generalized tonic-clonic seizures and absence seizures. The visual evaluation of electroencephalography (EEG) shows 3–5.5 Hz generalized spike-wave and polyspike-wave [1]. Traditionally, the initial symptomatology and EEG of IGE were considered to suggest that the hypersynchronous discharge of neurons originates bilaterally in the brain [2].
Recently, the possibility has been raised that discharge in JME has a focal origin [3, 4, 5]. One study has reported that focal or multi-focal spikes could be observed in up to 20% of JME patients during the interictal period and that they were similar to spikes observed during seizure [1]. A report published by the International League Against Epilepsy also defined generalized epilepsy as “originating at a point in the brain network and rapidly spreading to bilateral hemispheres”, a concept that includes cortical and subcortical structures in the seizure and suggests the possibility of focal abnormalities within the brain network in generalized epilepsy [6]. Although JME has generalized epileptic traits, according to neuropsychological findings, JME patients exhibit more appropriate functional impairment in the frontal lobe than other brain areas [7].
EEG signals at different frequencies hold significant physiological and
pathological implications. High-frequency oscillations between 80–500 Hz,
recorded through EEG, may be a new biomarker for epileptogenic zones [8]. These
oscillations are categorized into hippocampal ripples (80–250 Hz) and fast
ripples (
Different forms of neural synchronization in different frequency bands are thought to reflect a mechanism of neural activity. These potential neural synchronizations can be represented by using cross frequency coupling (CFC) [12, 13, 14]. Among these types of synchronization, phase amplitude coupling (PAC) is the most widely studied [15, 16, 17]. Previous studies have shown that seizures are accompanied by coupling between low-frequency rhythmic phases and high-frequency rhythmic wave amplitudes [18, 19, 20]. Ma et al. [21] discovered that in patients with frontal lobe epilepsy, PAC was weak and paroxysmal during the interictal and preictal periods, whereas during the ictal period, PAC became intense and persistent.
In clinical studies, visual evaluation of the EEG is an important tool for the diagnosis of clinical epilepsy. The EEG patterns of JME patients during seizure typically exhibit the characteristics of spike-wave and polyspike-wave in all leads. There are differences in frequency, amplitude and phase. These subtle differences may suggest important information about the origin, spreading and termination of neuronal hypersynchronous firing, but they are difficult to identify in precise detail from visual evaluation. Further quantitative studies examining how the correlation between EEG signals of different leads evolves during seizure are important for the study of the pathogenesis of epilepsy.
In the current study, wavelet transform and multi-scale correlation were used to quantify the EEG activity of JME patients during seizure. The time-frequency structure and PAC were observed in JME patients. Waveform characteristics, correlation and their dynamic evolution with seizure were examined in different leads of multi-scale EEG signals.
There were ten subjects in the JME group (mean age 20.6
| No. | Sex | Age (years) | Duration (years) | Seizure performance | EEG performance | Number of seizures recorded | Medication |
| 1 | F | 15 | 4 | Both upper limbs shaking with disturbance of consciousness in the wake up time | GSW | 1 | Topiramate, Clonazepam |
| 2 | M | 8 | 3 | Trunk jerking | GSW | 2 | Clonazepam |
| 3 | M | 42 | 20 | Limbs fluttering/Tumbling | GSW | 4 | Clonazepam |
| 4 | F | 20 | 5 | The body shaking at irregular interval with generalized myoclonus | GS | 2 | Valproic acid |
| 5 | M | 18 | 3 | Shoulders shaking with tumble | GSW, PSW, OSW | 4 | Sodium valproate |
| 6 | M | 12 | 1 | Both upper limbs shaking in the wake up time | GSW | 2 | Clonazepam, Valproic acid |
| 7 | F | 19 | 2 | Limbs shaking before falling asleep | GSW | 2 | Clonazepam |
| 8 | M | 32 | 20 | Involuntary limb shaking | GSW | 1 | Levetiracetam, Clonazepam |
| 9 | F | 13 | 2 | Limbs fluttering | GSW | 1 | Clonazepam |
| 10 | F | 27 | 14 | Limbs shaking in the menstrual period or falling asleep | GS | 2 | Clonazepam |
Note: EEG, Electroencephalography; GSW, Generalized spike-waves; GS, Generalized spikes; PSW, Parietal spike-waves; OSW, Occipital spike-waves; M, male; F, female; JME, Juvenile myoclonic epilepsy.
| JME group (n = 10) | NC group (n = 10) | Test statistic | p-value | |
| Age (years) | 20.6 |
18.3 |
0.017 (F) | 0.615 |
| Gender (M/F) | 5/5 | 2/8 | 1.978 (Chi |
0.16 |
| Epilepsy duration (years) | 3.5 (2, 15.5) | N/A | ||
| Polytherapy ( |
3 (30%) | N/A | ||
| Handedness | Right (100%) | Right (100%) |
Note: NC group, Normal control group; JME, Juvenile myoclonic epilepsy; N/A, not available.
All subjects were monitored with an EEG-2130 digital electroencephalograph
device (Nihon Kohden, Tokyo, Japan). The EEG data were collected using Ag/AgCl scalp
electrodes, placed according to the standard international 10–20 system, with
ipsilateral electrodes as reference electrodes, electrode electrical impedance
Gauss continuous wavelet transforms (CWT) were calculated as follows:
The schematic diagram of a continuous wavelet transform, as shown in Fig. 1. Table 3 gives the scale and frequency correspondence.
 Fig. 1.
Schematic diagram of continuous wavelet transform.
| Scale | 8 | 9 | 10 | 11 | 12 | 13 |
| Frequency (Hz) | 15.41 | 10.28 | 6.85 | 4.57 | 3.04 | 2.03 |
| Scale | 14 | 15 | 16 | 17 | 18 | 19 |
| Frequency (Hz) | 1.35 | 0.90 | 0.60 | 0.40 | 0.27 | 0.18 |
The CWT method was used to decompose the EEG signals. Formulae were the same as Eqns. 1,2. Wavelets of the 11th and 17th scales in the JME seizure period were extracted. The phase of the 17th scale EEG signal was used as the reference. The highest wave amplitude of the 11th scale EEG signal was extracted at different phase angles to observe the PAC relationship of the two scales during a seizure.
After decomposing the raw EEG data using CWT, the EEG signal at a given scale was extracted and the correlations between different leads at the same scale were analyzed using a correlation analysis method calculated as follows:
Where m and n represent different EEG leads, a
Characteristics of the EEG signal that can be extracted from the analysis are as follows:
(a) The raw EEG waveform at a particular scale, enables observation and comparison of the characteristics of simultaneous waveform changes between different leads.
(b) The time-frequency and structural characteristics of EEG signals at different scales on a given lead allows observation and comparison of the interrelation between different scales of EEG.
(c) The coefficients of the correlation between different leads of the EEG at a particular scale can be measured, representing the degree of correlation between two leads at the particular scale, while the dynamic evolution over time can be observed for a given time period.
All data were analyzed using the IBM SPSS Statistics 25 software (IBM SPSS Inc.,
Chicago, IL, USA). Normally distributed data are expressed as a mean
Fig. 2 shows the EEG of a JME subject. It shows a whole-brain burst of 4 Hz high amplitude spike-wave, which lasts for approximately one second. This was followed by a return to the background wave rhythm. The EEG signal JME subjects during seizure exhibited a spike-wave with higher amplitude in the frontal central region.
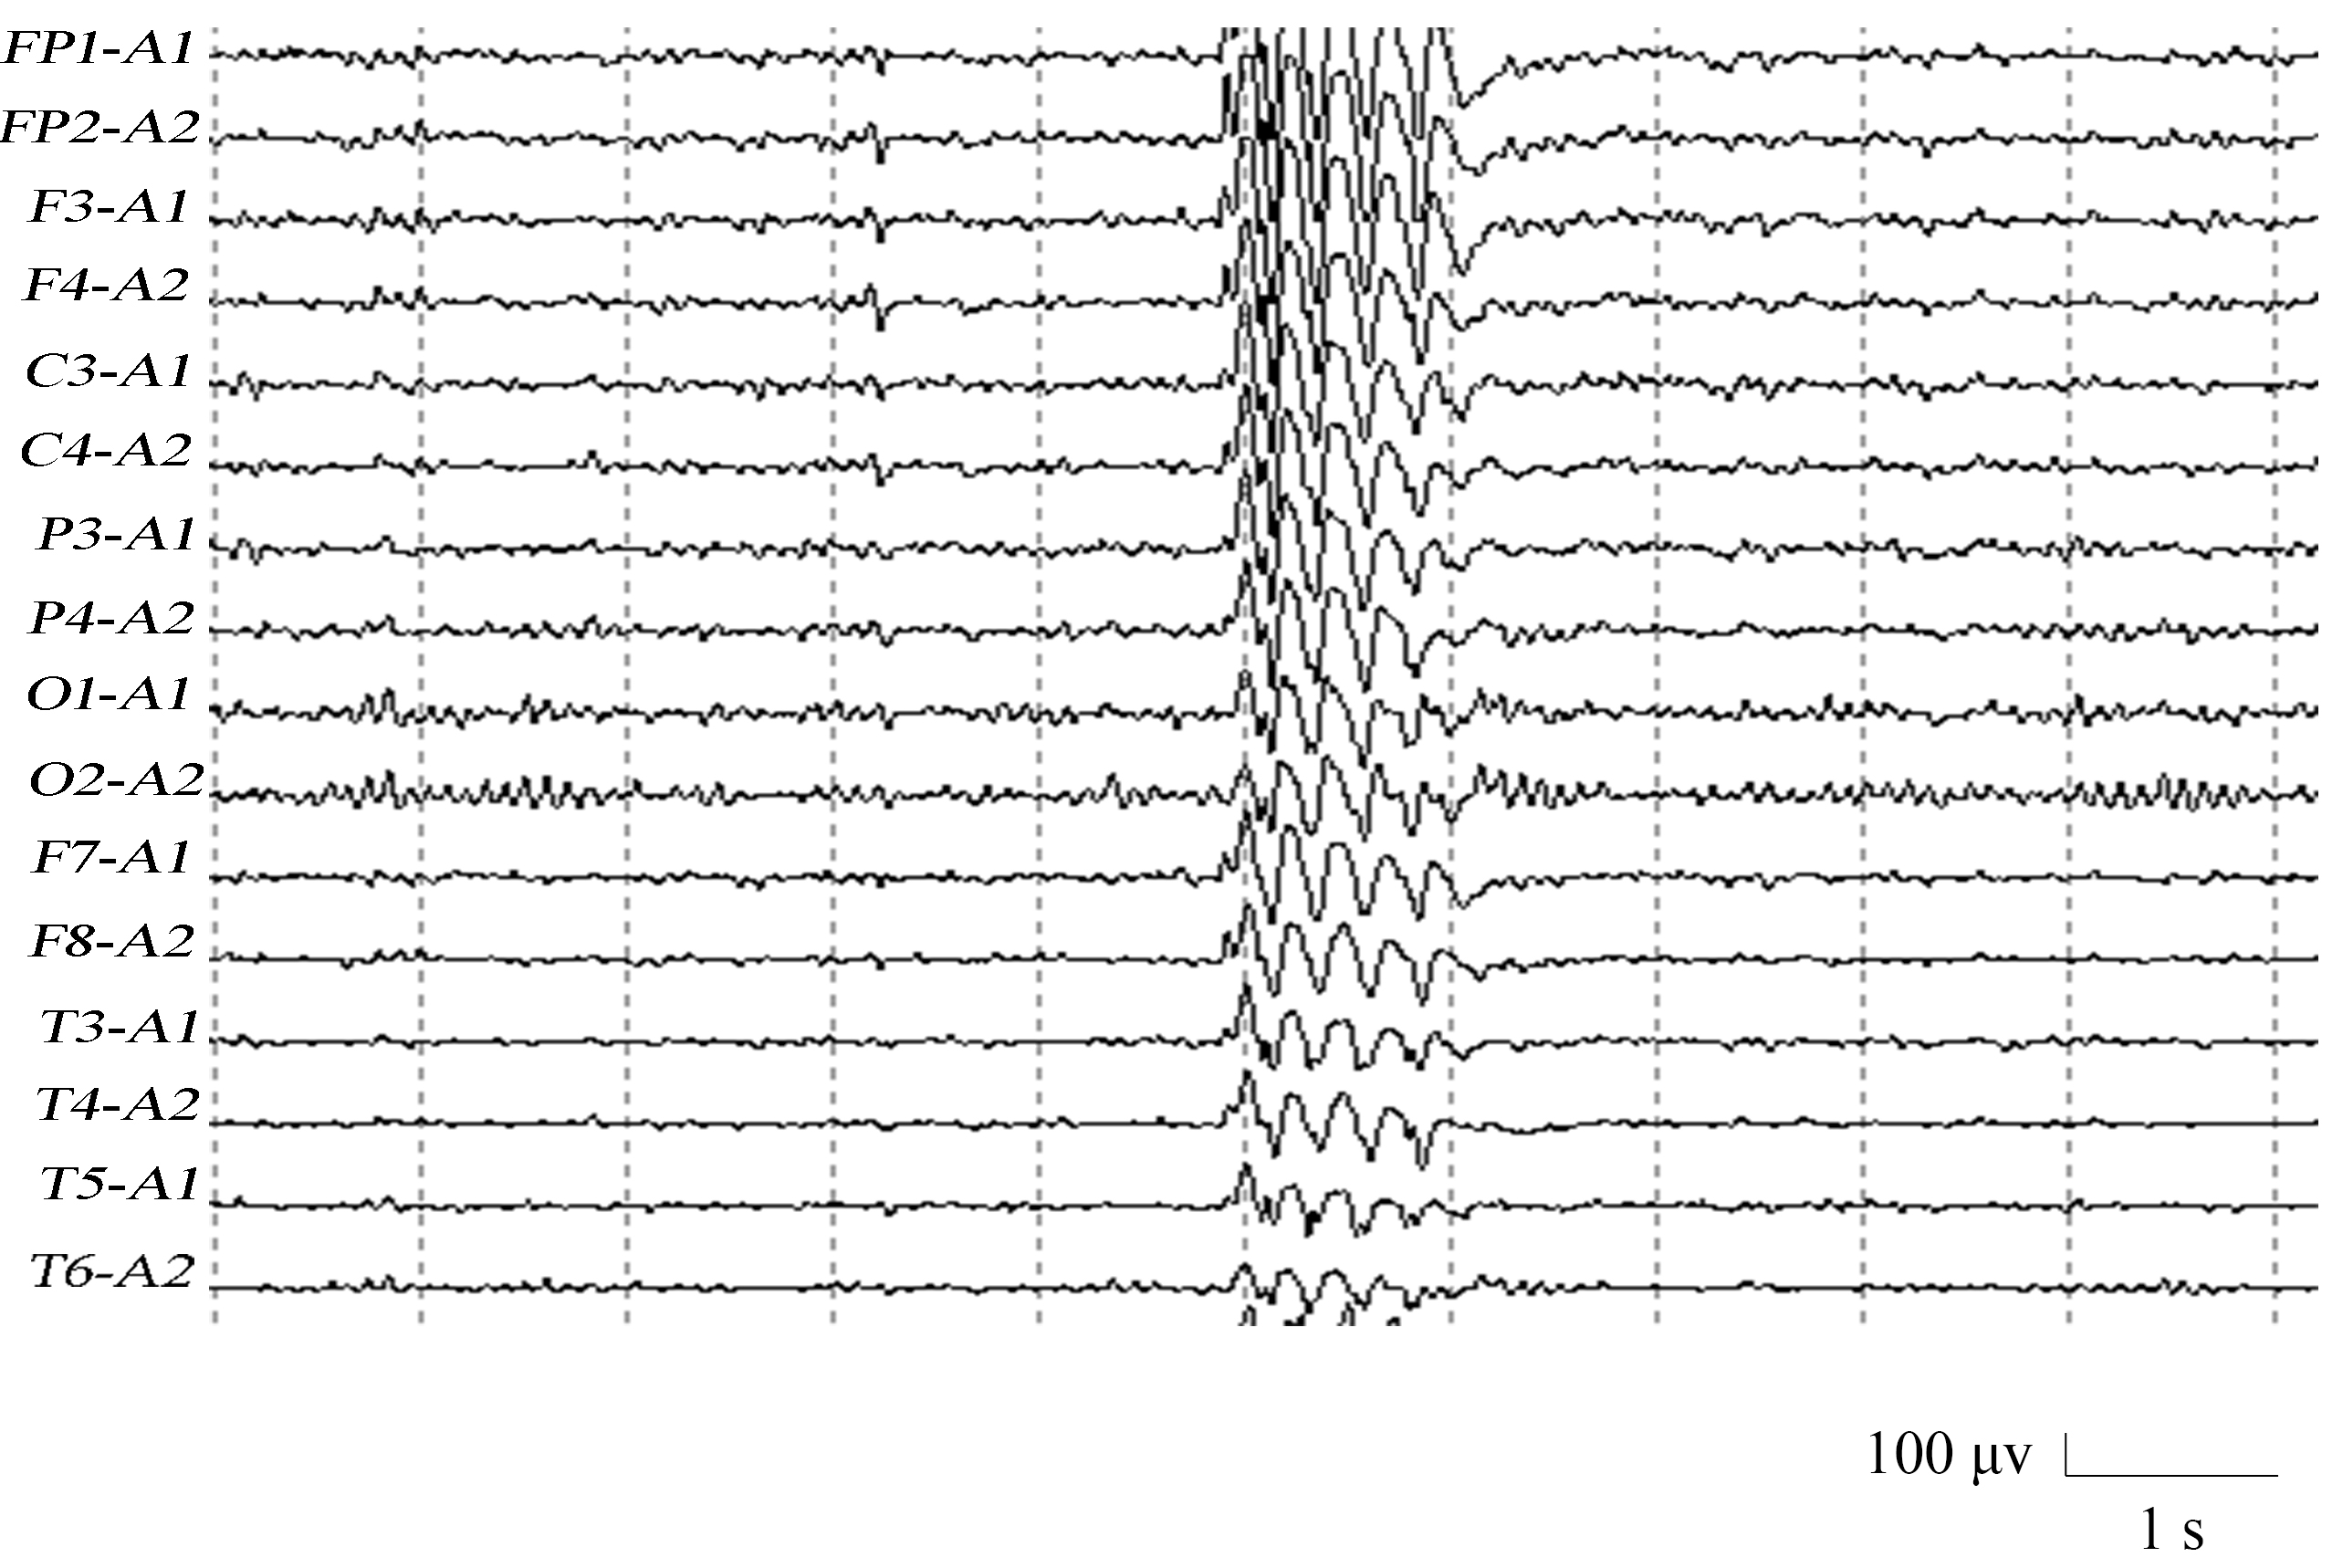 Fig. 2.
Electroencephalography (EEG) of a juvenile myoclonic epilepsy (JME) subject.
Fig. 3 shows a normal control EEG signal with an occipital rhythm, which is dominated by an 8–10 Hz alpha rhythm with several beta waves in between. It is bilaterally symmetrical and well-modulated.
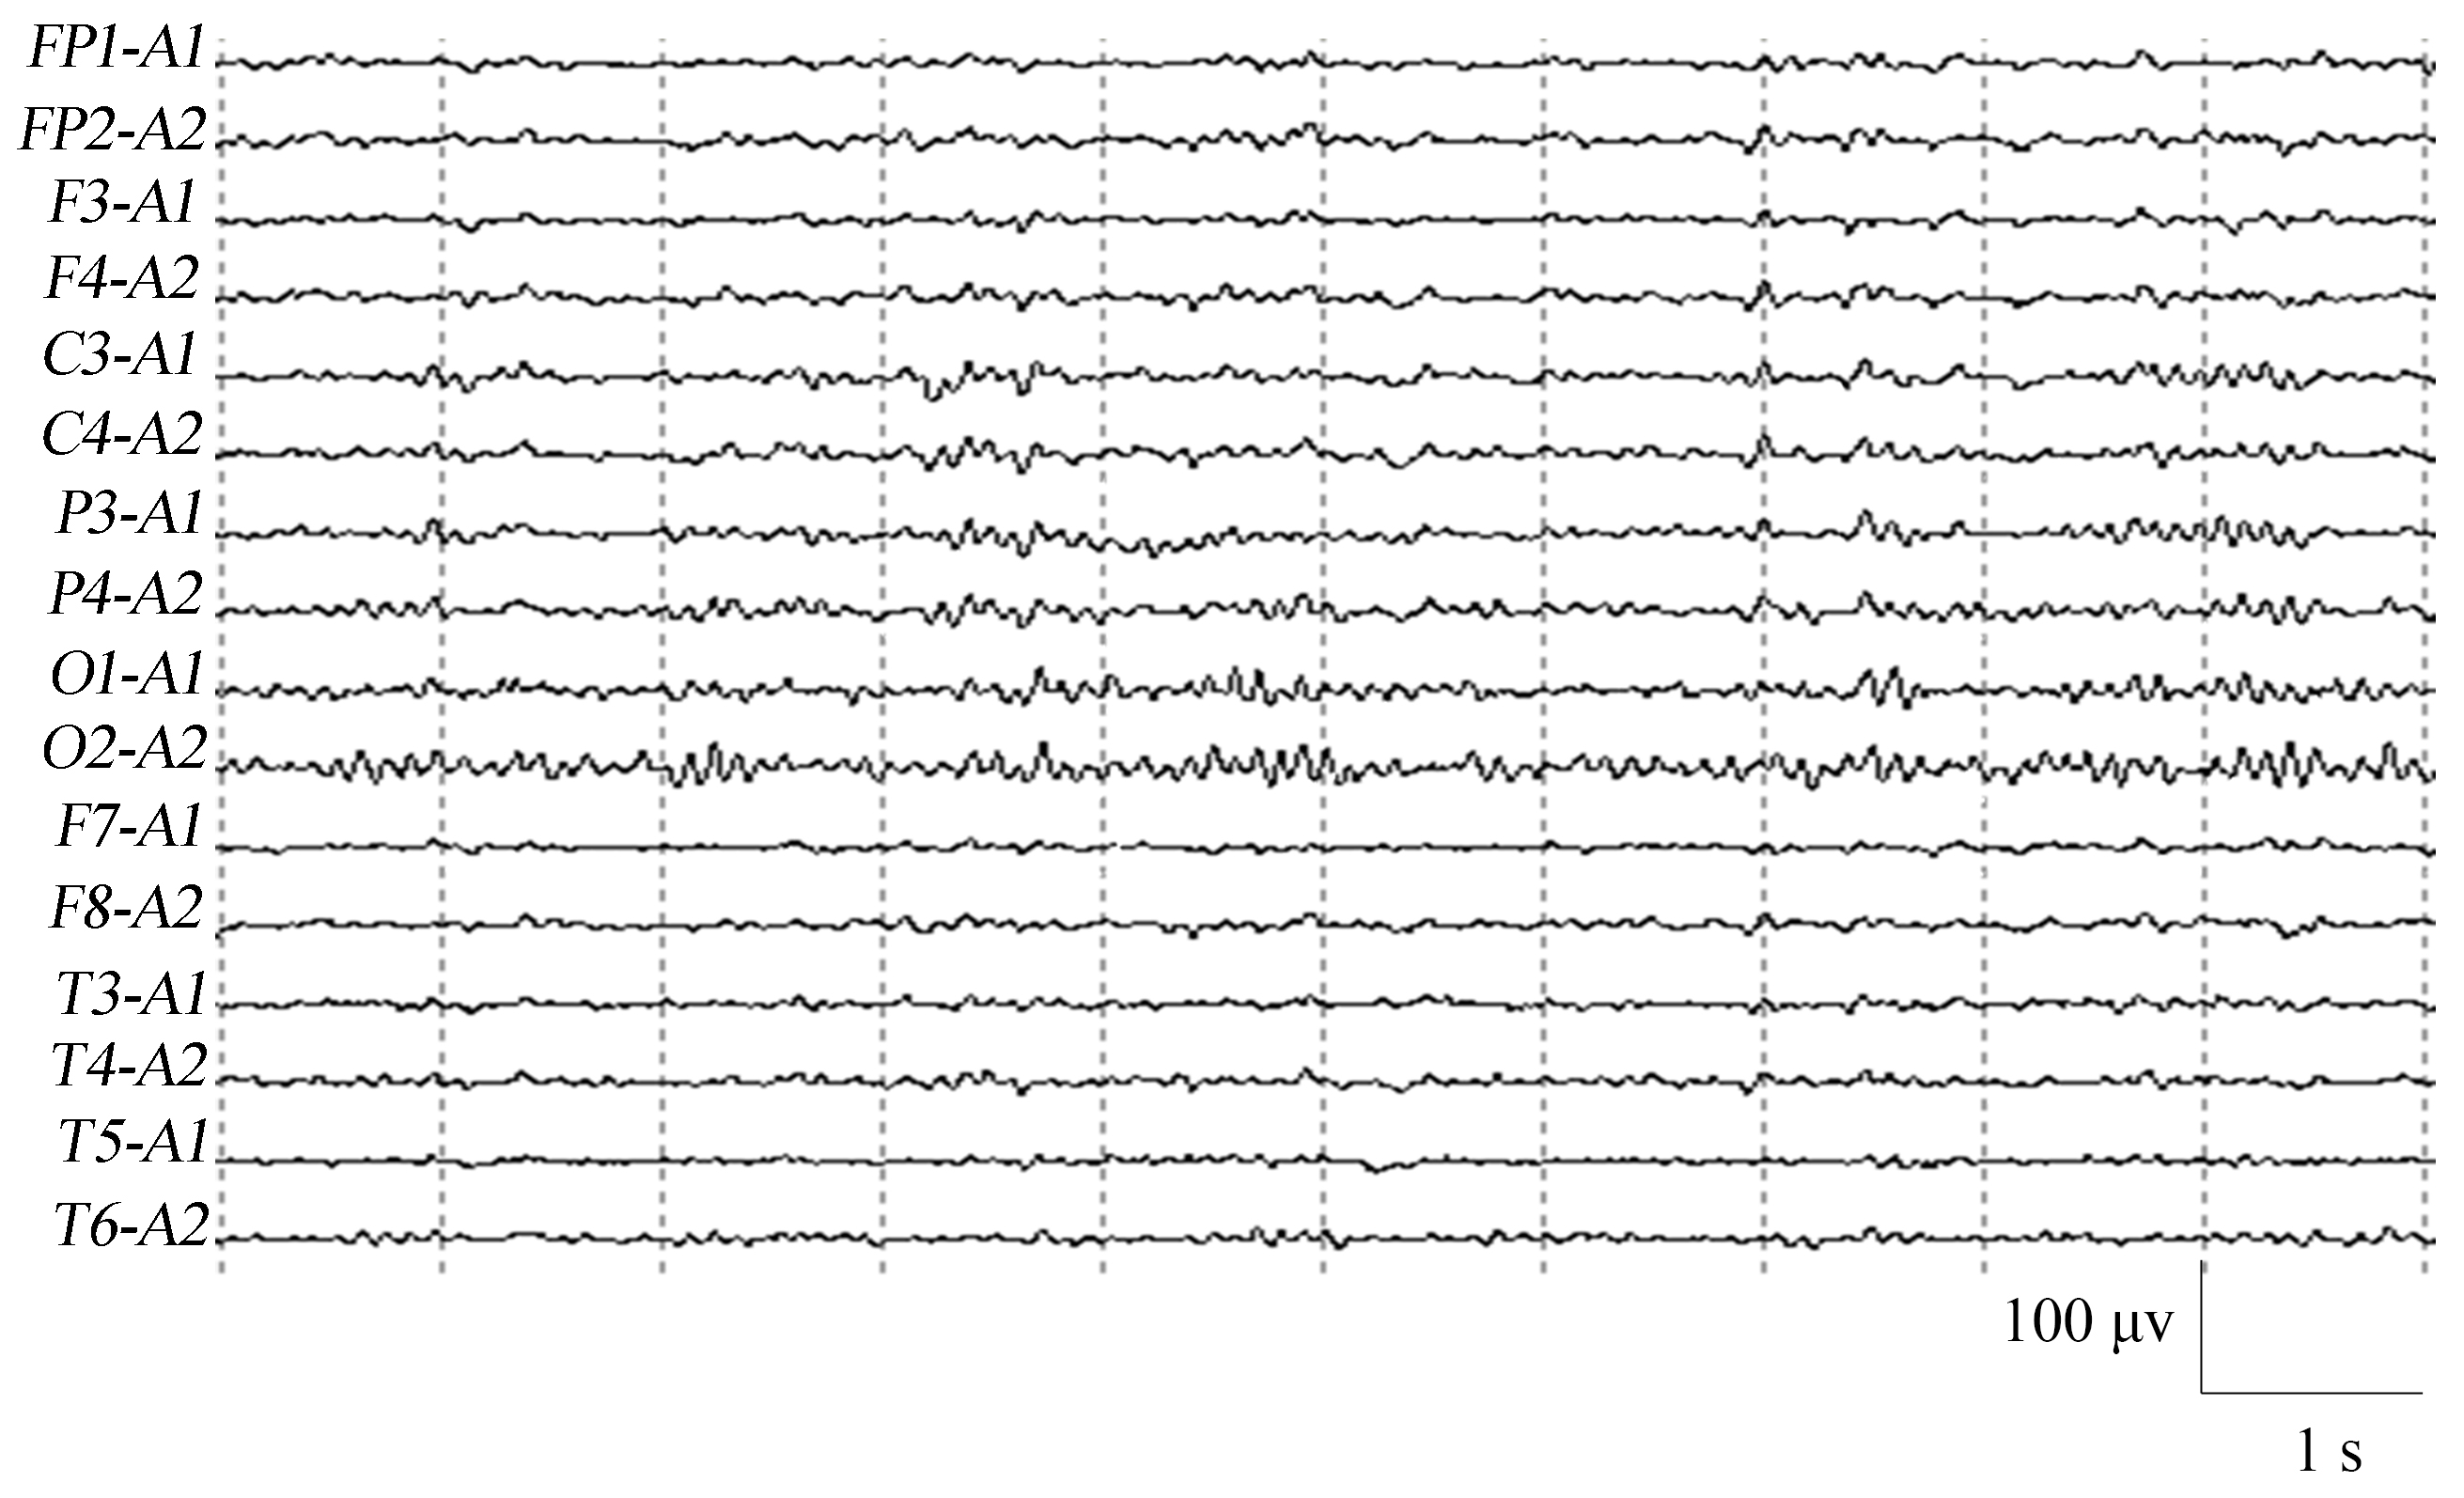 Fig. 3.
EEG of a normal control.
The time-frequency structural features of the EEG signal of JME subjects and normal controls are shown in Fig. 4. In terms of scale structure, JME patients exhibited intense rhythmic activity in the 11th and 17th scales during the seizure (Fig. 4a). In terms of time-frequency structural features, the discharge during the seizure usually started with a positive 17th scale branch, interrupted by one or more 11th scale negative and positive branches and ending with a 17th scale positive branch. The large and small scale components both continued, exhibiting a “trumpet flower” shape on the wavelet analysis contour map. The normal control group exhibited a complex scale structure, with rhythmic activity visible from scales 6 to 22. However, the overall wavelet coefficients was low and no hyperactive rhythmic activity was present (Fig. 4b).
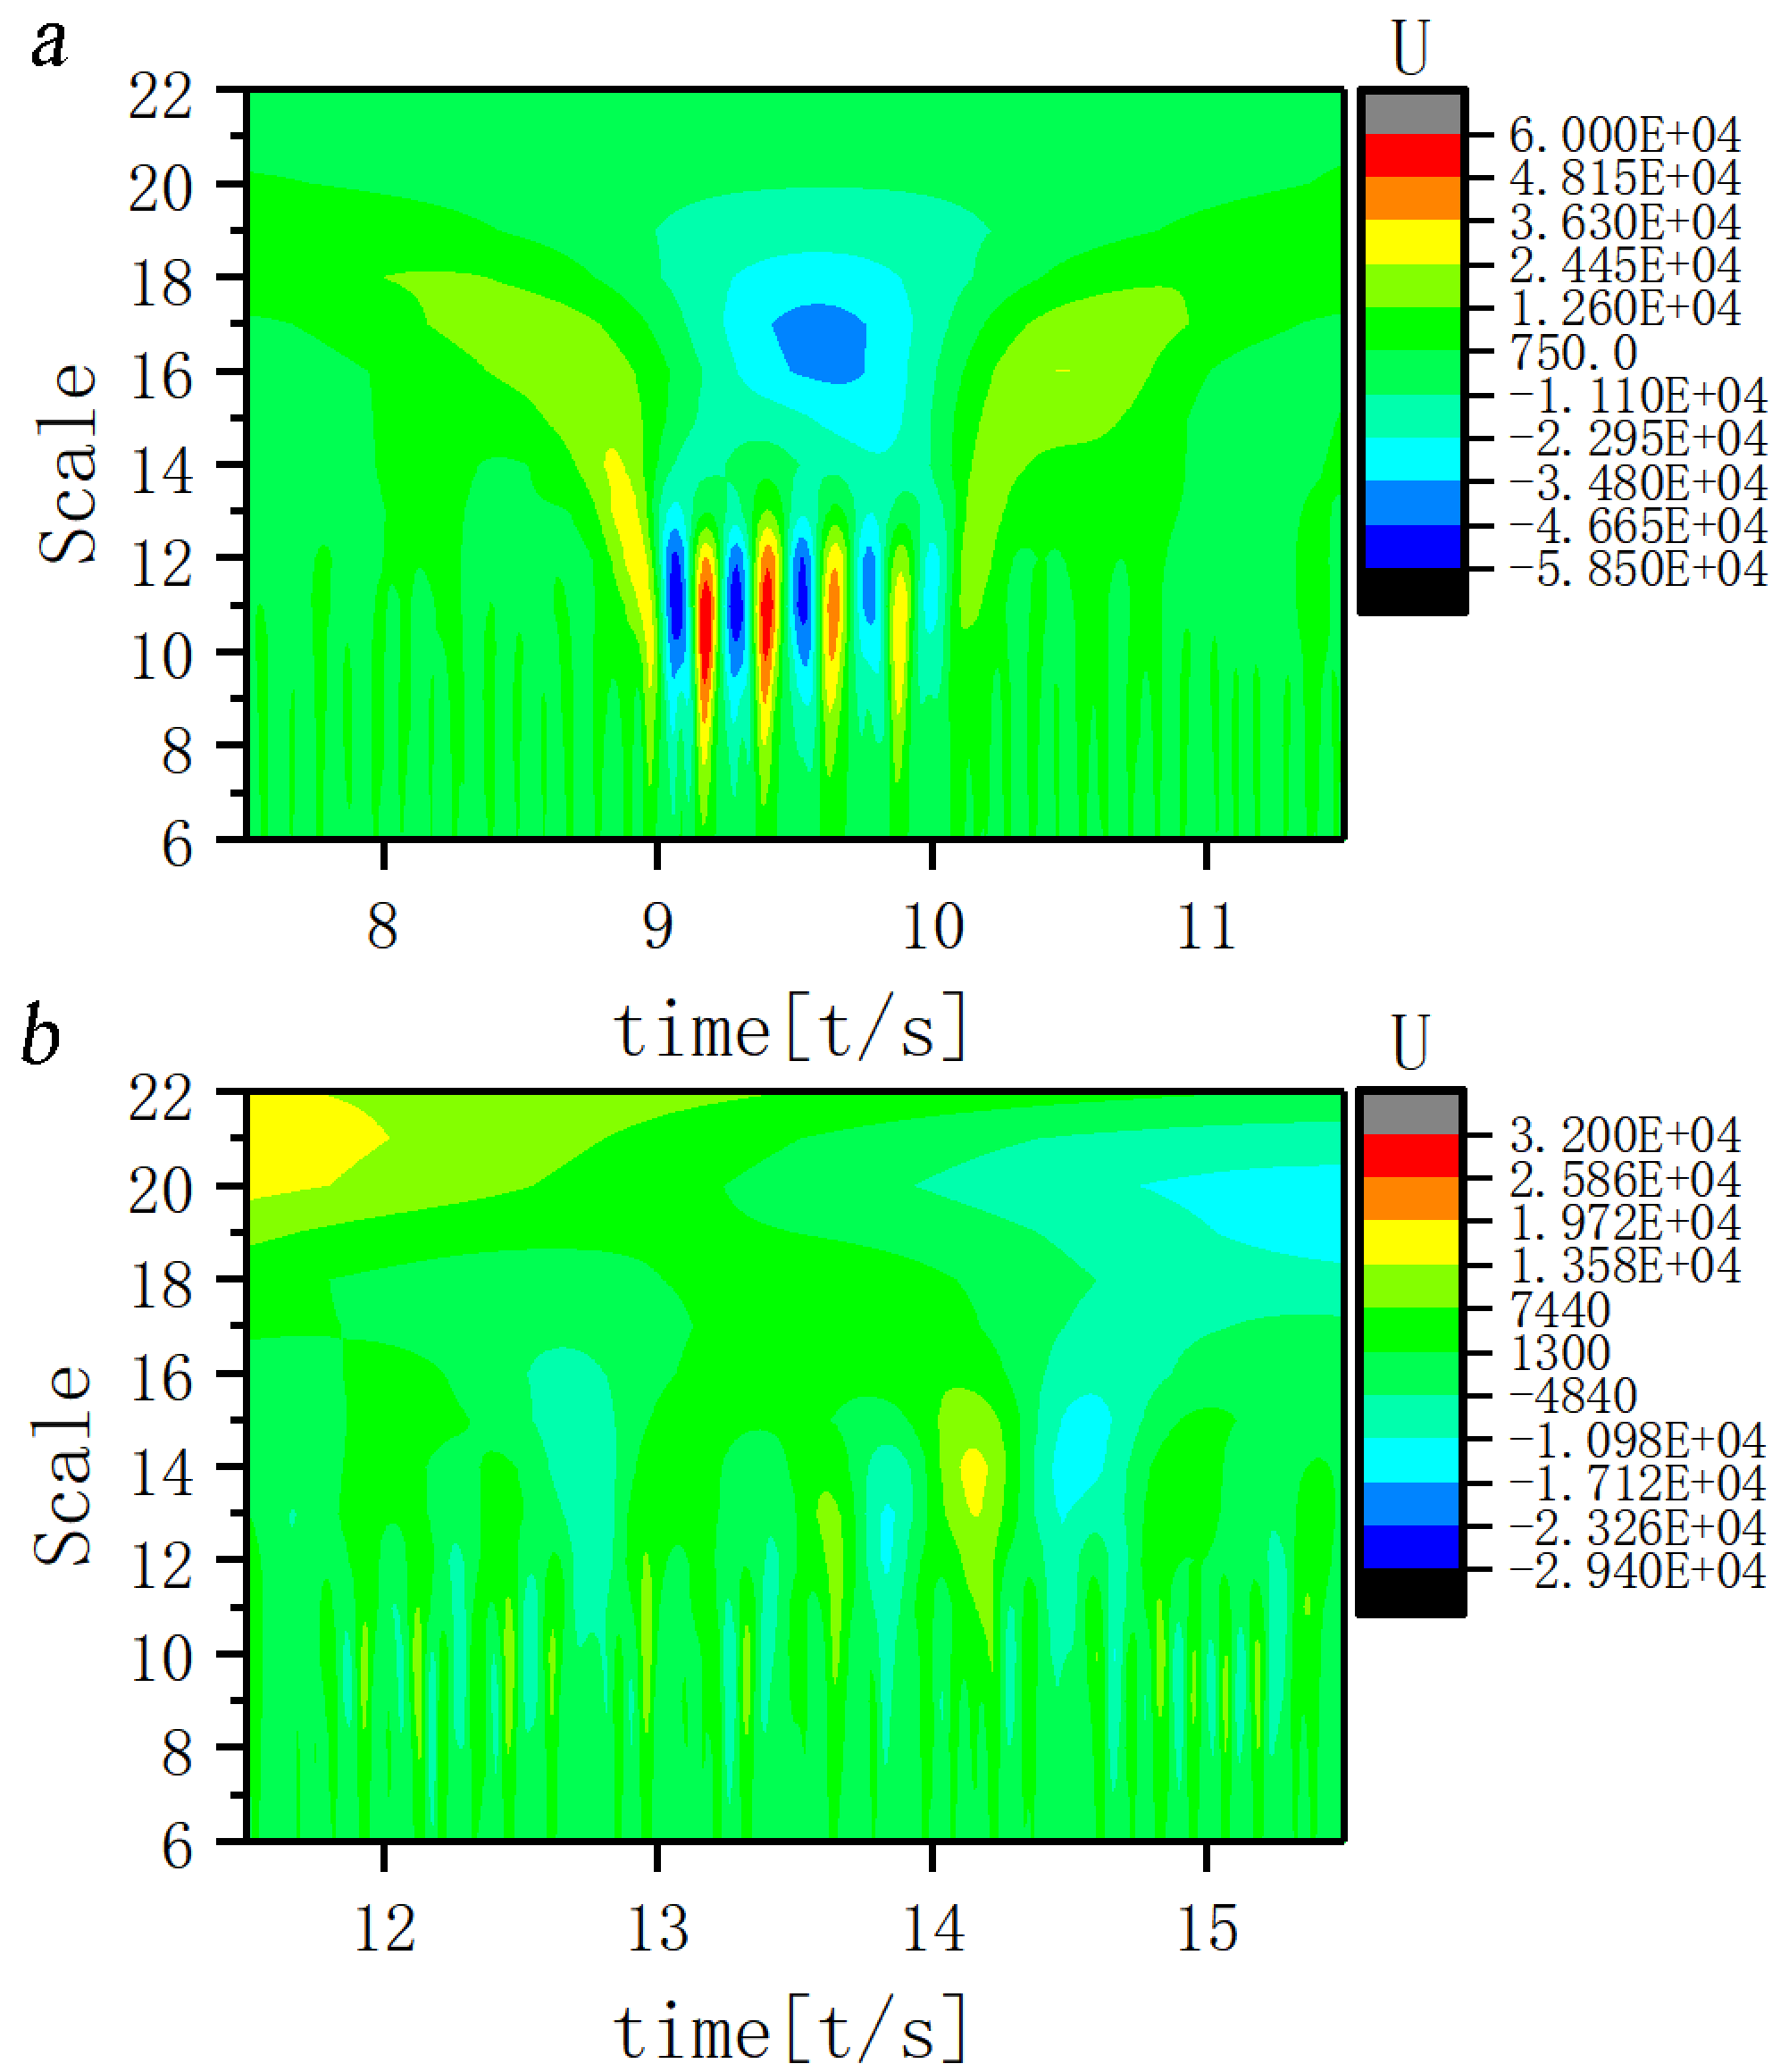 Fig. 4.
Time-frequency structure for ictal EEG of (a) JME subjects and (b) normal controls. Note: U, Wavelet coefficients.
A scale corresponding to the slow-wave band that is most closely coupled to the 11th scale was sought and the EEG signal coupling relationship between the two scales was further analyzed. Fig. 5 shows that the 17th scale is most closely related to the 11th scale. Figs. 6,7,8 show the time-frequency structure and coupling maps for three subjects. It was found that all JME subjects showed a similar time-frequency structure and coupling relationship during seizures. We have added representative figures of the other JME subjects in the Supplementary Material.
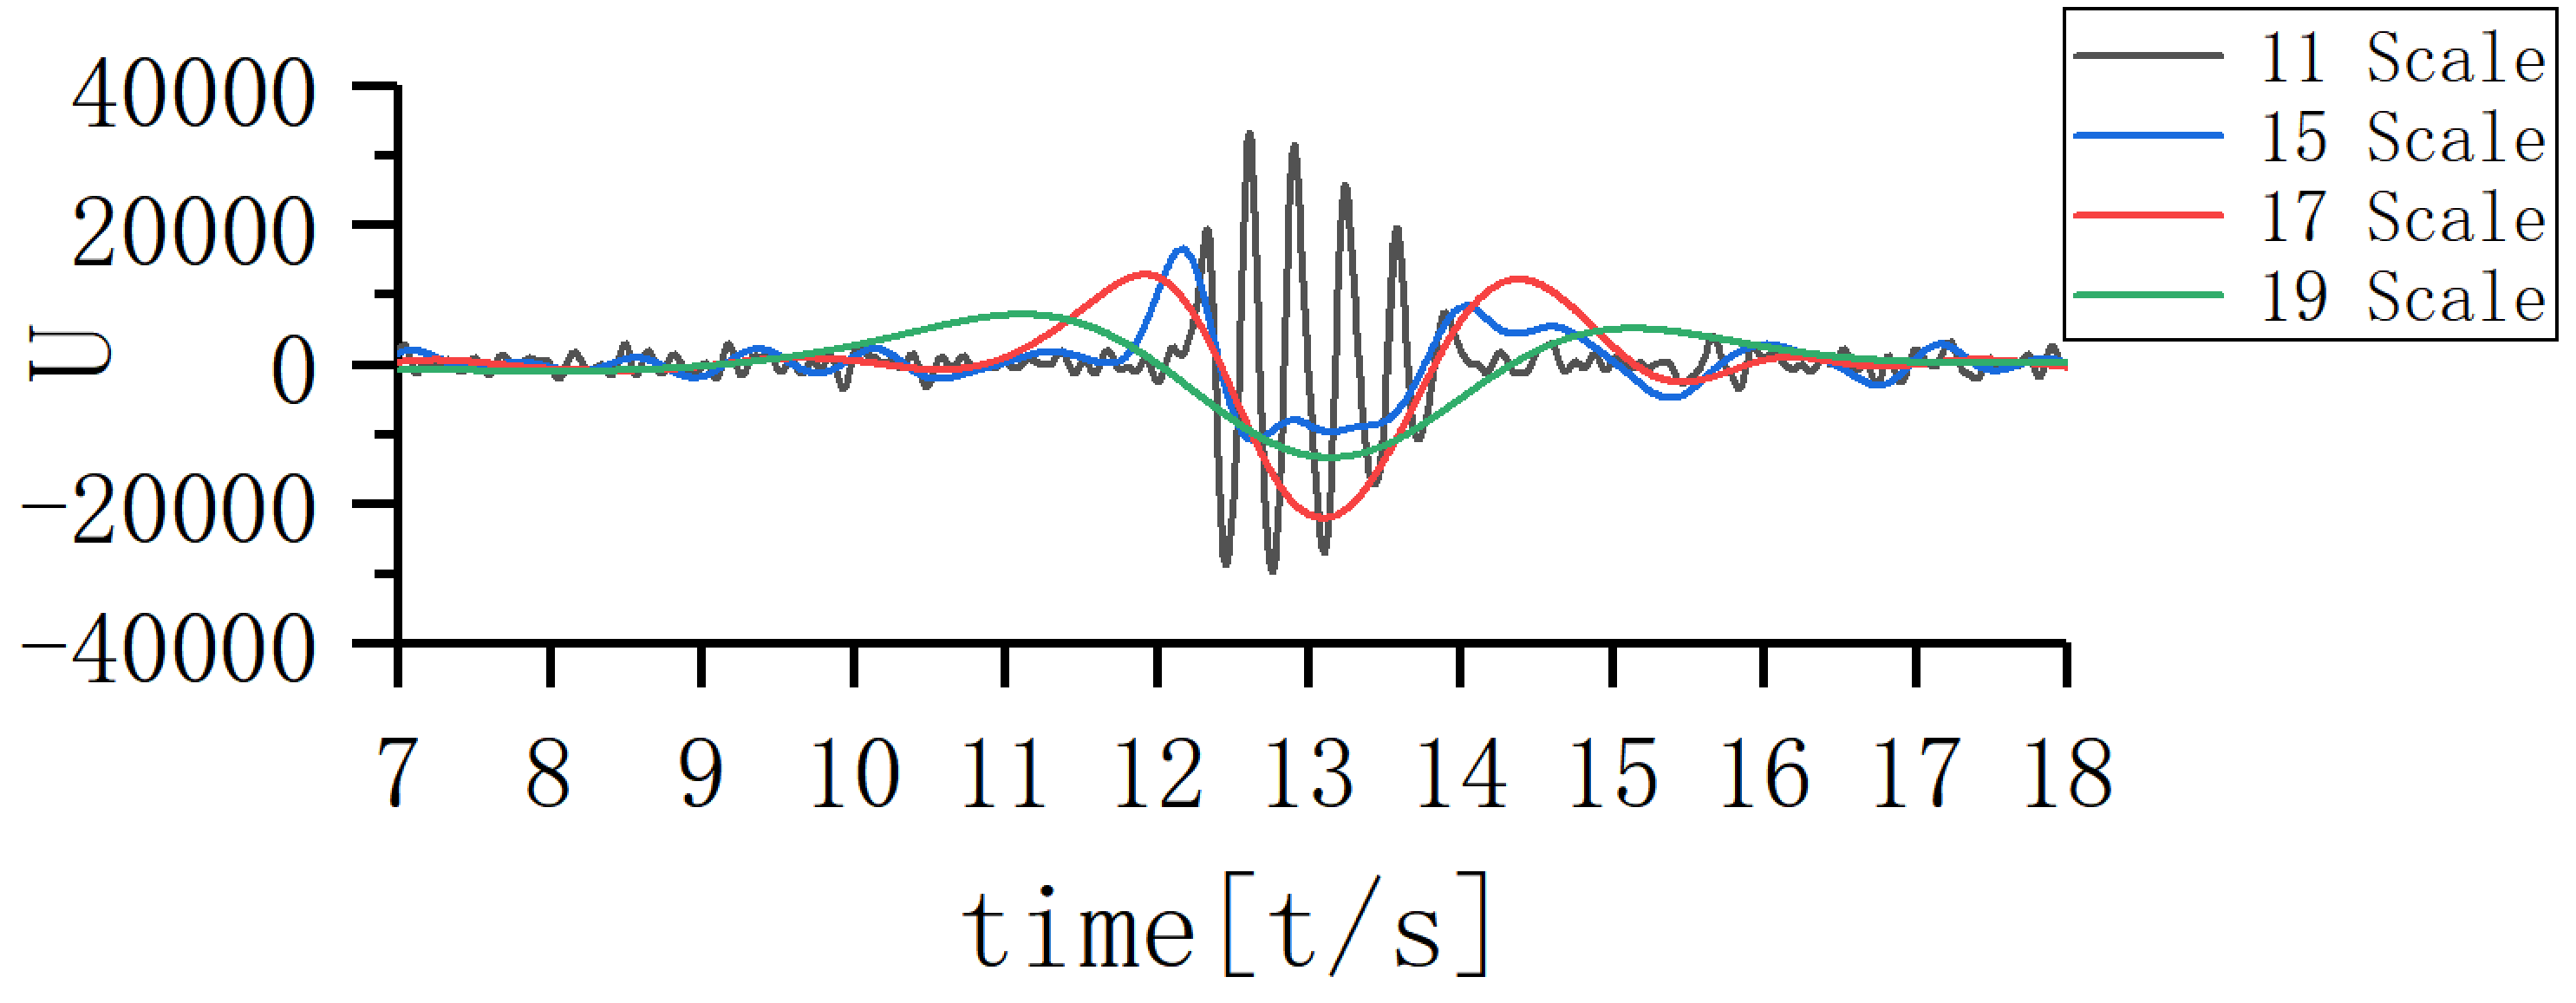 Fig. 5.
Coupling map of different scales.
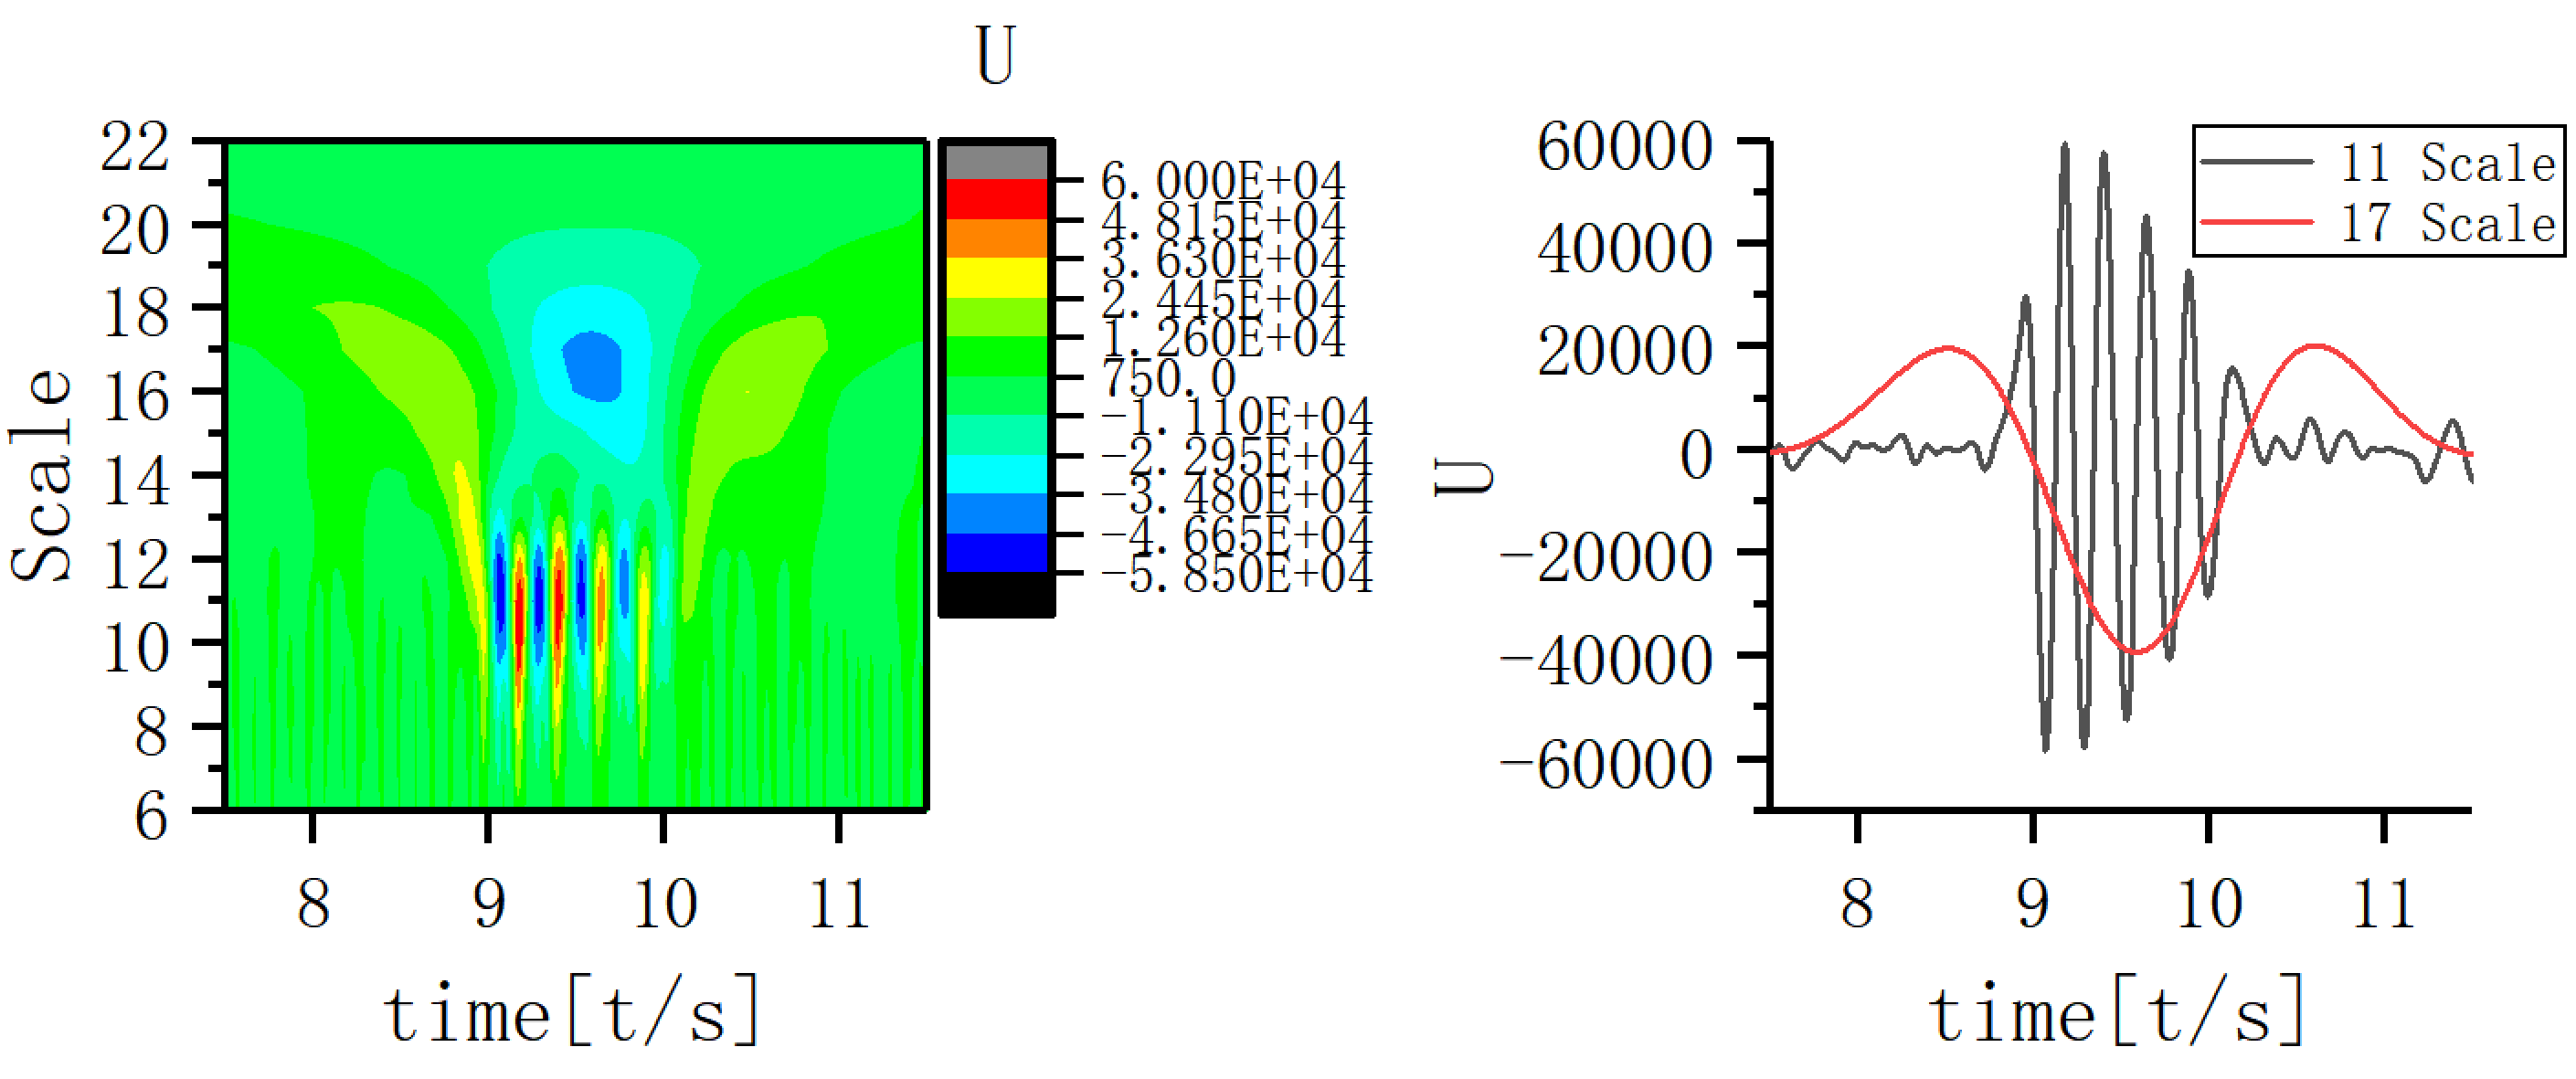 Fig. 6.
Time-frequency structure and coupling maps for subject A.
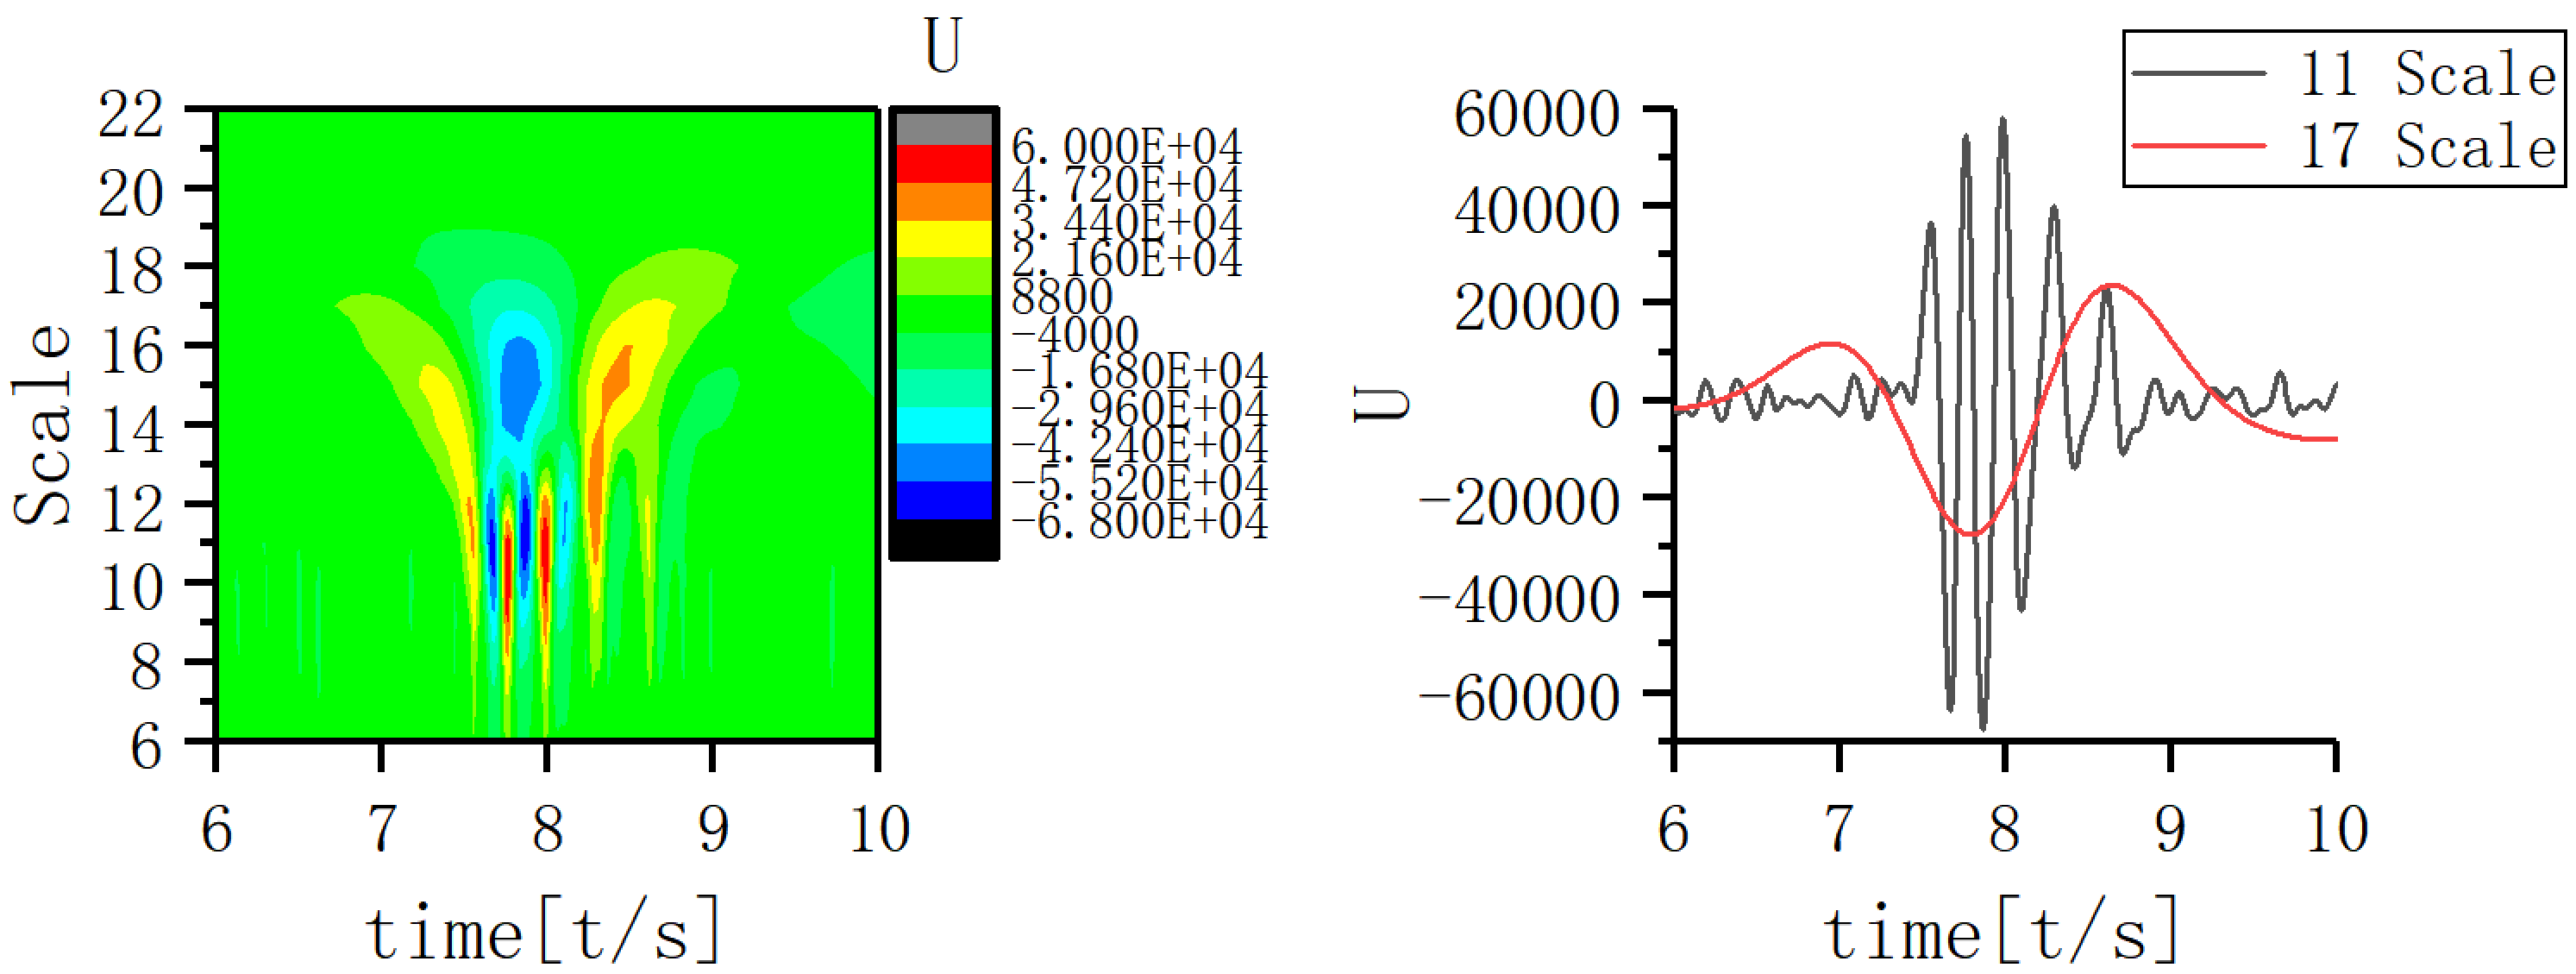 Fig. 7.
Time-frequency structure and coupling maps for subject B.
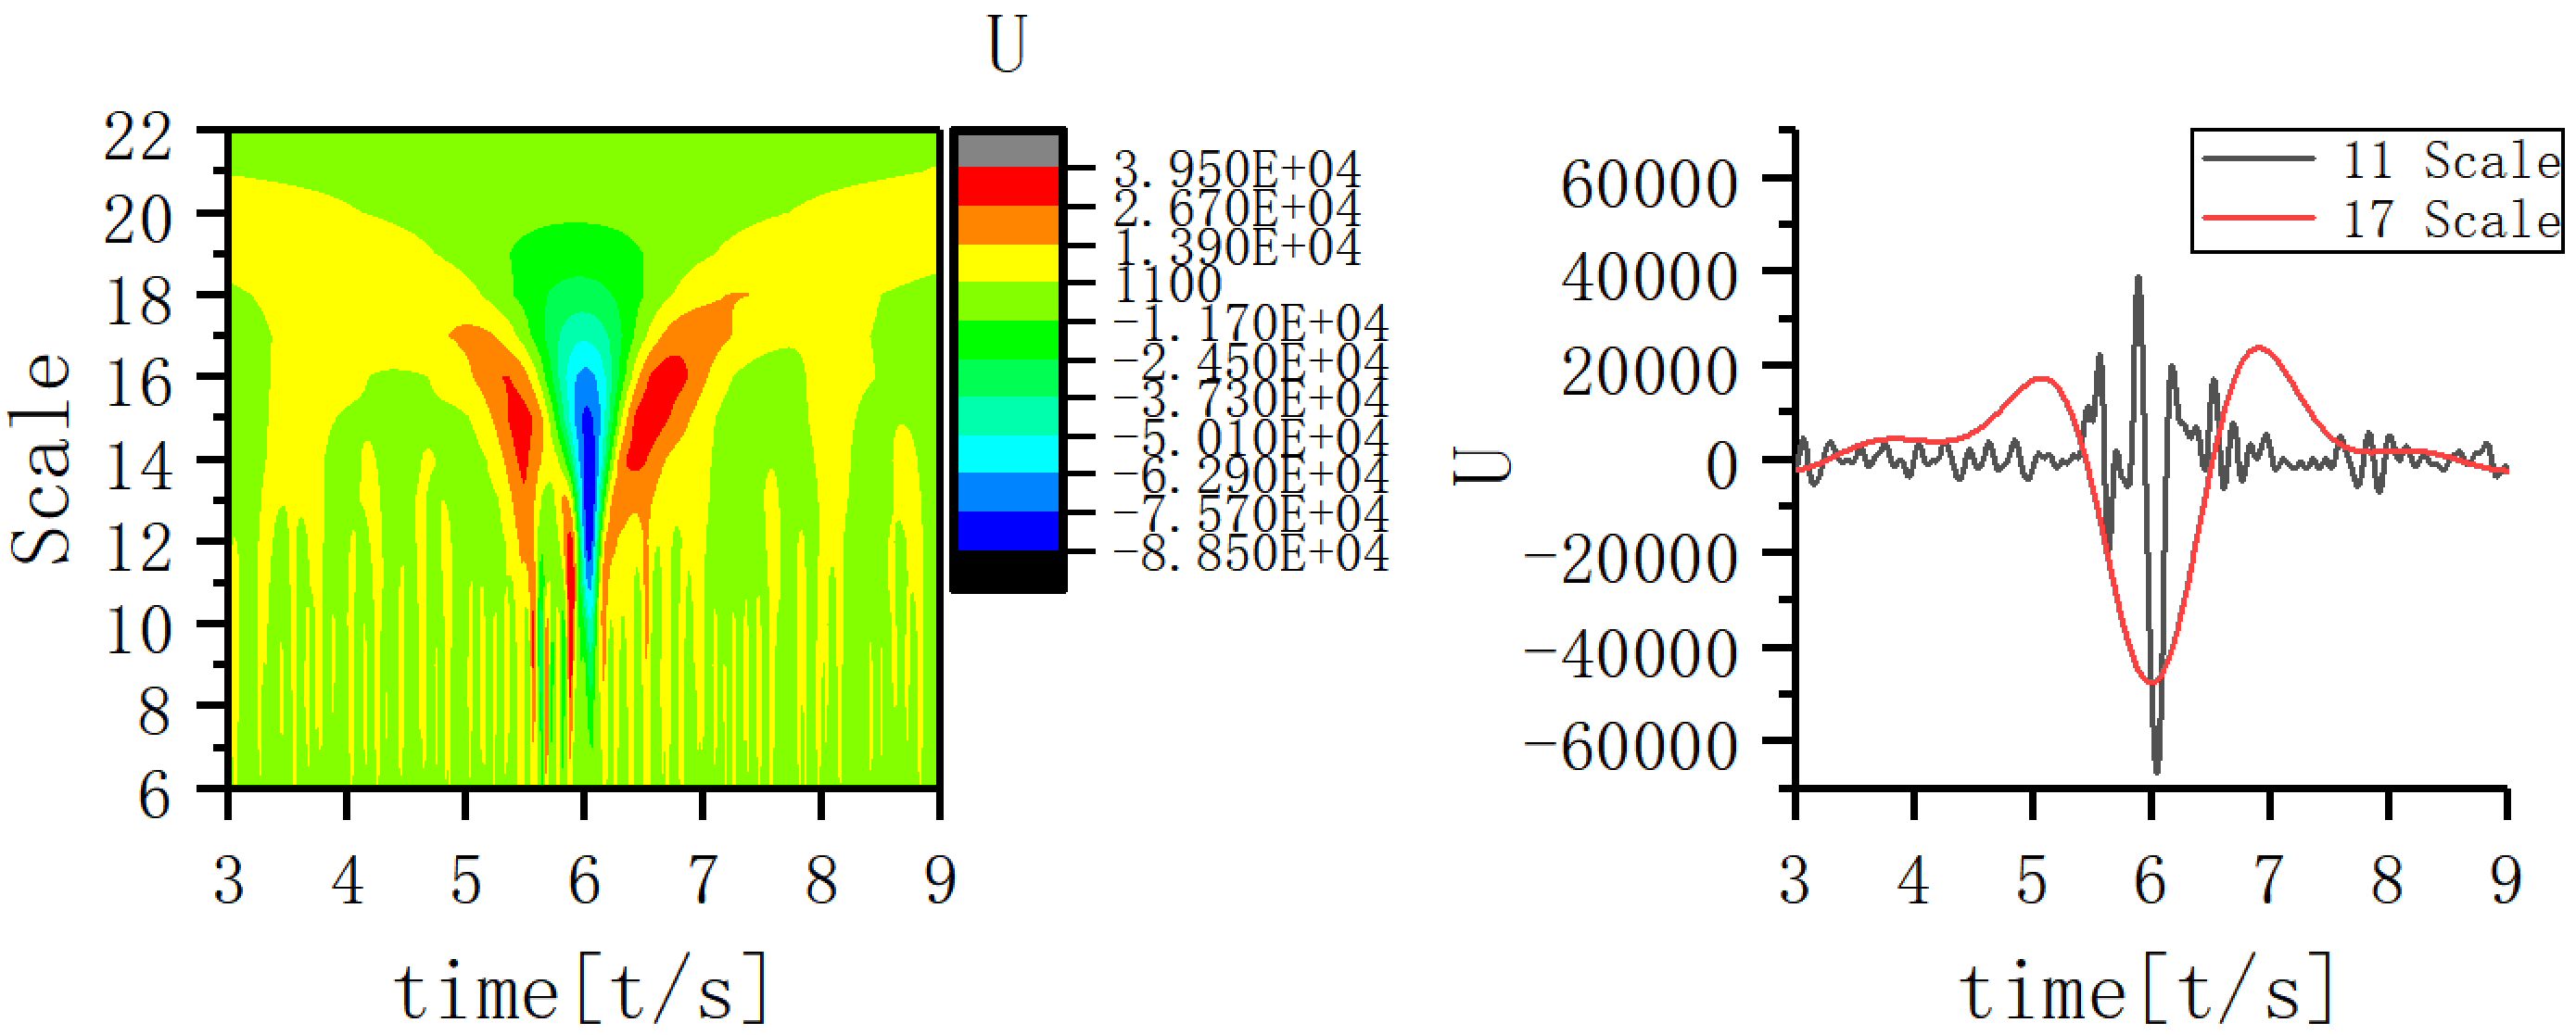 Fig. 8.
Time-frequency structure and coupling maps for subject C.
The phase of the 17th scale EEG signal was used as a reference. The 17th scale trough was at 0° and continued 270° in each direction. The amplitude of the 11th scale EEG signal was extracted at the same moment according to a phase angles of every 30°. In Fig. 9, the red line gives the phase of 17th scale waveform during the onset for the JME patients. The bars bordered by blue boxes give the amplitudes.
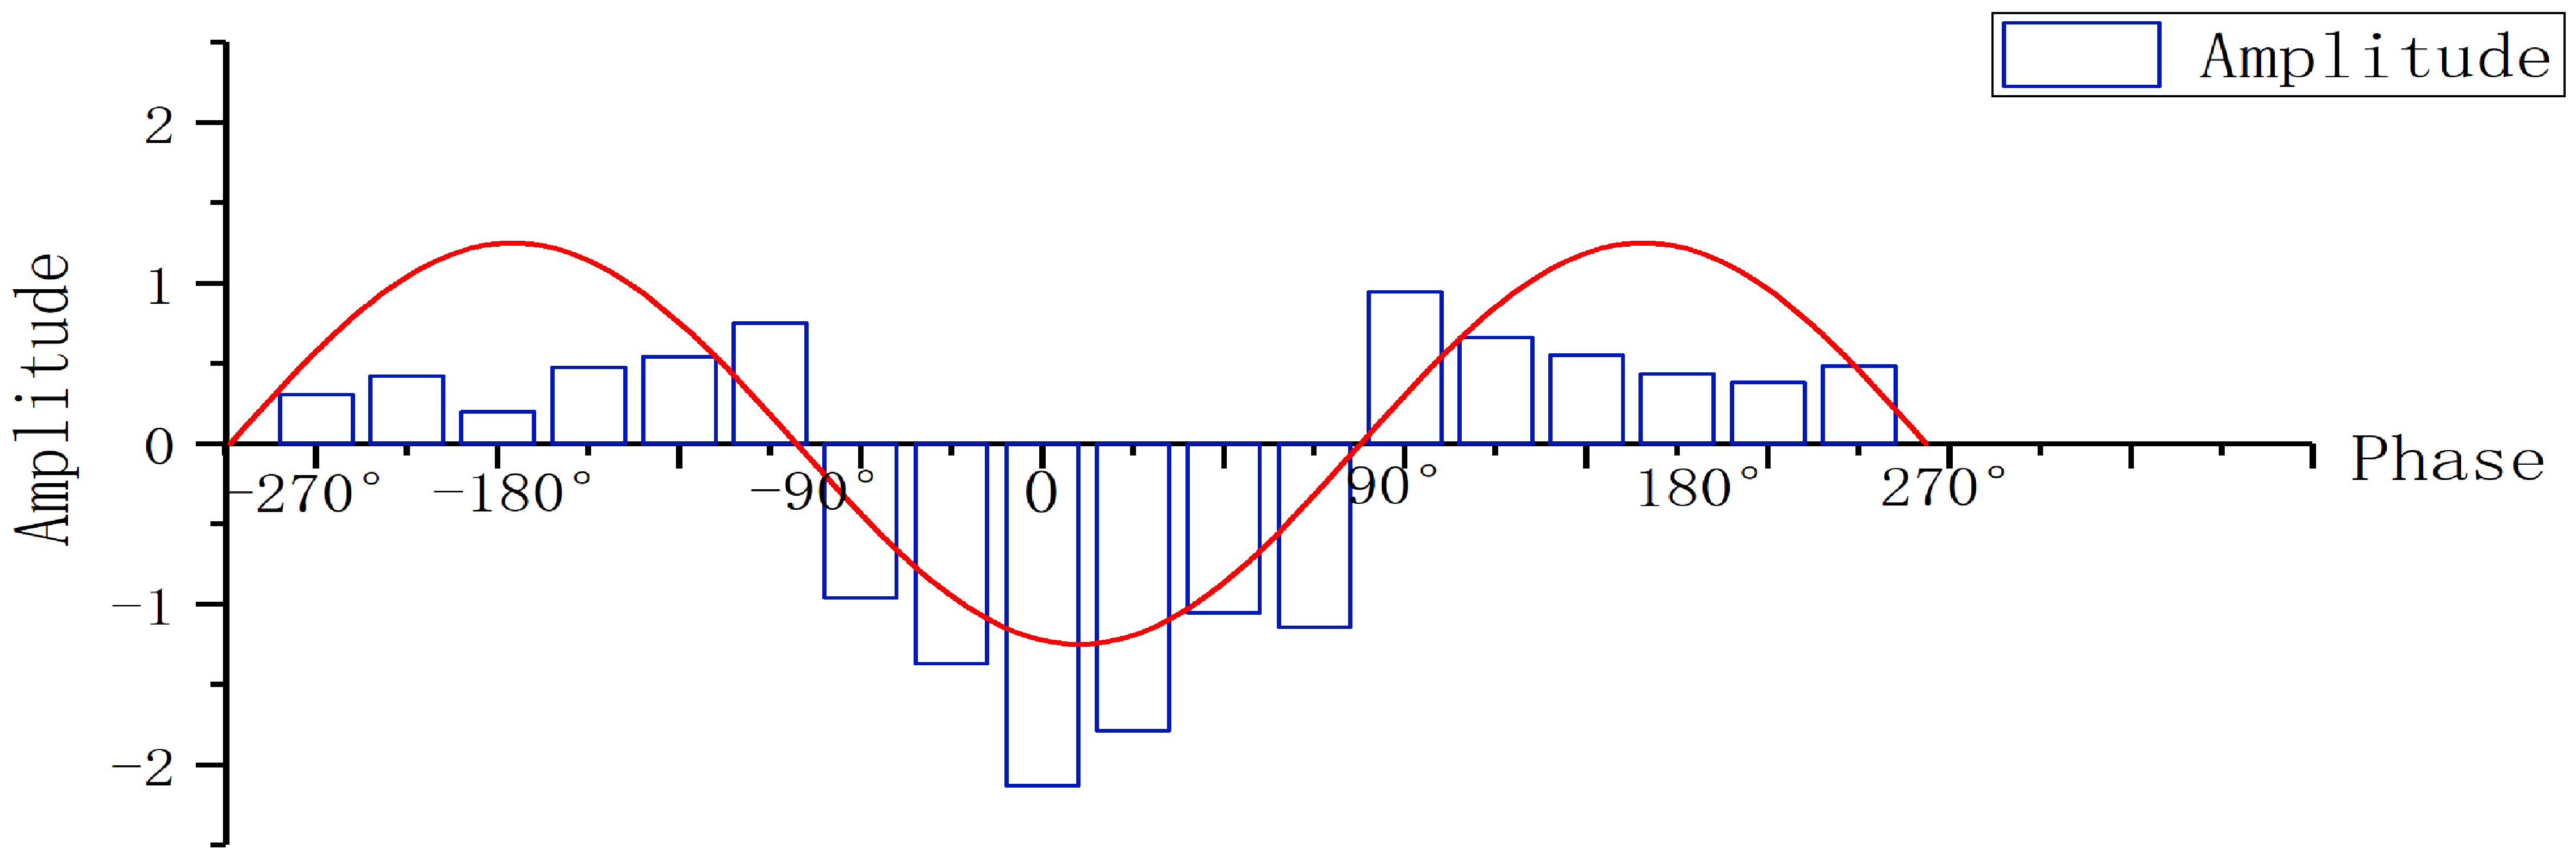 Fig. 9.
Phase amplitude coupling (PAC) of 11th scale and 17th scale in JME subjects.
The 11th scale EEG information during seizure was extracted and the waveform, wave amplitude, phase and other characteristics observed (Fig. 10a). The 11th scale EEG signal of JME subjects in the first two seconds before seizure tended to be similar in waveform and consistent in phase, but lower in amplitude. At seizure onset, the waveform amplitude suddenly increased and there was a mild phase difference from the anterior to the posterior head lead. Following the seizure, the 11th scale EEG gradually returned to its original state.
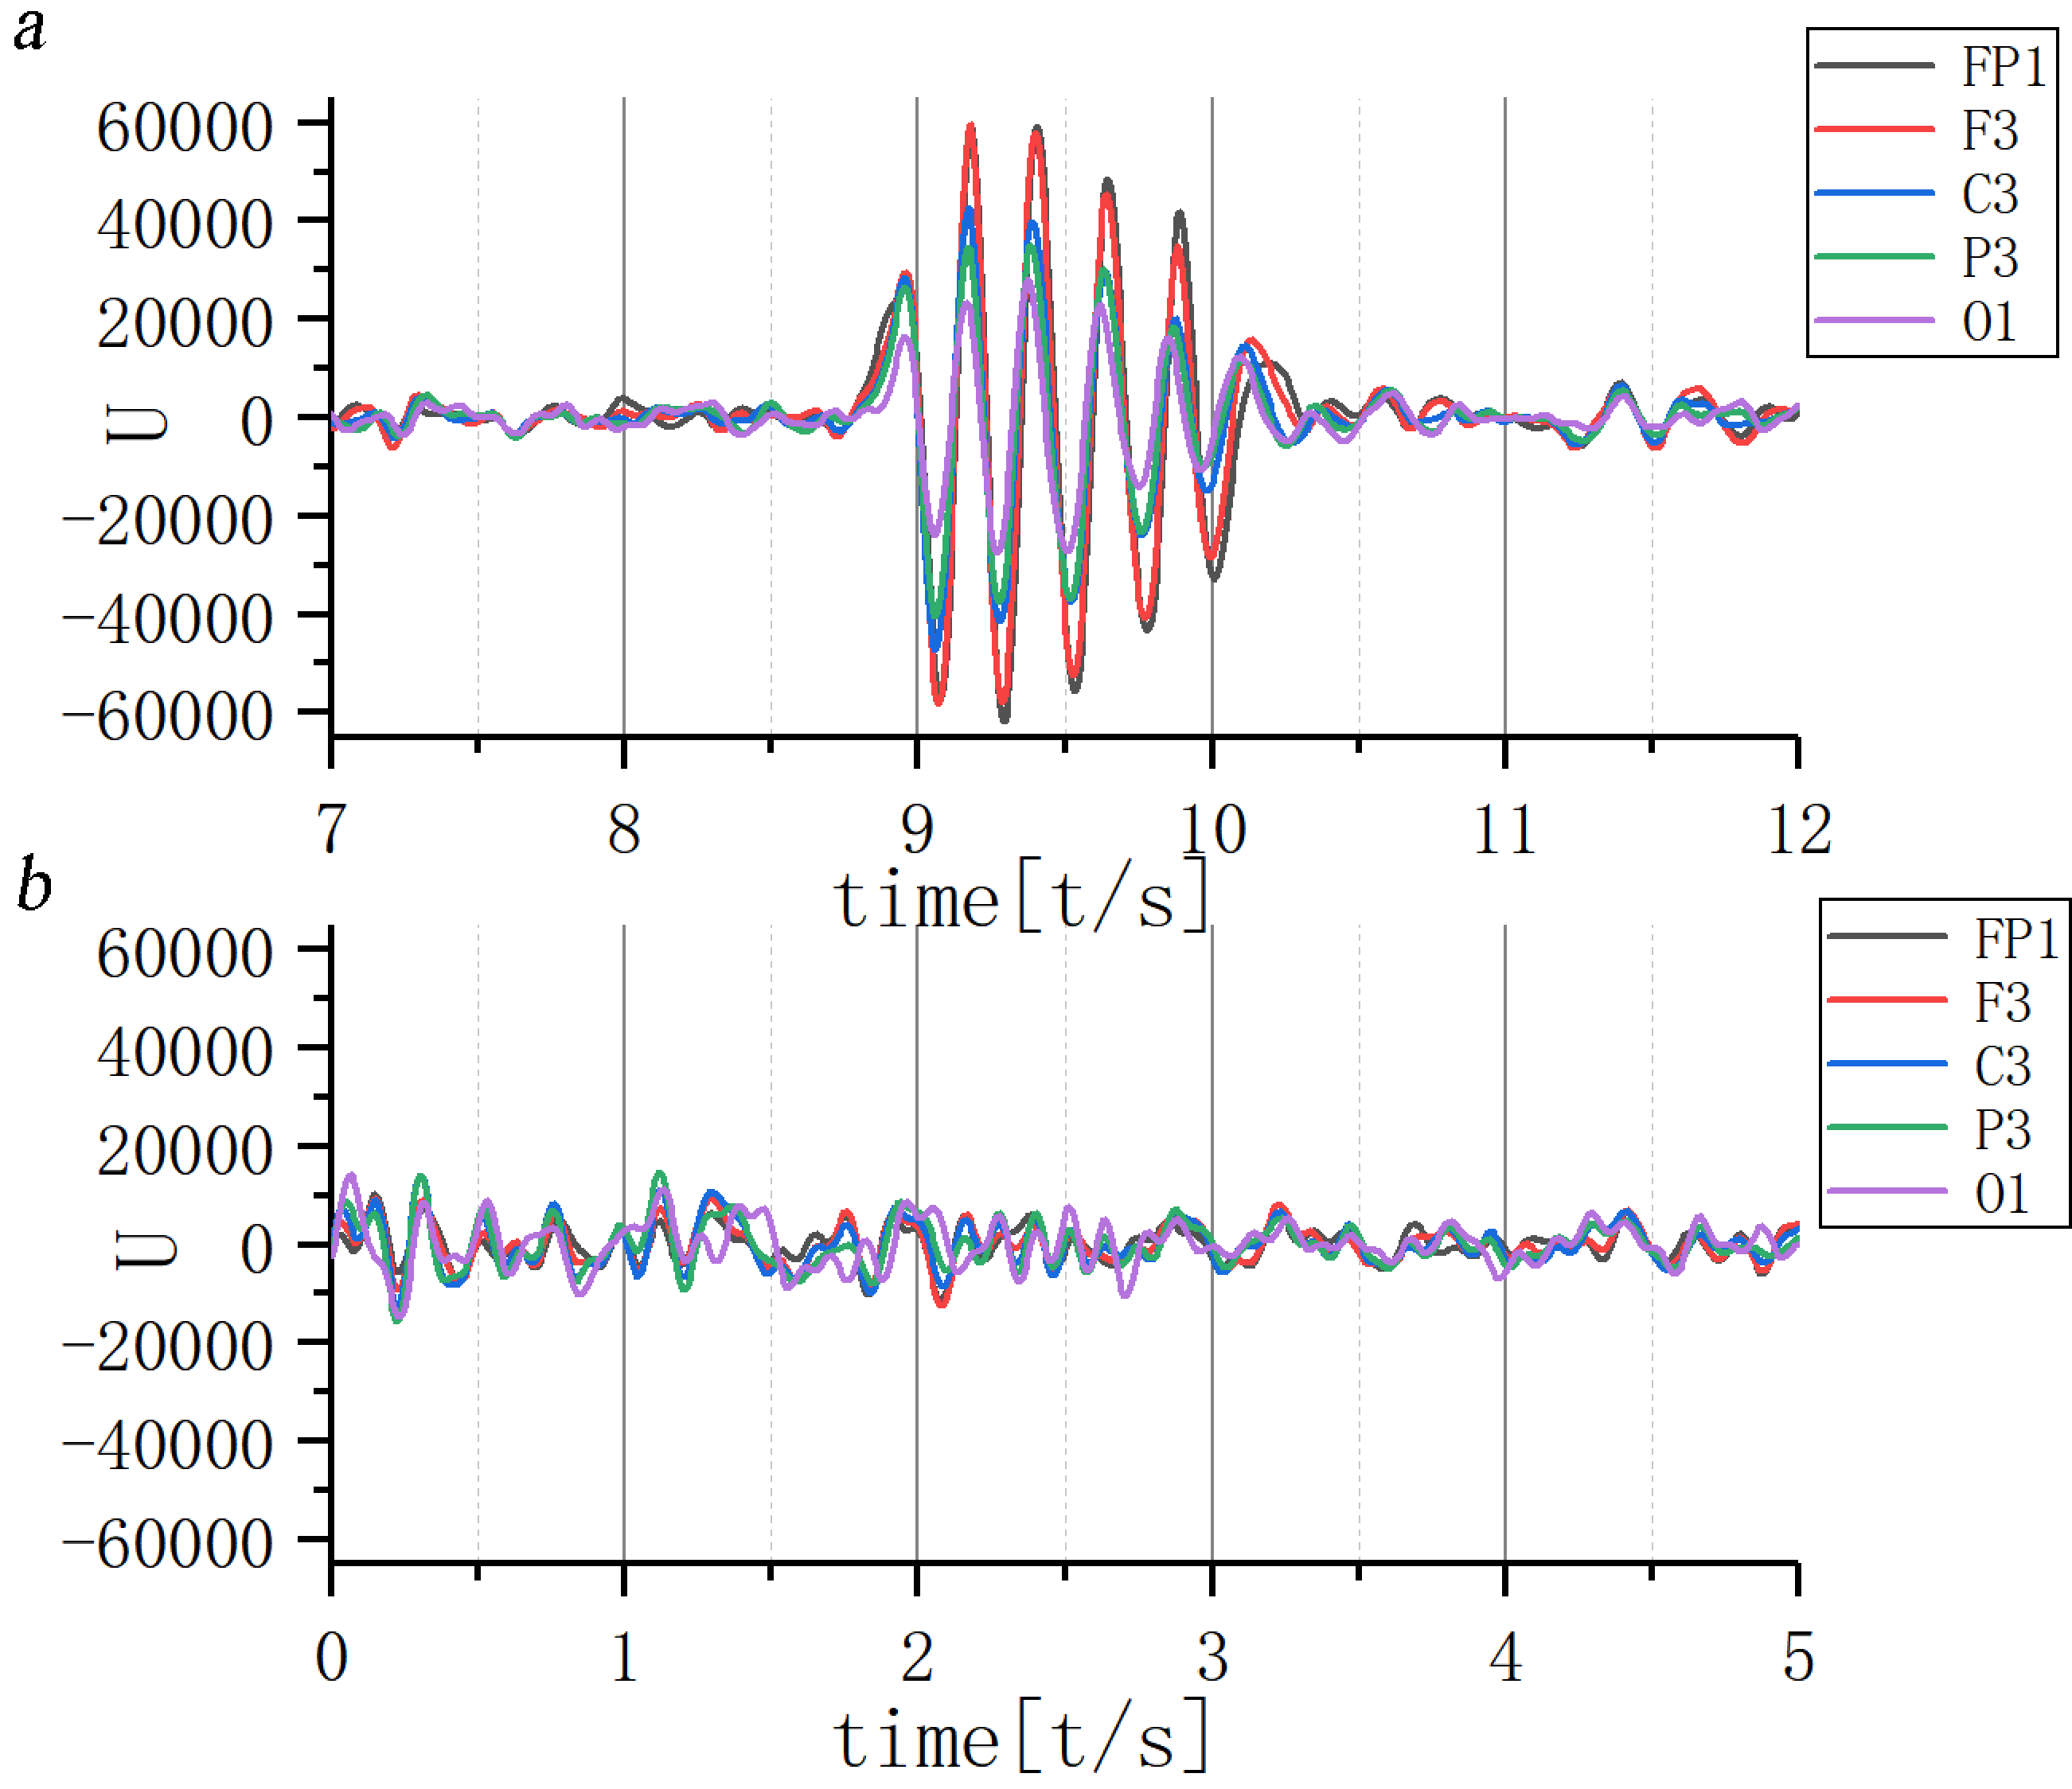 Fig. 10.
Waveform of 11th scale for ictal EEG of (a) JME subjects and (b) normal controls. Note: U, Wavelet coefficients.
Overall wave amplitude was lower in the normal control group, with no fixed correlation in different leads between the wave amplitude and phase (Fig. 10b).
Characteristics of the EEG waveform in the different leads were then investigated at the 17th scale. Results are given in Fig. 11, demonstrating that the wave amplitude increased and decreased at approximately one second before and after the seizure, forming two wave peaks. The wave amplitude dropped sharply, followed by a sharp rise during the seizure, forming a wave valley. The waveform of the 17th scale EEG signal in the normal control group was lower in overall amplitude, with a smoother increase and decrease at the same time.
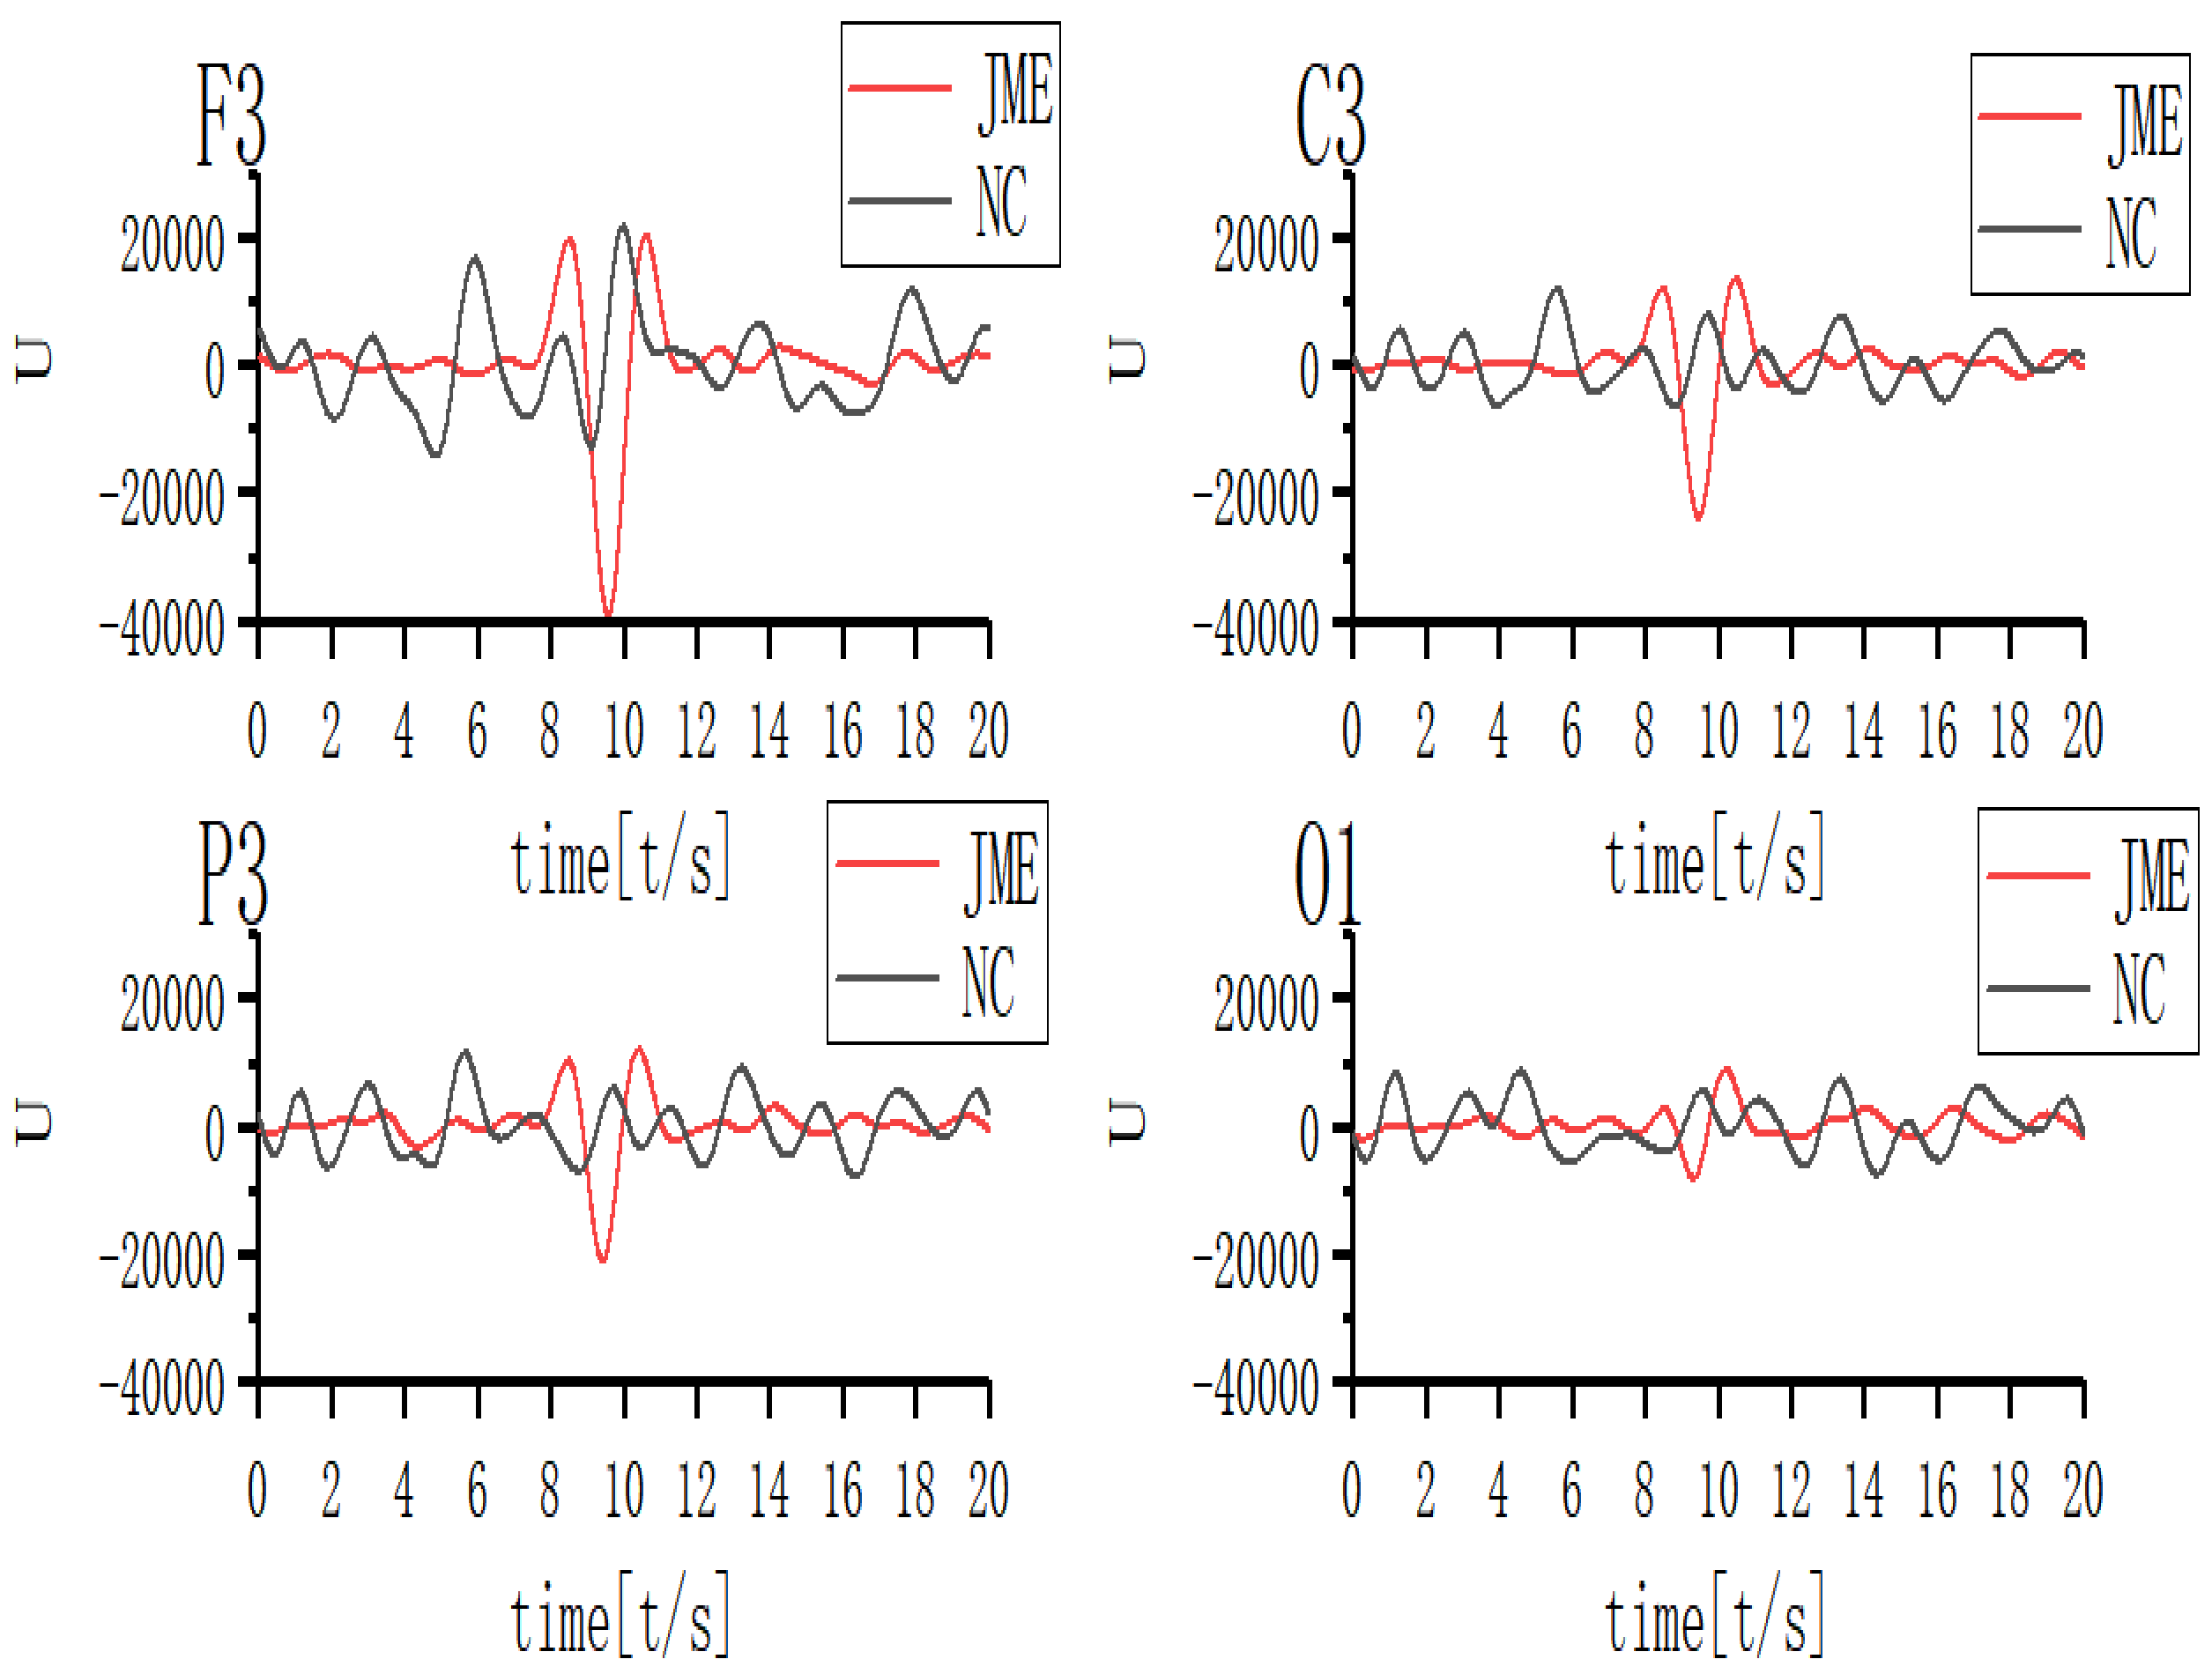 Fig. 11.
Waveform of 17th scale for ictal EEG of JME subjects and normal controls. Note: U, Wavelet coefficients.
As can be seen in Fig. 12a, the correlations of the whole head leads were significantly higher in JME subjects, exhibiting a significant positive correlation. However, the correlation did not increase to the same extent for all leads. Fig. 12b shows the correlation coefficient of normal controls at the 11th scale EEG and no specific relationship.
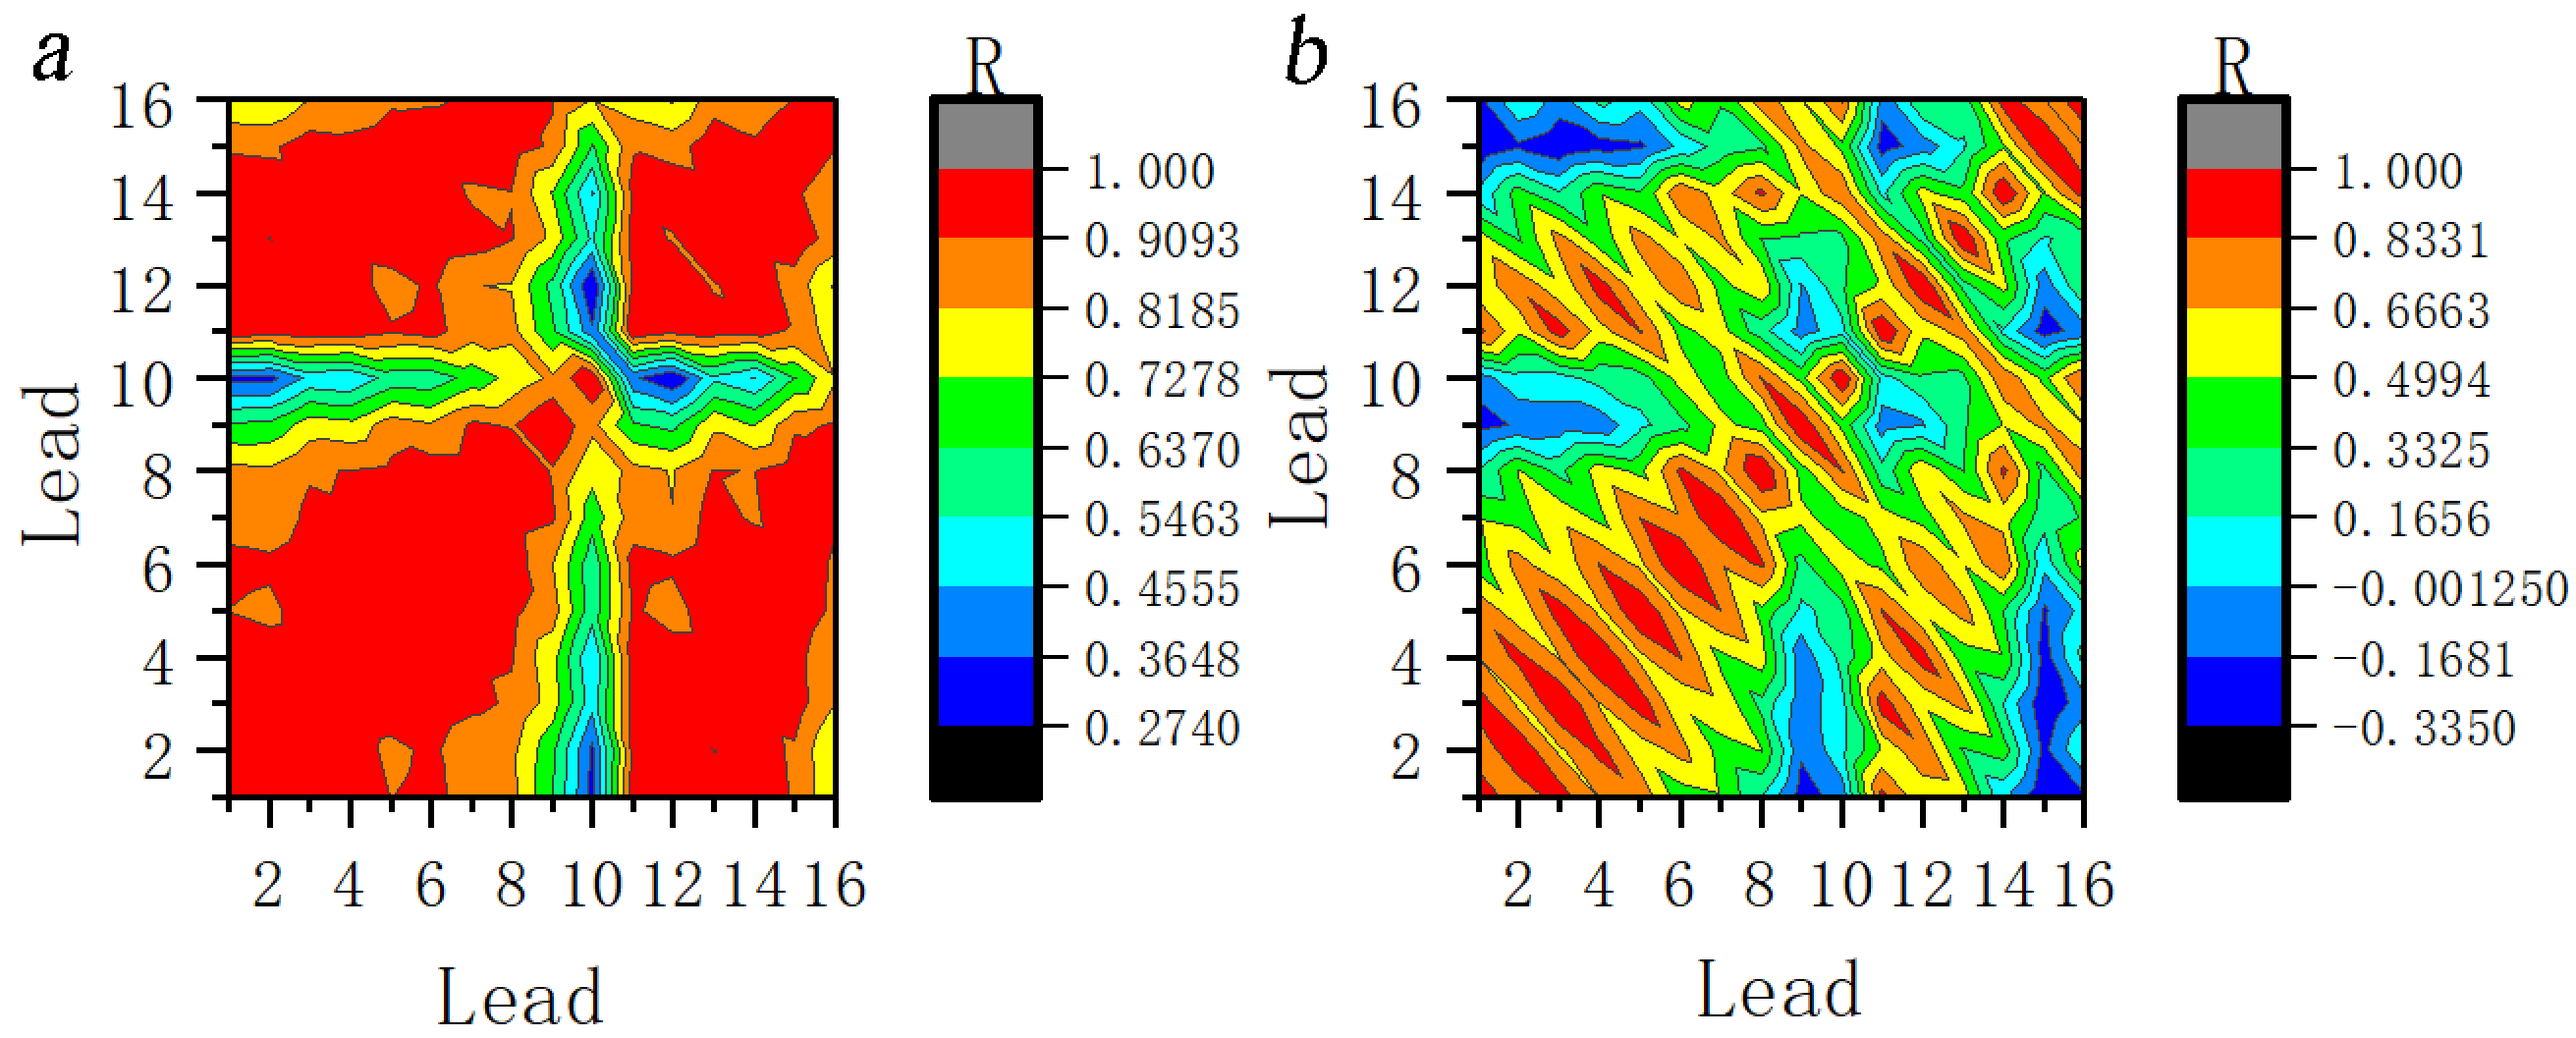 Fig. 12.
Correlation coefficients between the leads at 11th scale for ictal EEG of (a) JME subjects and (b) normal controls. Note: Lead 1–Lead 16 correspond to FP1–T6; R, Correlation coefficients.
Seizure was segmented into one second intervals and the coefficient of correlation was calculated between different leads (Fig. 13). Two seconds prior to the seizure, the range of leads with a significant positive correlation in the anterior head gradually increased and the correlation between the posterior and anterior head leads gradually changed from no correlation to a mild positive correlation. The correlation increased significantly during the one to two seconds of the seizure. In the subsequent one to two seconds after a seizure, the range of leads with significantly higher correlations gradually decreased. Additionally, the coefficient of correlation gradually decreased and returned to preictal magnitude.
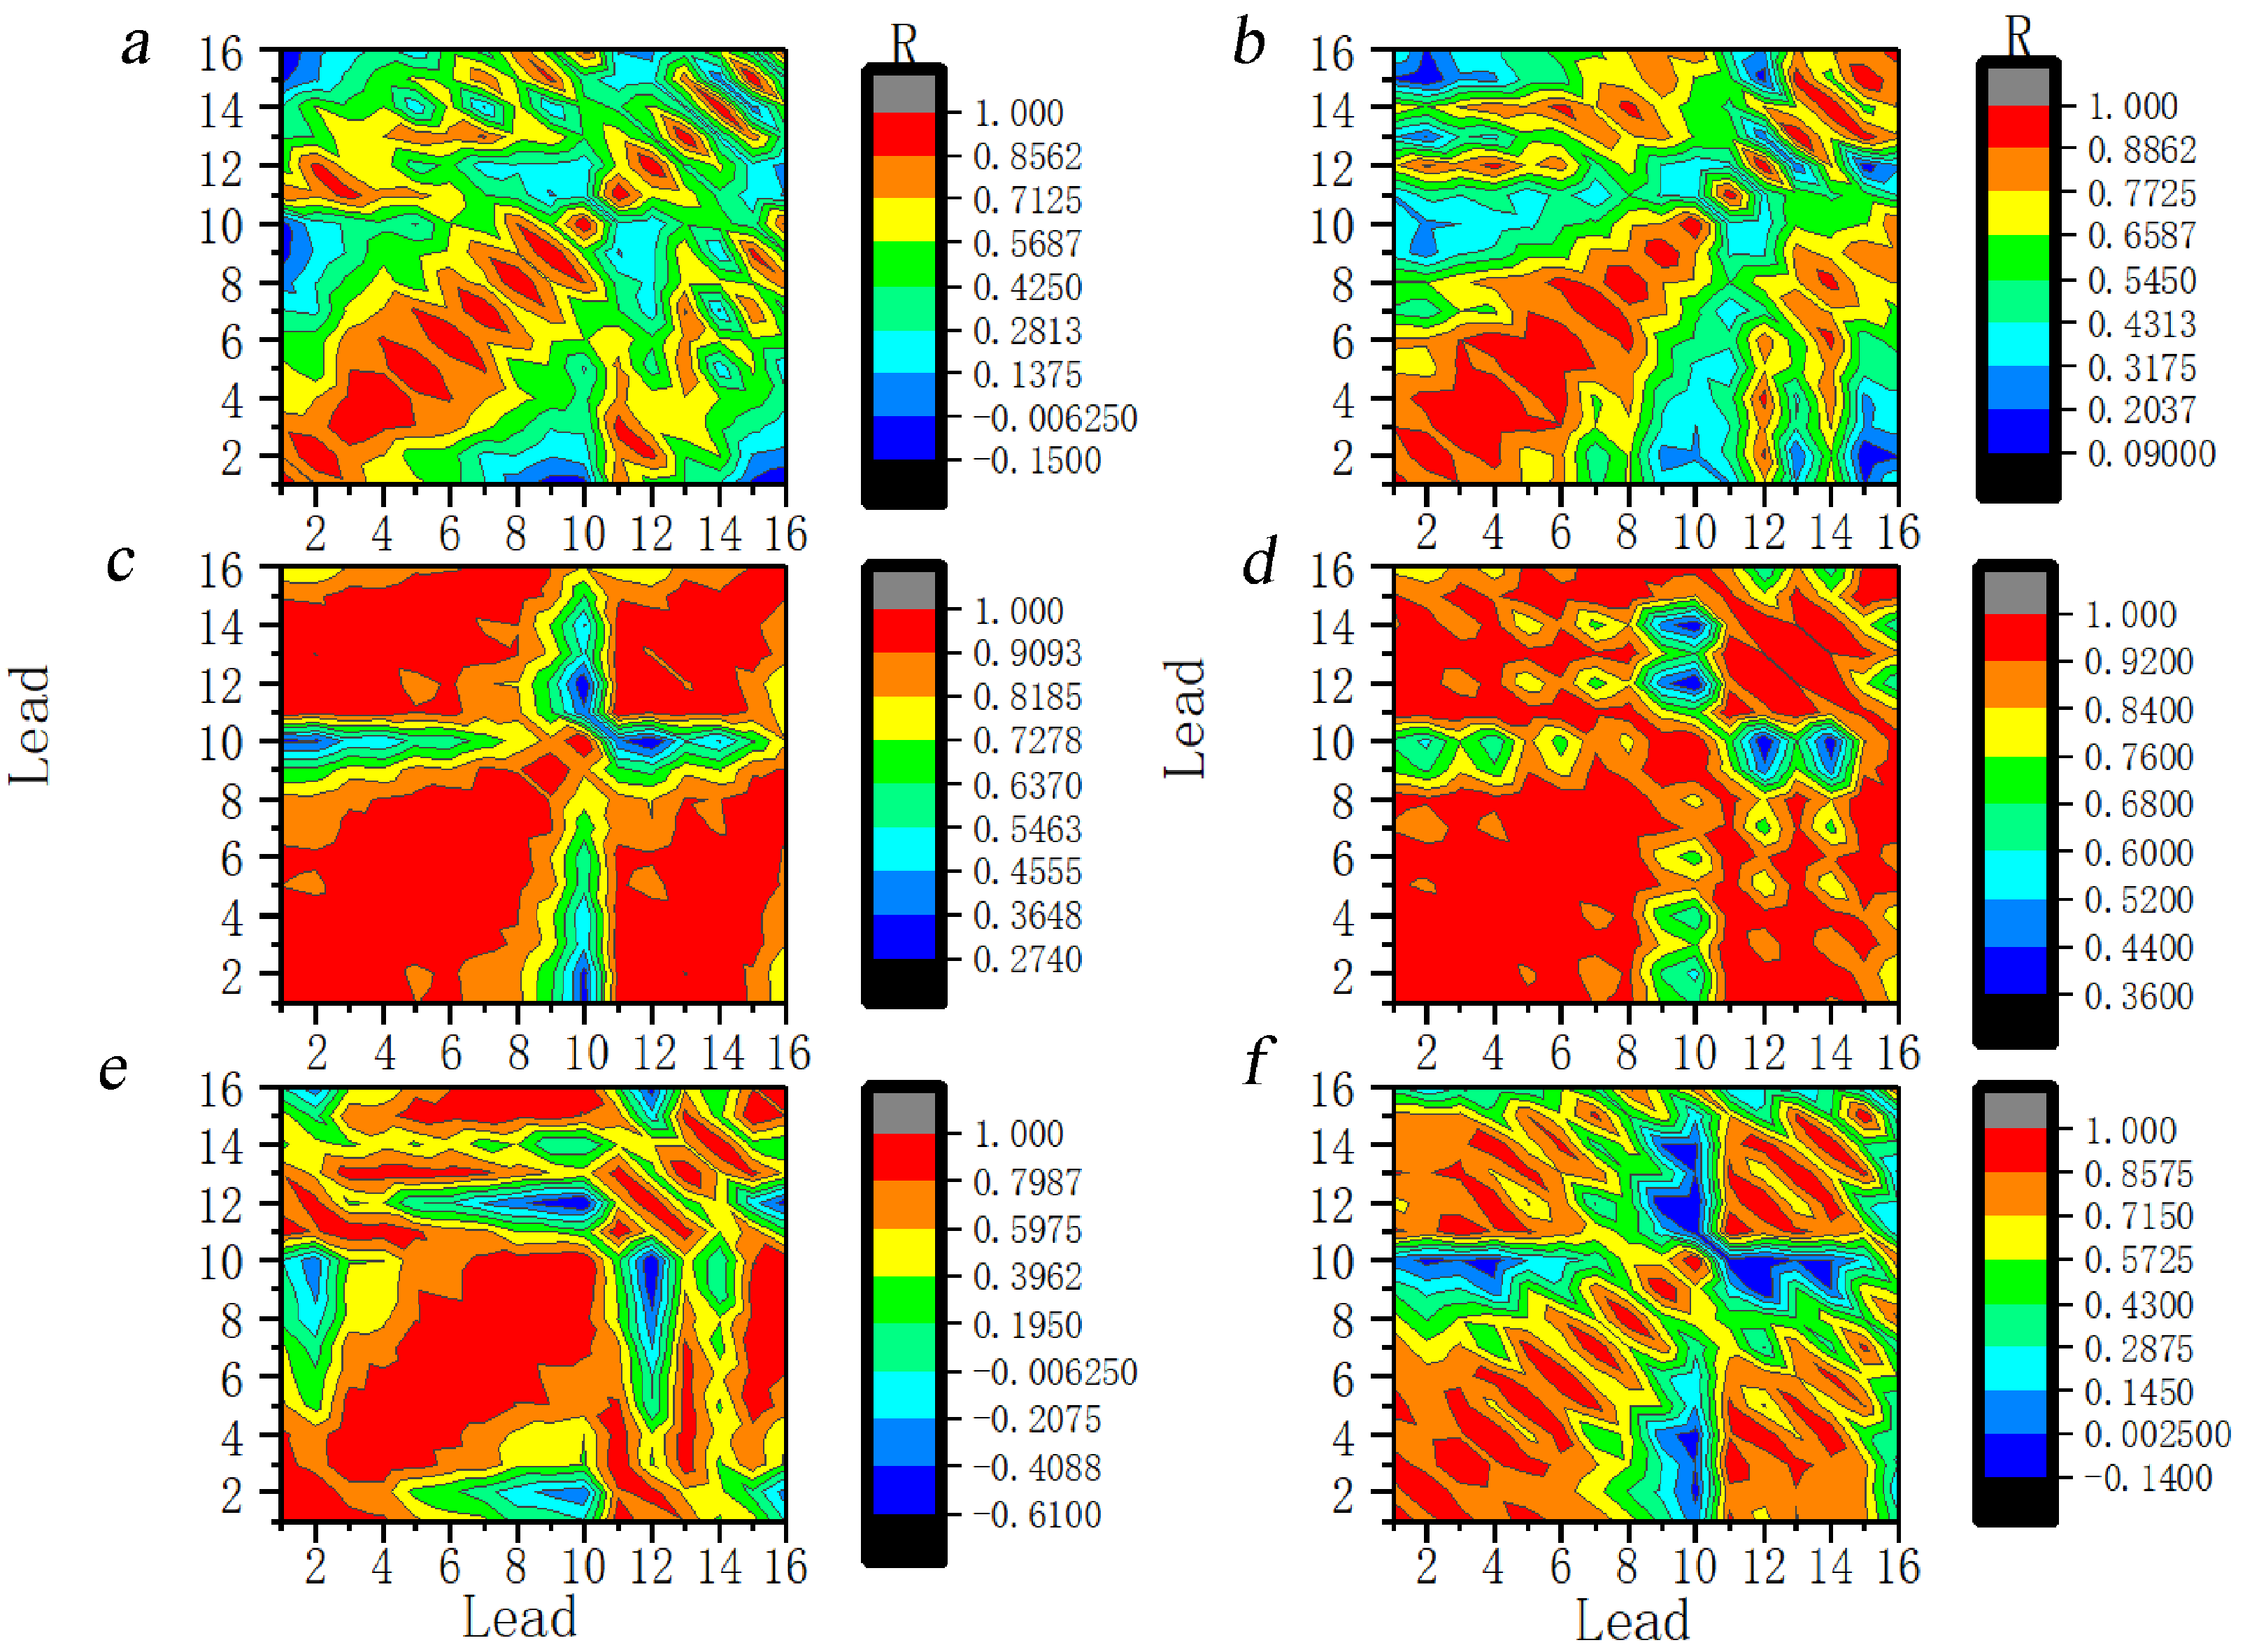 Fig. 13.
Dynamic evolution of correlation coefficients between the leads at the 11th scale for ictal EEG of JME subjects. Note: Lead 1–Lead 16 correspond to FP1–T6. (a) 2 s before seizure. (b) 1 s before seizure. (c) The first second of the seizure. (d) The 2 s of the seizure. (e) 1 s after seizure. (f) 2 s after seizure. R, Correlation coefficients.
Fig. 14 shows the dynamics of the correlation at the 17th scale. The process of change is similar to that for the 11th scale.
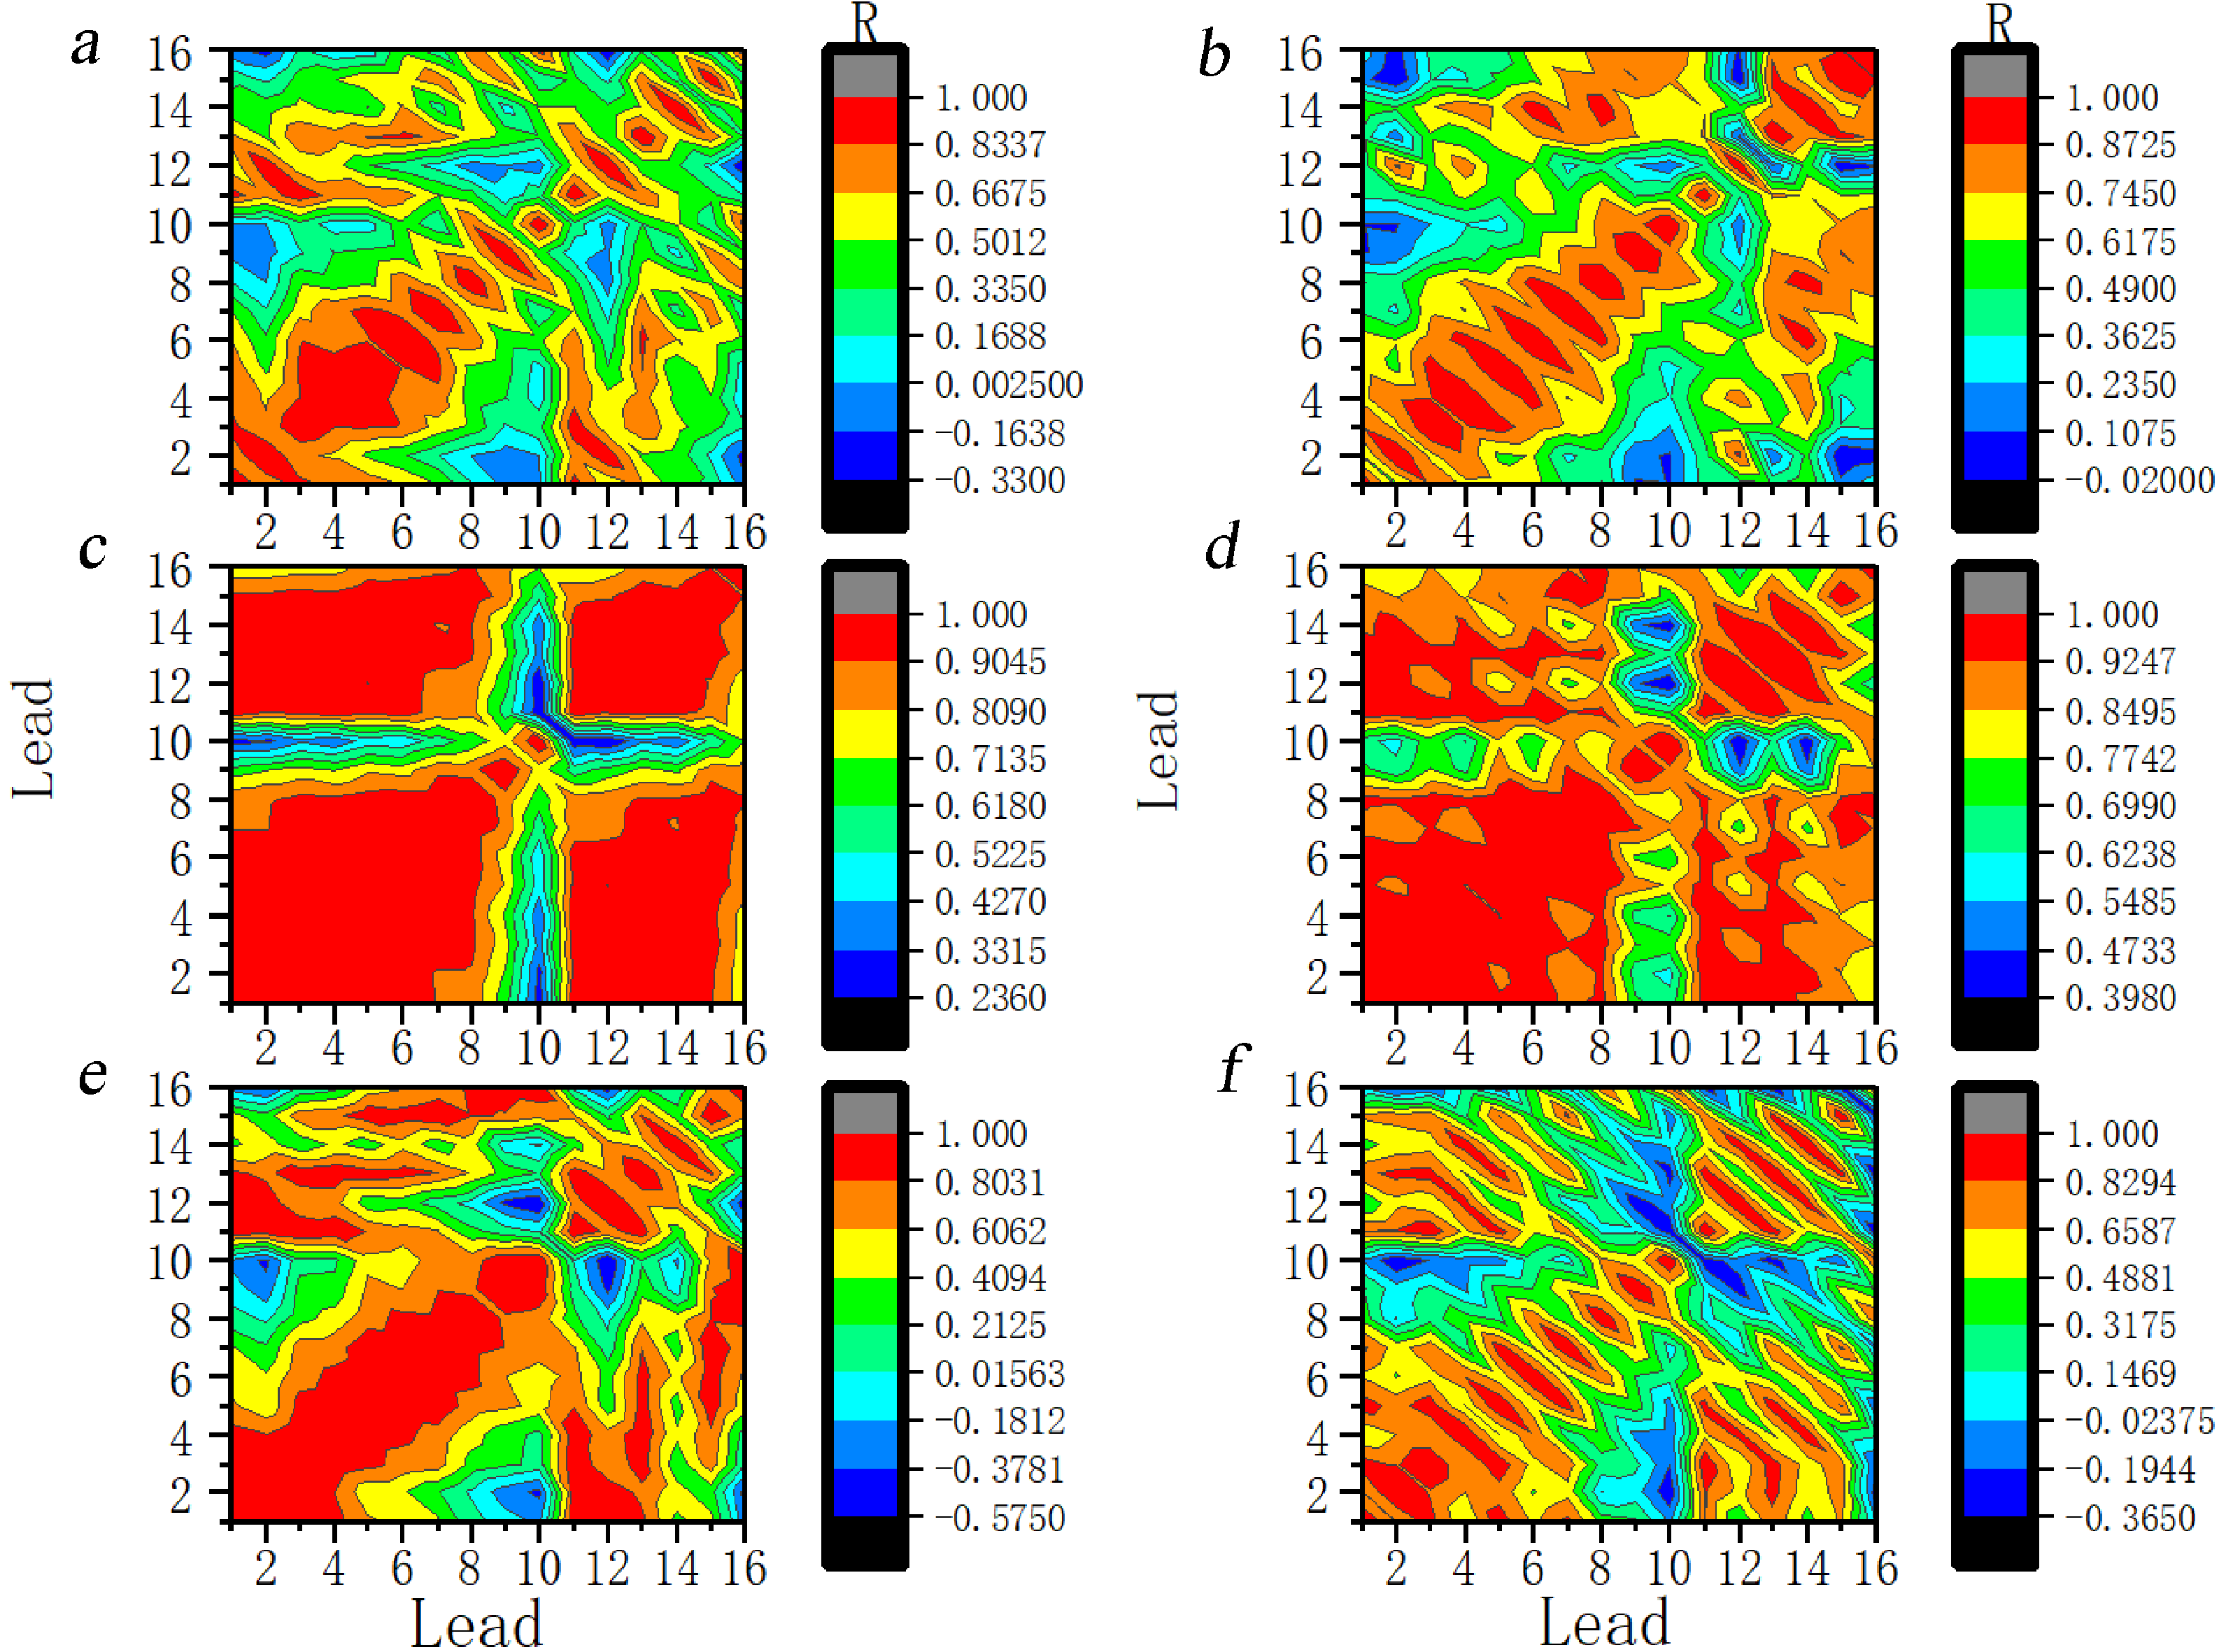 Fig. 14.
Dynamic evolution of correlation coefficients between the leads at the 17th scale for ictal EEG of JME subjects. Note: Lead 1–Lead 16 correspond to FP1–T6. (a) 2 s before seizure. (b) 1 s before seizure. (c) The first second of the seizure. (d) The 2 s of the seizure. (e) 1 s after seizure. (f) 2 s after seizure. R, Correlation coefficients.
Results reported in the previous subsection suggest that the correlations in the anterior head were the earliest to exhibit synchronization. The FP1 lead was chosen as the reference lead. In this study, the EEG in JME subjects were segmented into one second blocks to observe the change of correlation in different periods. The preictal period of JME subjects was characterized by disruption of the negative correlation between the anterior and posterior head leads and the gradual expansion of the range of leads with a positive correlation. Additionally, a further increase was observed in the coefficients of leads with a positive correlation during this period. The post-seizure period was characterized by both a gradual decrease in the range of leads with positive correlations and a gradual decrease in the coefficients of correlation. Results revealed a gradual recovery of the negative correlation between the anterior and posterior parts of the head. The extent of involvement of each lead was not the same throughout the seizure. Fig. 15 shows the dynamic evolution of correlation coefficients between FP1 and the other lead at the 11th scale for ictal EEG of JME subjects.
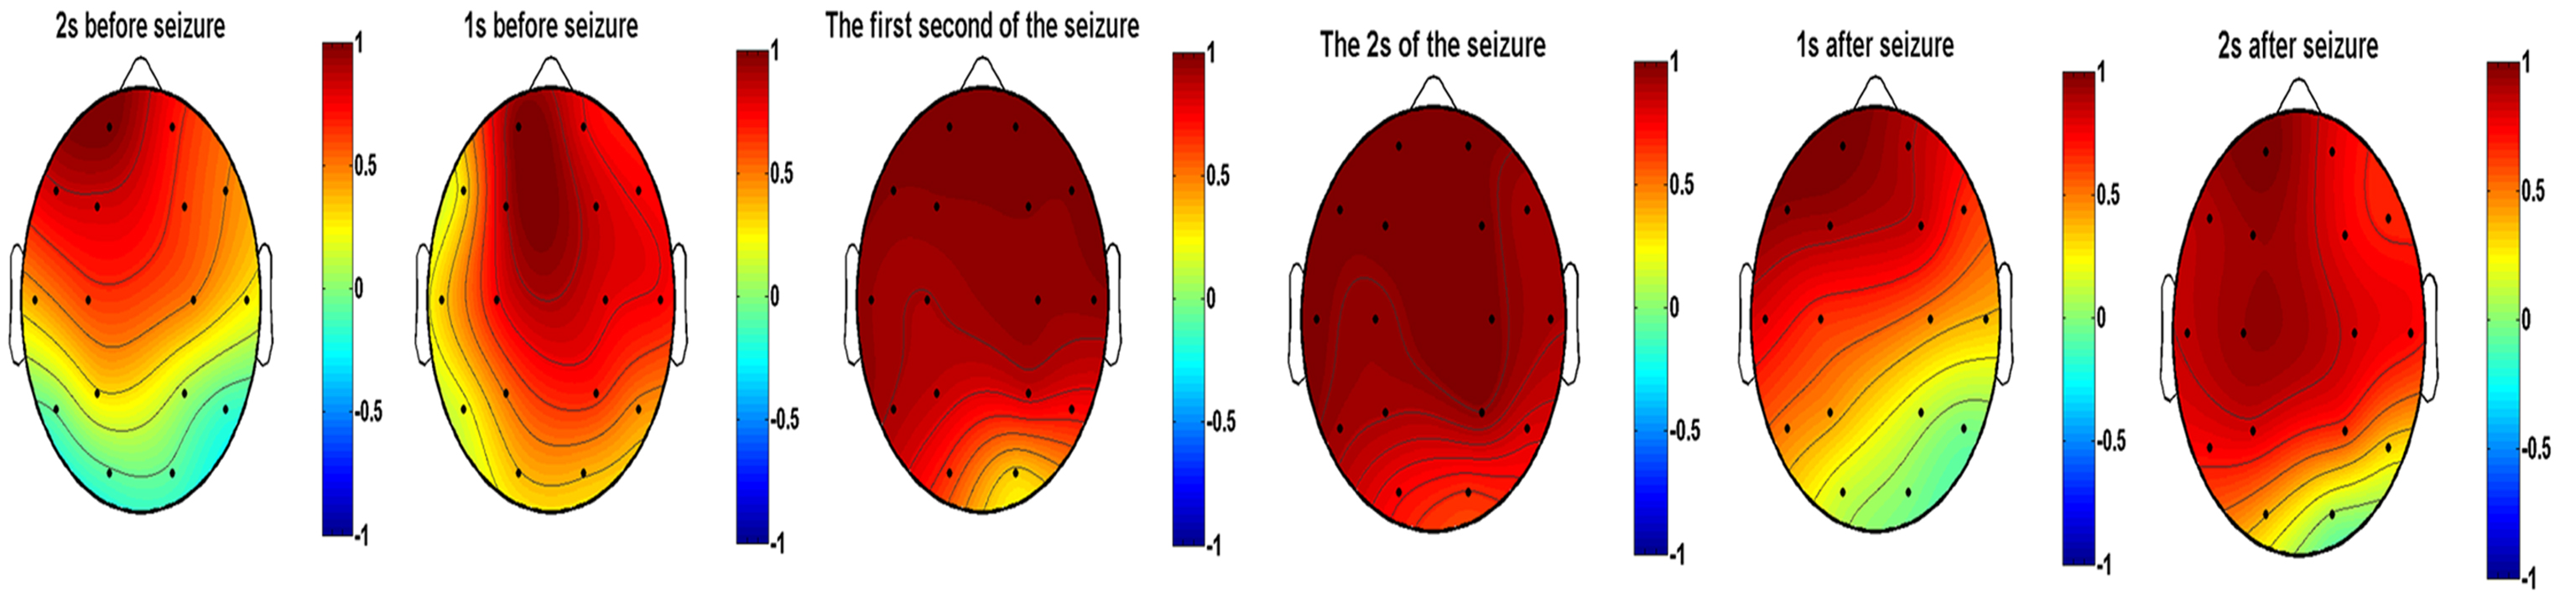 Fig. 15.
Dynamic evolution of correlation coefficients between FP1 and the other lead at the 11th scale for ictal EEG of JME subjects.
As shown in Fig. 16. A comparison of the interictal period and normal controls revealed that the interictal coefficient of correlation was higher in FP2, F4, and F8. The preictal correlation was higher in FP2, F3, and F8 in JME subjects than in the normal controls. It is shows that significantly higher correlation coefficients were found during seizure compared with controls for all leads except F7 and T5. The postictal correlations were stronger in FP2, F3, F4, and F8 in the JME subjects compared with normal controls.
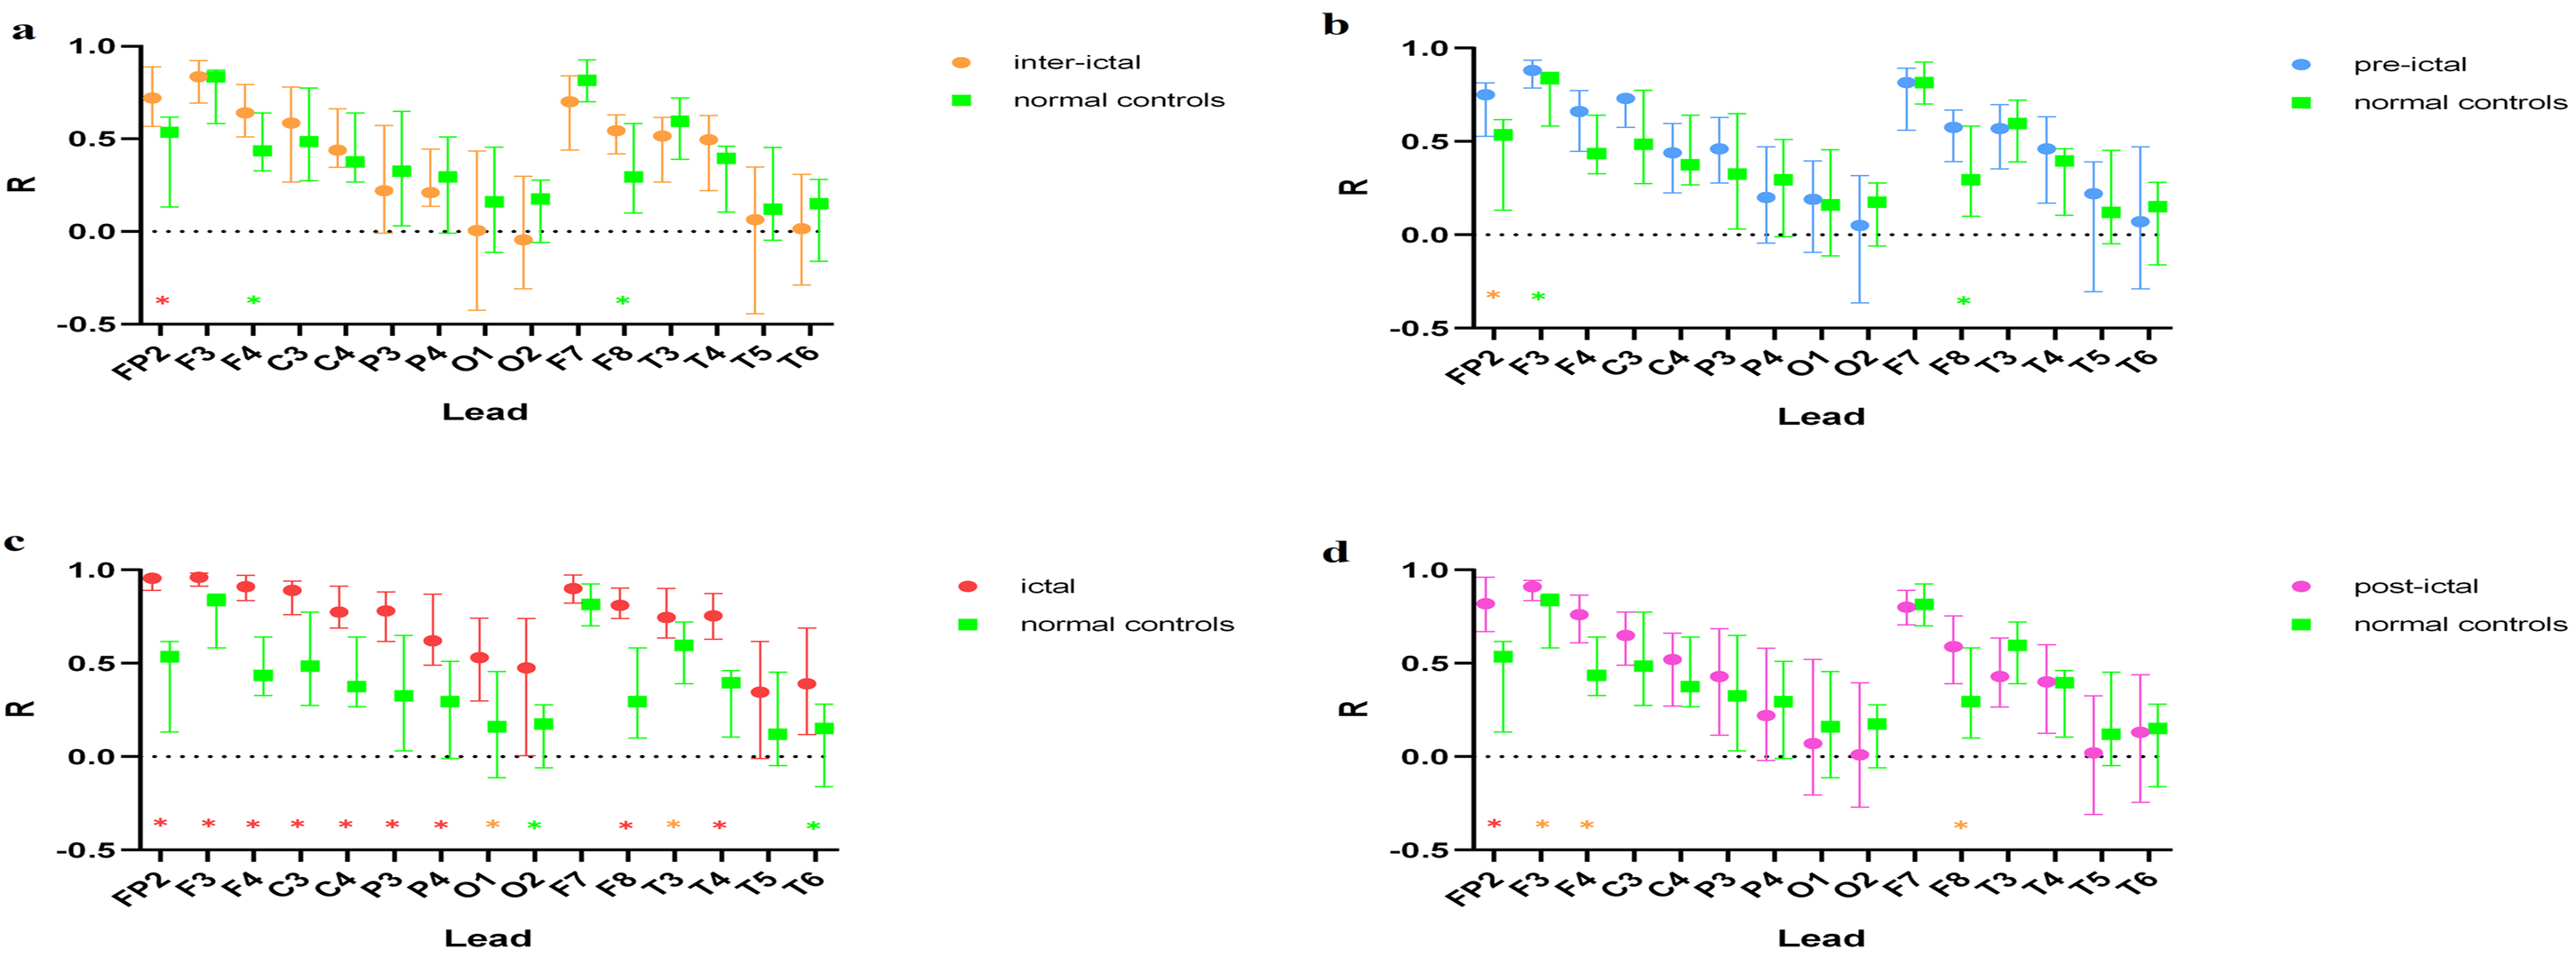 Fig. 16.
Comparison of the 11th scale EEG FP1 lead with other leads at
different periods in JME subjects and normal controls. Note: (a) Interictal vs. normal
controls. (b) Preictal vs. normal controls. (c) Ictal vs. normal controls. (d)
Postictal vs. normal controls. ✳(Red start): p
The mechanisms by which neural activity is coordinated at different spatial and temporal scales has long been a central question in neuroscience. It has been suggested that the activity of some neurons is generated by the joint coordination of all neurons [22]. According to this notion, large populations of neurons oscillate and synchronize in the low-frequency band, small populations of neurons are active in the high-frequency band and large populations of neurons guide small populations of neurons. Many investigators have examined the effects of CFC between slow waves and spindles during sleep on aspects of cognition in humans. It is generally accepted that the spindle patterns produced during sleep are closely related to memory consolidation in humans, that coupling between slow wave and spindle activity supports memory consolidation and that the loss of coupling is associated with cognitive decline and neurodegeneration [23, 24, 25]. Coupling has been suggested as a possible biomarker of cognitive impairment [26], but little is known about the coupling relationship during epileptic seizure. Neurologists have been searching for a more effective, safer and non-invasive biomarker to locate areas of epilepsy and predicted epilepsy. The advent of CFC may provide new ideas for epilepsy research [27, 28]. Here, the presence of coupling in JME seizure was determined and the relationship between amplitude and phase was described.
Many previous studies have examined the coupling between slow-wave oscillations and high-frequency bands (e.g., gamma band, ripple) [29, 30, 31, 32, 33]. The present study found strong PAC between the 11th and 17th scale during seizure in JME subjects. The amplitude of the 11th scale was modulated by the phase of the 17th scale. The EEG signal of the 17th scale persisted for some time both before and after seizure, possibly suggesting that the 17th scale slow-wave signal excites the emergence of the 11th scale signal, which strongly influences JME seizures.
Results reported here suggest that JME patients exhibit increased synchronization in all leads compared with normal controls. However, they do not immediately reach a peak state in all leads at seizure onset. This result accords with Mormann et al. [34]. Palmigiano et al. [35] found highly localized and stable synchronization areas in the lateral and middle ipsilateral temporal lobes during the phase and resection of stable synchronization areas was associated with seizure elimination. Throughout a seizure, leads are not involved to the same extent in relation to each other and there may be bilateral asymmetry. This is not entirely consistent with the traditional view of abnormal IGE discharges.
Network studies examining brain structure and function suggest a focal cortical origin and intraepileptic network propagation of JME epileptiform discharges. Recent studies have shown that generalized spike wave discharges in JME subjects do not involve the entire brain “comprehensively”, but selectively involve specific neural networks [36, 37, 38, 39]. This study found that JME seizure discharges first exhibit correlation in frontal regions, then spread to the posterior leads. The strongest correlations were found in frontal regions during seizure. Increasing correlations in most leads during JME seizure suggest that abnormal electrical activity spreads throughout the bilateral brain. In the preictal and postictal periods, certain regions retain stronger correlations with each other. This may suggest the nature of the focal origin during abnormal electrical generation of JME.
The functional brain network is a description of the dynamic interaction of different neurons and the connectivity of the functional brain network reflects the temporal sequence of neuronal activity in different regions. Most recent studies of this topic have suggested that the generation of epileptiform discharge in JME involves the cortico-thalamic loop, but the causal relationship between the thalamus and the cortex is not yet clear. Numerous animal and imaging studies have challenged the conventional notion that the origin of generalized epilepsy involves the whole brain. In generalized tonic clonic patients, three hertz stimulation of the centromedian thalamic nucleus induces generalized spike wave discharges [40]. Developments in imaging provide new possibilities for the discovery of the pathogenesis of JME. Emerging imaging techniques suggest that seizure in JME patients may selectively involve different brain regions, forming a core network of structurally and functionally connected epileptiform activity that plays an important role in the evolution of seizure. For example, Alhusaini et al. [41] used voxel-based morphometry techniques and found a simultaneous increase in local gray matter thickness in the bilateral prefrontal and central frontal lobes and a significant decrease in bilateral thalamic volume in JME subjects. Gong et al. [42] used magnetic detection to capture changes in white matter in JME subjects and found that the JME group showed an increase in mean diffusion of the bilateral frontal-callosal connections compared with normal controls. Kagawa et al. [43] used a gradient magnetic topography technique to study the magnetic field gradients of cortical spike/polyspike wave activity during seizure in JME subjects and ultimately found that their epileptogenic zones were bilaterally localized in the frontal and parietal regions. Additionally, some investigators have proposed the reclassification of JME from IGE to a frontal variant of multiregional thalamocortical network epilepsy [44]. In JME subjects, it has been demonstrated that a region of the frontal cortex passes directly to the thalamus via an anatomical bundle and the degree of abnormal connectivity was found to be correlated with disease severity [45].
Low-frequency oscillation has been studied by an increasing number of investigators and low-frequency EEG components have been found to play an important role in seizures. Westin et al. [46] found that all patients exhibited a statistically significant increase in delta (1–4 Hz) and/or theta (4–8 Hz) preinterictal epileptiform discharges compared to baseline using beamformer Dynamical Imaging of Coherent Sources. A large body of research indicates that infraslow activity is present throughout the entire epileptic seizure process, including pre-seizure and the interictal period. Ren et al. [47] found ISA in the 8–22 minutes before seizures in three patients with refractory epilepsy, characterized by periodic slow negative baseline shifts, occurring at long intervals of 40 to 120 seconds, until disappearing after the clinical seizure. The presence of ISA offers new perspectives for studying the dynamic changes in the epileptic process and for predicting seizures. Since ISA’s electric field is more localized compared to conventional frequencies, it plays a crucial role in localizing the epileptogenic zone, providing an additional parameter for its characterization. The results of this study show that low-frequency EEG signals at the 17th scale (0.4 Hz) persist before and after JME seizures and closely affect it.
(1) The number of patients included was small and larger patient samples should be examined in future studies.
(2) The cortex-based EEG technique in this study may not allow for analysis of deep brain structures.
(3) PAC was studied across scales during the seizure period. PAC during other periods should be examined in future studies.
To clarify the correlations in EEG signals in JME patients, this study used CWT methods to decompose and examine their EEG data as well as normal controls. There were several key findings:
(1) The EEG signal recorded during JME seizure exhibited hyper-rhythmic activity in two frequency bands at the 11th and 17th scales.
(2) PAC was observed between the 11th and 17th scales during JME seizure. In the case of IGE, an increase correlation coefficient between the different leads and the cross-scale PAC may provide an electrophysiological parameter for seizure detection and prediction.
(3) At the onset of a seizure, the anterior head first showed an increase in correlation, which gradually expanded to the posterior head and showed a significant increase in correlation in all leads, but the area of increasing correlation sometimes did not involve certain posterior head leads. This suggests that JME may originate in the anterior head and gradually extend into the posterior head.
The datasets used and analyzed during the current study are available from the corresponding author on reasonable request.
QY, CW designed the research study. QY, CW, LL performed the research. YW, YC, MZ provided help and advice on the experiments. QY, CW analyzed the data. All authors contributed to editorial changes in the manuscript. All authors read and approved the final manuscript. All authors have participated sufficiently in the work and agreed to be accountable for all aspects of the work.
The study was conducted according to the guidelines of the Declaration of Helsinki, and approved by the Ethics Committee of Tianjin Union Medical Center (approval number: 2023-B90).
Not applicable.
This study was sponsored by Tianjin Health Research Project (No.TJWJ2022ZD005).
The authors declare no conflict of interest.
Publisher’s Note: IMR Press stays neutral with regard to jurisdictional claims in published maps and institutional affiliations.