
- Academic Editor
The enterotype concept allows the differentiation of gut microbiota in relation to individual characteristics and is determined by the genetics and external stressors of the host. It was previously shown that not all clustering methods can accurately identify such enterotypes. Therefore, this pilot study primarily aimed to compare different algorithms for enterotype definition and to estimate the factors that correlate with the differentiation of the gut microbiota in adolescents with different body weights.
Adolescents with normal body weight (N) and obesity (O) (aged 11–17 years) were included in this pilot study. Based on the analysis of the V3–V4 variable regions of the 16S ribosomal RNA gene amplicon libraries, the main enterotypes of the gut microbiota of adolescents were characterized using three approaches (E-typing A, B, and C) according to the bacterial taxa that were chosen for differentiation. For sample clustering, we used Bray–Curtis, Jensen–Shannon divergence, and weighted and unweighted UniFrac distance metrics. Clustering was assessed using the silhouette index. Meanwhile, the Kruskal–Wallis test was used to determine the relationship between enterotype and biochemical parameters.
The O and N groups comprised 18 and 22 adolescents, respectively, and, according to anthropometric data, differed significantly only in weight and body mass index (BMI). The linear discriminant analysis effect size (LEfSe) plot showed that the presence of minor and rare phylotypes in the gut microbiota differed between the two groups of adolescents. The distribution of individual samples based on the principal coordinates analysis (PCoA) showed that the gut microbiomes in the adolescents were not grouped in the N or O groups but were distributed according to the composition of the main bacterial taxa. We assessed the contribution of the Bacteroides, Prevotella, Subdoligranulum, and Ruminococcus phylotypes to the microbiota of the adolescents in the two groups. The Subdoligranulum enterotype was significantly more represented in the N group than in the O group when the E-typing A approach to enterotyping was applied. Pairwise comparisons were performed with corrections for multiple testing between the biochemical parameter levels of the different enterotypes. Bilirubin levels were lower in adolescents with the gut microbiota enterotype Ruminococcus–Subdoligranulum than in those with the enterotype Bacteroides when the E-typing B approach was used for differentiation.
This pilot study comprised a small group of adolescents with normal body weight and obesity; we identified Bacteroides as the main enterotype, regardless of body weight. A stable microbial community is formed in the gut during adolescence, which determines its stratification by enterotype.
Gut microbiota vary greatly not only between individuals but also within individuals throughout life. The enterotype concept, proposed in 2011, stratifies the microbiome to reduce its global variation into several categories [1]. The authors described three distinct clusters or enterotypes, which were named according to their dominant bacterial species: Bacteroides (enterotype 1), Prevotella (enterotype 2), and Ruminococcus (enterotype 3) [1]. It was initially noted that enterotypes were not as clearly demarcated as human blood types. This clustering can be correctly represented as “densely populated areas in the multidimensional space of community composition” [1]. Over the past 15 years, research related to human microbiota typing has developed in several directions: studies that examine variations in sample collection and patient recruitment, as well as the effectiveness of different bioinformatics algorithms on typing results [2, 3]; typing depending on environmental stress factors, nutrition, and lifestyle [4, 5, 6, 7]; typing depending on the age-related dynamics of the gut microbiome in infants, children, adolescents, adults, and centenarians [8, 9, 10]; typing depending on the disease [11, 12, 13]; and typing depending on the human body biotopes [14, 15]. Genetic studies have contributed more to the concept of typing the human microbiota and the formation of stable clusters in time and space under certain external factors. The search for specific loci in the human genome that correlate with the microbiota and have a probable functional impact on the host was carried out based on analyses of single-nucleotide polymorphisms (SNPs) obtained from both metagenomic data and genome-wide association studies [16, 17, 18, 19]. The study showed that among host genes that correlate with the microbiome, there is a significant enrichment of genes involved in the leptin signaling pathway, as well as immune-related pathways [16]. Bonder and co-authors showed an association of a functional single nucleotide polymorphism in the lactase gene (LCT) — which was studied in connection with adult-type lactose intolerance and the inability of adults to digest milk — with the number of Bifidobacterium [17]. In developing this research, Kurilshikov and co-authors [19] in a cohort study of the MiBioGen consortium showed an age-related association between the LCT locus and the number of Bifidobacterium. Cohort studies from the Genetic Environmental Microbial Project examining healthy first-degree relatives of patients with Crohn’s disease assessed the association between gut microbiota composition and host genetic variation and identified heritable fecal bacterial taxa [18]. Genetic studies of dizygotic and monozygotic twins have made it possible to calculate the heritability of specific components of the gut microbiota and link microbial abundance to host gene alleles [20]. These studies confirm that humans and the microbiome have coevolved into complex relationships, resulting in microbiota structures that remain stable under certain conditions. This has been attributed to the functional diversity and metabolic redundancy of microorganisms.
The establishment of the gut microbiota in the first year of life, its development up to the age of three, the formation of the adult-type microbiota, and the characteristics of the microbiota of centenarians are the key areas of research into the gut microbiota in association with microbiota development from delivery to the adult type. In some cross-sectional studies, the authors not only mention dominant taxa but also provide examples of clustering according to different dominants. Microbial colonization in the first time is determined by perinatal factors such as cesarean section [21], gestational age [22], formula feeding [23, 24], and antibiotic use [25]. By describing in longitudinal studies the development of the gut microbiota of children and characterizing age-related types of microbial communities, it can be concluded that there are individual dynamics in the trajectory of gut microbiota development, which depends on many factors [10, 26, 27, 28]. Adolescence during puberty has received much attention, particularly in the context of the role of the gut microbiota. In a longitudinal research, Ou et al. [10, 27] examined gut microbiota development in children aged from birth to 14 years. The primary objective of their research was to establish the association between gut microbiome clusters and internalizing and externalizing difficulties and social anxiety during puberty, a period that is highly significant in the development of mental health issues. The authors identified four distinct microbial clusters formed during puberty in these children [10]. In addition to identifying clusters, the authors identified individual bacterial taxa associated with more externalizing behavior and social anxiety. In another study, Xu et al. [29] examined the prospective association of gut microbiota enterotype with the timing of puberty and the potential interaction of age and weight in children. The authors showed that children with the Bacteroides enterotype had a later menarche/vocal fracture than those with the Prevotella enterotype. Moreover, this association was more evident among younger children with a higher standard deviation score (SDS) of the body mass index (BMI). Thus, by adolescence, children have formed certain gut microbiota structures, the qualitative and quantitative composition of which reflects the individual characteristics of the child, determined not only by his or her genetics but also by lifestyle, nutrition, and environmental factors.
Note that sample clustering can be performed using different methodological approaches. Koren et al. [2] tested the stability and sustainability of the enterotype concept using data from the International Human Microbiome Project. They showed that most human body habitats showed smooth gradients in the abundance of key genera without distinct clustering of samples with bimodal (e.g., gut) or multimodal (e.g., vagina) abundance distributions. The authors note that not all clustering methods are effective in identifying such clusters. Since identifying enterotypes in datasets depends not only on the structure of the data but also on the sensitivity of the methods used to determine the strength of clustering, the authors suggested using and comparing multiple approaches when testing for enterotypes [2].
Since 2016, the Scientific Center for Family Health and Human Reproduction Problems (Irkutsk) has been conducting research on the gut microbiome of adolescents with normal body weight and obesity. The features of the composition and structure of the gut microbiome of adolescents with obesity, different durations of breastfeeding [30], and different types of obstetric care [31] have been reported. A comparison of the bacteriological data of the normo- and pathobiota with the results of amplicon sequencing was performed [32, 33, 34], as was a pilot study of the diversity and predictive metabolic functions of the gut microbiome in adolescents with obesity and normal body weight [35].
The aim of this pilot study was to compare different algorithms for enterotype definition and to estimate the factors that correlate with the differentiation of the gut microbiota in adolescents with different body weights.
Adolescents aged 11–17 years with different body mass indices were recruited
for the pilot study. They were sent for examination to Clinic of the Federal
State Budgetary Institution “Scientific Center for Family Health and Human
Reproduction Problems” (Irkutsk). The criteria for study inclusion, collection
of biological material, sample preparation, and method of processing the
sequencing data were previously published [30, 36, 37]. Briefly, the inclusion
criteria for the study were a physiological birth, the presence of normal body
weight (BMI
The sampling size for a cross-sectional study is calculated using the formula: n
= Z2
The pilot study was conducted in accordance with the Declaration of Helsinki 1964, with subsequent changes, and approved by the local ethics committee of the Scientific Center for Family Health and Human Reproduction Problems (protocol number 6, date of approval 21 December 2015). The study comprised participants who met the inclusion criteria and did not meet the exclusion criteria provided that their parents or legal representatives, as well as the adolescents aged above 15 years, signed a voluntary informed consent.
Feces collection and metagenomic analysis of the amplicons of the V3–V4 variable regions of the 16S rRNA gene were previously described [30, 37]. Shortly, feces were collected using a home fecal collection kit according to the instructions, and transportation and sample preparation under laboratory conditions were performed within 4–24 hours. The home fecal collection kit included all the necessary components to collect the biomaterial without exposing it to non-sterile surfaces or water. The kit also included a refrigerant to ensure transportation at a temperature of about 4 °C. In the laboratory, the biomaterial was divided into aliquots and frozen at –80 °C until further use.
DNA was isolated from the fecal samples using zirconium beads
(BeadBug™, 0.5 mm zirconium beads, Z763772, Sigma, Rockville, MD,
USA) and a commercial kit (QIAamp DNA Stool Mini Kit, Qiagen, Stockach, Germany)
according to the manufacturer’s protocol [30]. Briefly, the lysis buffer from the
kit and zirconium beads, which provide physical destruction and chemical lysis,
were added to an aliquot of the biomaterial weighing between 150 and 200 mg. DNA
purification was performed according to the to the guidelines provided by the
manufacturer. The quality and quantity of the DNA were assessed using 1% agarose
gel electrophoresis, Nano-500 Allsheng spectrophotometer (Hangzhou Allsheng
Instruments Co., Ltd., Hangzhou, China), and a Qubit 4 fluorimeter
(Qubit™ 4 Fluorometer, Thermo Fisher Scientific, Waltham, MA, USA).
Qubit dsDNA HS Assay Kit (Qubit™ dsDNA HS Assay Kit, 500 assays,
Thermo Fisher Scientific, Waltham, MA, USA) was used according to the
manufacturer’s protocol. For metagenomic analysis, only those DNA samples meeting
the following criteria were submitted to the company: a quantity
Metagenomic analysis of the amplicons of two variable regions of the 16S rRNA gene (V3–V4) was done by Novogene Company (Beijing, China). The raw reads and sample description were registries in the National Center for Biotechnology Information (NCBI) database as BioProject PRJNA604466. Processing of the 16S rRNA amplicon sequencing data was described previously [35, 37].
Anthropometric measurements and laboratory tests of the blood samples to measure the liver transaminases (alanine aminotransferase (ALT) and aspartate aminotransferase (AST)), bilirubin, insulin, glucose, and lipid spectrum were described previously [36]. Briefly, the anthropometric measurements were carried out by a qualified pediatrician in the morning. The BMI calculations were performed from the height and weight measured using a stadiometer and an electronic scale. SDS BMI was calculated and used according to international recommendations [40]. Blood samples were obtained after an overnight fast; atherogenic index (AI) was calculated as (TC‒HDL)/HDL (where TC, total cholesterol value; HDL, high density lipoprotein value). The anthropometric and biochemical parameters of the study’s participants are presented in Table 1.
| Indices | N group (n = 22) | O group (n = 18) | p-value |
| Sex | female (n = 9) | female (n = 8) | |
| male (n = 13) | male (n = 10) | ||
| Age, years | 14.72 |
14.70 |
0.942 |
| Height, cm | 170.60 |
171.10 |
0.147 |
| Weight, kg | 58.70 |
95.60 |
0.037 |
| BMI | 19.97 |
32.57 |
0.0001 |
| SDS BMI | 0.008 |
2.70 |
0.632 |
| TC, mmol/L | 4.10 |
4.80 |
0.583 |
| TG, mmol/L | 0.93 |
1.19 |
0.003 |
| HDL cholesterol, mmol/L | 1.45 |
1.30 |
0.966 |
| LDL cholesterol, mmol/L | 2.31 |
2.95 |
0.992 |
| AI | 1.96 |
2.83 |
0.097 |
| Glucose, mmol/L | 4.80 |
5.03 |
0.190 |
| Insulin, mU/L | 8.30 |
15.20 |
0.704 |
| ALT, U/L | 21.50 |
29.37 |
0.601 |
| AST, U/L | 37.34 |
27.70 |
0.015 |
| Bilirubin, µmol/L | 13.37 |
8.90 |
0.007 |
BMI, body mass index; SDS BMI, standard deviation score of the body mass index; TC, total cholesterol; TG, triglycerides; HDL cholesterol, high density lipoprotein cholesterol; LDL cholesterol, low density lipoprotein cholesterol; AI, atherogenic index; ALT, alanine aminotransferase; AST, aspartate aminotransferase.
All calculations were performed using the R version 4.4.2 (Bell laboratories, Murray Hill, NJ, USA) [41] and R-Studio version 2024.12.0+467 (Posit Pbc, Boston, MA, USA). Previously, we analyzed taxonomic diversity and described the structure of the gut microbiota community in adolescents with obesity [35, 37]. Using QIIME2 (Caporaso Lab, Flagstaff, AZ, USA) [42], we generated an amplicon sequence variant (ASV) table and determined the taxonomic affiliation for each ASV. We further used these data in the following analyses [35, 37].
We calculated the Bray-Curtis (BC) distance matrix and constructed a principal coordinates analysis (PCoA) ordination graph with distribution vectors of the numbers of the largest phylotypes. To calculate the ecological metrics of the BC distance and construct the PCoA ordination graph, the R packages “vegan” version 2.5-6 and “ape” version 5.8 were used.
Clustering was performed by partitioning the medoids in the R package “cluster” v.2.1.6.
The previously recommended enterotyping method uses distance metrics such as
Jensen-Shannon divergence, Bray-Curtis, or weighted and unweighted UniFrac [1, 2]. We calculated the distance matrix for the Jensen-Shannon divergence (JSD)
The number of clusters and quality of the resulting clusters were selected based
on the value of the silhouette index (SI) [2, 43]. To distinguish between the
presence and absence of clusters in the data, we considered the following
threshold values. For the SI, a score of 0.5 for moderate clustering and
We reduced the ASV frequency table to the genus level and determined the
relative abundance of each taxon in the sample (percentages of the total
community abundance). The key taxa for our pilot study were Bacteroides,
Prevotella, and Ruminococcus because other authors used them to
type the gut microbiota [e.g., 1, 2]. Based on the mean value
The Kruskal-Wallis test was used to determine the difference between the typing
variant and the average biochemical parameters of the adolescents. The Wilcoxon
test was used to perform pairwise comparisons between groups, with correction for
multiple testing. The difference was considered reliable at a p-value
We compared the anthropometric and biochemical parameters between obese and normal-weight adolescents (Table 1). According to the results of the statistical tests, among the anthropometric parameters, the weight of the patients and the body mass index differed significantly between the groups. For the biochemical parameters, we found differences in TG, AST, and bilirubin.
This pilot study analyzed 40 amplicon libraries from the gut microbiomes of adolescents. In the first stage of the bioinformatics analysis of the obtained data, we searched for differences between the two groups of adolescents, N and O. The linear discriminant analysis effect size (LEfSe) plot showed that the two groups of adolescents differed in the presence of phylotypes with different taxonomic identifications. In the N group, the phylotypes of Bacteroidia were classified at the class level and Phascolarctobacterium at the genus level. In the O group, there were phylotypes of the Prevotellaceae family and the genus Negativibacillus (Fig. 1). However, it should be noted that the representation of these phylotypes in the gut microbiomes of the two groups of adolescents did not exceed 0.02, 0.51, 1.19, and 4.29% for Negativibacillus, Bacteroidia, Phascolarctobacterium, and Prevotellaceae, respectively. These phylotypes are minor and rare in the gut microbiota.
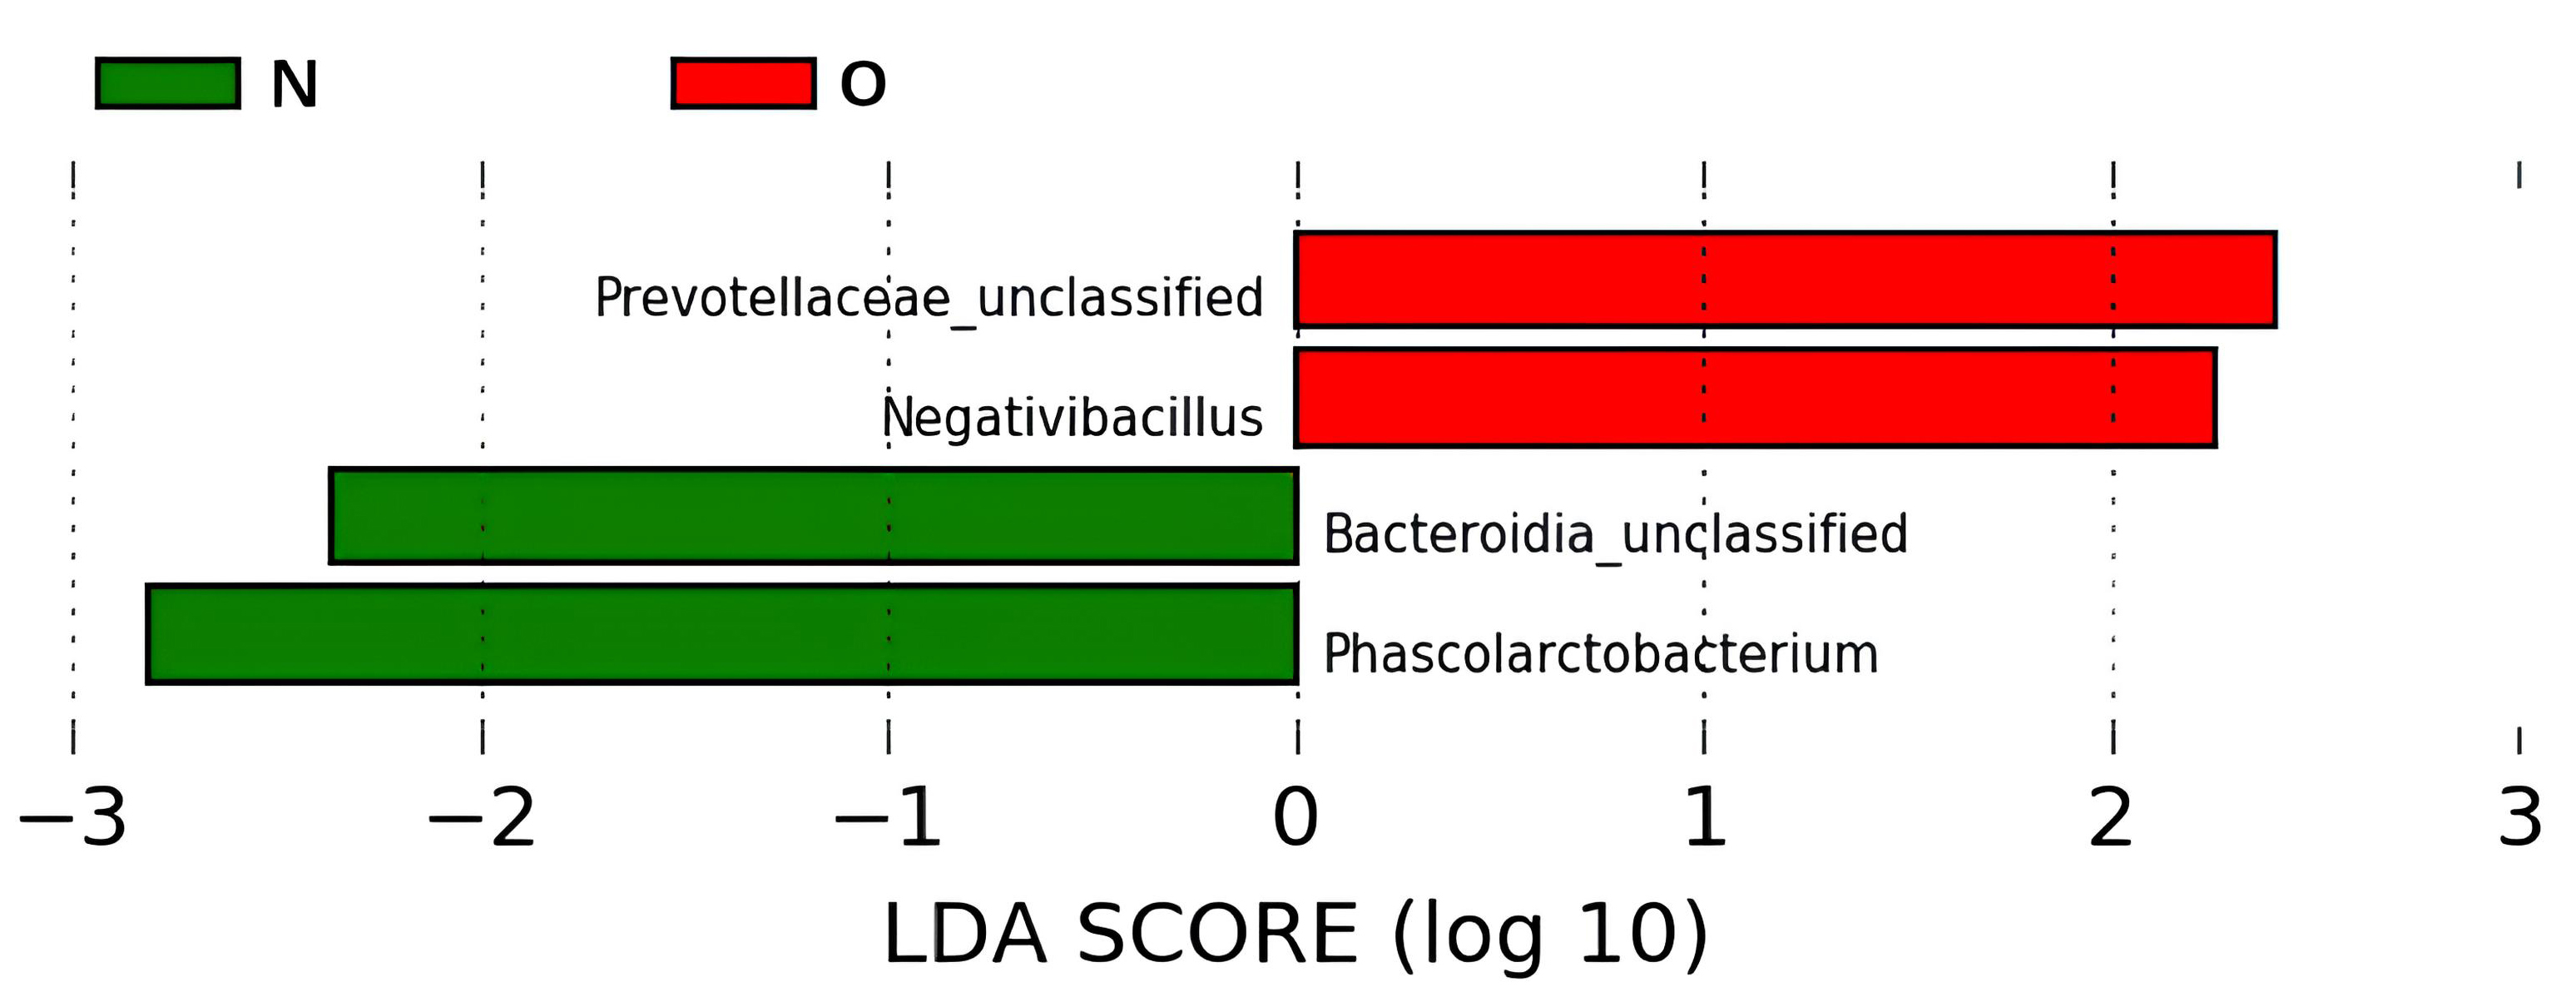 Fig. 1.
Linear discriminant analysis effect size (LEfSe) plot with LDA score. This analysis determined the microbiome phylotypes most likely to explain the differences between the two groups of adolescents. Phylotypes were identified at the genus level. Abbreviations: N, normal body weight group; O, obesity group; LDA, linear discriminant analysis.
The search for taxa that are determinants of gut microbiota structure is of obvious interest. The distribution of individual samples based on BC distance data by multidimensional scaling using the PCoA method showed that the adolescent gut microbiomes were not grouped as closely as the N or O groups but rather by composition and structure (Fig. 2). The main bacterial taxa influencing this clustering were the bacterial genera Bacteroides, Prevotella, and Subdoligranulum.
 Fig. 2.
Principal coordinates analysis (PCoA) graph based on the Bray-Curtis (BC) distance matrix. According to the Bray-Curtis distance matrix, gut microbiomes showed three distribution trends following dominant phylotypes: Bacteroides, Subdoligranulum, and Prevotella group 9. The dominant phylotypes are indicated in gray. Abbreviations: N, normal body weight group; O, obesity group.
Considering that Bacteroides and Prevotella are representative of the two taxa, on the basis of which microbiomes are stratified into enterotypes, we attempted to identify an algorithm for further differentiation of the adolescent gut microbiota.
The number of clusters in the studied data was determined using the SI on the JSD distance measures and weighted/unweighted UniFrac distances.
The SI values indicated that there was no strong clustering of the data in all
three metrics because the silhouette value did not exceed 0.18 at best for the
weighted UniFrac metric (Fig. 3). This indicates the absence of clearly defined
clusters that can be calculated based on the distance matrix of the
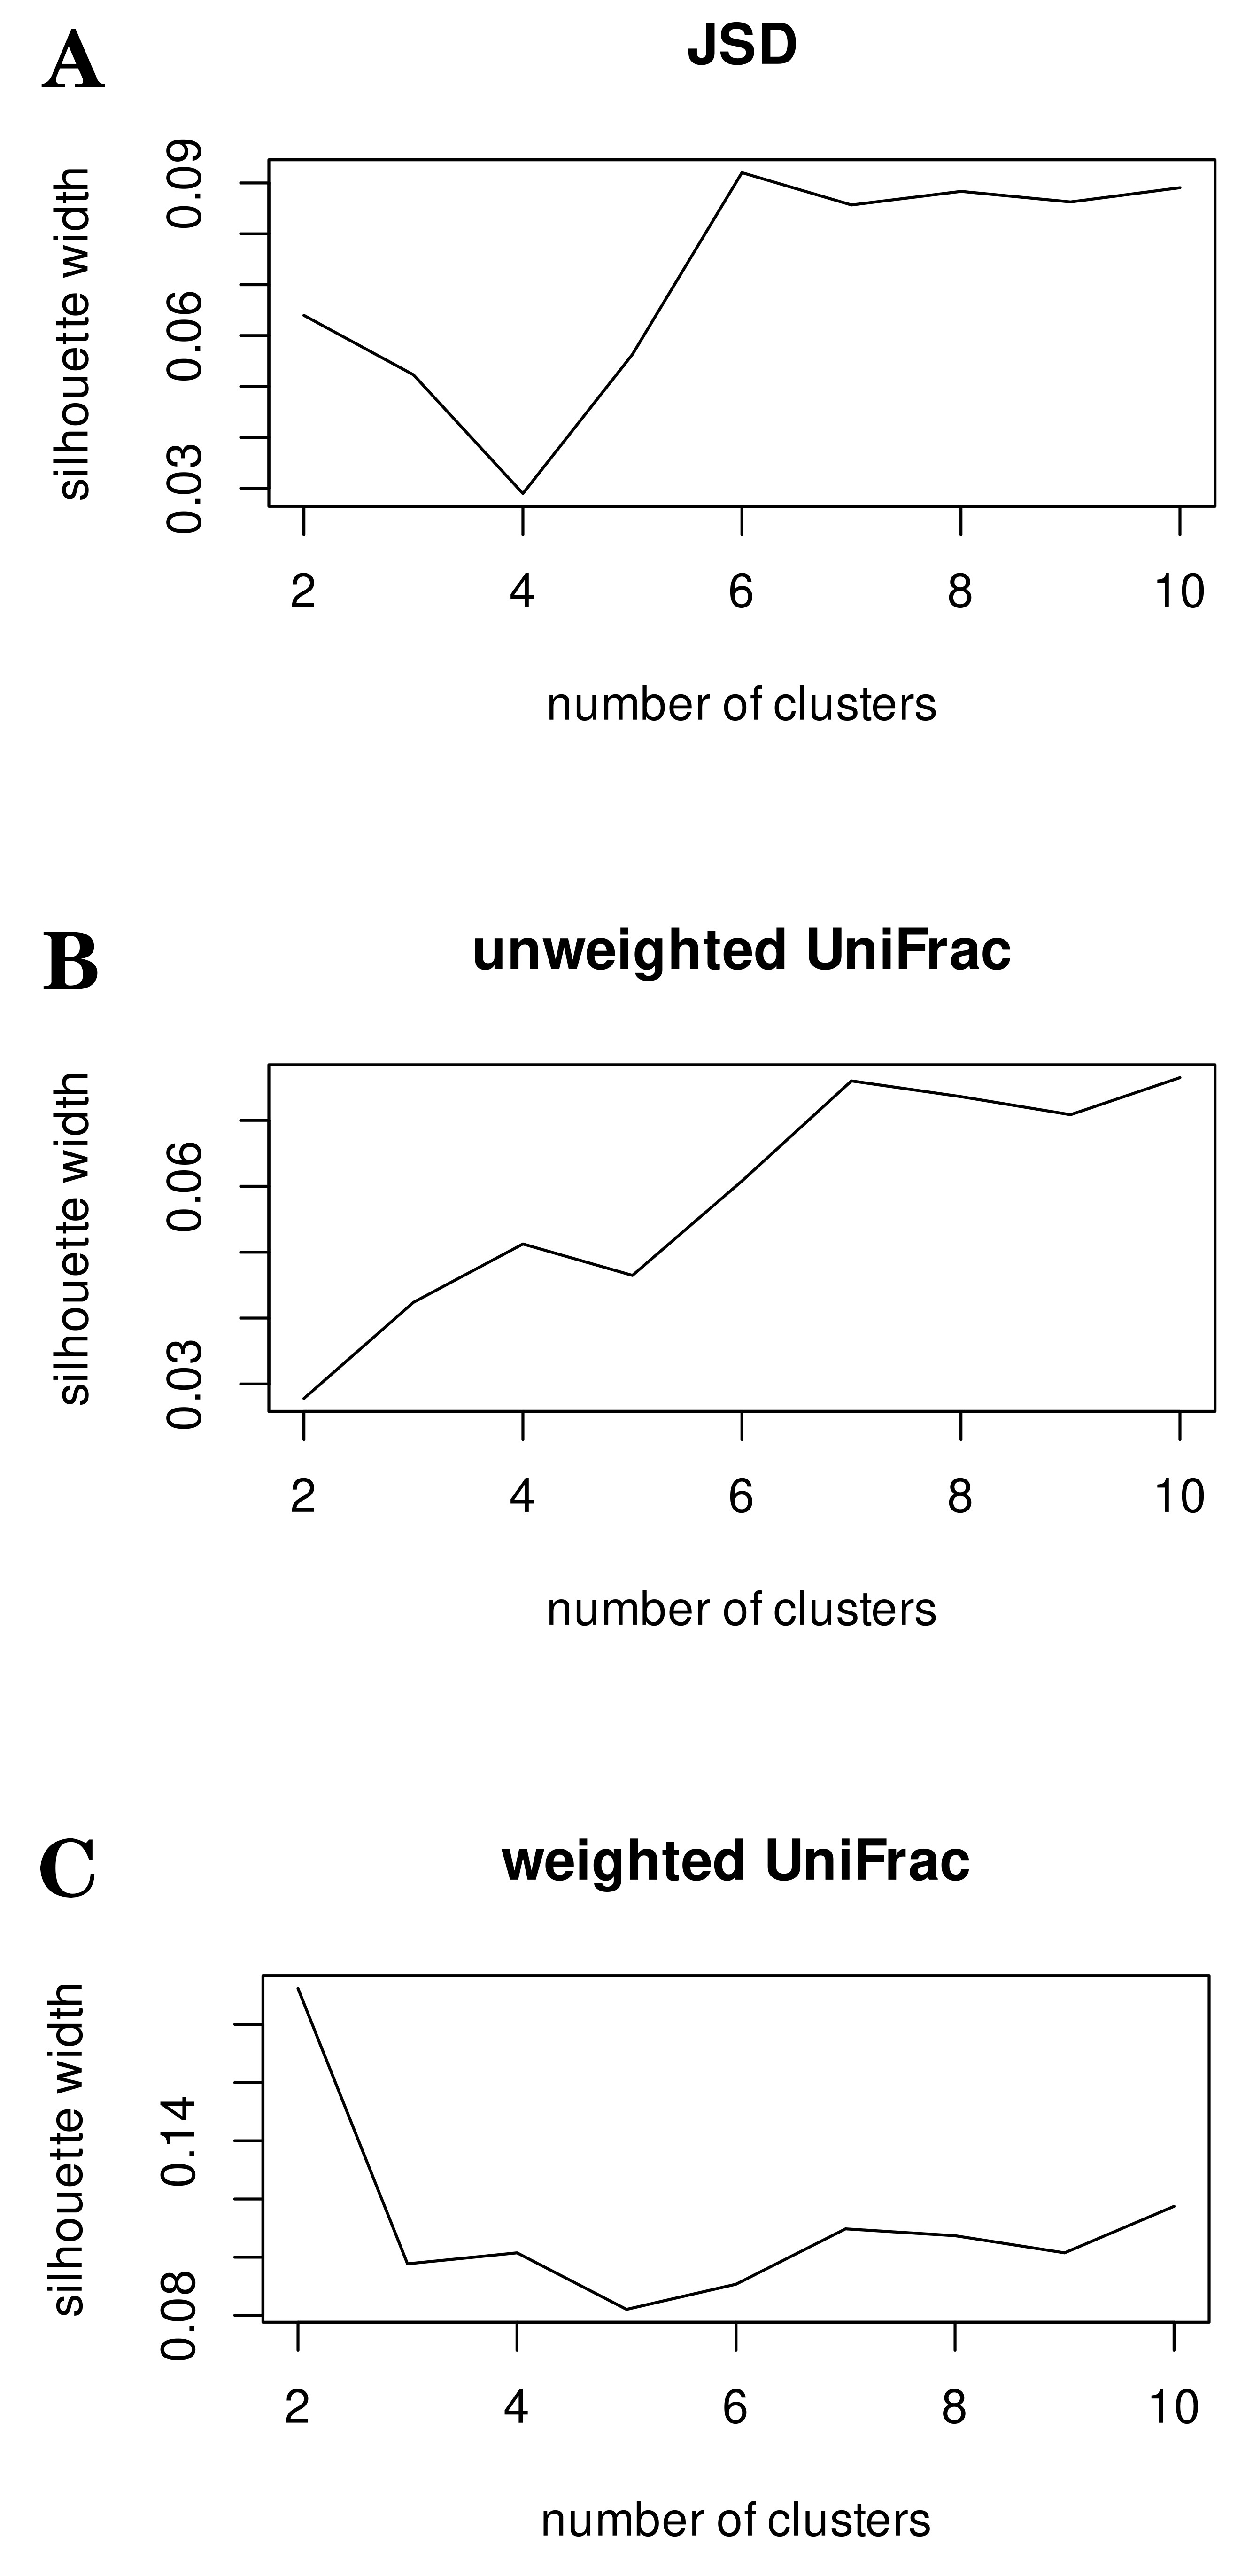 Fig. 3.
Silhouette index calculated based on three distance metrics. Testing enterotype clustering using silhouette index along with Jensen-Shannon divergence (JSD) (A), unweighted (B) and weighted UniFrac (C) distance metrics. This testing demonstrated that none of the distance matrices employed exhibited reliable clustering.
After obtaining weak results from the sample clustering, we decided to test another method for determining the gut community type. Gut microbiomes were differentiated based on the dominant taxa. We assessed the contribution of the Bacteroides, Prevotella, Subdoligranulum, and Ruminococcus phylotypes to the microbiota structure of adolescents in the two groups (Table 2). Note that the two bacterial phylotypes Subdoligranulum and Ruminococcus belong to the same family (Oscillospiraceae) and are part of the main pool of bacterial cells in the gut microbiome. Performing similar metabolic functions, they are an example of taxonomic diversity and functional redundancy of gut microbial communities. This ensures the stability and resilience of microbial communities under stressful environmental conditions.
| Approach | Group | Main phylotypes vs genera | |||
| E-typing А | Bacteroides (B) | Prevotella cluster 9 (P9) | Subdoligranulum (S) | ||
| N group | 28.82 |
3.27 |
3.88 | ||
| 15.33 |
18.19 |
2.43 | |||
| 11.40 |
5.52 |
17.32 | |||
| O group | 34.99 |
3.51 |
2.32 | ||
| 14.92 |
15.30 |
3.26 | |||
| 14.82 |
2.55 |
7.10 | |||
| E-typing B | Bacteroides (B) | all Prevotella (Pa) | all Ruminococcus + Subdoligranulum (RaS) | ||
| N group | 29.57 |
4.38 |
13.39 | ||
| 15.33 |
19.13 |
14.14 | |||
| 13.53 |
5.41 |
21.98 | |||
| O group | 43.48 |
2.96 |
12.09 | ||
| 18.48 |
23.37 |
11.08 | |||
| 14.72 |
4.37 |
17.82 | |||
| E-typing C | Bacteroides (B) | all Prevotella (Pa) | Subdoligranulum (S) | all Ruminococcus (Ra) | |
| N group | 29.57 |
4.38 |
3.83 |
9.57 | |
| 15.33 |
19.13 |
2.43 |
11.71 | ||
| 13.53 |
5.41 |
14.11 |
7.87 | ||
| O group | 43.48 |
2.96 |
2.91 |
9.18 | |
| 18.48 |
23.37 |
2.89 |
8.19 | ||
| 14.72 |
4.37 |
4.38 |
13.44 | ||
Note: N, normal body weight; O, obesity.
Thus, based on the results of testing various enterotyping (E-typing) approaches, the best result was obtained by analyzing the differential abundance of taxa. In the sample of adolescents analyzed, the main enterotype was Bacteroides. In both groups, the enterotypes dominated by Prevotella, Ruminococcus, and Subdoligranulum were determined. It was noteworthy that in E-typing A, the enterotype with the dominance of Subdoligranulum was significantly more represented in the N group than in the O group.
We performed pairwise comparisons with corrections for multiple testing between the biochemical parameter levels of the different E-typing approaches. Using the E-typing B approach, a significant difference in bilirubin levels was observed between the enterotypes Bacteroides (B) and Ruminococcus-Subdoligranulum (RaS) (Fig. 4). Lower levels of bilirubin were observed in the host in which the gut microbiota structure was dominated by Ruminococcus and Subdoligranulum than the Bacteroides-dominated phylotypes. The remaining biochemical parameters did not differ significantly.
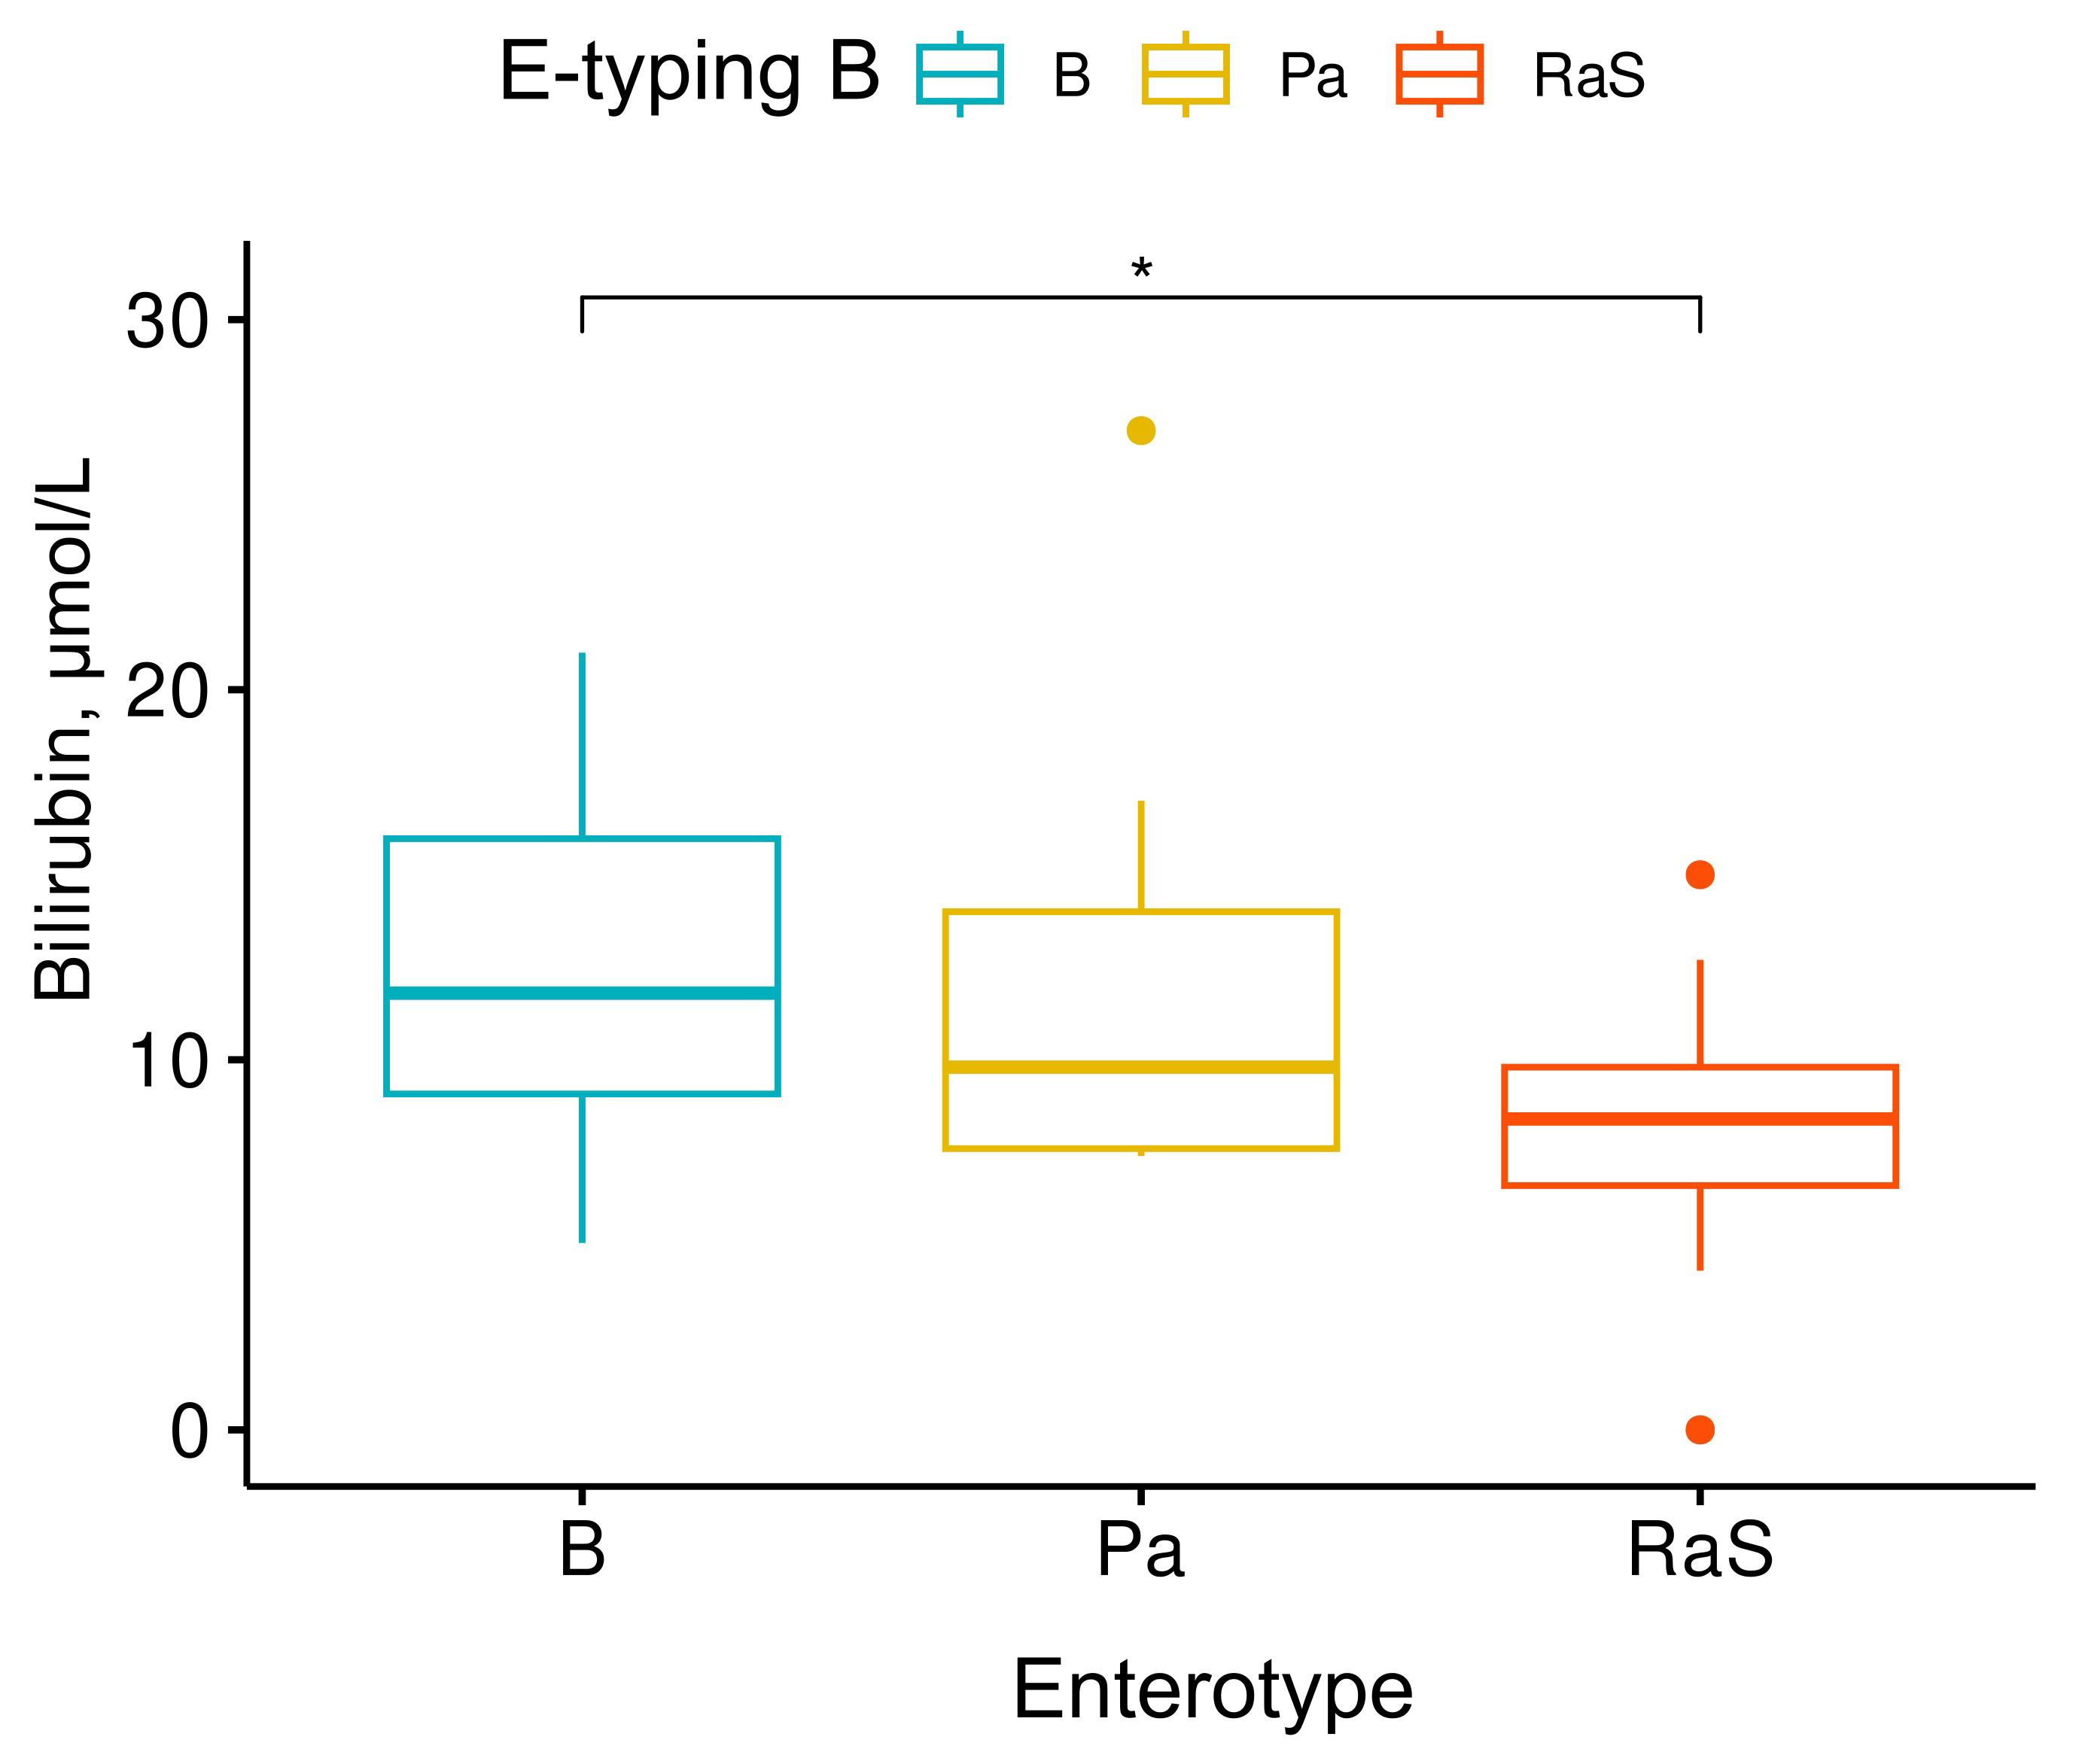 Fig. 4.
Differences in blood bilirubin concentrations in adolescents
belonging to different enterotypes of the gut community. In terms of blood
bilirubin levels, only the Bacteroides (B) and
Ruminococcus-Subdoligranulum (RaS) enterotypes differed significantly
from each other. Kruskall-Wallis test, x2 = 7.2, p-value = 0.027, n =
40. Pairwise test: Wilcoxon test, p-values adjusted using Bonferroni
correction. * - statistically significant changes (p
The human gut microbiota develops soon after birth and can acquire interindividual differences under the influence of hereditary and environmental factors. The development of the concept of enterotype [1], aimed at stratifying the human gut microbiome, showed that the results of enterotyping may vary in different age cohorts of the population. This is because the factors influencing the gut microbiome are enough to change its enterotype at different stages of life (infancy, childhood, adulthood, and old age) [8, 9, 10]. For example, in school-aged children aged 6–9 years (Netherlands), three enterotypes were identified, dominated by Bacteroides, Prevotella, and Bifidobacterium [44]. In addition, the authors noted that the duration of breastfeeding at an early age and the diet of preschool-aged children correlated with the composition and functional characteristics of the gut microbiota in school-aged children. This correlation clearly depends on the enterotype [44].
A study of the gut microbiota of healthy Asian children included 303 children aged from 7 to 11 years living in 10 cities in 5 countries (China, Japan, Taiwan, Thailand, and Indonesia). The average sample size ranged from 25 to 43 children, depending on the city [45]. The authors showed that most children in China, Japan, and Taiwan had the Bacteroides enterotype, whereas most children in Indonesia and Thailand, had the Prevotella enterotype. The Prevotella-dominated microbiota was characterized by a more conservative microbial community, sharing a greater number of type-specific phylotypes. The analysis classified the gut community as reflecting the location of the country of residence, suggesting that ecogeographic factors shape the gut microbiota [45]. Another study of the gut microbiota of 106 infants (aged 3–12 months) from three Asian ethnic groups, including 41 Chinese, 35 Malays, and 30 Indians, living in the same geographic location (Singapore), showed that delivery mode, breastfeeding status, and ethnicity were the main factors influencing the compositional development of the gut microbiota [46].
Studies on enterotype stability have been conducted mainly in cohorts of healthy adults, suggesting that adults already have established stable communities resistant to environmental stressor and, changes in diet and can stably recover to a normal state. For example, studies of the gut microbiota of healthy monozygotic pairs of Korean adults showed that the gut microbiota can be grouped into two enterotypes dominated by either Bacteroides or Prevotella [47]. Moreover, more than 72% of the paired samples from monozygotic twin pairs were belonged to the same enterotype. The microbial functions based on the Kyoto Encyclopedia of Genes and Genomes pathway were also divided into two clusters. For the Prevotella enterotype, 100% of the samples belonged to the same functional cluster, whereas for the Bacteroides enterotype, different functional clusters were identified. The Prevotella-dominated enterotype is more commonly linked to a fiber-containing diet [47, 48]. Pihelgas et al. [48] examined the stability of the gut microbiota in a 5-month multi-intervention nutritional study. The Prevotella-type microbiota responded more strongly to the tested dietary fibers, whereas the Bacteroides-type microbiota were least affected. The authors noted that the metabolism of the fecal microbiota depended on the individual microbiota type of the patients, and the relative abundance of bacteria remained stable during the baseline period and within the normal range of variation during the final period of the studies, which emphasizes the stability of a healthy microbiota [48].
The findings highlight enterotype-specific associations between host metabolic phenotype and dietary patterns. The importance of gut microbiome stratification was emphasized in a study of metabolic responses to nutrition and diet, as well as in nutritional interventions for the prevention and treatment of obesity and associated cardiometabolic disorders in adolescents [49]. Given that enterotypes are defined based on the gut microbiota, which is relatively stable but dynamic in response to interventions [4, 50, 51, 52, 53, 54], it is important to systematize the factors that influence the gut microbiome to change its enterotype. Factors that have a short-term influence on the composition of the microbiota may not be strong enough to change the enterotype [4], which is due to the reversibility and relative stability of the gut microbiota [54, 55, 56]. However, diet and antibiotic use have a significant impact on the gut microbiota [4, 57, 58, 59]. In the long term, food preferences are significantly associated with enterotype patterns [4, 52].
Raymond et al. [57] presented an example of how a patient’s enterotype can influence the effectiveness of antibiotics. When cefprozil was administered to the volunteers included in the study, an increase in the presence of Enterobacter cloacae complex bacteria was noted, with five out of six participants initially having a gut enterotype of Bacteroides with a lower diversity of bacteria [57]. Thus, it is important to consider the enterotype of the gut microbiome when prescribing antibiotics. In vitro model experiments with 10 different artificial gut microbiota (AGM) obtained by culturing fecal samples in a continuous fermentation system were used to study the metabolism of orally administered drugs [60]. The authors showed that the artificial microbial communities exhibited different metabolizing capacities for hydrolysis-mediated conversion of prodrugs to drugs. For the tested glucocorticoids, significant differences were obtained in the stability of the parent compounds and in their conversion rates to multiple reductive metabolites. AGMs dominated by the genus Bacteroides showed the highest conversion rate of parent glucocorticoids to several metabolites [60]. Understanding the role of the gut microbiota in drug metabolism, as well as the biological mechanisms linking different variations in gut microbial associations with clinical outcomes, is necessary for assessing the therapeutic efficacy of drug therapy and developing personalized medicine.
The various enterotypes are specified by the microorganisms that predominate within the microbiota, and the two main enterotypes are defined by the dominance of Prevotella and Bacteroides. The microbiota dominated by Prevotella and Bacteroides are associated with long-term diet, which is associated with complex carbohydrate intake and leads to increased protein and animal fat intake [4, 47]. Prevotella and Bacteroides are common food fiber fermenters. Their dominance in gut bacterial communities provides insight into how the behavior of the driver species influences the overall community structure and composition. The former affects the production of metabolites, among which short-chain fatty acids (SCFAs) are the most important for human health. In vitro fecal fermentation studies of different fibers and metabolite analyses showed that Prevotella- and Bacteroides-dominated fecal communities differentially affected the SCFA fermentation and produced metabolites with different chemical structures. In Prevotella-dominated fecal communities, sorghum and maize fructooligosaccharides and arabinoxylans maintained a single Prevotella phylotype, resulting in high total SCFA production and propionate as the main SCFA product. For comparison, in the Bacteroides-dominated fecal communities, different fibers stimulate multiple phylotypes, resulting in variability in levels and ratios of SCFA [61]. These in vitro experiments demonstrate how the driver species in the fecal microbiome affect enterotype differences and induce distinct responses to dietary fiber [61]. The most important point in developing personalized approaches to maintaining human health is that from the same substrate, the microbiota dominated by different fiber-utilizing bacteria may produce different amounts and profiles of SCFAs.
Another functional role of the dominant forms in microbial communities may be mediated by post-translational modification (PTM). PTM regulates protein activity, influences protein expression, and has a bidirectional nature of microorganism vs host interactions in gut microbiomes [62]. In model experiments with mice and different clonal strains of Escherichia coli, the importance of PTM for bacterial proteins was demonstrated [63]. Bacterial tryptophanase and its S-sulfhydration play a significant role in the regulation uremic toxin production. This process is closely linked to the development and progression of chronic kidney disease in mice [63]. In bacteria, K-acetylation has a significant impact on various cellular functions and influences central bacterial metabolic enzymes, including those involved in fatty acid metabolism and the tricarboxylic acid cycle. It regulates their activity, acting as a stop signal [64] or regulates controlling and managing functions, for example, quorum sensing system in Pseudomonas aeruginosa [65]. Thus, pathogens and commensals have the ability to modify PTM profiles of their host organisms through the secretion protein and by influencing the host’s metabolic processes, which are regulated by diet. In its’ emerging stage, metaPTMmics studies PTM changes in the bacterial and host profiles, their relationship with environmental factors, such as diet and pollution, and their functional influence on the interaction between microrganisms and hosts [62].
Recent studies have suggested that the microbiome-mediated conversion of bilirubin to urobilin and its absorption via the hepatic portal vein contribute to the development of cardiovascular diseases, suggesting the involvement of the liver–gut axis [66, 67]. It has been experimentally shown that bacterial species such as Clostridioides difficile [66], Clostridium perfringens [68], and Clostridium ramosum (current name Thomasclavelia ramosa) [69] can reduce bilirubin to urobilinogen. In our pilot study, reduced bilirubin concentrations were observed in patients with a Ruminococcus enterotype. Considering that the driver taxon of this enterotype is a representative of the same class Clostridia, it is possible to assume that similar metabolic transformations will occur, reflecting the ecological principles governing microbial communities, including diversity and functional redundancy [53].
The traditional approach to enterotype identification is cluster identification based on mathematical calculations using multivariate community diversity data. This methodology includes several important nuances: data clustering, the method of calculating the distance metric, the level of taxonomy hierarchy, and the gradient structure of communities. Koren et al. [2] recommended using at least one absolute evaluation metric prediction strength (PS) or SI when searching for enterotypes and, if possible, confirming these results with a second absolute metric. In addition, PS is recommended for large sample sizes. There is currently no consensus on the specific thresholds that should be used with these methods to assess cluster strength. The interpretation of clustering results based on distance metrics is subjective. In the absence of standardized practices, using at least two or three distance metrics is recommended, as well as clearly indicating the criteria used to designate the enterotypes in the context of any particular study.
Given that this was a cross-sectional analysis, conclusions about the causes and effects could not be drawn. The pilot study was conducted among Caucasian adolescents, which means the findings may not be applicable to all adolescents. Additionally, the pilot study’s limitations include not considering the psychological and social characteristics of the adolescents.
With our sample size (n = 40,
Furthermore, the limitations of this pilot study may be related to the small sample size of patients compared with the dimensionality of the obtained metagenomic data. The direct application of classical clustering methods to small- and high-dimensional datasets may lead to unreliable results. Clustering implies the concept of dissimilarity between data samples. When the dimensionality of the data increases, the concepts of closeness, distance, or nearest neighbor become less qualitatively meaningful, especially for the commonly used Euclidean or Manhattan distances [73]. The small number of samples further worsens this problem because the cloud of data points in high-dimensional space becomes sparse, leading to unreliable probability density estimates [74]. Perhaps the unstable reproduction of enterotypes in different population samples indicates that the distribution of the microbiota spectrum is continuous rather than discrete [75]. Although our analysis requires verification in a larger cohort, it demonstrates that the adolescent population is characterized by the presence of the classical dominants Bacteroides and Prevotella, as well as alternative or intermediate dominants Ruminococcus and Subdoligranulum.
Our study is a pilot study that was performed using a small sample collection from adolescents to determine the possibilities of typing the gut microbiota of adolescents during their transition period. Based on the obtained metagenomic data, we developed an approach for typing the gut microbiota based on the dominant taxa. In our pilot study involving small groups of adolescents with normal body weight and obesity, we identified Bacteroides as the main enterotype regardless of body weight. The possibility of differentiating the enterotypes Prevotella, Ruminococcus, and Subdoligranulum in the gut microbiota of adolescents was also noted.
Apparently, during adolescence, a stable microbial community is formed in the gut, which determines its stratification by enterotype. This determines, on the one hand, the possibility of effective correction of the composition and structure of the gut microbiota and, on the other hand, the need to understand the full potential of such activities.
Several relevant directions for future research on the gut microbiota of adolescents are suggested. Given the multifactor characteristics of the adolescent period in human life, the most interesting will be longitudinal studies in well-characterized cohorts of healthy adolescents and high-defined adolescents with obesity. In this case, the ethnic aspect, place of residence (city/village), and specificity of nutrition (meat eaters/vegetarians) should be considered. In longitudinal studies, it is possible to evaluate both the methodological criteria for enterotyping and the influence of various factors on gut microbiota stratification. Factors such as the effectiveness of antibiotic therapy and other drugs and their effects on the organisms of adolescents stratified by gut microbiota can be complementary and mutually exclusive.
16S rRNA, 16S ribosomal ribonucleic acids; AI, atherogenic index; AGM, artificial gut microbiota; ALT, alanine aminotransferase; AST, aspartate aminotransferase; ASV, amplicon sequence variant; BC, Bray-Curtis; BMI, body mass index; DNA, deoxyribonucleic acid; E-typing, enterotyping; HDL cholesterol, high density lipoprotein cholesterol; JSD, Jensen-Shannon divergence; LCT, lactase gene; LDA, linear discriminant analysis; LDL cholesterol, low density lipoprotein cholesterol; LEfSe, linear discriminant analysis effect size; NCBI, National Center for Biotechnology Information; PCoA, principal coordinates analysis; PS, prediction strength; PTM, post-translational modification; SCFA, short-chain fatty acids; SDS, standard deviation; SI, silhouette index; SNP, single-nucleotide polymorphism; TC, total cholesterol; TG, triglycerides.
The amplicon metasequencing data were deposited at NCBI SRA as BioProject PRJNA604466. The datasets used and analyzed during the current study are available from the corresponding author on reasonable request.
NB, EK performed the research and analyzed the data. NS, AP, LR, OB, provided advice on patients recruiting. AP, LK, MD designed the research study. NB, EK wrote the manuscript. All authors contributed to editorial changes in the manuscript. All authors read and approved the final manuscript. All authors have participated sufficiently in the work and agreed to be accountable for all aspects of the work.
The study was carried out in accordance with the guidelines of the Declaration of Helsinki. This study was approved by the Biomedical Ethics Committee of the Federal State Public Scientific Institution “Scientific Centre for Family Health and Human Reproduction Problems” (Protocol No. 6 of December 21, 2015) and was conducted with the informed consent of adolescents over 15 years of age or parents/legal representatives of children under 15 years of age.
This work was performed using the equipment of the Core Facility “Centre for the Development of Progressive Personalized Health Technologies” and the “Human Microbiota Collection of the Irkutsk Region” of the Federal State Public Scientific Institution “Scientific Center for Family Health and Human Reproduction Problems”, Irkutsk.
The study was conducted within the framework of research work No. 123051600014-1.
The authors declare no conflict of interest.
Publisher’s Note: IMR Press stays neutral with regard to jurisdictional claims in published maps and institutional affiliations.