
- Academic Editor
Depression during pregnancy can have serious negative effects on the health of both the woman and the fetus. Therefore, studying the risk factors associated with depression in pregnancy is important for timely interventions and prevention. This study aimed to comprehensively identify the risk factors of depression during pregnancy and construct and verify the effectiveness of a prediction model to provide a basis for early prevention and intervention of depression during pregnancy.
A total of 630 pregnant women who underwent regular prenatal checkups at Jinshan Central Hospital Affiliated to Shanghai University of Medicine & Health Sciences from January 2020 to October 2023 were included. The Edinburgh Postnatal Depression Scale (EPDS) and Generalized Anxiety Disorder (GAD-7) were utilized to assess the presence of depressive disorders in mid-pregnancy. A risk prediction nomogram model was constructed using the R program, and validation was performed using the Bootstrap method. The calibration curve chart was produced, and diagnostic efficacy was evaluated using the receiver operating characteristic (ROC) curve.
The prevalence of mid-pregnancy depression was found to be 19.37%. Moreover, no statistically significant differences were observed between the two groups in terms of age, gravidity, parity, pre-pregnancy body mass index (BMI), cultural level, smoking or drinking alcohol, and work cessation due to pregnancy (p > 0.05). However, statistically significant differences were noted in the incidence of spousal disharmony, discordant relations with parents, changes in sleep and diet, work-study stress, adverse maternal history, dissatisfactory living environments, assisted reproduction, unplanned pregnancy, adverse life events, lack of maternity knowledge, family income, and pregnancy comorbidities (p < 0.05). A nomogram model was developed based on the multifactor analysis, showing a mean absolute error of 0.011 in the calibration curve, indicating good predictive accuracy. The ROC analysis demonstrated an area under the curve (AUC) of 0.806 for the joint prediction model, with a sensitivity of 66.4% and a specificity of 83.5%, suggesting a strong clinical diagnostic value. The study sample was drawn from pregnant women in our hospital, which may have led to a limited representative sample. The timeframe of the study may also have led to the exclusion of specific periods of pregnant women.
A nomogram model, which incorporates indicators such as spousal and parental disharmony, changes in sleep and dietary habits, work-study stress, adverse maternal history, unsatisfactory living environment, assisted reproduction, unplanned pregnancy, interference from adverse life events, and lack of maternity knowledge, can effectively predict depression during pregnancy.
Pregnancy and childbirth constitute crucial phases in the life cycle of a woman, yet these phases also present numerous physical and psychological challenges [1]. The occurrence of depression during pregnancy has been reported to be as high as 20.70% in 2020 [2], a rate significantly above that of the general population. According to the 2018 American College of Obstetricians and Gynecologists (ACOG) consensus, depressive episodes experienced by pregnant women, ranging from mild to severe, can be diagnosed as perinatal depression [3]. This condition not only poses risks for adverse pregnancy outcomes, such as fetal growth restriction, preterm labor, and increased cesarean section rates, but also elevates the likelihood of postpartum depression [4]. Furthermore, perinatal depression can impact the day-to-day functioning and overall quality of life for pregnant women and new mothers [5]. Research by Lebel et al. [6] has shown that maternal depression during mid-pregnancy can have lasting effects on neonatal brain structure and long-term emotional, behavioral, cognitive, physiological, and neurological development. Meanwhile, psychological factors play a significant role in labor and delivery, with approximately 10% of cesarean sections being attributed to elevated levels of maternal anxiety [7]. Notably, compared to postpartum mental health, mental health during pregnancy has not been adequately addressed in clinical practice. Moreover, depression screening is not routinely included in obstetric examinations, even though depression during pregnancy can lead to adverse birth outcomes such as smaller gestational age babies and reduced head circumference [8, 9, 10]. The reported detection rate of depression during pregnancy is 20.00% [11]. Research indicates that depression and anxiety during pregnancy cannot only affect the health of the pregnant woman and fetus but also impact family dynamics and impose a significant economic burden on both the family and society [12]. Mellor et al. [13] highlighted that risk factors such as fear of childbirth, self-perceived stress, and exposure to stressful or negative events during pregnancy can contribute to the development of depressive symptoms in pregnant women. Thus, as the medical field transitions from the traditional biomedical model to the biopsychosocial medical model, there is a growing emphasis on recognizing and addressing the somatization of psychosocial stress symptoms in patients with mental illnesses stemming from psychosocial disorders.
Therefore, perinatal depression can result in a series of physical and psychological disorders in both mothers and children, imposing a certain burden on families and society. Australia recommends the application of the Prenatal Risk Factor Questionnaire (PRFQ) and the Postnatal Risk Questionnaire (PRQ) for maternal screening [14]. In the United States, it is recommended to ask about psychiatric history, medication use, and the presence of anxiety and depression at 6, 8, and 28 weeks of pregnancy and postpartum, and to use the Edinburgh Postnatal Depression Scale (EPDS) for screening [15]. Given the high prevalence of prenatal depression among perinatal women, coupled with the severity of adverse outcomes and low rates of mental health visits, the implementation of a rapid and convenient screening method could significantly enhance the mental well-being of perinatal women [16]. However, the current tools have limitations: The PRFQ and PRQ focus on risk factor questioning and lack consideration of complex multifactorial interactions; the EPDS is primarily used for postnatal depression screening and is not sufficiently targeted in the prediction of depression during pregnancy. Various risk factors contribute to depression during pregnancy, yet there remains a scarcity of studies examining the present state of depression and its risk factors in pregnant women [17, 18, 19]. Thus, this study aimed to explore the risk factors associated with the occurrence of depression in pregnant women, starting with the construction of a maternal handbook in mid-pregnancy. A column-line diagram model was constructed to quickly assess the risk of depression in pregnancy based on multidimensional information of pregnant women, which improved the diagnostic efficiency and made the operation more convenient. This study aimed to identify and explore risk factors associated with depression in pregnant women, focusing on the development of a maternity booklet during mid-pregnancy to enhance the detection and screening of prenatal depression.
A total of 630 pregnant women who had regular antenatal checkups in the Jinshan Central Hospital Affiliated to Shanghai University of Medicine & Health Sciences between January 2020 and October 2023 were selected for the prospective study. Inclusion criteria: (1) women with a first-time pregnancy booklet, weeks of pregnancy from 12 to 16; (2) pregnant women with normal intelligence; (3) those with voluntary participation and normal communication skills who were able to complete the questionnaire independently. Exclusion criteria: (1) any mental abnormalities before pregnancy; (2) receiving psychotherapy or participating in any psychological intervention. The patients were categorized into 122 cases in the occurrence group and 508 cases in the non-occurrence group according to whether or not depression occurred during pregnancy. This study was approved by the Ethics Committee of Jinshan Central Hospital Affiliated to Shanghai University of Medicine & Health Sciences (approval number: jszxyy202129), and the patients were informed and signed a consent form.
The sample size estimation in this study was based on two considerations: (1)
this study was a prospective cohort design, and the sample size was derived from
the data of 630 pregnant women collected in the clinic (122 cases in the
depression group and 508 cases in the non-depression group), which meets the
minimum criteria for the number of events/variable ratio
A self-administered questionnaire was used to investigate general demographic and clinical information. These included: age, gravidity, parity, pre-pregnancy body mass index (BMI), those who smoked or drank alcohol, literacy level, monthly family income, pregnancy comorbidities, sleep and dietary status, living conditions, husband and wife and parental relationships, marital satisfaction, work-study stress, adverse life events, adverse maternal history, unplanned pregnancy, assisted reproduction, lack of maternal knowledge, and work cessation due to pregnancy.
The EPDS [21] and the Generalized Anxiety Disorder (GAD-7) [22] were utilized to
evaluate the occurrence of depression among pregnant women. Created by Cox
et al. [23] in 1987 for postpartum depression screening, the EPDS
demonstrates strong reliability and validity, making this scale suitable for
depression screening during pregnancy. The EPDS consists of 10 entries, and the
description of each entry is divided into four levels. The severity of each
symptom is assigned a score of 0–3 according to the severity of each entry, from
no symptoms to very severe symptoms, and lower total scores indicate fewer
depression symptoms: A total EPDS score of
Pregnant women who showed abnormal results on both the EPDS and GAD-7 scales were classified as experiencing depression during pregnancy.
Uniformly trained investigators distributed all questionnaires to eligible pregnant women who had signed the informed consent form, and pregnant women were instructed to complete them alone and within the specified timeframe. The questionnaires were retrieved immediately after being verified and perfected by the investigators to ensure quality and authenticity.
This study used SPSS 27.0 software developed by IBM (Armonk, NY, USA) for the
database creation and analysis. Normality was tested for the measured variables
using the Shapiro-Wilk test. Measured variables that followed a normal
distribution are presented as the mean and standard deviation, with group
comparisons conducted using an independent samples t-test. The median
(lower and upper quartiles) was used for continuous variables that did not meet
normal distribution, and independent samples rank sum test comparisons were
performed. Categorical variables are expressed as the number of cases
(percentage) (n (%)), and comparisons between groups were conducted using the
Chi-square test or Fisher’s exact probability method. Statistical analysis was
performed to determine correlation indices with the occurrence of depression
during pregnancy in patients. In terms of selecting appropriate risk factors to
construct the model, this study first screened the potential factors associated
with the occurrence of depression during pregnancy through one-way analysis of
variance (ANOVA) (p
A total of 712 questionnaires were distributed to pregnant women, of which 652
were returned, resulting in 630 valid responses, indicating a valid response rate
of 88.48% (Fig. 1). Among the respondents, 122 pregnant women, constituting
19.37% of the sample, were positively screened for depression with an EPDS score
of
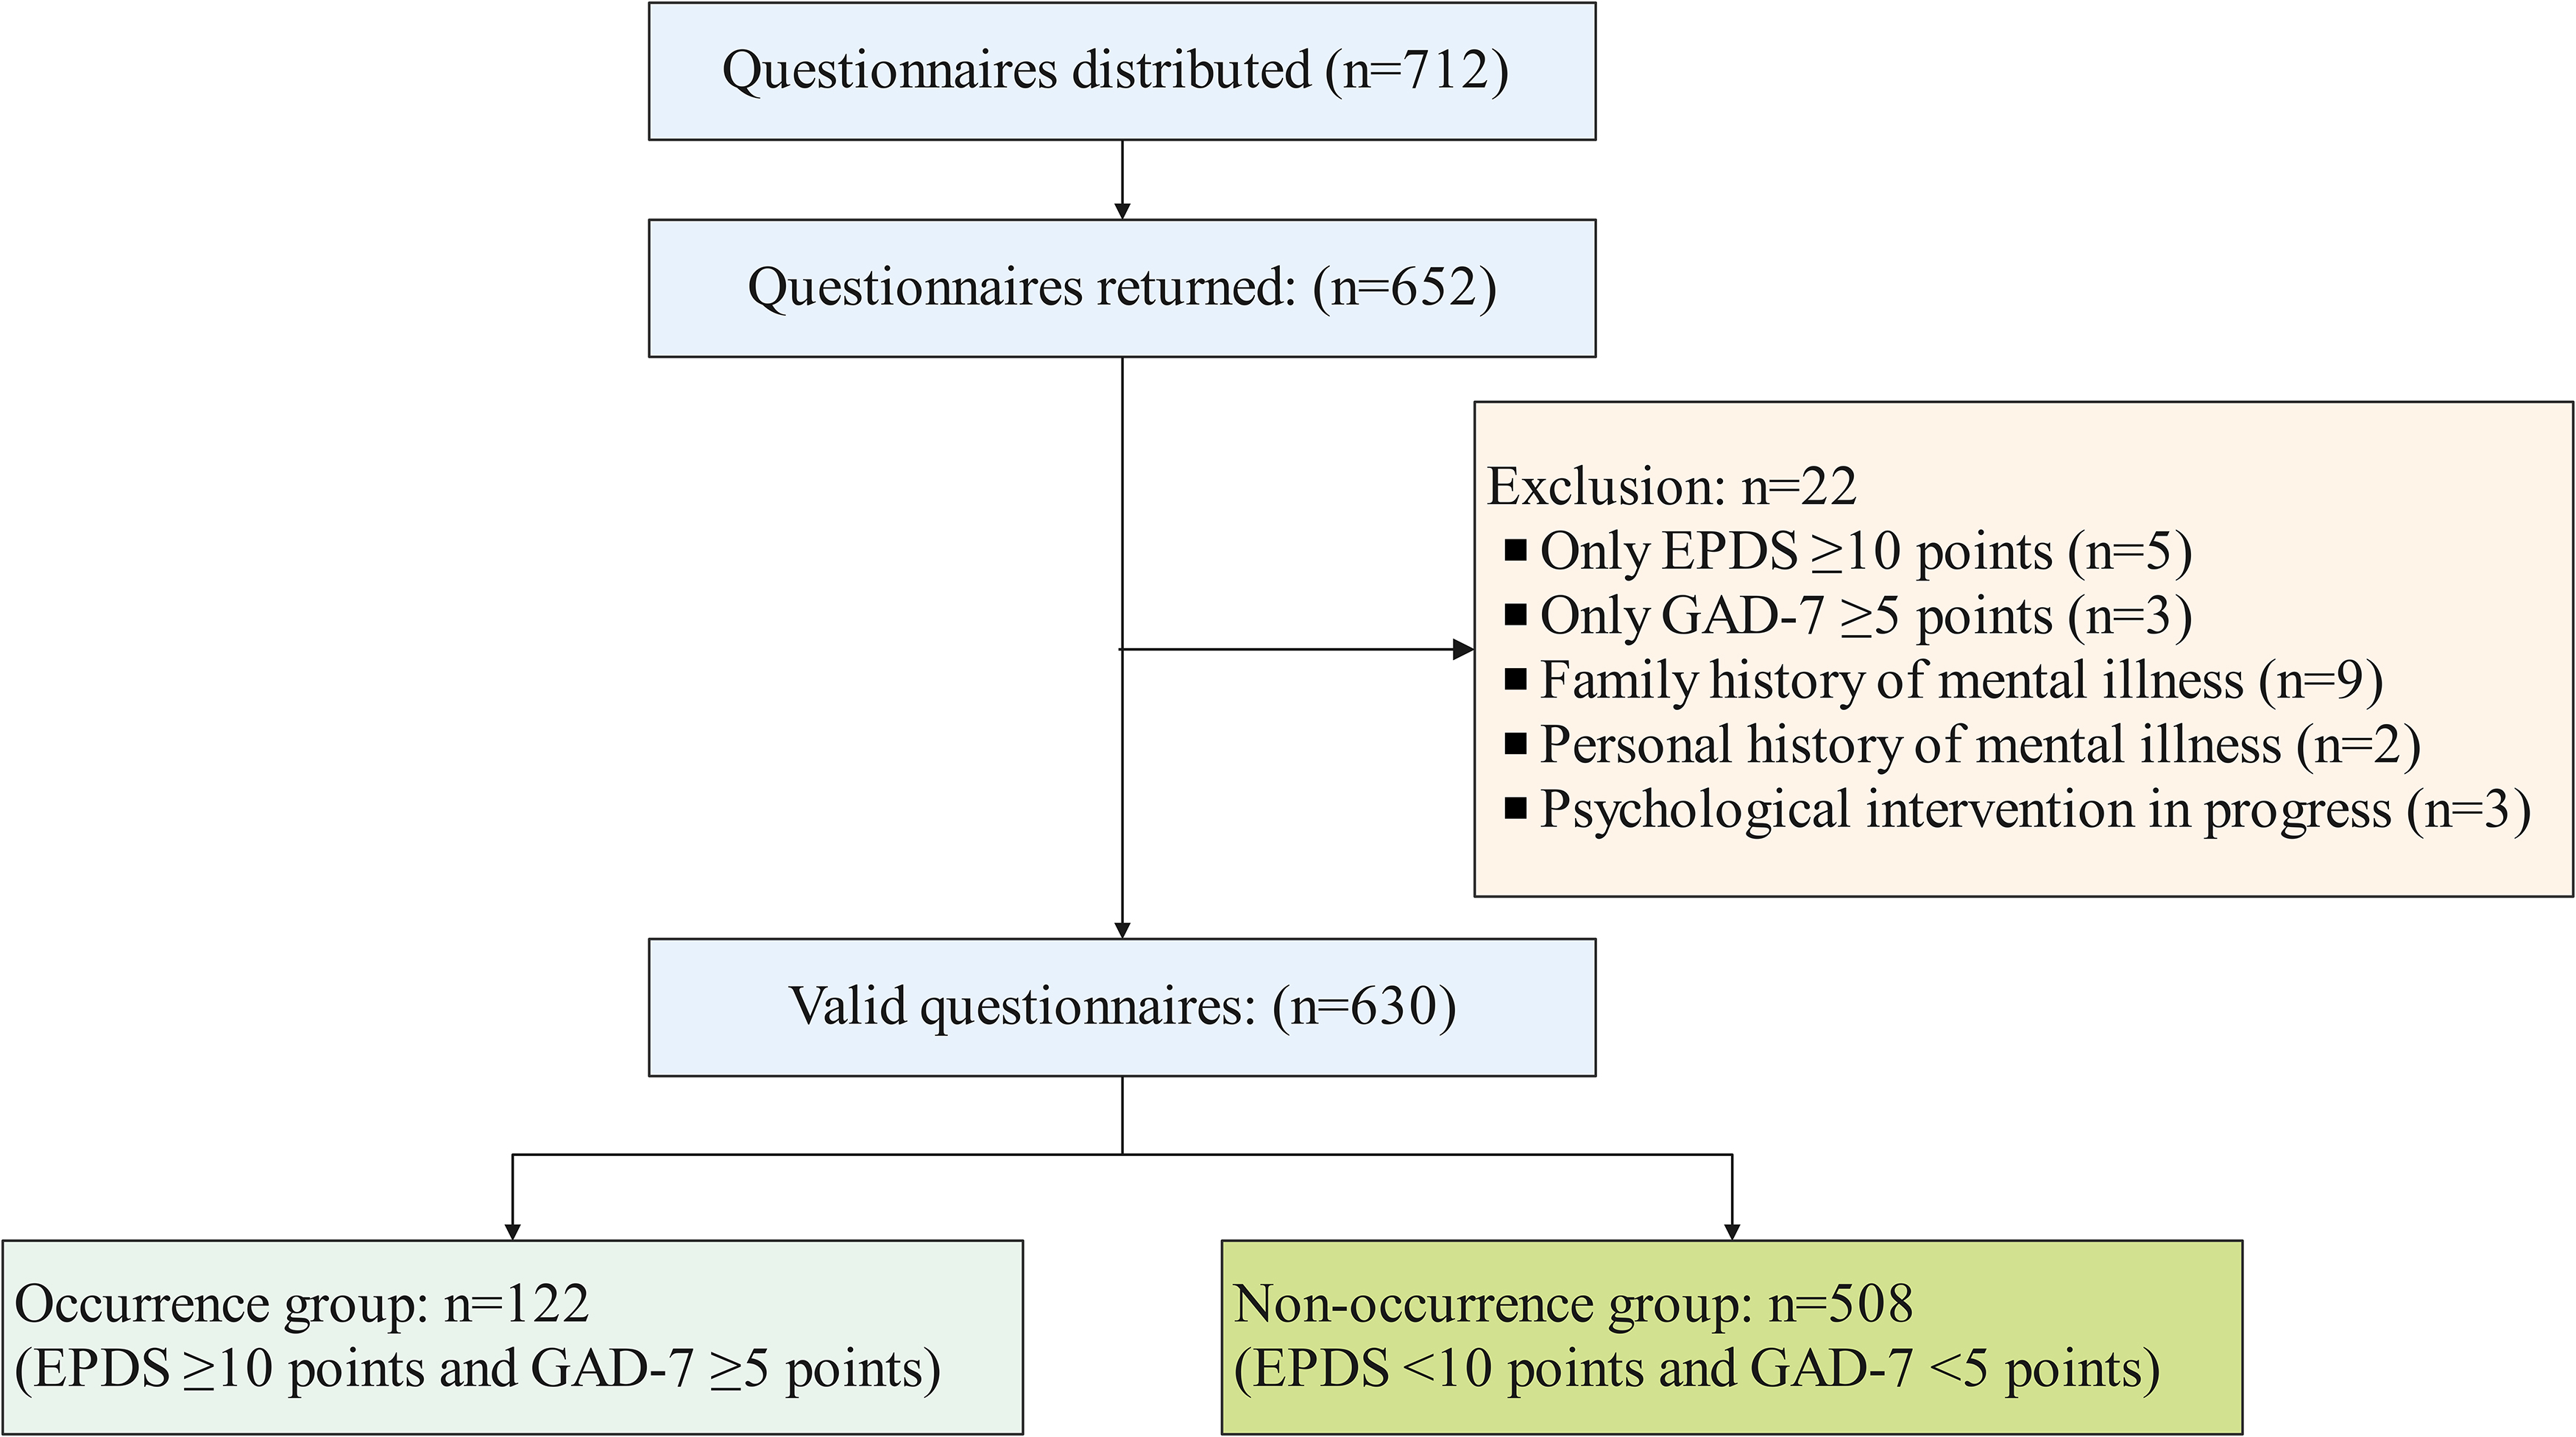 Fig. 1.
Flowchart of the participation criteria in this study. EPDS, Edinburgh Postnatal Depression Scale; GAD-7, Generalized Anxiety Disorder.
The median age of patients in the occurrence group was 30 years old, with a mean
pre-pregnancy BMI of 23.05
| Risk factors and conditions | Non-occurrence group (n = 508) | Occurrence group (n = 122) | Z/t/ |
p-value | |
| Age (years) | 30.0 (27.0, 32.0) | 30.0 (28.0, 33.0) | –1.836 | 0.066 | |
| Pre-pregnancy BMI (kg/m2) | 22.68 |
23.05 |
1.900 | 0.058 | |
| Education level | Junior high school and below | 225 (44.3) | 45 (36.9) | 2.203 | 0.138 |
| High school and above | 283 (55.7) | 77 (63.1) | |||
| Family income (USD) | 71 (14.0) | 35 (28.7) | 20.657 | ||
| 1400–2800 | 249 (49.0) | 62 (50.8) | |||
| 188 (37.0) | 25 (20.5) | ||||
| Smoked or consumed alcohol | No | 496 (97.6) | 120 (98.4) | 0.021 | 0.885 |
| Yes | 12 (2.4) | 2 (1.6) | |||
| Pregnancy comorbidities | No | 485 (95.5) | 110 (90.2) | 5.284 | 0.022 |
| Yes | 23 (4.5) | 12 (9.8) | |||
| Gravidity | 2.0 (2.0, 3.0) | 2.0 (2.0, 3.0) | –1.599 | 0.110 | |
| Parity | 2.0 (2.0, 2.0) | 2.0 (2.0, 2.0) | –1.026 | 0.305 | |
| Spousal disharmony | No | 475 (93.5) | 85 (69.7) | 56.571 | |
| Yes | 33 (6.5) | 37 (30.3) | |||
| Discordant relation with both parents | No | 483 (95.1) | 105 (86.1) | 12.844 | |
| Yes | 25 (4.9) | 17 (13.9) | |||
| Change in sleep and diet | No | 446 (87.8) | 93 (76.2) | 10.648 | 0.001 |
| Yes | 62 (12.2) | 29 (23.8) | |||
| Work-study stress | No | 479 (94.3) | 107 (87.7) | 6.569 | 0.010 |
| Yes | 29 (5.7) | 15 (12.3) | |||
| Work cessation due to pregnancy | No | 432 (85.0) | 100 (82.0) | 0.707 | 0.400 |
| Yes | 76 (15.0) | 22 (18.0) | |||
| Adverse maternal history | No | 503 (99.0) | 116 (95.1) | 6.729 | 0.009 |
| Yes | 5 (1.0) | 6 (4.9) | |||
| Living environment | Satisfactory | 495 (97.4) | 111 (91.0) | 9.501 | 0.002 |
| Unsatisfactory | 13 (2.6) | 11 (9.0) | |||
| Assisted reproduction | No | 505 (99.4) | 116 (95.1) | 10.190 | 0.001 |
| Yes | 3 (0.6) | 6 (4.9) | |||
| Unplanned pregnancy | No | 429 (84.4) | 87 (71.3) | 11.456 | 0.001 |
| Yes | 79 (15.6) | 35 (28.7) | |||
| Adverse life events | No | 505 (99.4) | 115 (94.3) | 13.552 | |
| Yes | 3 (0.6) | 7 (5.7) | |||
| Lack of maternity knowledge | No | 454 (89.4) | 96 (78.7) | 10.125 | 0.001 |
| Yes | 54 (10.6) | 26 (21.3) | |||
Note: smoked or consumed alcohol and other categorical variables, except
pre-pregnancy BMI, are reported in the table as number (%); pre-pregnancy BMI is
presented as median (lower quartile, upper quartile) or mean
A 10-fold cross-validated LASSO regression model was employed for screening
independent variables and conducting regression analysis. Significant independent
variables from the univariate analysis were incorporated into the regression
equation. These findings indicated that various risk factors such as pregnancy
comorbidities, discordant spousal and parental relationships, change in sleep and
diet, work-study stress, adverse maternal history, family income, satisfaction
with living environment, assisted reproduction, unplanned pregnancy, interference
from adverse life events, and lack of maternal knowledge influenced the
likelihood of experiencing depression during pregnancy. Specifically, planned
pregnancy, interference from adverse life events, and lack of maternal knowledge
were identified as key factors contributing to depression during pregnancy. The
regression coefficients for each factor can be found in Table 2. Meanwhile, Figs. 2,3 display the deviation and partial regression coefficients plots generated by
LASSO regression. Among them, Fig. 2 shows the deviation of the LASSO regression
for different values of
| Risk factors | 10-fold LASSO regression coefficient |
| Intercept | –1.006 |
| Pregnancy comorbidities | 0.013 |
| Discordant spousal relationship | 1.448 |
| Inharmonious parental relationship | 0.742 |
| Alterations in sleep and dietary habits | 0.456 |
| Work-study stress | 0.319 |
| Adverse maternal history | 0.849 |
| Family income | –0.498 |
| Living environment | 0.742 |
| Assisted reproduction | 0.940 |
| Unplanned pregnancy | 0.254 |
| Interference of adverse life events | 1.251 |
| Lack of maternal knowledge | 0.559 |
LASSO, Least Absolute Shrinkage and Selection Operator.
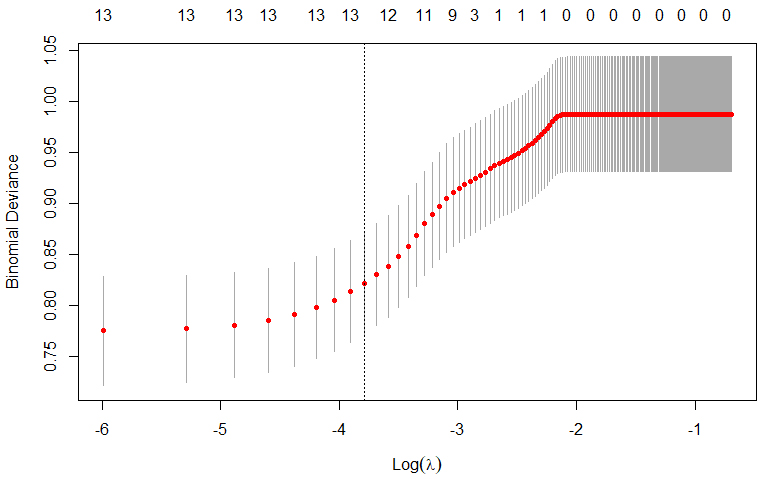 Fig. 2.
Deviation in Least Absolute Shrinkage and Selection Operator (LASSO) regression with different
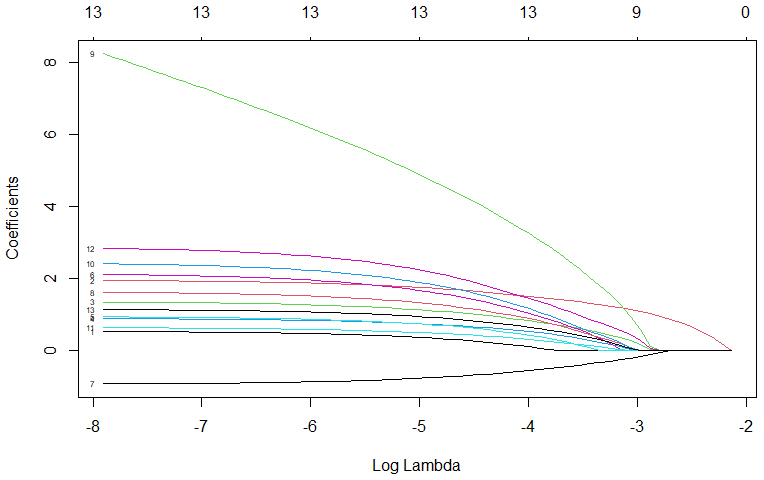 Fig. 3.
Plot of
The independent variables were screened using LASSO regression and included in
the logistic regression analysis. The regression model was established using the
entry method. The Hosmer-Lemeshow test for the model (
| Risk factors | SE | df | p-value | OR | 95% CI | ||||
| Lower | Upper | ||||||||
| Pregnancy comorbidities | 0.508 | 0.452 | 1.259 | 1 | 0.262 | 1.661 | 0.685 | 4.032 | |
| Discordant spousal relationship | 1.885 | 0.308 | 37.568 | 1 | 6.589 | 3.606 | 12.041 | ||
| Inharmonious parental relationship | 1.291 | 0.403 | 10.259 | 1 | 0.001 | 3.635 | 1.650 | 8.008 | |
| Alterations in sleep and dietary habits | 0.838 | 0.290 | 8.378 | 1 | 0.004 | 2.312 | 1.311 | 4.078 | |
| Work-study stress | 0.895 | 0.397 | 5.083 | 1 | 0.024 | 2.447 | 1.124 | 5.327 | |
| Adverse maternal history | 2.061 | 0.751 | 7.525 | 1 | 0.006 | 7.855 | 1.801 | 34.252 | |
| Family income | 25.530 | 2 | |||||||
| 1400–2800 USD | –0.888 | 0.285 | 9.687 | 1 | 0.002 | 0.412 | 0.235 | 0.720 | |
| –1.774 | 0.352 | 25.345 | 1 | 0.170 | 0.085 | 0.338 | |||
| Living environment | 1.563 | 0.507 | 9.482 | 1 | 0.002 | 4.771 | 1.765 | 12.899 | |
| Assisted reproduction | 2.359 | 0.905 | 6.791 | 1 | 0.009 | 10.576 | 1.794 | 62.337 | |
| Unplanned pregnancy | 0.658 | 0.281 | 5.473 | 1 | 0.019 | 1.931 | 1.113 | 3.350 | |
| Interference of adverse life events | 2.748 | 0.909 | 9.129 | 1 | 0.003 | 15.608 | 2.626 | 92.780 | |
| Lack of maternal knowledge | 1.079 | 0.302 | 12.746 | 1 | 2.943 | 1.627 | 5.322 | ||
| Constant | –1.698 | 0.260 | 42.692 | 1 | 0.183 | 0.110 | 0.304 | ||
Note: df, degrees of freedom; OR, odds ratio.
Binary logistic regression was employed to identify independent factors influencing the construction of a risk prediction model depicted in a nomogram graph. Each position of the predictor on the scoring scale determined a score, which was then aggregated to calculate the total score. Mapping the total score on the probability axis allowed the predicted likelihood of pregnancy depression occurrence in patients to be ascertained, as illustrated in Fig. 4.
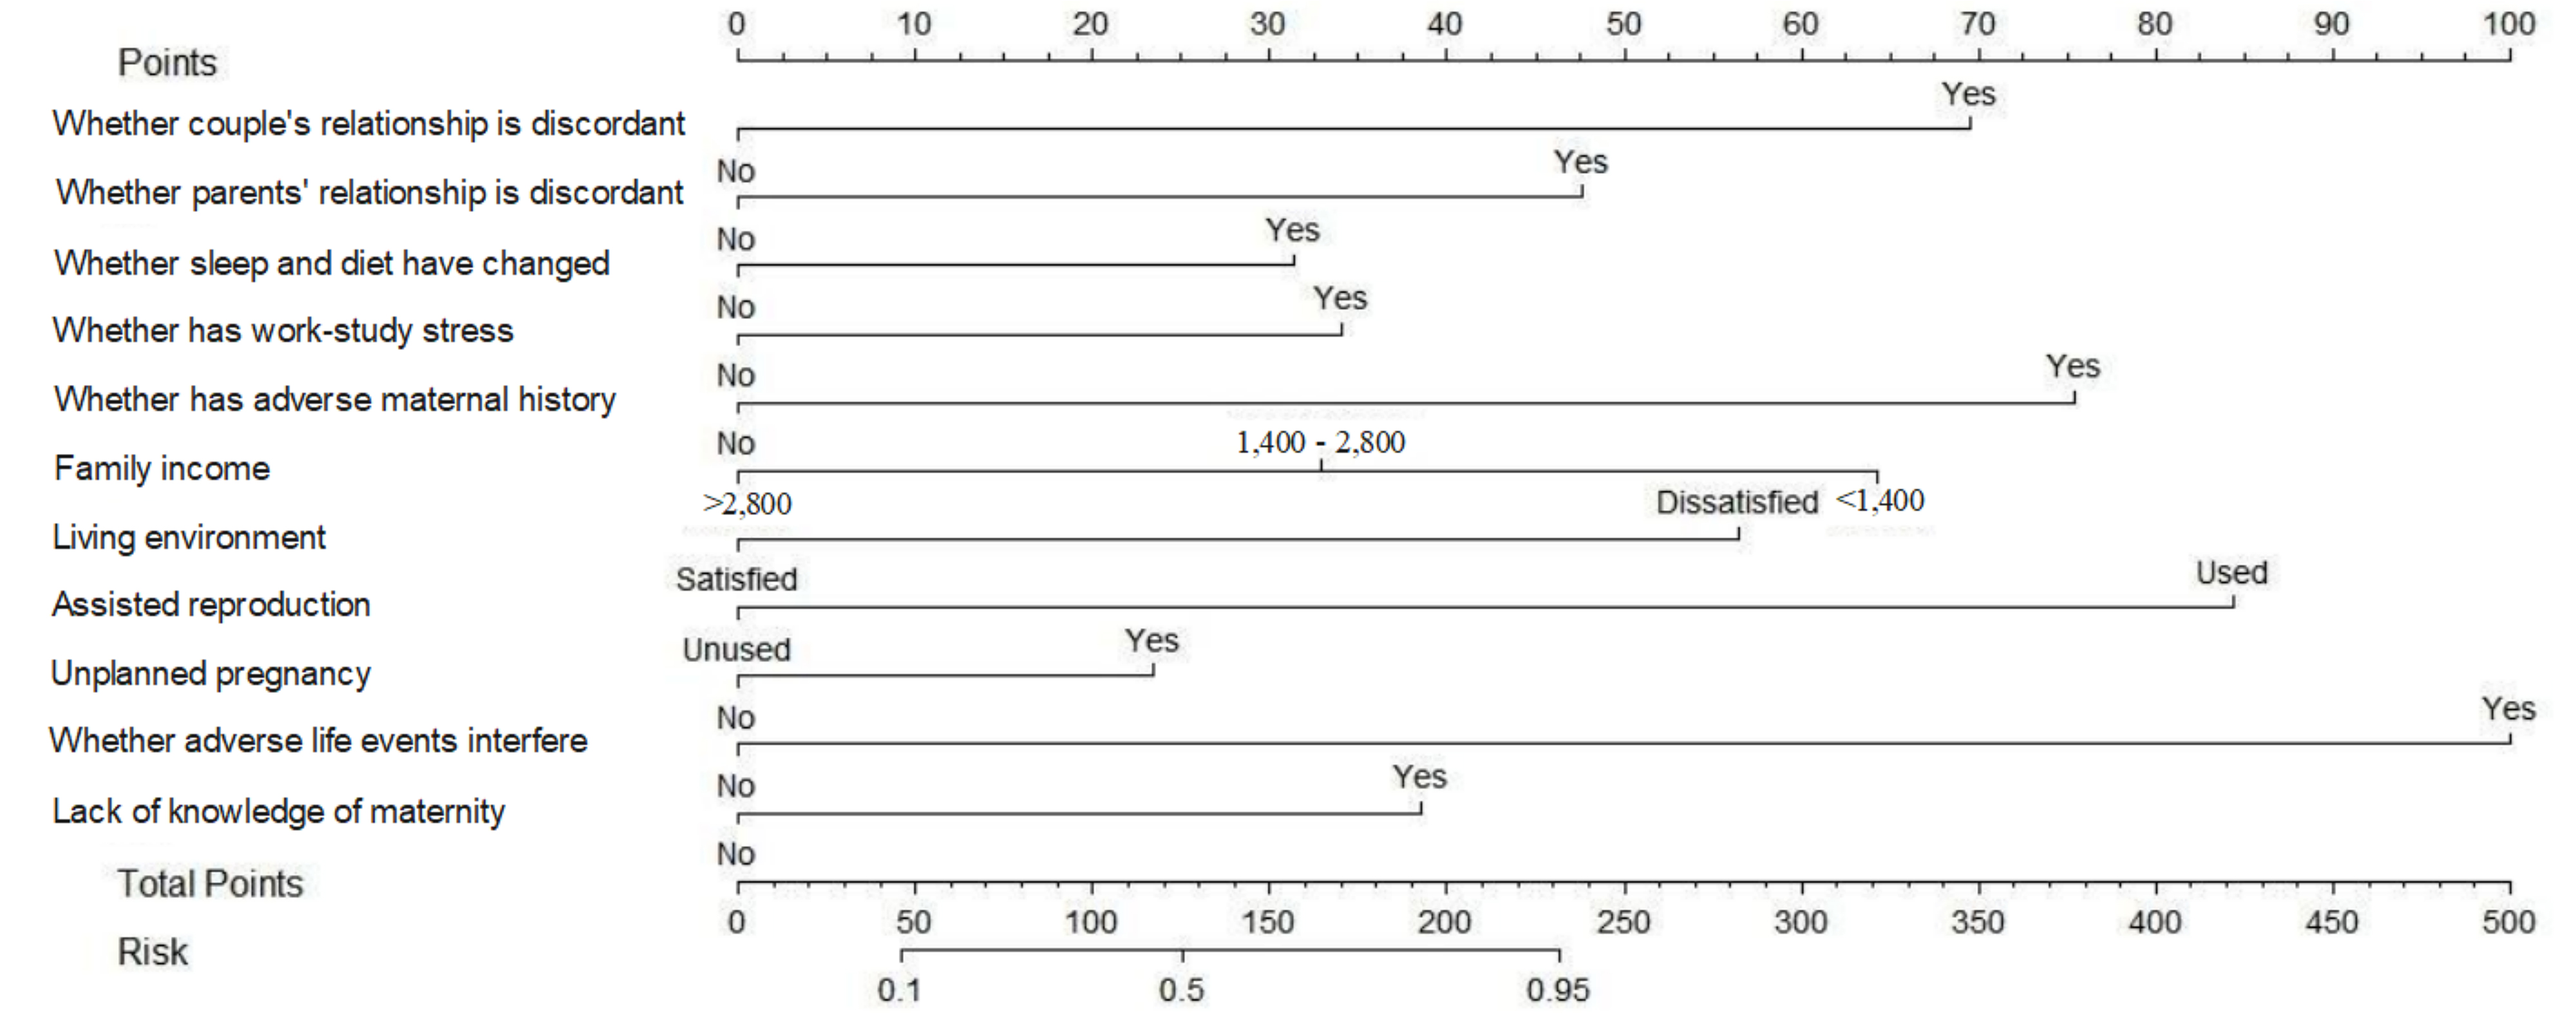 Fig. 4.
Scores on the nomogram graph for each independent influential factor.
Validation of the nomogram model using the bootstrap method with 1000 samples presented a mean absolute error of 0.011 for the calibration curve, which shows that the predicted probability of the model is consistent with the actual value, reflecting the high quality of the calibration curve. In addition, the C index of the present model was 0.806, and the calibration C index was 0.791; these values show that the model has a good differentiation between whether or not a patient develops depression, as illustrated in Fig. 5.
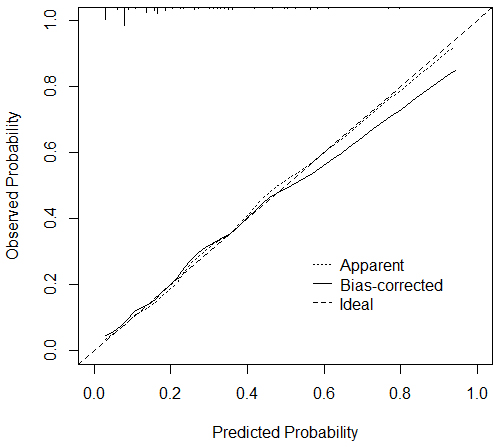 Fig. 5.
Calibration curve of the bootstrap method of the prediction model.
The ROC curve was utilized to establish the critical threshold of the prediction model for anticipating the onset of depression in pregnant patients. These findings indicated that the combined prediction model had an AUC of 0.806, with a sensitivity of 66.4% and a specificity of 83.5%. An AUC over 0.75 demonstrates promising clinical diagnostic utility, as presented in Table 4 and Fig. 6.
| AUC | SE | p-value | 95% CI | Threshold value | Sensitivities | Specificities | Youden index | ||
| Lower | Upper | ||||||||
| Joint prediction probability | 0.806 | 0.023 | 0.760 | 0.852 | 0.261 | 0.664 | 0.835 | 0.499 | |
Note: ROC, receiver operating characteristic; AUC, area under the curve.
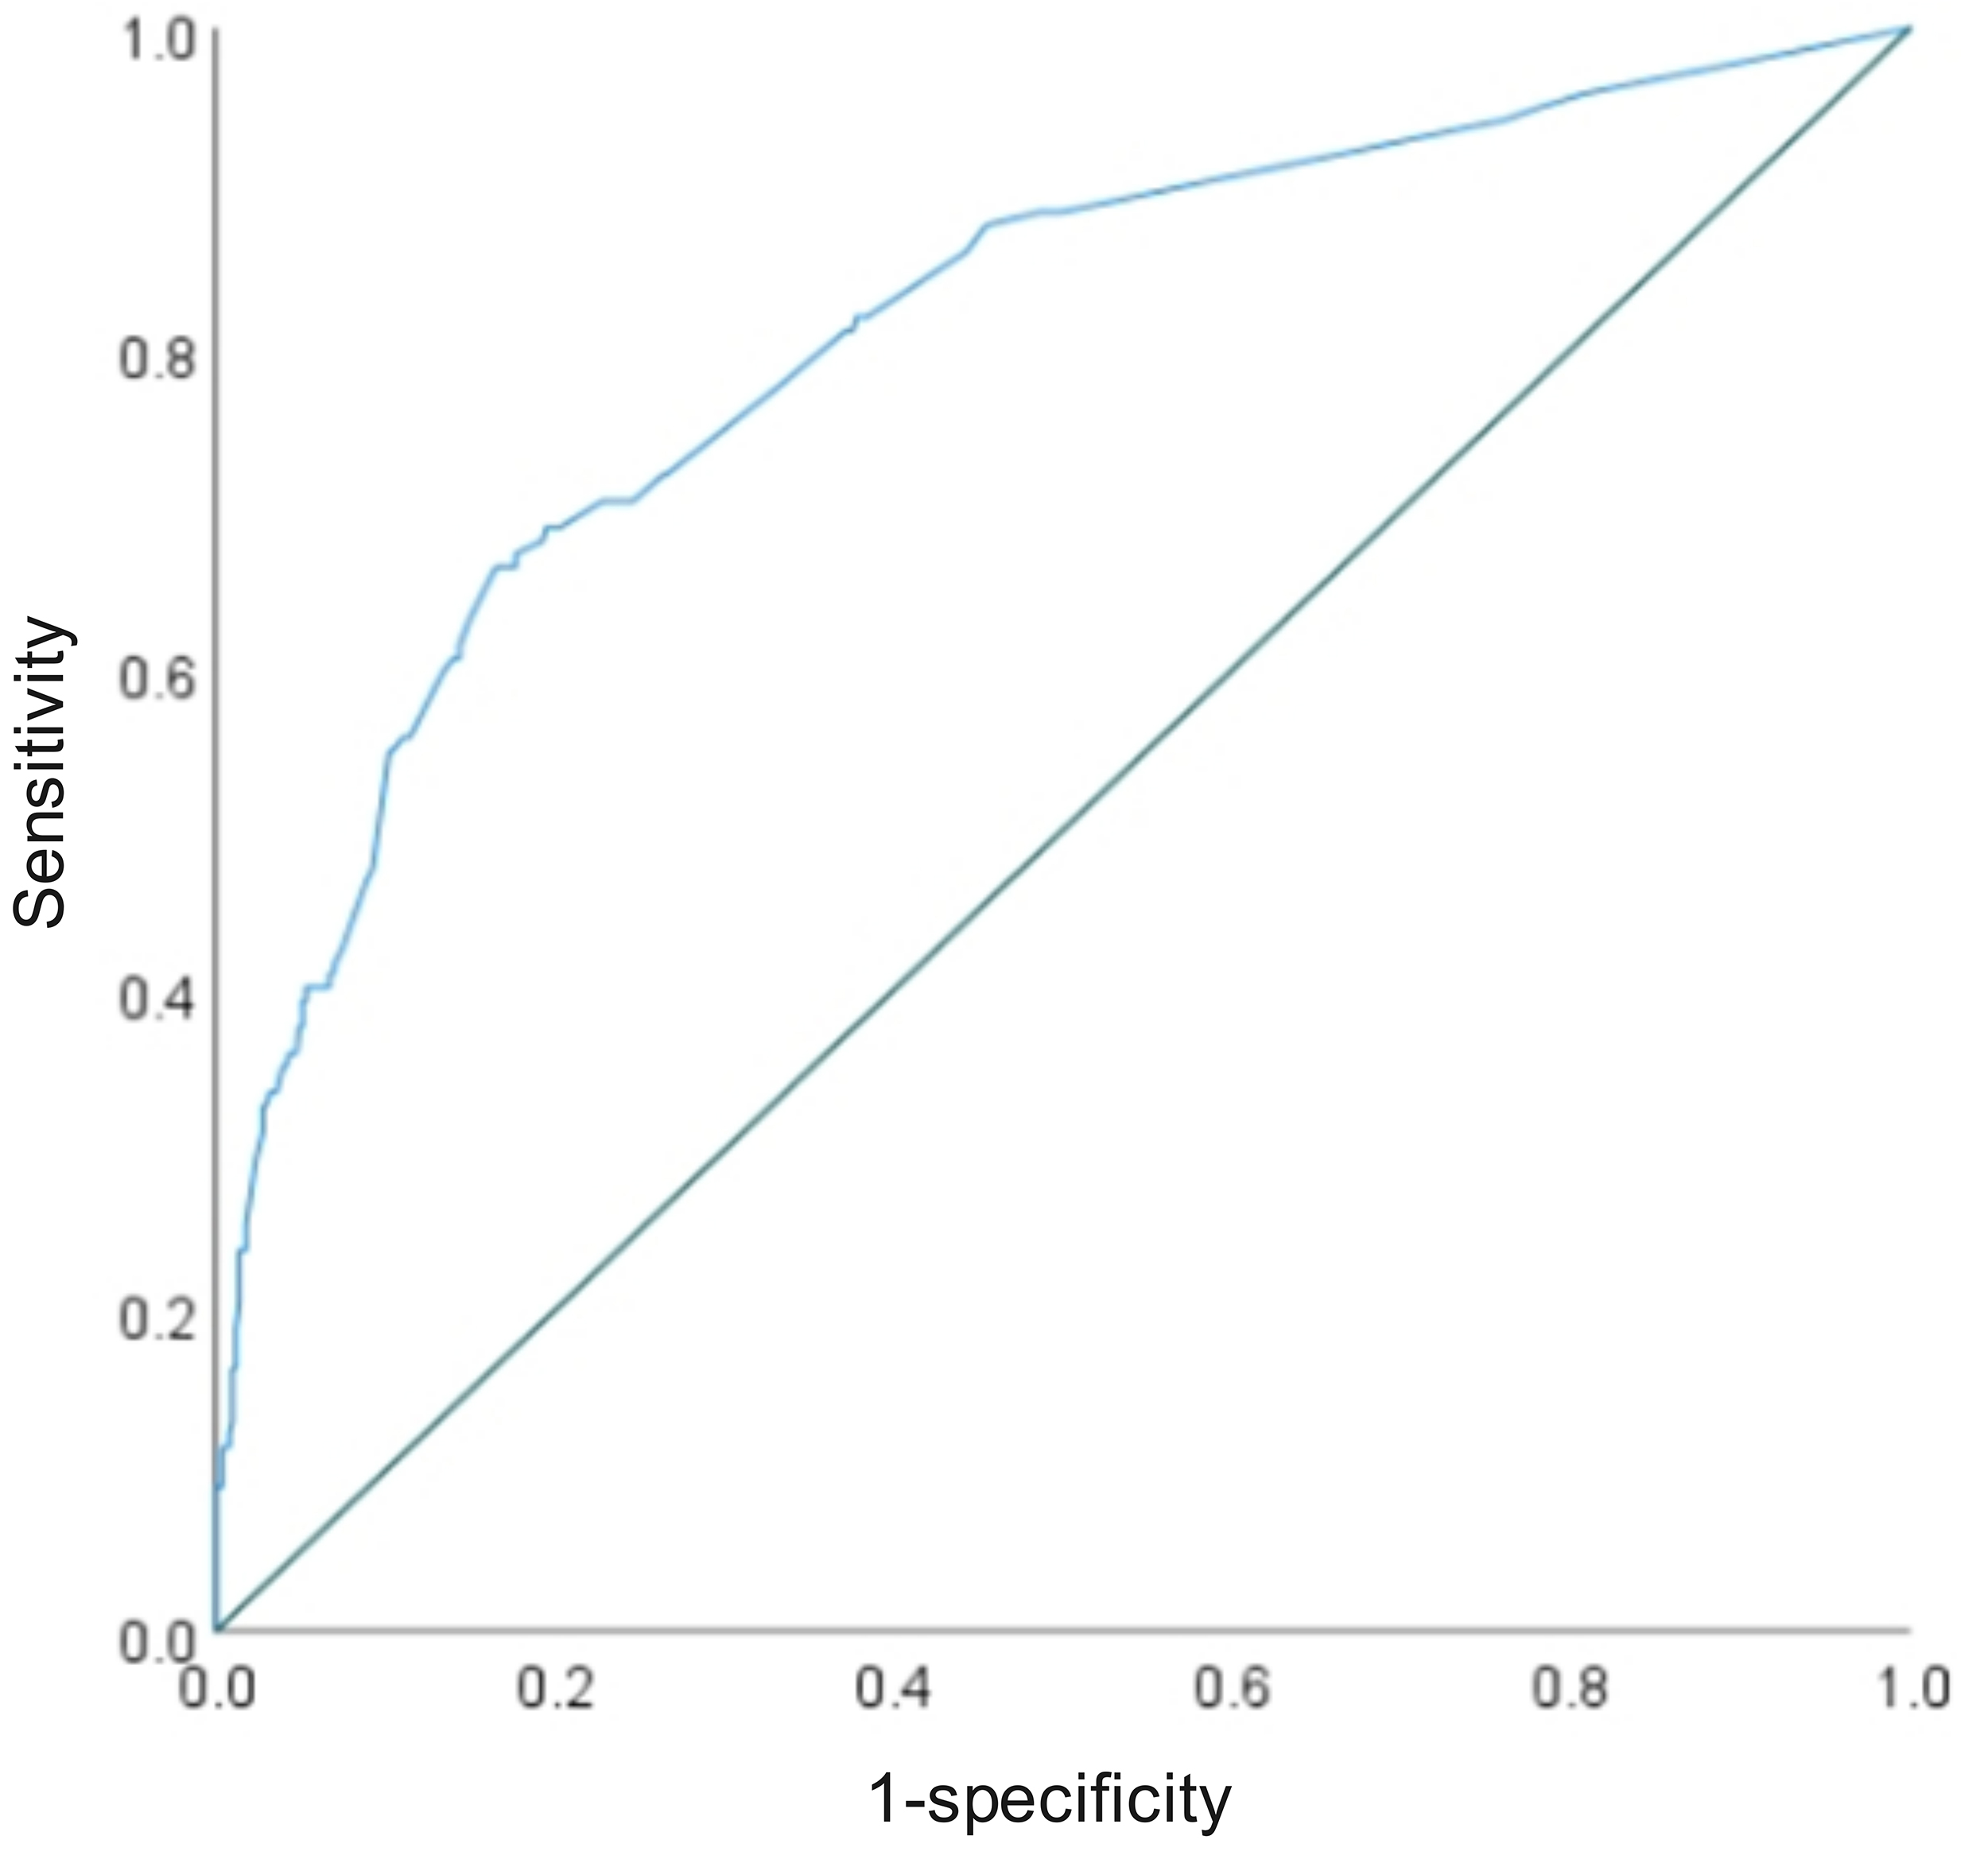 Fig. 6.
ROC curve of the predictive model.
Perinatal depression, also referred to as maternal depression, encompasses depressive symptoms that emerge during pregnancy, following childbirth, or after an abortion. Perinatal depression includes prenatal depression (PD) and postpartum depression (PPD), and is a prevalent complication during pregnancy and the postpartum period [24]. The various stressors experienced during pregnancy can have adverse effects on the mental health of women, potentially increasing the risk of depression due to hormonal changes and physical transformations [25]. Prior research has indicated that perinatal depression not only impacts the health and well-being of women but also extends to the entire family, influencing the emotional and psychological state of the mother, her ability to care for the baby, and the bonding process [26]. Moreover, perinatal depression can promote a significant decline in the mother’s quality of life, an economic strain on the family, and may even result in family discord, self-harm, suicide, and other negative outcomes [27]. A study has shown a clear link between postpartum depression and depression during pregnancy, with approximately one-third of postpartum depression patients experiencing depression during or before pregnancy [28]. Postpartum depression is characterized by persistent low mood, diminished self-esteem, lack of confidence in daily life, and heightened levels of anxiety or hypervigilance [29].
The current study found that 19.37% of pregnant women experienced mid-pregnancy
depression. Meanwhile, general demographic and clinical data analysis revealed no
statistically significant differences between the two groups of patients in terms
of age, gravidity, parity, pre-pregnancy BMI, education level, smoking or alcohol
consumption, and work cessation due to pregnancy (p
Adverse pregnancy outcomes and insomnia can result in negative maternal emotions such as self-blame, guilt, and distress, and are significant risk factors for postpartum depression, as noted by Chung et al. [37]. Pregnant women who have experienced adverse pregnancy events, including miscarriage, preterm delivery, stillbirth, and other challenging experiences, are more prone to psychological issues during the next pregnancy. Gong et al. [38] found that pregnant women who had a history of miscarriage and short intervals between pregnancies were at a higher risk of experiencing depression and anxiety in early pregnancy compared to those without such a history. Additionally, Meijer et al. [39] discovered that life events during pregnancy were linked to prenatal depression and anxiety symptoms, with pregnancy-related events notably increasing the likelihood of anxiety symptoms.
In addition to social support and stressful life events, various social factors such as economic level, social status, marital status, non-native speakers, and housing status also play a role in the prenatal psychological state of pregnant women [40]. Morylowska-Topolska et al. [41] discovered that economic level and housing situations consistently impact the psychological well-being of pregnant women. Previous research [42] has indicated that favorable living conditions significantly contribute to enhancing maternal psychological recovery. Conversely, this study revealed that poor living conditions can be a risk factor for developing depression during pregnancy. Furthermore, women with lower marital satisfaction were more likely to experience heightened levels of stress during pregnancy [43]. The physiological changes and psychological needs that accompany pregnancy necessitate support and understanding within the marital relationship; thus, women with higher levels of marital satisfaction are less likely to experience postpartum depression [44].
This study successfully constructed a risk prediction model for depression during pregnancy. The mean absolute error of the calibration curve of the model was verified as 0.011, demonstrating good predictive accuracy, and the area under the working characteristic curve of the subjects reached 0.806, with a sensitivity of 66.4% and specificity of 83.5%. Compared with existing diagnostic methods and scales, the EPDS focuses on postnatal depression screening, and this model can integrate multidimensional risk factors at the stage of pregnancy to assess the risk of disease in pregnant women in advance; moreover, this model is more advantageous in terms of accuracy. Some traditional screening questionnaires focus on a single dimension of risk, whereas this model incorporates a combination of factors, which greatly improves the comprehensiveness of the prediction.
Compared with the existing literature, the advantage of this model is that it integrates multiple social, psychological, and physiological factors and is presented in the form of a visualized column-line graph, which facilitates clinicians in calculating the risk probability and identifying high-risk pregnant women quickly. However, the fact that the sample was from a single center may limit the generalizability of the model.
To summarize, the independent risk factors for depression during pregnancy include spousal disharmony, discordant parental relationships, changes in sleep and diet, work-study stress, adverse maternal history, dissatisfactory living environment, assisted reproduction, unplanned pregnancy, interference from adverse life events, and lack of maternal knowledge. The prediction model presented in this study can effectively calculate the occurrence of depression during pregnancy, which is helpful for clinical staff to identify high-risk groups, strengthen pregnancy health care for pregnant women with multiple risk factors, and conduct prenatal health education to alleviate nervousness and fear. Meanwhile, individualized psychological guidance and family intervention can be provided for depressed pregnant women to reduce the occurrence of depression during pregnancy, ensure that pregnant women receive sufficient social support, and minimize the probability of depression during pregnancy.
This study also has some limitations. First, this was a single-center retrospective study with a relatively small sample size (n = 630), and the subjects were all from the same region, which may result in an under-representative sample and affect the generalizability of the model. Second, although the EPDS and GAD-7 scales employed in the study are commonly used screening tools, these scales are mainly used for postpartum depression assessment, and their specificity in predicting depression during pregnancy still needs to be validated further. In addition, this study only explored the correlates of depression during pregnancy; thus, it did not clarify the causal relationships or consider potential influences such as cultural differences and social support systems. Future studies are needed to expand the sample size, conduct multicenter prospective studies, and include more dimensional assessment indicators to enhance the credibility of the research and the applicability of the model.
In addition, the model in this study was constructed and internally validated only on single-center data, meaning the model has not been externally validated, which limits its diagnostic generalizability. The follow-up study will expand the sample range, conduct a multicenter study, collect data from pregnant women in different regions, and externally validate the model by applying the same assessment scales and statistical methods to test the accuracy and applicability of the model further.
This study clarified the independent risk factors for depression during pregnancy through multifactorial analyses, including multidimensional indicators, such as spousal relationships, familial environments, changes in living habits, work-study stress, and pregnancy and childbirth history. The column-line graph prediction model constructed based on these factors had good predictive efficacy (AUC = 0.806) and effectively identified a group of high-risk pregnant women. This study provides a visual and easy-to-use risk assessment tool for the clinic, which can help early intervention and personalized management to reduce the incidence of depression during pregnancy. Future multicenter studies are needed to validate the generalizability of the model further and explore its application value in different cultural contexts.
Original data in this study are available from the corresponding author according to reasonable request.
HQ and YZ designed the research study. HQ and YZ performed the research. YY performed verification and formal analysis. HQ analyzed the data. All authors contributed to editorial changes in the manuscript. All authors read and approved the final manuscript. All authors have participated sufficiently in the work and agreed to be accountable for all aspects of the work.
The study was conducted in accordance with the Declaration of Helsinki and approved by the Ethics Committee of Jinshan Central Hospital Affiliated to Shanghai University of Medicine & Health Sciences (Code number: jszxyy202129; Approval date: November 3, 2020). All subjects gave their informed consent for inclusion before they participated in the study.
We thank all the patients who have participated in this study.
This research is supported by Jinshan District Medical and Health Science and Technology Innovation Fund Project (Grant No. 2020-3-31) and Shanghai University of Medicine & Health Sciences Affiliated Hospital Faculty Talent Hundred People Talent Program (Grant No. 2023-1).
The authors declare no conflict of interest.
Publisher’s Note: IMR Press stays neutral with regard to jurisdictional claims in published maps and institutional affiliations.