
- Academic Editor
Passing from the first to the third trimester of pregnancy is correlated with a significant increase in pelvic anterior tilting that relates to lumbopelvic morbidities. Additionally, cesarean section (CS) is linked to lumbopelvic morbidities. This study measured the pelvic tilt angle and pelvic torsion in postpartum women who underwent CS after the end of the puerperium. The aim was to determine whether these kinematic pelvic measures persist or are corrected by the end of the puerperium. Therefore, the study compared these measures to those of the control group that had never been pregnant.
This study followed the Strengthening the Reporting of Observational studies in Epidemiology (STROBE) guidelines for the cross-sectional comparative design, with retrospective classification of exposure (CS vs. nulliparous controls), in which 42 women were categorized into two equal-sized groups. Group (A) was 21 women who delivered by CS. Group (B) was 21 women who served as controls, who never experienced pregnancy. Women in the CS group were measured at 6–12 weeks postpartum. The digital pelvic inclinometer (DPI) was used to estimate the pelvic tilt angle.
The statistical analysis yielded non-significant differences between both groups in the right and left pelvic tilt angles (p = 0.385 and 0.762), respectively. Also, there was a non-significant difference in pelvic torsion between the two groups (p = 0.519). An analysis of covariance (ANCOVA) model adjusting for multiple physical covariates confirmed that the group differences in pelvic tilt and pelvic torsion remained non-significant.
By 8 weeks postpartum, pelvic tilt and torsion in post-CS women return to near-normal levels, with residual differences that are negligible both statistically and clinically compared with the controls.
The study has been registered on https://clinicaltrials.gov/ (registration number: NCT06019962; registration link: https://clinicaltrials.gov/study/NCT06019962?cond=NCT06019962&rank=1).
Pregnant women undergo notable adaptations in different systems, such as the urogenital, musculoskeletal, and cardiovascular systems. These adaptations are physiological responses to hormonal changes associated with pregnancy [1]. Adaptations in the musculoskeletal system include alterations in bone alignment, mostly at the lumbopelvic region, such as exaggerated anterior tilting of the pelvis and excessive lordosis of the lumbar spine [2]. These adaptations are linked to the rise in ligament flexibility resulting from the substantial impact of relaxin, estrogen, and progesterone hormones [3, 4]. Lumbopelvic pain occurs largely during the third trimester and following childbirth because of these pregnancy-related adaptations [5]. Some researchers reported a significant increase in anterior pelvic tilting as pregnant women advanced from the first trimester to the third trimester [6]. A cesarean section (CS) refers to the delivery of one or more newborns through surgical incisions to the abdomen and uterus [7]. The steady increase in CS rates continues to raise global concern [8]. According to governmental sources from the Central Agency for Public Mobilization and Statistics, the rate of CS in Egypt rose from 52% in 2014 to about 72% of all deliveries in 2021, making it the highest worldwide [9, 10]. This rate is substantially higher than the projected global CS rate, which is expected to reach 28.2% by 2030 [10]. CS may be associated with various postpartum musculoskeletal morbidities, like sacroiliac dysfunction, low back pain, and symphysis pubis diastasis [11, 12, 13, 14, 15, 16]. The puerperium period begins rapidly after the delivery of the newborn and extends up to six weeks [17]. Despite either pregnancy or birth-related adaptations, most of these adaptations revert to the pre-pregnant state by the end of the puerperium [18]. However, recovery of the pelvic floor and abdominal muscles typically takes longer, requiring at least 4 and 6 months, respectively [19, 20].
Pelvic tilting is a rotatory movement of the pelvis (the innominate bones) relative to stationary femurs, which occurs in the sagittal plane [21]. The angle of pelvic tilt can be defined as the angle formed by the horizontal plane and the line connecting the midpoints of the posterior superior iliac spine (PSIS) and the anterior superior iliac spine (ASIS) [22, 23]. When measured from a standing position in healthy participants, the pelvic tilt angle appears to be gender-dependent, with males having a mean value of 9° and females having a mean value of 12° [24]. The difference between the bilateral pelvic tilt angles can be used to assess pelvic torsion [25].
Increased anterior pelvic tilt has been associated with sacroiliac joint dysfunction, lower back pain, and femoroacetabular impingement [26, 27, 28]. Moreover, pelvic tilt measurements obtained through diagnostic radiology are widely used in research settings and in planning surgical procedures [29]. Given these clinical implications and alongside the growing national and international concern regarding CS rates, we conducted this study, which, to the best of our knowledge, is the first to examine whether pelvic tilt and torsion values in post-CS women (after the puerperium) return to levels comparable with nulliparous women (who have never experienced pregnancy).
This study followed the STROBE guidelines of a cross-sectional comparative design. It was run at the Women’s Hospital of South Valley (Qena) University Hospitals, Qena governorate, Egypt. 42 women completed this study. The sample size was calculated based on a large effect size (16.1) with (95% CI: 12.8 to 19.4) of third trimester of pregnancy on the angle of pelvic tilt compared to the controls who never had been pregnant as reported by Kouhkan et al. [30], 2015. Using the G*Power (version 3.1; Heinrich Heine University Düsseldorf, Düsseldorf, Germany) analysis, with an effect size of 0.8 instead of 16.1, an alpha level of 0.05, a power of 0.80, and an allocation ratio of 1:1. So, we needed a total number of participants of 42, 21 in each group. We used the effect size from the previous study, as no published effect size was available for postpartum versus non-pregnant women at the time of planning this study. Also, it was the closest available reference as both late pregnancy and early postpartum states reflect biomechanical pelvic adaptations.
Participants’ names, mode of birth, type of anesthesia, date of birth, and contact information were obtained from the Women and Children’s Hospital database. Women who had delivered vaginally were excluded, leaving those who had given birth by CS, along with controls who had never been pregnant. Recruitment was conducted between August 2021 and February 2022. Eligible women were consecutively reached out by phone and asked to visit the outpatient department of the hospital for assessment of pelvic tilt angle (bilaterally) and pelvic torsion (calculated as the difference between right and left pelvic tilt angles). Controls were additionally recruited through hospital announcements and outpatient clinics. Personal information, including address, number of births, and history of specific lower back disorders, was recorded. Subsequently, all participants underwent measurement of height, body weight, and body mass index (BMI).
After applying the inclusion criteria, the women in the CS group were either primiparous (gave birth one time) or multiparous (gave birth more than once). All study participants were between 18 and 34 years old, their BMIs were between 19 and 28.5 kg/m2, and all participants were free of a previous specific lower back disorder. They were divided into two equal groups. Group (A) was 21 women who gave birth by CS. Group (B) was 21 women who were the controls and had never been pregnant. Our exclusion criteria were women who delivered by vaginal delivery, women who were older than 34 years, and women who had a BMI of less than 19 kg/m2 or more than 28.5 kg/m2. Also, women who complained of previous specific lower back or pelvic disorders like genital organ prolapse, spondylolisthesis, lumbar disc herniation, and scoliosis, and women whose postpartum period was less than 6 weeks or more than 12 weeks. We illustrated the study procedures, and an informed consent agreement was obtained before the onset of the study. Assessment of women in the CS group was conducted at 6–12 weeks postpartum (the index date of the study), at an average of 8 weeks postpartum, to ensure that participants had completed their puerperium. To decrease bias risk, only two skilled researchers (Mohamed G. Ali and Abeer A. Mohammed) performed the measurement.
The predictor (independent) variable of interest in this research was CS. In contrast, the assessed (dependent) variables were the bilateral pelvic tilt angles and pelvic torsion. The exposure was the mode of reproductive status (post-CS vs. never pregnant). The primary outcome is the right pelvic tilt angle (continuous, expressed in numerical degrees). The secondary outcomes were the left pelvic tilt angle (continuous, expressed in numerical degrees) and Pelvic torsion (continuous, expressed in numerical degrees).
The Digital Pelvic Inclinometer (DPI) was used to measure the right and left angles of pelvic tilt and pelvic torsion for women in the two groups.
The DPI (Sub-4 Limited, Sub-4 Technologies, Leek, Staffordshire, UK) was used to measure the pelvic tilt angle from a static, relaxed standing position.
The DPI is a reliable instrument to measure the angle of pelvic tilt. Within one rating session, it demonstrated strong inter-tester reliability (intraclass correlation coefficient [ICC] of 0.81–0.88) and test-retest reliability (ICC of 0.88–0.95) [31]. Also, it is one of the digital caliper-based pelvic inclinometers, which displayed a good convergent criterion validity of 0.93 when compared to radiography [32].
The DPI is equipped with two precision arms that are fastened to the main body. In the main body, a tri-axial accelerometer estimates the pelvic tilt angle across the two precision arms. The output of the tri-axial accelerometer is shown as a numerical angle in degrees on a liquid crystal display. Participants stood barefoot in a relaxed stance. After careful palpation, the DPI anterior arm was put on the ilium (innominate bone) on the ASIS, and the DPI posterior arm was put on the PSIS. The neutral position for the device was obtained by making the liquid bubble in the middle of the liquid crystal display to avoid measuring with the inclinometer in upper or lower tilt. The degree of inclination on the right side was recorded first, followed by the left side, as described by Beardsley et al. [31], and then the estimation of the difference between right and left pelvic tilt angles was done to quantify pelvic torsion (Fig. 1).
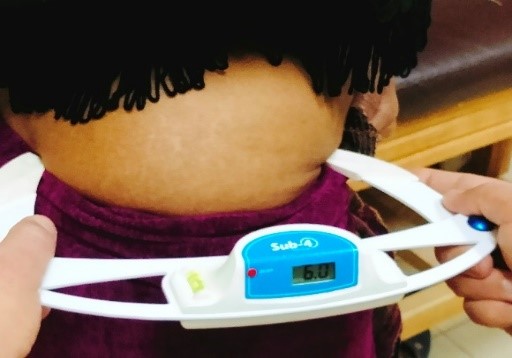 Fig. 1.
Measurement of pelvic tilt angle using DPI from a relaxed standing position in the sagittal plane, with the frontal axis and DPI arms positioned on the ASIS and PSIS. DPI, Digital Pelvic Inclinometer; ASIS, anterior superior iliac spine; PSIS, posterior superior iliac spine.
Data were assessed for either being normally distributed or not using the
Shapiro-Wilk normality test, which indicated the following variables of interest;
Age expressed in years (p = 0.045), BMI expressed in kg/m2
(p = 0.021), postpartum period expressed in weeks (p = 0.000),
and number of births (p = 0.000), left angle of pelvic tilt expressed in
numerical degrees (p = 0.031), and pelvic torsion expressed in numerical
degrees (p = were non-parametric (i.e., p
The data were analyzed statistically by the IBM SPSS statistical software program, version 25 for Windows (SPSS, Inc., Chicago, IL, USA). The following statistical analyses were carried out:
Descriptive statistics. Data presented as the median and interquartile range
(IQR) represented the non-parametric variables, including age (years), body mass
index (BMI, kg/m2), postpartum period (weeks), number of births, left angle
of pelvic tilt, and pelvic torsion expressed in numerical degrees. Both the mean
(average)
The Mann-Whitney U test was utilized to match the mean ranks of the two groups for the non-normally distributed data. Their effect sizes were calculated using the rank-biserial correlation (rrb).
The independent t-test was utilized to match the means of the two groups for the normally distributed data. Their effect sizes were calculated using Cohen’s d.
The ANCOVA Model was utilized to control for the potential confounding influence of multiple covariates, group factors, and physical characteristics like age, BMI, weight, and height on the outcomes of interest (the right and left angles of pelvic tilt and pelvic torsion).
Statistical significance was set at a probability level of p
A total of 71 women were screened for eligibility. Of these, 29 were excluded: 12 had a BMI greater than 30 kg/m2 or less than 18.5 kg/m2, 6 were older than 35 or younger than 18 years, 4 were outside the window of 6–12 weeks postpartum, 2 were experiencing specific low back pain before pregnancy, and 5 did not complete all required procedures. The remaining 42 women met the eligibility criteria and were enrolled in the study. 21 women were assigned to the post-CS group and 21 to the control group (never pregnant). All enrolled participants completed the study and were included in the final analysis (Fig. 2).
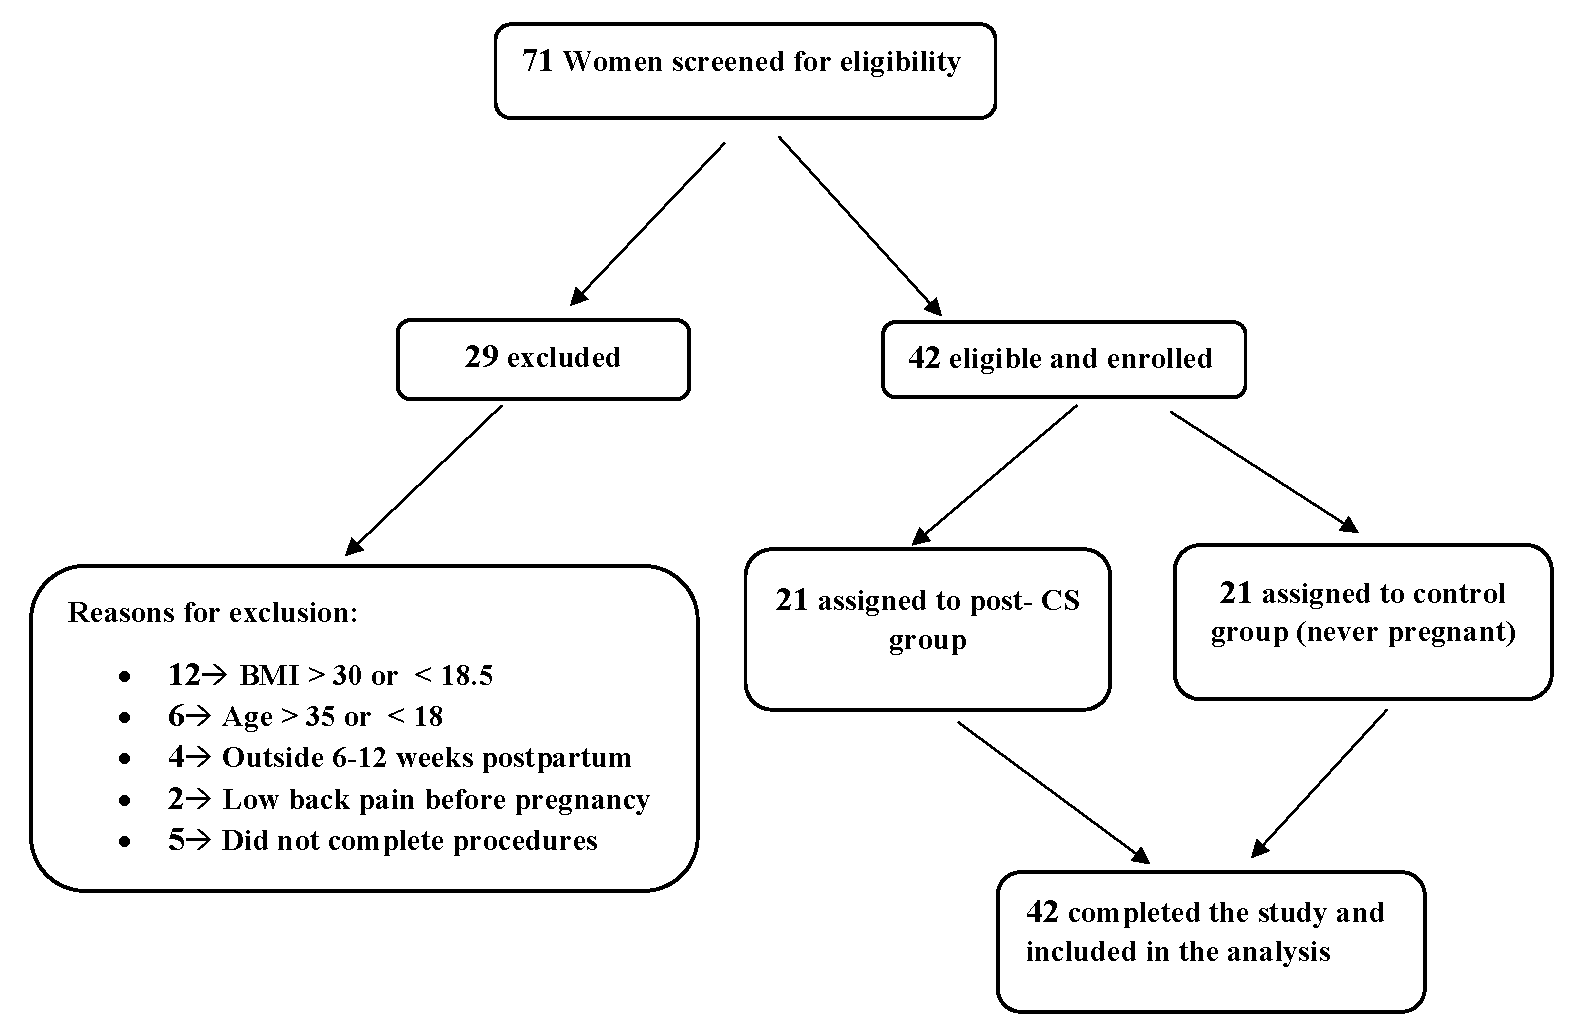 Fig. 2.
STROBE flow diagram. STROBE, Strengthening the Reporting of Observational studies in Epidemiology; BMI, body mass index; CS, cesarean section.
The median [IQR] values for age expressed in years for groups A and B were 24
[7] and 24 [2], respectively (Table 1). The effect size of age (rrb = 0.08; very
small or negligible effect size). The mean
| Items | Physical features of the participating women | |||||
| Age in Years Median [IQR] | Weight in kg Mean |
Height in cm Mean |
BMI in kg/m2 Median [IQR] | Postpartum Period in Weeks Median [IQR] | Number of Births Median [IQR] | |
| Group A (n = 21) | 24 [7] | 62.81 |
158.57 |
25.53 [3.9] | 8 [2] | 2 [2] |
| 95% CI: | 95% CI: | 95% CI: | 95% CI: | 95% CI: | 95% CI: | |
| [21.84–25.49] | [58.82–66.80] | [155.70–161.44] | [23.46–25.98] | [7.19–8.81] | [1.62–2.57] | |
| Group B (n = 21) | 24 [2] | 60.48 |
162.57 |
22.19 [8.6] | 0 [0] | 0 [0] |
| 95% CI: | 95% CI: | 95% CI: | 95% CI: | - | - | |
| [23.07–25.79] | [55.92–65.04] | [160.14–165.00] | [21.32–25.07] | - | - | |
| p-value | 0.656 | 0.455 | 0.043 | 0.117 | 0.000 | 0.000 |
| Significance | NS | NS | S | NS | S | S |
| Effect size | 0.08 | 0.23 | 0.60 | 0.46 | 1.00 | 1.00 |
Group A, CS group; Group B, Control group; p-value, probability value; NS, non-significant; S, significant; CI, confidence interval; BMI, body mass index; IQR, interquartile range.
The mean
| Items | Pelvic Measurements of the participating women | ||
| The right angle of pelvic tilt is expressed in numerical degrees (Mean |
The left angle of pelvic tilt is expressed in numerical degrees, Median [IQR] | Pelvic torsion is expressed in numerical degrees Median [IQR] | |
| Group A (n = 21) | 11.48° |
10.50° [3.8°] | 1.5° [2.3°] |
| 95% CI: [10.03°–12.93°] | 95% CI: [8.6°–12.4°] | 95% CI: [0.35°–2.65°] | |
| Group B (n = 21) | 10.70° |
10.00° [5.3°] | 1.5° [1.5°] |
| 95% CI: [9.64°–11.76°] | 95% CI: [7.35°–12.65°] | 95% CI: [0.75°–2.25°] | |
| p-value | 0.385 | 0.762 | 0.519 |
| Significance | NS | NS | NS |
| Effect size | 0.28 (Small) | 0.06 (Very Small) | 0.00 (None) |
To further account for potential confounding factors, ANCOVA models were used, with age, weight, height, and BMI entered as covariates. After adjustment, the mean right pelvic tilt angle was 11.18° in Group A and 10.99° in Group B (adjusted mean difference = 0.19°, 95% CI: –1.93 to 2.32, p = 0.855, partial η2 = 0.001). The left pelvic tilt angle was 11.00° in Group A and 10.45° in Group B (adjusted mean difference = 0.55°, 95% CI: –1.87 to 2.96, p = 0.649, partial η2 = 0.006). Pelvic torsion was 1.86° in Group A and 1.29° in Group B (adjusted mean difference = 0.57°, 95% CI: –0.51 to 1.65, p = 0.289, partial η2 = 0.031). None of the group effects reached statistical significance (Table 3).
| Dependent Variable | Adjusted Mean (Group A) | Adjusted Mean (Group B) | Mean Difference (Group A - B) | 95% CI | F(1, 36) | p-value | partial η² |
| Right pelvic tilt | 11.18° | 10.99° | 0.19° | −1.93 to 2.32 | 0.03 | 0.855 | 0.001 |
| Left pelvic tilt | 11.00° | 10.45° | 0.55° | −1.87 to 2.96 | 0.21 | 0.649 | 0.006 |
| Pelvic torsion | 1.86° | 1.29° | 0.57° | −0.51 to 1.65 | 1.16 | 0.289 | 0.031 |
ANCOVA, analysis of covariance. partial η2, a measure of the effect size.
This study estimated the pelvic tilt angle and pelvic torsion in postpartum women who underwent CS after the end of the puerperium. The aim was to determine whether these kinematic pelvic measures persist or are corrected by the end of the puerperium. Therefore, the study compared these measures to those of controls who had never been pregnant. The null hypothesis of this study assumed that women who have passed through pregnancy and CS do not show significant differences in the pelvic tilt angle and pelvic torsion compared to those who had never been pregnant.
The findings of this study indicated non-significant increases in the right and
left angles of pelvic tilt in women who experienced CS when compared to women in
the control group. Also, there was a non-significant increase in pelvic torsion
between the two groups. The small effect sizes support the interpretation that
the observed differences were not only statistically non-significant but also
clinically negligible. We calculated the mean
Regarding our result of the non-significant difference between the two groups in pelvic torsion (which equals the difference between the right and left pelvic tilt angle). This result agrees with the result of Morino et al. [35], who reported a non-significant difference in pelvic asymmetry (torsion) in women who completed 1 month after childbirth without clarification of their mode of birth, either vaginal or cesarean.
On the contralateral side, our results regarding the mean right pelvic tilt
angle in non-pregnant women of the control group showed an angle of
10.70°
The ANCOVA models adjusting for multiple covariates (Age, Weight, Height, BMI) on the pelvic tilt angles and pelvic torsion provide the following interpretation: The ANCOVA effectively controls confounding effects to isolate the main effect and evaluate the contribution of covariates to the outcome variance. It confirmed that after adjusting for anthropometric covariates, the observed differences between post-CS and control women in pelvic tilt and torsion were minimal and not statistically significant. The partial η2 values ranged from 0.001 to 0.031, indicating negligible to small effect sizes. These findings reinforce the interpretation that pelvic alignment after CS normalizes by the end of the puerperium, and the observed residual differences were negligible both statistically and clinically.
This research work has valuable strengths. Firstly, to our knowledge, this study is the first study to estimate the pelvic tilt angle and pelvic torsion in post-CS women and compare them to those of the controls to determine the persistence or the correction of these measures after the end of the puerperium. Secondly, a valid, reliable, objective device for the measurement (the DPI) was used. Thirdly, only two qualified researchers measured the participating women. Fourthly, the inclusion of a post hoc power analysis for the primary outcome demonstrated an achieved power of 0.81. This provides reassurance that the study was adequately powered to detect clinically meaningful differences within the predefined equivalence margin. In addition, effect sizes (Cohen’s d, rank biserial correlation) were reported for all variables alongside p-values. This practice offers a more comprehensive interpretation of the results. Fifthly, a key strength of this study is the application of ANCOVA, adjusting for potential confounders including age, weight, height, and BMI. This approach ensured that the comparisons of pelvic tilt and torsion between groups were not biased by baseline anthropometric or demographic differences, which enhances the robustness and internal validity of the findings, providing greater confidence that the observed results reflect true group differences rather than confounding influences.
The professional significance of this research lies in its demonstration that kinematic pelvic measurements, specifically pelvic tilt and pelvic torsion, return rapidly toward normal values after the end of the puerperium in post-CS women, as observed at a mean of 8 weeks postpartum. Although the between-group differences were statistically non-significant, the small magnitude of change suggests these findings are clinically trivial and support the interpretation of a near-complete recovery of pelvic alignment by this stage. Larger studies incorporating BMI-stratified analyses would be beneficial. Further research with larger samples are needed to validate these study results, and comparisons between women who have a CS and women who have a normal vaginal delivery could enrich the scientific knowledge in obstetric physical therapy.
This research work has limitations. Firstly, the design of this study is cross-sectional with retrospective classification of exposure (CS), which limited comparison with postpartum CS women after the end of puerperium to themselves before pregnancy. This previous limitation may be solved in the prospective cohort design; however, participants’ withdrawal or the failure to follow up, as well as the time-consuming factors in such a design, presented a difficulty, as illustrated by De Rango [37] and Euser et al. [38]. Secondly, we did not consider the sacroiliac joint painful syndrome or other current pelvic girdle pain in the exclusion or inclusion standards. This painful syndrome may affect the pelvic girdle biomechanics, as we deduced from the research of Enix and Mayer [39]. Thirdly, we only measured the angle of pelvic tilt and pelvic torsion, although other pelvic parameters like the angle of sacral slope and the pelvic incidence angle can also be useful indicators for the biomechanical functions of the lumbopelvic region, as reported by Le Huec et al. [40]. Also, the lack of imaging validation (radiographs/MRI) of pelvic measurements is considered a limitation in the study. Fourthly, reliability and inter-rater agreement were not assessed in our sample, and this is a potential source of measurement bias. Fifthly, the exclusion of women who had undergone vaginal delivery restricts the applicability of our findings across the full spectrum of postpartum women. Also, although the sample met the calculated minimum, the absolute number remained modest, which may limit generalizability, especially in this single-center setting. Moreover, the true effect size for postpartum vs. non-pregnant women may differ from that of pregnancy vs. non-pregnant women, potentially influencing the power estimation.
CS does not appear to be associated with lasting alterations in pelvic tilt angle or pelvic torsion. By the end of the puerperium (around 8 weeks postpartum), these kinematic pelvic measurements had declined to levels that were statistically indistinguishable from controls, with only trivial differences observed. This supports the interpretation that pelvic alignment returns to near-normal values comparable to those of women who have never been pregnant.
The data from this study can be obtained upon request from the corresponding author. Because of ethical constraints, the dataset is not accessible to the public.
RSM, ASAK, MA and MGA designed the research study. MGA, AMY and AAM performed the research. MA and MAMS provided help and advice. MGA, HMZ and MAMS analyzed the data. HMZ and ASAK supported the research process and contributed to funding acquisition. AMY supervised the research and provided critical guidance throughout the study. RSM and MGA, performed editing, and handled the submission process. All authors contributed to editorial changes in the manuscript. All authors read and approved the final manuscript. All authors have participated sufficiently in the work and agreed to be accountable for all aspects of the work.
The study was conducted in accordance with the Declaration of Helsinki. The research proposal was approved by the Research Ethics Review Committee of the Faculty of Physical Therapy, South Valley University, Qena, Egypt, under the number P.T-WH-10/2023-524. Also, the study has been registered on https://clinicaltrials.gov/ (registration number: NCT06019962; registration link: https://clinicaltrials.gov/study/NCT06019962?cond=NCT06019962&rank=1). Written informed consent was obtained from all subjects involved in the study.
The authors thank PT. Aya Gamal (The Instructor of Women’s Health Physical Therapy, South Valley (Qena) University, Egypt) for her helpful support in completing this research work. Finally, the authors thank each participating woman in this research.
This research was funded by Princess Nourah bint Abdulrahman University Researchers Supporting Project number (PNURSP2025R785), Princess Nourah bint Abdulrahman University, Riyadh, P.O. Box 84428. Riyadh 11671, Saudi Arabia.
The authors declare no conflict of interest.
The authors used ChatGPT-3.5 and Grammarly during manuscript preparation to improve English fluency and grammar. After using this tool, the authors reviewed and edited the content as needed and take full responsibility for the content of the publication.
Supplementary material associated with this article can be found, in the online version, at https://doi.org/10.31083/CEOG45605.
Publisher’s Note: IMR Press stays neutral with regard to jurisdictional claims in published maps and institutional affiliations.