
- Academic Editor
Dysmenorrhea is a common condition that affects many women during their reproductive years and can lead to significant disruptions in daily life. While studied extensively worldwide, only limited research has been conducted on the severity and effects of dysmenorrhea in women from the Eastern region of Saudi Arabia. Therefore, this study aimed to examine the prevalence of dysmenorrhea and its impact on women from this region, using the Work ability, Location, Intensity, Duration of Dysmenorrhea (WaLIDD) score to assess the severity of dysmenorrhea across multiple dimensions.
A cross-sectional study was conducted at the University of Hafr Al Batin to determine the severity of dysmenorrhea among 291 female students using the WaLIDD score. Data on demographic characteristics, clinical history, and menstrual patterns were collected through an online questionnaire. Statistical analyses, including Fisher’s exact test and ANOVA test, were performed using R Studio.
Among the participants, 13.1% had no or mild dysmenorrhea (no-to-mild), 47.4% had moderate dysmenorrhea, and 39.5% had severe dysmenorrhea. Severe dysmenorrhea was associated with significantly higher body mass index (BMI) (p = 0.024), a history of gynecological disease (p = 0.029), and seeking medical consultation (p < 0.001). Severe dysmenorrhea was also significantly associated with irregular cycles (p = 0.003), heavier menstrual flow (p < 0.001), and functional impairment (p < 0.001).
Dysmenorrhea is highly prevalent and has significant effects on the daily life of young women in the Eastern region of Saudi Arabia. BMI and menstrual characteristics play key roles in the severity of dysmenorrhea, thereby highlighting the need for targeted interventions and increased awareness to improve management strategies.
Dysmenorrhea is a prevalent gynecological condition characterized by painful uterine contractions that lead to recurrent pelvic pain, particularly among adolescents and young adult women. It is generally categorized into two subtypes: primary dysmenorrhea, which occurs without identifiable pelvic pathology and typically responds well to analgesic therapy, and secondary dysmenorrhea, which is often more severe and associated with underlying conditions such as endometriosis or uterine fibroids [1, 2, 3].
Globally, dysmenorrhea affects between 50% and 90% of menstruating women [4, 5, 6, 7, 8]. In Saudi Arabia, the burden appears to be particularly high, with a reported prevalence ranging from 70% to 92.3% [9, 10, 11, 12, 13, 14, 15]. This condition has been found to significantly disrupt daily activities, academic performance, and overall quality of life [16]. While numerous international and national studies have examined its prevalence, variations in study design and data collection tools, particularly the inconsistent use of systems for grading severity, have contributed to heterogeneity in the reported outcomes. In many cases, emphasis has been placed on estimating the prevalence of dysmenorrhea, with less attention given to the standardized assessment of symptom intensity and functional effects, thus making it difficult to examine potential associations with clinical and demographic factors [11, 15].
To address these limitations, the Work ability, Location, Intensity, Duration of Dysmenorrhea (WaLIDD) score developed by Teherán et al. (2018) [17] provides a validated and multidimensional approach for grading the severity of dysmenorrhea in the range from none to severe. This tool allows for more objective assessments and consistent comparisons across populations, while including factors such as body mass index (BMI) and menstrual characteristics in the analysis. Previous studies have suggested an association between higher BMI and increased severity of dysmenorrhea, as well as a strong relation between symptom severity and reduced quality of life [18, 19, 20, 21].
Only a limited number of studies conducted in Saudi Arabia have used the WaLIDD score to assess dysmenorrhea. Notably, Alateeq et al. (2022) [12] examined its association with depression, while Almanasef and Alqarni (2023) [15] investigated self-management strategies. While both studies provide valuable contributions, neither focused on the relationship between the severity of dysmenorrhea and clinical or menstrual characteristics. The goal of the present study was to fill that gap by assessing the prevalence, severity, and functional effects of dysmenorrhea among female university students in Hafr Al Batin, Eastern Saudi Arabia, using the WaLIDD score. We also investigated associations between the severity of dysmenorrhea and key variables such as age, BMI, and menstrual characteristics. By using a standardized and validated tool, this research has the potential to enhance clinical understanding, support targeted interventions, and promote greater awareness of menstrual health among young women.
A total of 300 Saudi women were recruited from the University of Hafr Al Batin
(Hafr Al Batin, Saudi Arabia) between May 2023 and November 2024. The study used
convenience sampling, and the sample size was determined using G*Power software
(version 3.1.9.7; Heinrich-Heine-Universität Düsseldorf, Düsseldorf,
Germany) to achieve a 95% CI (
The participants were recruited through study flyers and brochures containing quick response (QR) codes that directed them to an online survey hosted on Google Forms. The survey was available in Arabic and collected information on demographic characteristics, socioeconomic status, and menstrual history. To ensure appropriate participant selection, specific inclusion and exclusion criteria were applied as follows:
Inclusion Criteria:
Saudi women.
Aged 17 years or older.
Enrolled as students at the University of Hafr Al Batin.
Exclusion Criteria:
Known pelvic disorders, including endometriosis, pelvic inflammatory disease, and uterine fibroids.
History of pelvic surgery.
Pregnancy.
The severity of dysmenorrhea was assessed using the WaLIDD score. This was calculated by assigning numeric values to participant responses across four domains related to menstrual pain: pain intensity, location of pain, interference with work or school, and duration of pain. Each component was scored on a 4-point scale from 0 to 3. Pain intensity was categorized using a modified Wong-Baker scale, where “Does not hurt” was scored as 0, “Hurts a little bit” as 1, “Moderate” and “Severe pain” as 2, and “Very severe” and “Intense pain” as 3. Pain location was scored based on the number of body parts affected, with “None” as 0, “One site” as 1, “2–3 sites” as 2, and “4 sites” as 3. Interference with daily activities was rated from “None” (0) to “Always” (3), reflecting increasing disruption of work or school. Duration of pain was classified by the number of days, with 0 days scored as 0, “1–2” days as 1, “3–4” days as 2, and more than 4 days as 3. The total WaLIDD score ranged from 0 to 12, and was further categorized into severity levels: 0–4 as no to mild dysmenorrhea (no-to-mild), 5–7 as moderate, and 8–12 as severe.
Demographic and clinical data were collected from participants, including
information related to the severity of dysmenorrhea based upon the WaLIDD score.
Categorical variables were described using frequencies and percentages.
Categorical variables were compared between groups using the Chi-square test when
the expected frequency in each cell was greater than 5, and Fisher’s exact test
was applied when expected frequencies were
A total of 291 participants were included in the study, of which 38 (13.1%)
were classified as having no to mild dysmenorrhea, 138 (47.4%) with moderate
dysmenorrhea, and 115 (39.5%) with severe dysmenorrhea (Fig. 1A). No significant
differences in menstrual status, age distribution, marital status, or academic
level were observed between the dysmenorrhea severity groups (all p
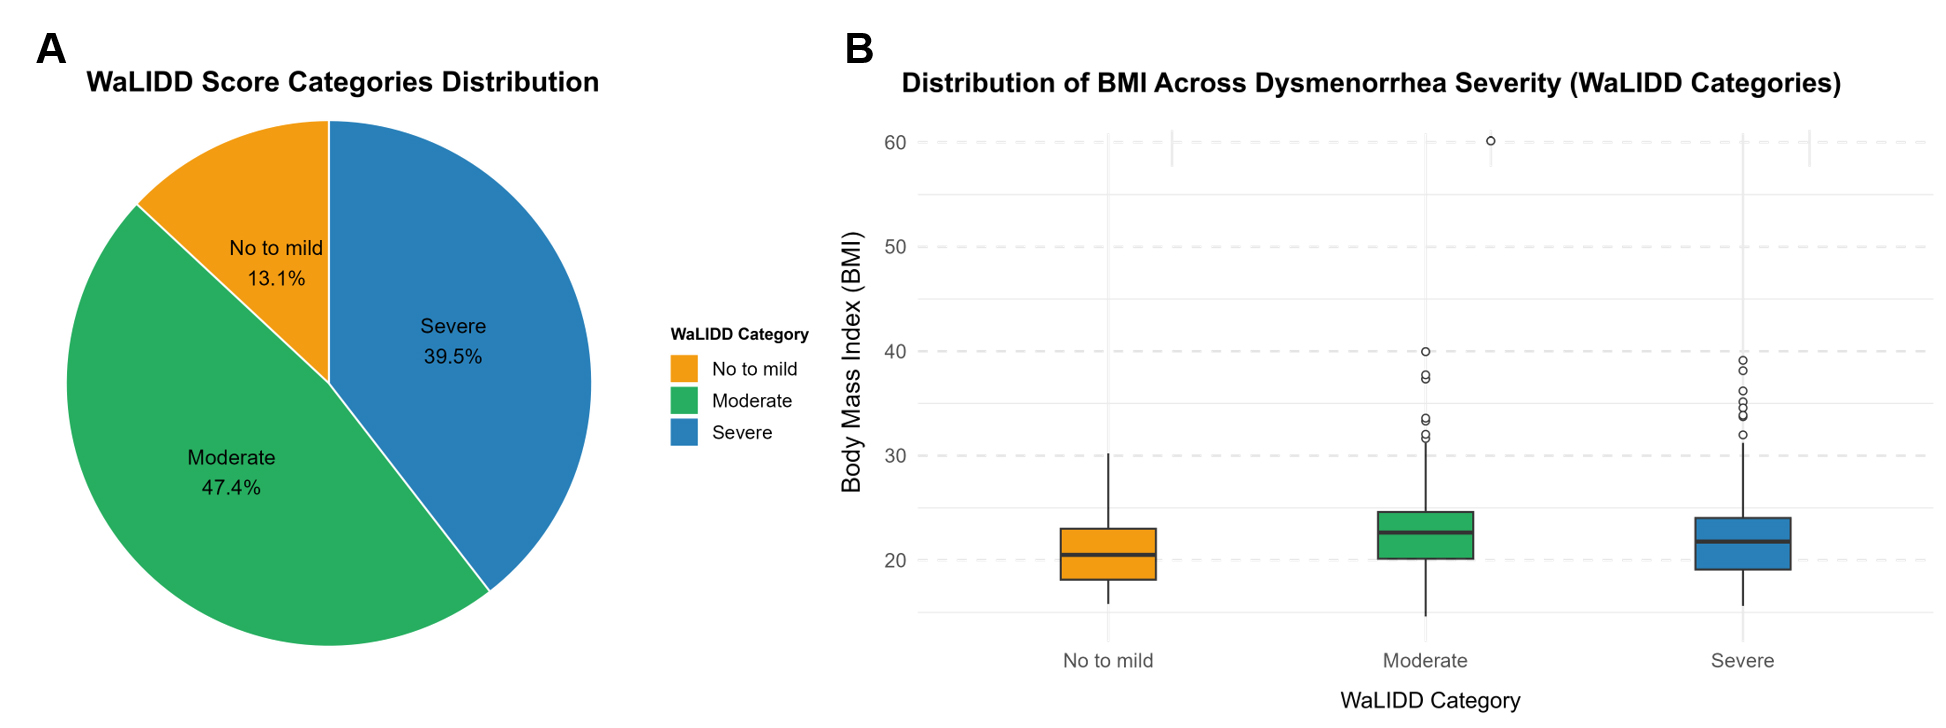 Fig. 1.
Severity of dysmenorrhea and its association with BMI among participants. (A) Distribution of dysmenorrhea severity. The pie chart shows the distribution of dysmenorrhea severity among 291 female university students, as classified using the WaLIDD score. Of the total participants, 13.1% reported no-to-mild dysmenorrhea (red), 47.4% reported moderate dysmenorrhea (green), and 39.5% experienced severe dysmenorrhea (blue). (B) Comparison of BMI across different WaLIDD dysmenorrhea levels. The boxplots show the distribution of BMI among participants with no-to-mild, moderate, and severe dysmenorrhea, as categorized using the WaLIDD score. Participants with moderate and severe dysmenorrhea had a higher BMI compared to those with no-mild dysmenorrhea. WaLIDD, Work ability, Location, Intensity, Duration of Dysmenorrhea; BMI, body mass index.
| Variable | Overall (n = 291) | No-to-mild (n = 38) | Moderate (n = 138) | Severe (n = 115) | p-value | |
| Age (%) | 18–20 years | 113 (39.0) | 13 (35.1) | 62 (44.9) | 38 (33.0) | 0.393ϯ |
| 21–23 years | 159 (54.8) | 22 (59.5) | 68 (49.3) | 69 (60.0) | ||
| 18 (6.2) | 2 (5.4) | 8 (5.8) | 8 (7.0) | |||
| Marital status (%) | Married | 20 (6.9) | 2 (5.4) | 8 (5.8) | 10 (8.7) | 0.616ϯ |
| Single | 270 (93.1) | 35 (94.6) | 130 (94.2) | 105 (91.3) | ||
| Height [mean (SD)] | 158.36 (5.46) | 156.78 (4.69) | 158.82 (5.59) | 158.32 (5.48) | 0.131ϼ | |
| Weight [mean (SD)] | 54.00 (16.32) | 51.46 (7.82) | 59.82 (17.47) | 56.76 (13.12) | 0.009ϼ* | |
| BMI [mean (SD)] | 22.04 (5.83) | 20.97 (3.35) | 23.70 (6.75) | 22.60 (4.94) | 0.024ϼ* | |
| Academic level (%) | Preliminary year | 17 (5.8) | 5 (13.2) | 7 (5.1) | 5 (4.3) | 0.268ϯ |
| First year | 49 (16.8) | 3 (7.9) | 21 (15.2) | 25 (21.7) | ||
| Second year | 55 (18.9) | 7 (18.4) | 27 (19.6) | 21 (18.3) | ||
| Third year | 74 (25.4) | 7 (18.4) | 40 (29.0) | 27 (23.5) | ||
| Fourth year | 60 (20.6) | 9 (23.7) | 30 (21.7) | 21 (18.3) | ||
| Fifth year | 36 (12.4) | 7 (18.4) | 13 (9.4) | 16 (13.9) | ||
| GPA (%) | Excellent (3.5 or above) | 94 (32.6) | 11 (29.7) | 55 (39.9) | 28 (24.8) | 0.193ϯ |
| Very good (3 to 3.5) | 98 (34.0) | 12 (32.4) | 45 (32.6) | 41 (36.3) | ||
| Good (2.5 to 3) | 81 (28.1) | 11 (29.7) | 34 (24.6) | 36 (31.9) | ||
| Pass ( |
15 (5.2) | 3 (8.1) | 4 (2.9) | 8 (7.1) | ||
| Have you ever been diagnosed with gynecological disease (%) | No | 219 (75.3) | 30 (78.9) | 112 (81.2) | 77 (67.0) | 0.029Ω* |
| Yes | 72 (24.7) | 8 (21.1) | 26 (18.8) | 38 (33.0) | ||
| Have you ever consulted a doctor because of menstrual pain (%) | No | 241 (82.8) | 37 (97.4) | 123 (89.1) | 81 (70.4) | |
| Yes | 50 (17.2) | 1 (2.6) | 15 (10.9) | 34 (29.6) |
* Statistically significant; ϯ Fisher exact test; Ω Chi-square test; ϼ ANOVA. GPA, grade point average.
Menstrual characteristics varied significantly across the three dysmenorrhea
severity groups. Participants with severe dysmenorrhea were significantly more
likely to have experienced irregular menstrual cycles over the past 12 months
compared to the no-to-mild dysmenorrhea group (47.0% vs. 23.7%, respectively,
p = 0.003). The duration of menstrual cycles also differed
significantly, with 14.8% of individuals with severe dysmenorrhea reporting
cycles lasting 8 or more days, compared to just 2.2% in the moderate
dysmenorrhea group and 10.5% in the no-to-mild group (p = 0.002).
Menstrual bleeding patterns also showed significant differences. Heavy menstrual
flow (more than four pads per day and/or associated with clots) was reported by
29.6% of women with severe dysmenorrhea compared to 11.6% in the moderate group
and only 2.6% in the no-to-mild group (p
| Variable | Overall (n = 291) | No-to-mild (n = 38) | Moderate (n = 138) | Severe (n = 115) | p-value | |
| Age at first menstruation [mean (SD)] | 12.63 (1.66) | 12.95 (1.71) | 12.62 (1.55) | 12.53 (1.78) | 0.409 | |
| Regular menstrual period in the last 12 months (%) | No | 103 (35.4) | 9 (23.7) | 40 (29.0) | 54 (47.0) | 0.003Ω* |
| Yes | 188 (64.6) | 29 (76.3) | 98 (71.0) | 61 (53.0) | ||
| Interval between two menstrual cycles (%) | 62 (21.3) | 8 (21.1) | 29 (21.0) | 25 (21.7) | 0.488Ω | |
| 22–28 | 172 (59.1) | 19 (50.0) | 81 (58.7) | 72 (62.6) | ||
| 57 (19.6) | 11 (28.9) | 28 (20.3) | 18 (15.7) | |||
| Number of days of menstrual pain (%) | 50 (17.2) | 6 (15.8) | 31 (22.5) | 13 (11.3) | 0.002ϯ* | |
| 5–7 days | 217 (74.6) | 28 (73.7) | 104 (75.4) | 85 (73.9) | ||
| 24 (8.2) | 4 (10.5) | 3 (2.2) | 17 (14.8) | |||
| Menstrual bleeding flow (%) | Normal flow (2 to 3 pads per day) | 209 (71.8) | 33 (86.8) | 106 (76.8) | 70 (60.9) | |
| Light (1 to 2 pads per day) | 31 (10.7) | 4 (10.5) | 16 (11.6) | 11 (9.6) | ||
| Very heavy (more than 4 pads per day and/or associated with clots) | 51 (17.5) | 1 (2.6) | 16 (11.6) | 34 (29.6) | ||
| Family history of dysmenorrhea (%) | Don’t know | 92 (31.6) | 7 (18.4) | 43 (31.2) | 42 (36.5) | 0.036Ω* |
| No | 120 (41.2) | 23 (60.5) | 60 (43.5) | 37 (32.2) | ||
| Yes | 79 (27.1) | 8 (21.1) | 35 (25.4) | 36 (31.3) |
* Statistically significant; ϯ Fisher exact test; Ω Chi-square test.
Menstrual pain characteristics varied significantly between the dysmenorrhea
severity groups. The prevalence of menstrual pain during the last three cycles
was significantly higher in women with severe dysmenorrhea (93.9%) compared to
the moderate group (74.6%) and the no-to-mild group (31.6%) (p
| Variable | Overall (n = 291) | No-to-mild (n = 38) | Moderate (n = 138) | Severe (n = 115) | p-value | |
| Have you experienced pain during your last 3 menstrual cycles? (%) | No | 68 (23.4) | 26 (68.4) | 35 (25.4) | 7 (6.1) | |
| Yes | 223 (76.6) | 12 (31.6) | 103 (74.6) | 108 (93.9) | ||
| How often do you experience menstrual pain? (%) | Never | 5 (1.7) | 3 (7.9) | 1 (0.7) | 1 (0.9) | |
| Rarely | 37 (12.7) | 20 (52.6) | 16 (11.6) | 1 (0.9) | ||
| Occasionally | 128 (44.0) | 12 (31.6) | 84 (60.9) | 32 (27.8) | ||
| Every period | 121 (41.6) | 3 (7.9) | 37 (26.8) | 81 (70.4) | ||
| When do you experience menstrual pain? (%) | Before menstruation | 35 (12.0) | 16 (42.1) | 15 (10.9) | 4 (3.5) | |
| During menstruation | 108 (37.1) | 16 (42.1) | 63 (45.7) | 29 (25.2) | ||
| Before and during menstruation | 105 (36.1) | 5 (13.2) | 47 (34.1) | 53 (46.1) | ||
| After menstruation | 2 (0.7) | 0 (0.0) | 0 (0.0) | 2 (1.7) | ||
| All of the above | 41 (14.1) | 1 (2.6) | 13 (9.4) | 27 (23.5) | ||
| Where do you experience menstrual pain? (%) | None | 7 (2.4) | 7 (18.4) | 0 (0.0) | 0 (0.0) | |
| Lower abdomen | 36 (12.4) | 7 (18.4) | 19 (13.8) | 10 (8.7) | ||
| Lower abdomen, thigh | 14 (4.8) | 2 (5.3) | 7 (5.1) | 5 (4.3) | ||
| Lower back | 23 (7.9) | 6 (15.8) | 13 (9.4) | 4 (3.5) | ||
| Lower back, lower abdomen | 99 (34.0) | 9 (23.7) | 59 (42.8) | 31 (27.0) | ||
| Lower back, lower abdomen, thigh | 103 (35.4) | 3 (7.9) | 36 (26.1) | 64 (55.7) | ||
| Lower back, thigh | 6 (2.1) | 2 (5.3) | 3 (2.2) | 1 (0.9) | ||
| Thigh | 3 (1.0) | 2 (5.3) | 1 (0.7) | 0 (0.0) |
* Statistically significant; ϯ Fisher exact test; Ω Chi-square test.
The WaLIDD score components showed significant differences between the
dysmenorrhea severity groups. First, the severity of menstrual pain was strongly
associated with dysmenorrhea severity (p
| Variable | Overall (n = 291) | No-to-mild (n = 38) | Moderate (n = 138) | Severe (n = 115) | p-value | |
| How severe is your period pain? | Does not hurt | 8 (2.7) | 8 (21.1) | 0 (0.0) | 0 (0.0) | |
| Hurts a little bit | 31 (10.7) | 21 (55.3) | 8 (5.8) | 2 (1.7) | ||
| Moderate pain | 105 (36.1) | 9 (23.7) | 80 (58.0) | 16 (13.9) | ||
| Severe pain | 86 (29.6) | 0 (0.0) | 45 (32.6) | 41 (35.7) | ||
| Very severe pain | 35 (12.0) | 0 (0.0) | 5 (3.6) | 30 (26.1) | ||
| Intense pain | 26 (8.9) | 0 (0.0) | 0 (0.0) | 26 (22.6) | ||
| How many parts of your body experience pain? (%) | None | 12 (4.1) | 10 (26.3) | 2 (1.4) | 0 (0.0) | |
| One site | 72 (24.7) | 25 (65.8) | 37 (26.8) | 10 (8.7) | ||
| 2–3 sites | 170 (58.4) | 3 (7.9) | 97 (70.3) | 70 (60.9) | ||
| 4 sites | 37 (12.7) | 0 (0.0) | 2 (1.4) | 35 (30.4) | ||
| Does menstrual pain prevent you from going to school? (%) | Nearly always | 114 (39.2) | 0 (0.0) | 42 (30.4) | 72 (62.6) | |
| Almost never | 95 (32.6) | 10 (26.3) | 74 (53.6) | 11 (9.6) | ||
| Always | 32 (11.0) | 0 (0.0) | 0 (0.0) | 32 (27.8) | ||
| None | 50 (17.2) | 28 (73.7) | 22 (15.9) | 0 (0.0) | ||
| How many days does your menstrual cycle last? (%) | 0 | 12 (4.1) | 11 (28.9) | 1 (0.7) | 0 (0.0) | |
| 1 to 2 | 179 (61.5) | 26 (68.4) | 111 (80.4) | 42 (36.5) | ||
| 3 to 4 | 69 (23.7) | 1 (2.6) | 25 (18.1) | 43 (37.4) | ||
| 31 (10.7) | 0 (0.0) | 1 (0.7) | 30 (26.1) |
* Statistically significant; ϯ Fisher exact test.
Menstrual pain significantly affected the daily activities of participants, with
the severity of dysmenorrhea correlating strongly with functional limitations
(p
Overall, 97.4% of participants with severe dysmenorrhea reported that menstrual
pain affected their daily activities, compared to 83.3% in the moderate group
and only 47.4% in the no-to-mild group (p
| Variable | Overall (n = 291) | No-to-mild (n = 38) | Moderate (n = 138) | Severe (n = 115) | p-value | |
| To what extent does your cycle affect your ability to perform daily activities? (%) | Not at all | 24 (8.2) | 15 (39.5) | 9 (6.5) | 0 (0.0) | |
| Affects me slightly | 88 (30.2) | 18 (47.4) | 61 (44.2) | 9 (7.8) | ||
| Affects me moderately | 118 (40.5) | 5 (13.2) | 55 (39.9) | 58 (50.4) | ||
| Prevents me from performing my daily tasks | 61 (21.0) | 0 (0.0) | 13 (9.4) | 48 (41.7) | ||
| Does menstrual pain affect your daily activities? (%) | None | 46 (15.8) | 20 (52.6) | 23 (16.7) | 3 (2.6) | |
| Yes | 245 (84.2) | 18 (47.4) | 115 (83.3) | 112 (97.4) | ||
| How many lectures do you miss because of menstrual pain? (%) | 4 (1.4) | 0 (0.0) | 1 (0.8) | 3 (2.7) | ||
| 1 to 3 | 157 (55.7) | 6 (16.2) | 66 (49.6) | 85 (75.9) | ||
| 4 to 5 | 11 (3.9) | 2 (5.4) | 3 (2.3) | 6 (5.4) | ||
| None | 110 (39.0) | 29 (78.4) | 63 (47.4) | 18 (16.1) |
* Statistically significant; ϯ Fisher exact test.
This study offers important insights into the prevalence, severity, and functional effects of dysmenorrhea on female university students in Hafr Al Batin. It represents the first investigation of dysmenorrhea in this particular region of Saudi Arabia. Our findings are consistent with global trends, which underscore the high prevalence of dysmenorrhea and its significant impacts on women’s health and well-being. Dysmenorrhea, particularly primary dysmenorrhea, is a common condition that affects a substantial proportion of women worldwide, with estimates ranging from 50% to over 90% [7, 22]. The prevalence in Saudi Arabia is similarly high, as demonstrated by Bakhsh et al. (2022) [10] who conducted the largest study to date on 1199 women of reproductive age and reported a dysmenorrhea prevalence of 92.3%.
In our cohort, 39.5% of participants reported experiencing severe dysmenorrhea, which is comparable to the findings of several international studies [7, 22]. This high prevalence underscores the significant burden of dysmenorrhea on young women in this region, and is consistent with other studies that have reported high rates of menstrual pain, particularly among university students [23, 24]. It is notable that the severity of dysmenorrhea in the present study was significantly associated with a higher BMI, a history of gynecological disease, and a greater likelihood of seeking medical consultation. Our results are consistent with those of previous studies that have linked these factors to more severe menstrual pain [20, 25]. The observed odds ratio of 1.11 indicates that each unit increase in BMI is associated with an approximately 11% higher likelihood of experiencing more severe dysmenorrhea. Although modest on an individual level, this effect becomes clinically meaningful at the population level, especially in regions where overweight and obesity are prevalent. These findings suggest that weight management interventions, including lifestyle modifications such as diet and physical activity, could play a role in alleviating the severity of dysmenorrhea. Incorporating BMI assessment into routine gynecological care may therefore provide an opportunity for early counseling and targeted interventions to improve menstrual health outcomes.
The prevalence of dysmenorrhea observed in Saudi Arabia is notably higher than that reported in many other countries. The results from Saudi studies are consistently higher, with the reported incidence ranging from about 70% to 90% [10, 13]. In contrast, a much lower prevalence of dysmenorrhea has been reported in some countries. For example, studies from China and Iran have reported rates as low as 41% [26, 27], whereas in parts of Europe they approach 90% [28, 29]. Several factors might account for the elevated rates and burdens seen in Saudi women. One important consideration is population demographics. Many of the participants were young and nulliparous, an age group known to have more frequent and severe dysmenorrhea, which typically diminishes with older age and childbirth [30]. Cultural and healthcare-related factors could further exacerbate the problem. Limited awareness or stigma surrounding menstruation and the lack of sex education might prevent Saudi women from seeking effective management, thereby increasing the reported intensity and impact of symptoms. Up to 87% of Saudi women consistently report menstruation-related interference in daily activities, which is far above the ~38% of women globally who experience such a severe impact [9]. These considerations suggest that sociocultural factors contribute to the comparatively high prevalence of dysmenorrhea and the associated burden observed in Saudi Arabia. To mitigate this, universities could integrate menstrual health workshops into orientation programs, while policymakers should consider pilot revisions of school curricula to improve early health literacy. Additionally, variations in how dysmenorrhea is defined and measured, including the lack of standardized diagnostic criteria and differences in study populations, complicate cross-study comparisons and likely contribute to the wide range in reported prevalence.
Menstrual characteristics, including irregular cycles and heavier menstrual flow, were also strongly associated with the severity of dysmenorrhea in this study. Participants with severe dysmenorrhea were significantly more likely to report irregular cycles and heavy menstrual flow, which are established risk factors for stronger pain intensity [5, 31]. Moreover, our results revealed that menstrual pain significantly interfered with daily activities, including academic attendance. This is consistent with previous studies that reported adverse effects of dysmenorrhea on education and work performance [23, 32].
The significant relation between dysmenorrhea and diminished quality of life noted in our study is a major concern. Severe dysmenorrhea was found to affect the ability of participants to engage in daily tasks. Some degree of impairment was reported by 97.4% of women with severe symptoms. This finding is consistent with those of Amza et al. [22], who found that dysmenorrhea significantly reduces the health-related quality of life, particularly in physical and emotional functioning domains. Furthermore, 75.9% of women with severe dysmenorrhea reported missing 1 to 3 lectures because of pain, consistent with earlier studies reporting academic disruption due to menstrual pain [24, 33].
Several factors that influence the onset and severity of dysmenorrhea have been identified, including age at menarche, family history, lifestyle factors, and psychosomatic aspects. Our study corroborates the importance of a family history of dysmenorrhea, as participants in the severe group were more likely to report a familial predisposition [26, 34]. Psychosomatic factors, such as stress and pain tolerance, have also been linked to the severity of dysmenorrhea in other populations [35, 36].
Our study was conducted over an 18-month period from May 2023 to November 2024, spanning all four seasons. Seasonal variation in factors such as temperature, vitamin D exposure, mood, and physical activity may influence the severity of dysmenorrhea. For example, colder months may be associated with increased muscle tension or reduced physical activity, potentially exacerbating pain symptoms [37]. Because the timing of our data collection did not control for seasonality, this could represent a source of variability in symptom reporting. Future studies may benefit from examining seasonal trends more explicitly, or stratifying data collection accordingly to assess potential seasonal effects.
This study has several limitations that should be considered. The sample was drawn from a single academic institution, which limits the ability to generalize the findings to other regions or populations. In addition, the cross-sectional study design does not allow causal inferences to be drawn. Future research should include more diverse samples and employ longitudinal methodologies to build on these results and provide a better understanding of dysmenorrhea and its associated factors. The use of self-reported data may also have led to recall bias and social desirability bias. While self-reporting remains a practical and widely accepted method for assessing menstrual symptoms, responses may still be influenced by personal interpretation or hesitancy in disclosure. Finally, due to logistical constraints, convenience sampling was used for efficient recruitment within a defined academic setting. While this method facilitates access to a relevant population, it introduces potential selection bias and limits the generalizability of findings to broader populations. Participants who chose to respond may differ systematically from non-respondents in ways that affect their reporting of dysmenorrhea prevalence or severity.
Despite these limitations, our study has solid clinical applications. Healthcare providers in Saudi Arabia can use the findings of recent dysmenorrhea research to make practical, evidence-based improvements in care. One key step is to incorporate the WaLIDD score into routine practice. Providers should proactively and routinely screen women of reproductive age, particularly those with high risk factors such as elevated BMI, prior to the development of symptoms. WaLIDD scores can help in the early identification of women with significant pain and in whom intervention is warranted. Such screening is crucial in the Saudi context, where many women normalize menstrual pain and avoid seeking care. A high WaLIDD score in an at-risk patient should prompt personalized counseling on lifestyle modifications (weight management, exercise) to help reduce symptoms, as well as timely referrals. It can also be used to guide treatment adjustments for better pain management, such as optimizing the use of nonsteroidal anti-inflammatory drug (NSAID) or trialing hormonal therapies.
This study provides important insights into the prevalence and impact of dysmenorrhea among female university students in the Eastern region of Saudi Arabia. The findings indicate that severe dysmenorrhea is both common and significantly disruptive, affecting daily activities, academic attendance, and overall quality of life. Factors such as elevated BMI, irregular menstrual cycles, and heavier menstrual flow were significantly associated with an increased severity of dysmenorrhea, consistent with the findings of similar global studies.
These results underscore the need for improved management strategies and targeted interventions to support young women in managing their symptoms. Given the complex nature of dysmenorrhea, which includes both physical and psychological components, a multidisciplinary approach to treatment may be particularly beneficial.
Future research should aim to include more diverse populations and longitudinal study designs to better understand the long-term effects of dysmenorrhea and develop effective prevention strategies. This study helps fill a critical gap in the regional literature and emphasizes the need for greater awareness and support for women experiencing this condition.
The data that support the findings of this study are available from the corresponding author, Zahraa Alali, upon reasonable request.
ZA contributed to the conceptualization of the study, sample collection, data analysis, and writing of the manuscript. ZA has read and approved the final version of the manuscript and agrees to be accountable for all aspects of the work.
The study was carried out in accordance with the guidelines of the Declaration of Helsinki and approved by the Institutional Review Board (IRB) at the University of Hafr Al Batin (Approval No.: UHB-003-03-2023). All participants provided written informed consent prior to enrollment, ensuring voluntary participation and confidentiality in accordance with the ethical guidelines for research involving human subjects.
I would like to express my sincere gratitude to the peer reviewers for their valuable comments and constructive suggestions, which have significantly improved the quality and clarity of this manuscript.
This research was supported by the Deanship of Scientific Research at the University of Hafr Al Batin, under project number [0068-1443-S].
The author declares no conflict of interest.
AI-based tools, including ChatGPT and QuillBot, were used to enhance the grammar and clarity of the manuscript. All scientific content, data analysis, and conclusions are entirely the work of the author, who assumes full responsibility for the integrity and accuracy of the publication.
Supplementary material associated with this article can be found, in the online version, at https://doi.org/10.31083/CEOG41538.
Publisher’s Note: IMR Press stays neutral with regard to jurisdictional claims in published maps and institutional affiliations.