
- Academic Editor
The association between parity and adverse outcomes has been a concern for decades; however, attention to the subgroups of low multiparity has not been adequately studied.
A retrospective study was conducted to examine the differences in maternal and neonatal outcomes among low-level multiparity subgroups, specifically women in their second, third, and fourth labors, who delivered between January 2012 and December 2016. Pregnancy outcomes were compared based on parity (second, third, and fourth labor).
A total of 1584 women were evaluated, of which 904 (57%) were in their second labor, 499 (31.5%) were in their third labor, and 181 (11.5%) were in their fourth labor. Women undergoing their second labor were younger than those in their third or fourth labors (29.6 vs. 32.3 or 32.7 years, respectively; p < 0.0001). Moreover, epidural analgesia was more common among women in their second labor compared to women in their third or fourth labor (70.0% vs. 59.5% or 52%, respectively; p < 0.0001). Women in their second labor were more likely to have a longer labor, compared to women in their third or fourth labor (8.50 vs. 7.46 and 6.24 hours, respectively; p < 0.05), and to have a higher rate of cesarean delivery (CD) compared to those in their third or fourth labor (13.2% vs. 7.8% or 6.1%, respectively; both cases, p < 0.01). There were no statistical differences in the rate of adverse outcomes between the third and fourth labor groups.
Women in their second labor were more likely to have longer labor durations and a higher risk of CD compared to women in their third or fourth labor. No difference in rates of adverse outcomes was noted between the third and fourth labors.
Parity is commonly divided into three categories: nulliparity, multiparity, and grand multiparity. Nulliparous women have never delivered before. Multiparity indicates previous deliveries, one or more than one. However, no universally accepted definition exists for grand multiparity. In the older medical literature, grand multiparity was reserved for women who delivered at least eight times [1, 2, 3]. According to more recent articles [4, 5, 6], a woman who has given birth at least five times is considered a grand multipara. Even more recently, four deliveries have been used as the cut-off for the definition of grand multiparity [7].
Previous studies have shown an association between multiparity and maternal adverse outcomes including postpartum hemorrhage, preterm birth, and prenatal death [2, 4, 7, 8]. These risks further increase in grand multiparity [7]. Compared to older grand multiparas, young grand multiparas—those under 35—are less likely to experience pregnancy complications [9]. However, studies directed at obstetrical risks in the subgroups with lower levels of multiparity in young patients including the second, third, and fourth deliveries are lacking.
The objective of this study was to examine the differences in maternal and neonatal outcomes in the low-level multiparity subgroups, specifically women in their second, third, and fourth labors.
This was a retrospective cohort study that included women with a singleton gestation who were delivered in a single, university-affiliated medical center, between January 2012 and December 2016 inclusively. Our center is an academic tertiary center with approximately 3600 annual deliveries. The hospital provides services to a heterogeneous population, including urban and non-urban subjects, and of different socio-economic classes. Most of our patients are Caucasians of European Origin. However, we also provide care to an important minority of Arabs. The study was approved by the local research committee # 0017-22-BNZ and complies with the 1964 Helsinki Declaration and its later amendments and all comparable ethical standards.
Data was collected from the institution’s birth registry, including a review of the electronic medical records, and the individual patient files. Baseline characteristics, delivery mode, duration, and maternal and neonatal adverse outcomes were compared among the three parity groups (second, third, and fourth labor). All subjects underwent a trial of labor.
Exclusion criteria included nulliparous or grand multiparous women, multifetal gestations, breech presentations, planned cesarean deliveries (CD), or any other contraindication for attempted vaginal delivery.
Women were classified into 3 groups according to parity: second, third, and
fourth labor. The maternal composite adverse outcome was defined as having 1 or
more of the following: CD, vacuum-assisted delivery, placenta abruption, retained
placenta, gestational diabetes mellitus, pregnancy-induced hypertension,
premature preterm rupture of membranes (PPROM), preterm labor, postpartum
hemorrhage, defined as more than 500 mL of blood loss for a vaginal delivery and
more than 1000 mL of blood loss for a CD [10], and a third- or fourth-degree
perineal laceration. The neonatal composite adverse outcome was defined as having
1 or more of the following: macrosomia (defined as birth weight above 4000 g),
low birth weight (defined as birth weight below 2500 g), 5-minute Apgar score
The data were analyzed using the SPSS 25 package (IBM Corporation, Chicago, IL,
USA). Chi-square tests were used to determine the differences in sociodemographic
factors and pregnancy outcomes between the parity groups. Analysis of variance
(ANOVA) was conducted to test the means of a continuous variable with
Bonferroni’s adjustment and post-hoc testing. Multiple logistic regression
analysis was used to determine the difference in probability of adverse maternal
and neonatal outcome variables between different parity groups after controlling
for confounders including maternal age, induction of labor, epidural anesthesia,
birth weight, and previous CD. p
After excluding nulliparous and grand multiparous women, 1584 deliveries were eligible for analysis and were evaluated, of which 904 (57%) were in their second labor; 499 (31.5%) in their third labor, and 181 (11.5%) in their fourth labor (Fig. 1).
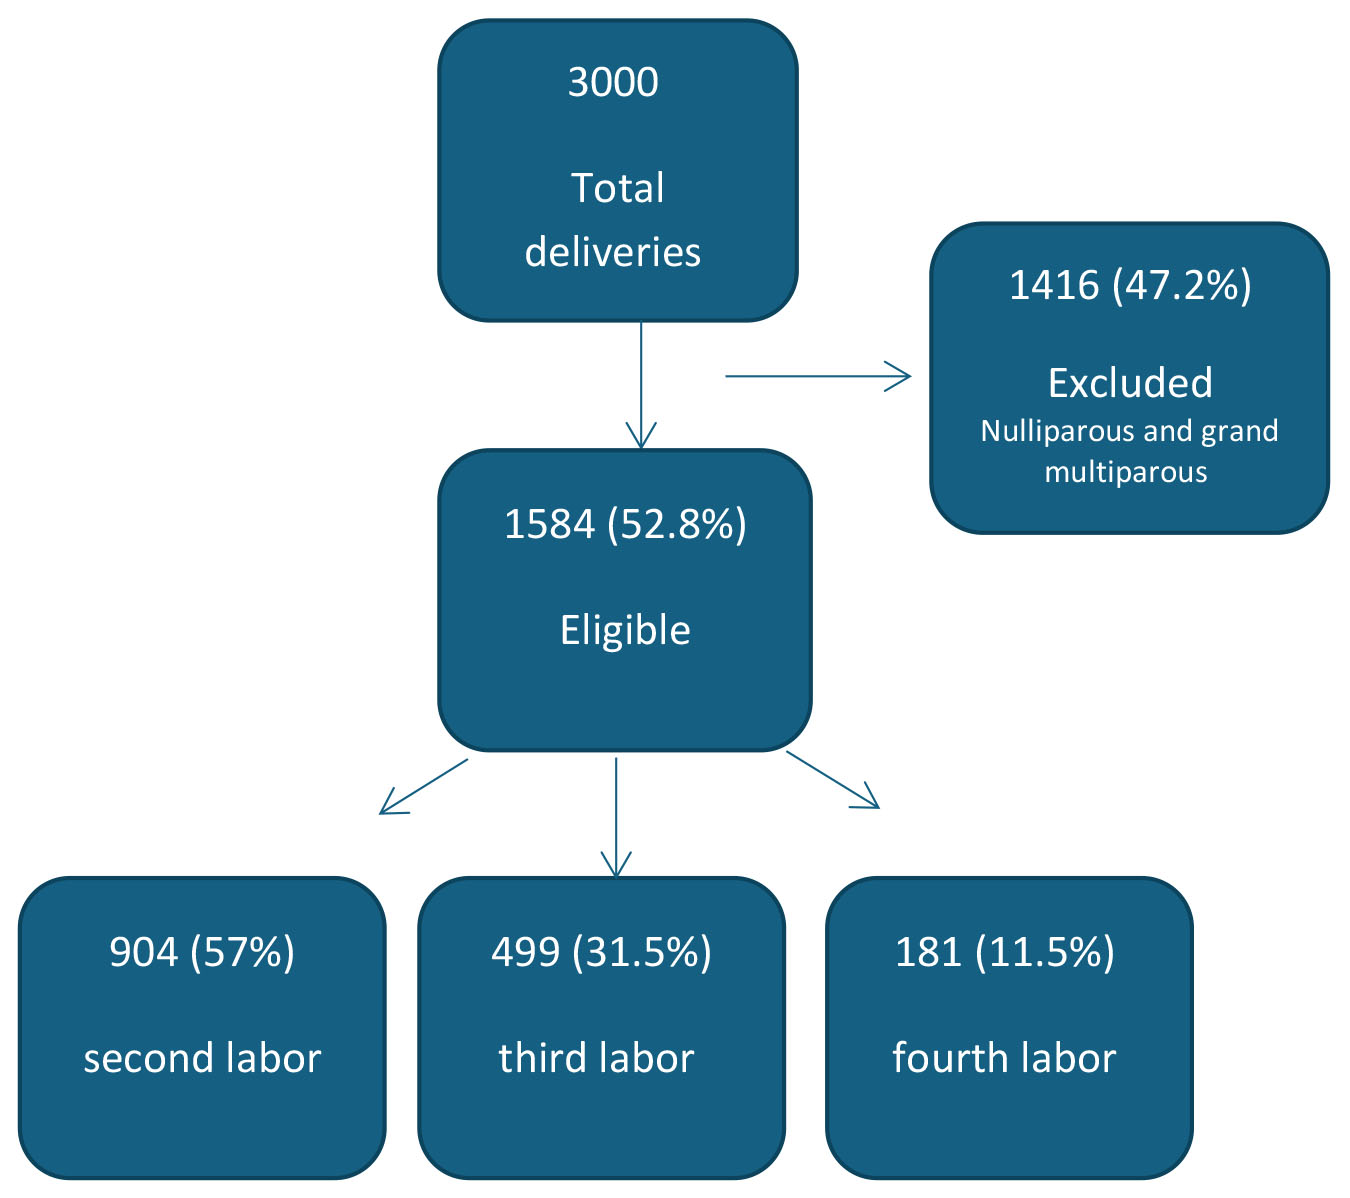 Fig. 1.
Flow chart.
The baseline characteristics of the three groups are presented in Table 1. Women
undergoing their second labor were younger than those in their third or fourth
labors (29.6 vs. 32.3 or 32.7 years, respectively, p
| Variable | Parity 2 (n = 904) | Parity 3 (n = 499) | Parity 4 (n = 181) | p-value |
| Age (years) | 29.6 |
32.3 |
32.7 |
P1,2 |
| Gestational age at birth (weeks) | 39.3 |
39.4 |
39.6 |
0.16 |
| Maternal smoking, n (%) | 2 (0.2%) | 0 | 0 | 1.0 |
| Maternal overweight/obesity, n (%) | 7 (0.8%) | 6 (1.2%) | 2 (1.1%) | 0.71 |
| Epidural analgesia, n (%) | 633 (70.0%) | 297 (59.5%) | 94 (52.0%) | P1,2 |
| Previous cesarean delivery, n (%) | 156 (17.3%) | 52 (10.4%) | 21 (11.6%) | P1 = 0.01; P2 = 0.06; P3 = 0.68 |
Note: Data are presented as mean
P1 = Parity 2 vs. Parity 3; P2 = Parity 2 vs. Parity 4; P3 = Parity 3 vs. Parity 4.
Labor duration was longer in the second labor compared to the third and fourth
labor (8.50 vs. 7.46 or 6.24 hours, respectively, p
| Variable | Parity 2 (n = 904) | Parity 3 (n = 499) | Parity 4 (n = 181) | p-value |
| Labor duration (hours), median [IQR] | 8.50 [4.13–16.29] | 7.46 [3.96–14.40] | 6.24 [3.38–13.33] | P1 = 0.05; P2 = 0.015; P3 = 0.14 |
| Second stage (min), with epidural, median [IQR] | 28.28 [0.14–55.00] | 20.27 [10.00–37.00] | 15.12 [9.00–23.00] | P1 = 0.001; P2 = 0.002; P3 = 0.31 |
| Second stage (min), without epidural, median [IQR] | 13.00 [8.00–27.00] | 10.00 [7.00–21.00] | 7.01 [5.00–13.00] | 0.092 |
Note: Data are presented as median [IQR interquartile range]. IQR, interquartile range.
P1 = Parity 2 vs. Parity 3; P2 = Parity 2 vs. Parity 4; P3 = Parity 3 vs. Parity 4.
Delivery mode and adverse maternal outcomes are presented in Table 3. We found
an association between the level of parity and the mode of delivery. The second
labor was more likely to have a vacuum-assisted delivery (VAD) than the third
labor (5.3% vs. 1.8%, p = 0.001). The second labor was also more
likely to result in a CD than was either the third or the fourth labor (13.2%
vs. 7.8% or 6.1% respectively, p
| Variable | Parity 2 (n = 904) | Parity 3 (n = 499) | Parity 4 (n = 181) | p-value |
| Induction of labor (IOL), n (%) | 315 (34.8%) | 179 (35.9%) | 49 (27.1%) | 0.08 |
| Vacuum-assisted delivery, n (%) | 48 (5.3%) | 9 (1.8%) | 8 (4.4%) | P1 = 0.001; P2 = 0.72; P3 = 0.09 |
| Cesarean delivery, n (%) | 119 (13.2%) | 39 (7.8%) | 11 (6.1%) | P1,2 |
| Preterm delivery, n (%) | 54 (6.0%) | 32 (6.4%) | 11 (6.1%) | 1.00 |
| Postpartum hemorrhage, n (%) | 11 (1.2%) | 9 (1.8%) | 2 (1.1%) | 0.63 |
| Third-/fourth-degree laceration, n (%) | 9 (1.0%) | 0 | 0 | 1.00 |
| PPROM, n (%) | 96 (10.6%) | 46 (9.2%) | 12 (6.6%) | 0.21 |
| Placental abruption, n (%) | 9 (1.0%) | 1 (0.2%) | 0 | 0.10 |
| Retained placenta, n (%) | 2 (0.2%) | 0 | 0 | 0.47 |
| Hypertensive disorders, n (%) | 11 (1.2%) | 7 (1.4%) | 2 (1.1%) | 0.93 |
| Maternal composite outcome*, median [IQR] | 1 [1–2] | 1 [1–2] | 1 [1–2] | 0.48 |
Data are presented as n (%).
P1 = Parity 2 vs. Parity 3; P2 = Parity 2 vs. Parity 4; P3 = Parity 3 vs. Parity 4.
IOL, induction of labor; PPROM, preterm premature rupture of membranes.
* Maternal composite outcome is presented as median [interquartile range], using Chi-square tests, including: vacuum-assisted delivery, cesarean delivery, preterm delivery, postpartum hemorrhage, hypertensive disorder, IOL, high-degree laceration, placental abruption, and retained placenta.
When comparing the three groups, there was no difference in any adverse maternal outcome (Table 3) including placental abruption, postpartum hemorrhage, and a third of fourth-degree genital tract laceration. Moreover, there was no difference in the rates of any of the studied adverse neonatal outcomes between the three groups including macrosomia, low birth weight, shoulder dystocia, umbilical cord pH, and low 5-min Apgar scores (Table 4).
| Variable | Parity 2 (n = 904) | Parity 3 (n = 499) | Parity 4 (n = 181) | p-value |
| Macrosomia, n (%) | 51 (5.6%) | 31 (6.2%) | 13 (7.2%) | 0.71 |
| Low birth weight, n (%) | 38 (4.2%) | 27 (5.4%) | 9 (5.0%) | 0.58 |
| Shoulder dystocia, n (%) | 11 (1.2%) | 6 (1.2%) | 1 (0.6%) | 0.73 |
| Non-reassuring fetal heart rate (NRFHR), n (%) | 46 (5.1%) | 17 (3.4%) | 5 (2.8%) | 0.18 |
| 5-min Apgar score |
12 (1.3%) | 4 (0.8%) | 1 (0.6%) | 0.51 |
| Umbilical cord pH |
30 (3.3%) | 8 (1.6%) | 3 (1.7%) | 0.91 |
| Neonatal composite outcome*, n (%) | 166 (18.4%) | 86 (17.2%) | 30 (16.6%) | 0.78 |
Data are presented as n (%).
NRFHR, non-reassuring fetal heart rate.
* Neonatal composite outcome includes NRFHR, umbilical cord pH
To evaluate the independent contribution of parity to adverse maternal outcomes, we performed a multivariate logistic regression model (the results of which are presented in Table 5). We adjusted for potential confounders including maternal age, induction of labor, epidural anesthesia, birth weight, and previous cesarean delivery. Higher parity was associated with lower rates of vacuum-assisted delivery and CD. The risk for VAD was lower in the third labor compared to the second labor (adjusted odds ratios (aOR): 0.34, 95% confidence interval (CI): 0.16–0.72), and the risk for CD was comparably lower in the third or the fourth labor than in the second labor (aOR: 0.43, 95% CI: 0.27–0.67 and aOR: 0.25, 95% CI: 0.12–0.53; respectively) (Table 5).
| Outcome | Parity 2 (Ref) | Parity 3 | Parity 4 |
| aOR [95% CI] | aOR [95% CI] | ||
| Gestational diabetes (GDM) | 1.00 | 0.73 [0.37–1.43] | 0.89 [0.36–2.16] |
| Hypertensive disorders (PIH) | 1.00 | 0.71 [0.25–2.03] | 0.65 [0.13–3.16] |
| PPROM | 1.00 | 0.87 [0.59–1.28] | 0.63 [0.33–1.19] |
| Postpartum hemorrhage (PPH) | 1.00 | 1.74 [0.69–4.38] | 1.16 [0.25–5.47] |
| Genital tract laceration (3rd/4th degree) | 1.00 | NA | NA |
| Cesarean delivery (CD) | 1.00 | 0.43 [0.27–0.67], p |
0.25 [0.12–0.53], p |
| Vacuum delivery (VD) | 1.00 | 0.34 [0.16–0.72], p = 0.005 | 0.963 [0.426–2.177] |
Data are presented as adjusted odds ratios (aORs) with 95% confidence intervals (CI).
Parity 2 = reference group.
Bold indicates statistically significant results (p
GDM, gestational diabetes mellitus; PIH, pregnancy-induced hypertension; PPH, postpartum hemorrhage; CD, cesarean delivery; VD, vacuum delivery; NA, not available; Ref, reference.
The main findings of this study are that: (1) Women in their second labor are more likely to have longer labor when compared to women in their third or fourth labor. (2) Women during their second labor, with epidural analgesia, tend to have a longer second stage of labor when compared to women in their third or fourth labors. (3) Women in their second labor are at a higher risk for a VAD or a CD than are women in their third or fourth labor. (4) There were no differences in any of the other adverse maternal or neonatal outcomes studied when comparing the second labor with the third or the fourth labor. (5) Maternal and neonatal adverse outcomes were not different between the third and the fourth labors. These findings remained after adjusting for possible confounders.
While previous studies reported only nulliparous and grand multiparous women to be at a greater risk [6, 7, 8, 11, 12] of pregnancy complications, we have found that there are different risks of CD and VAD when comparing women with different numbers of deliveries among the low multiparous group.
One explanation for these findings might be the increased rate of false labor in women in their second labor as opposed to women who delivered two or three times previously and who are more experienced at recognizing the signs of labor [13, 14]. It is possible that physicians may attempt to expedite delivery in cases when these women are admitted in false labor [15, 16]. This may result in higher rates of medical interventions in the second labor when compared to the third or fourth labor [17, 18]. The higher rates of VAD and CD in the second labor when compared to the third and fourth labor, were unlikely attributed to the higher rate of vaginal birth after CD in the second labor group. This was because the multivariate regression model which controlled for rates of previous CD still found a higher risk for CD and VAD in the second labor when compared to the other groups.
We have demonstrated that labor duration, and specifically the second stage of labor with epidural, was longer for women in their second labor versus women in their third or fourth labor. A recent large retrospective study has demonstrated that a longer duration of labor and a longer duration of the second stage are independent risk factors of adverse maternal and neonatal outcomes in multiparous women [19]. According to our study, the second stage of labor progresses at a substantially slower rate than expected in the second labor when compared to the third and fourth labor. This might imply that the labor curves are different for each level of parity, and not only for nulliparous women when compared to multiparous women. Of course, larger prospective studies are needed to introduce changes in the definitions of protraction and arrested labor in these groups.
Another interesting finding in this study is that the fourth labor was similarly safe as the third labor, in terms of risk for composite adverse outcomes including PPH, third- and fourth-degree genital tract laceration, and placenta abruptions. This is of importance since women are increasingly seeking greater choices in the selection of their birthplace, including options with more autonomy and fewer interventions such as home births [20].
According to our study, the fourth labor should not be considered a risk factor. However, the national guidelines for intrapartum care, which were developed by the National Institute for Health and Care Excellence (NICE), include a set of risk factors that provide the basis of a risk classification system, to make recommendations on the place of birth [21]. In these guidelines, the fourth labor is considered a risk factor [21]. Though, a recent large study that aimed to improve the NICE risk classification, found that grouping women initially according to parity and previous mode of birth, and subsequently within these groups according to the presence or absence of specific risk factors, provides better targeting of interventions and risks [22].
The main limitation of our study is its retrospective nature, and the absence of data on patients’ socioeconomic status, possibly masking undetected bias and limiting the ability to adjust for additional confounders. Furthermore, this study’s generalisability may be constrained by its single-center design.
Our study’s primary limitations are its retrospective design and the absence of data on patients’ socioeconomic status, which could conceal bias that goes unnoticed and make it more difficult to account for other variables. Additionally, the single-center design of this study may limit its generalisability.
Nevertheless, our study represents the first large series addressing the differences in pregnancy outcomes when comparing different low levels of multiparity in young patients. Our data support future research based on a large population, designed to evaluate and understand the labor curves as a function of the number of previous deliveries in multiparous women.
Women in their second labor were more likely to have a longer labor duration and longer second stage of labor than women in their third or fourth labor. Moreover, the second labor was associated with a higher risk for CD and VAD than the third or fourth labor. Lastly, there was no difference in the rate of maternal and neonatal complications when comparing the third and the fourth labors.
The datasets used and analyzed during the current study are available from the corresponding author on reasonable request.
EKP—study design, execution and manuscript drafting; MD—manuscript drafting, critical discussion, and interpretation of data for the work; SNH—execution and analysis; TO—statistical analysis and manuscript drafting; DV—study design, execution and manuscript drafting and critical discussion. All authors contributed to editorial changes in the manuscript. All authors read and approved the final manuscript. All authors have participated sufficiently in the work and agreed to be accountable for all aspects of the work.
The study was carried out in accordance with the guidelines of the Declaration of Helsinki. The study was approved by the Bnai-Zion Medical Center-Ethical Committee # 0017-22-BNZ. Because the data set did not contain patient identification information, all women received standard care and it was a retrospective data collection, the study was exempt from informed consent requirements.
Thanks to all the peer reviewers for their opinions and suggestions.
This research received no external funding.
The authors declare no conflict of interest. Michael H. Dahan is serving as Editor-in-Chief of this journal. We declare that Michael H. Dahan had no involvement in the peer review of this article and has no access to information regarding its peer review. Full responsibility for the editorial process for this article was delegated to Liquan Wang of delegated editor.
Publisher’s Note: IMR Press stays neutral with regard to jurisdictional claims in published maps and institutional affiliations.