
- Academic Editor
†These authors contributed equally.
The prognosis of patients with early diagnosis of malignant endometrial lesions is good. We aimed to identify benign and malignant lesions in endometrial tissue, explore effective methods for assisting diagnosis, and improve the accuracy and precision of identifying endometrial lesions.
1142 ultrasound radiomics and 18 clinical features from 1254 patients were analyzed, from which 36 features were selected for machine learning. We sketched the region of interest (ROI) of the abnormalities on the ultrasound images. Then, the radiomics features were extracted. Six common machine learning algorithms, including Support Vector Machine (SVM), Logistic Regression, Decision Tree, Random Forest, Gradient Boosting Tree, and k-Nearest Neighbors, were employed to identify benign and malignant changes in endometrial tissue. Cross-validation and grid search techniques for hyperparameter tuning were utilized to obtain the best model performance. Accuracy, precision, sensitivity, F1-scores, area under the curve (AUC), cross-validation average score and bootstrap average accuracy were also used to evaluate algorithm performance, classification accuracy, and generalization capability.
We combined 21 ultrasound characteristics and 15 clinical characteristics to develop and validate six common machine learning algorithms. After internal validation, the best models were the Random Forest models, with accuracy of 89%, precision of 93%, sensitivity of 97%, F1-score of 95%, and AUC of 95%, as well as a 10-fold cross-validation average score of 95% and bootstrap average accuracy of 94%, implying flawless classification in the test set.
We identified the clinical and ultrasound features in the early diagnosis of benign or malignant lesions in endometrial tissue. And Random Forest model algorithms have demonstrated excellent performance in identifying benign and malignant changes in endometrial tissue. This is significant for enhancing early diagnostic accuracy and improving treatment outcomes and long-term management.
The rising incidence of endometrial cancer, one of the most common types of gynecological malignancies, significantly impacts women’s health [1, 2]. Unfortunately, this disease often presents with subtle or no noticeable symptoms in its early stages, leading many patients to miss the optimal window for treatment, resulting in increased treatment difficulty and decreased survival rates. Therefore, early identification of benign or malignant changes in endometrial tissue is a crucial challenge in clinical practice to reduce patient mortality and improve treatment outcomes.
The diagnostic criteria of endometrial cancer is pathologic finding, which is usually based on endometrial dilatation and curettage or hysteroscopic sampling or hysterectomy biopsy. However, this is an invasive diagnosis and does not reflect the severity of the disease. Some previous studies have identified a lot of non-invasive diagnostic factor for diagnosing suspected endometrial tumors, including demographic features, medical history, tumor biomarkers, ultrasound and magnetic resonance imaging [3, 4, 5]. Transvaginal ultrasound should be utilized as first-line imaging modality, being more available, cost-effective, and more acceptable by patients. And endometrial echogenicity, endometrial–myometrial junction, blood flow signals, ect., have been investigated on ultrasound [6]. Researchers have developed some prediction models to facilitate the early diagnosis of symptomatic patients [7], and to predict endometrial cancer only based on clinical features or ultrasound features [8, 9]. Currently, there is lack of a comprehensive, population-wide predictive model to identify benign and malignant lesions in endometrial tissue integrating of ultrasound features and clinical features.
Radiomics provided a noninvasive method to extract numerous quantitative features from the standard medical images [10]. Then, those features can then be applied in statistical analysis, machine learning, or other analysis [11]. Ultrasound radiomics has been widely used to study in endometrial cancer, including predicting high-risk endometrial cancer and predicting the prognosis of patients with endometrial cancer [12, 13, 14]. Hence, we hypothesized that ultrasound radiomics features could show endometrial cancer heterogeneity and diagnose malignant endometrial lesions.
Machine learning algorithms have recently made remarkable progress in medical diagnosis, becoming powerful tools for assisting clinical decision-making. By learning patterns and features from available data, machine learning algorithms automatically build models for precise disease diagnosis and prediction [11, 15]. Compared to traditional rule-based and statistical methods, machine learning algorithms excel at discovering complex relationships and patterns in data, resulting in higher accuracy and generalization capabilities [16, 17]. Specifically, in endometrial cancer, the application of machine learning has offered notable contributions towards non-invasive diagnostics and prognostication [18]. Such as, Vipul Bhardwaj and colleagues [19] provided a sketch of endometrial cancer in risk factors and diagnostic methods, underscoring machine learning’s potential in endometrial cancer diagnosis and prognosis.
The aim of this study was (1) to identify certain ultrasound features of benign and malignant changes in endometrial tissue and explore effective methods for assisting diagnosis, and (2) to build and validate six algorithms integrated clinical and ultrasound features to identify benign and malignant endometrial lesions and provide scientific evidence for their ability to enhance early diagnostic accuracy.
The dataset used in this study was collected from a medical database and
consists of information from 1254 patients treated between June 1, 2018 and June
1, 2023 at the Central Hospital Enshi Tujia and Miao Autonomous Prefecture,
including 953 benign cases and 301 malignant cases with pathological results of
intrauterine adhesions. The inclusion criteria were: (1) age
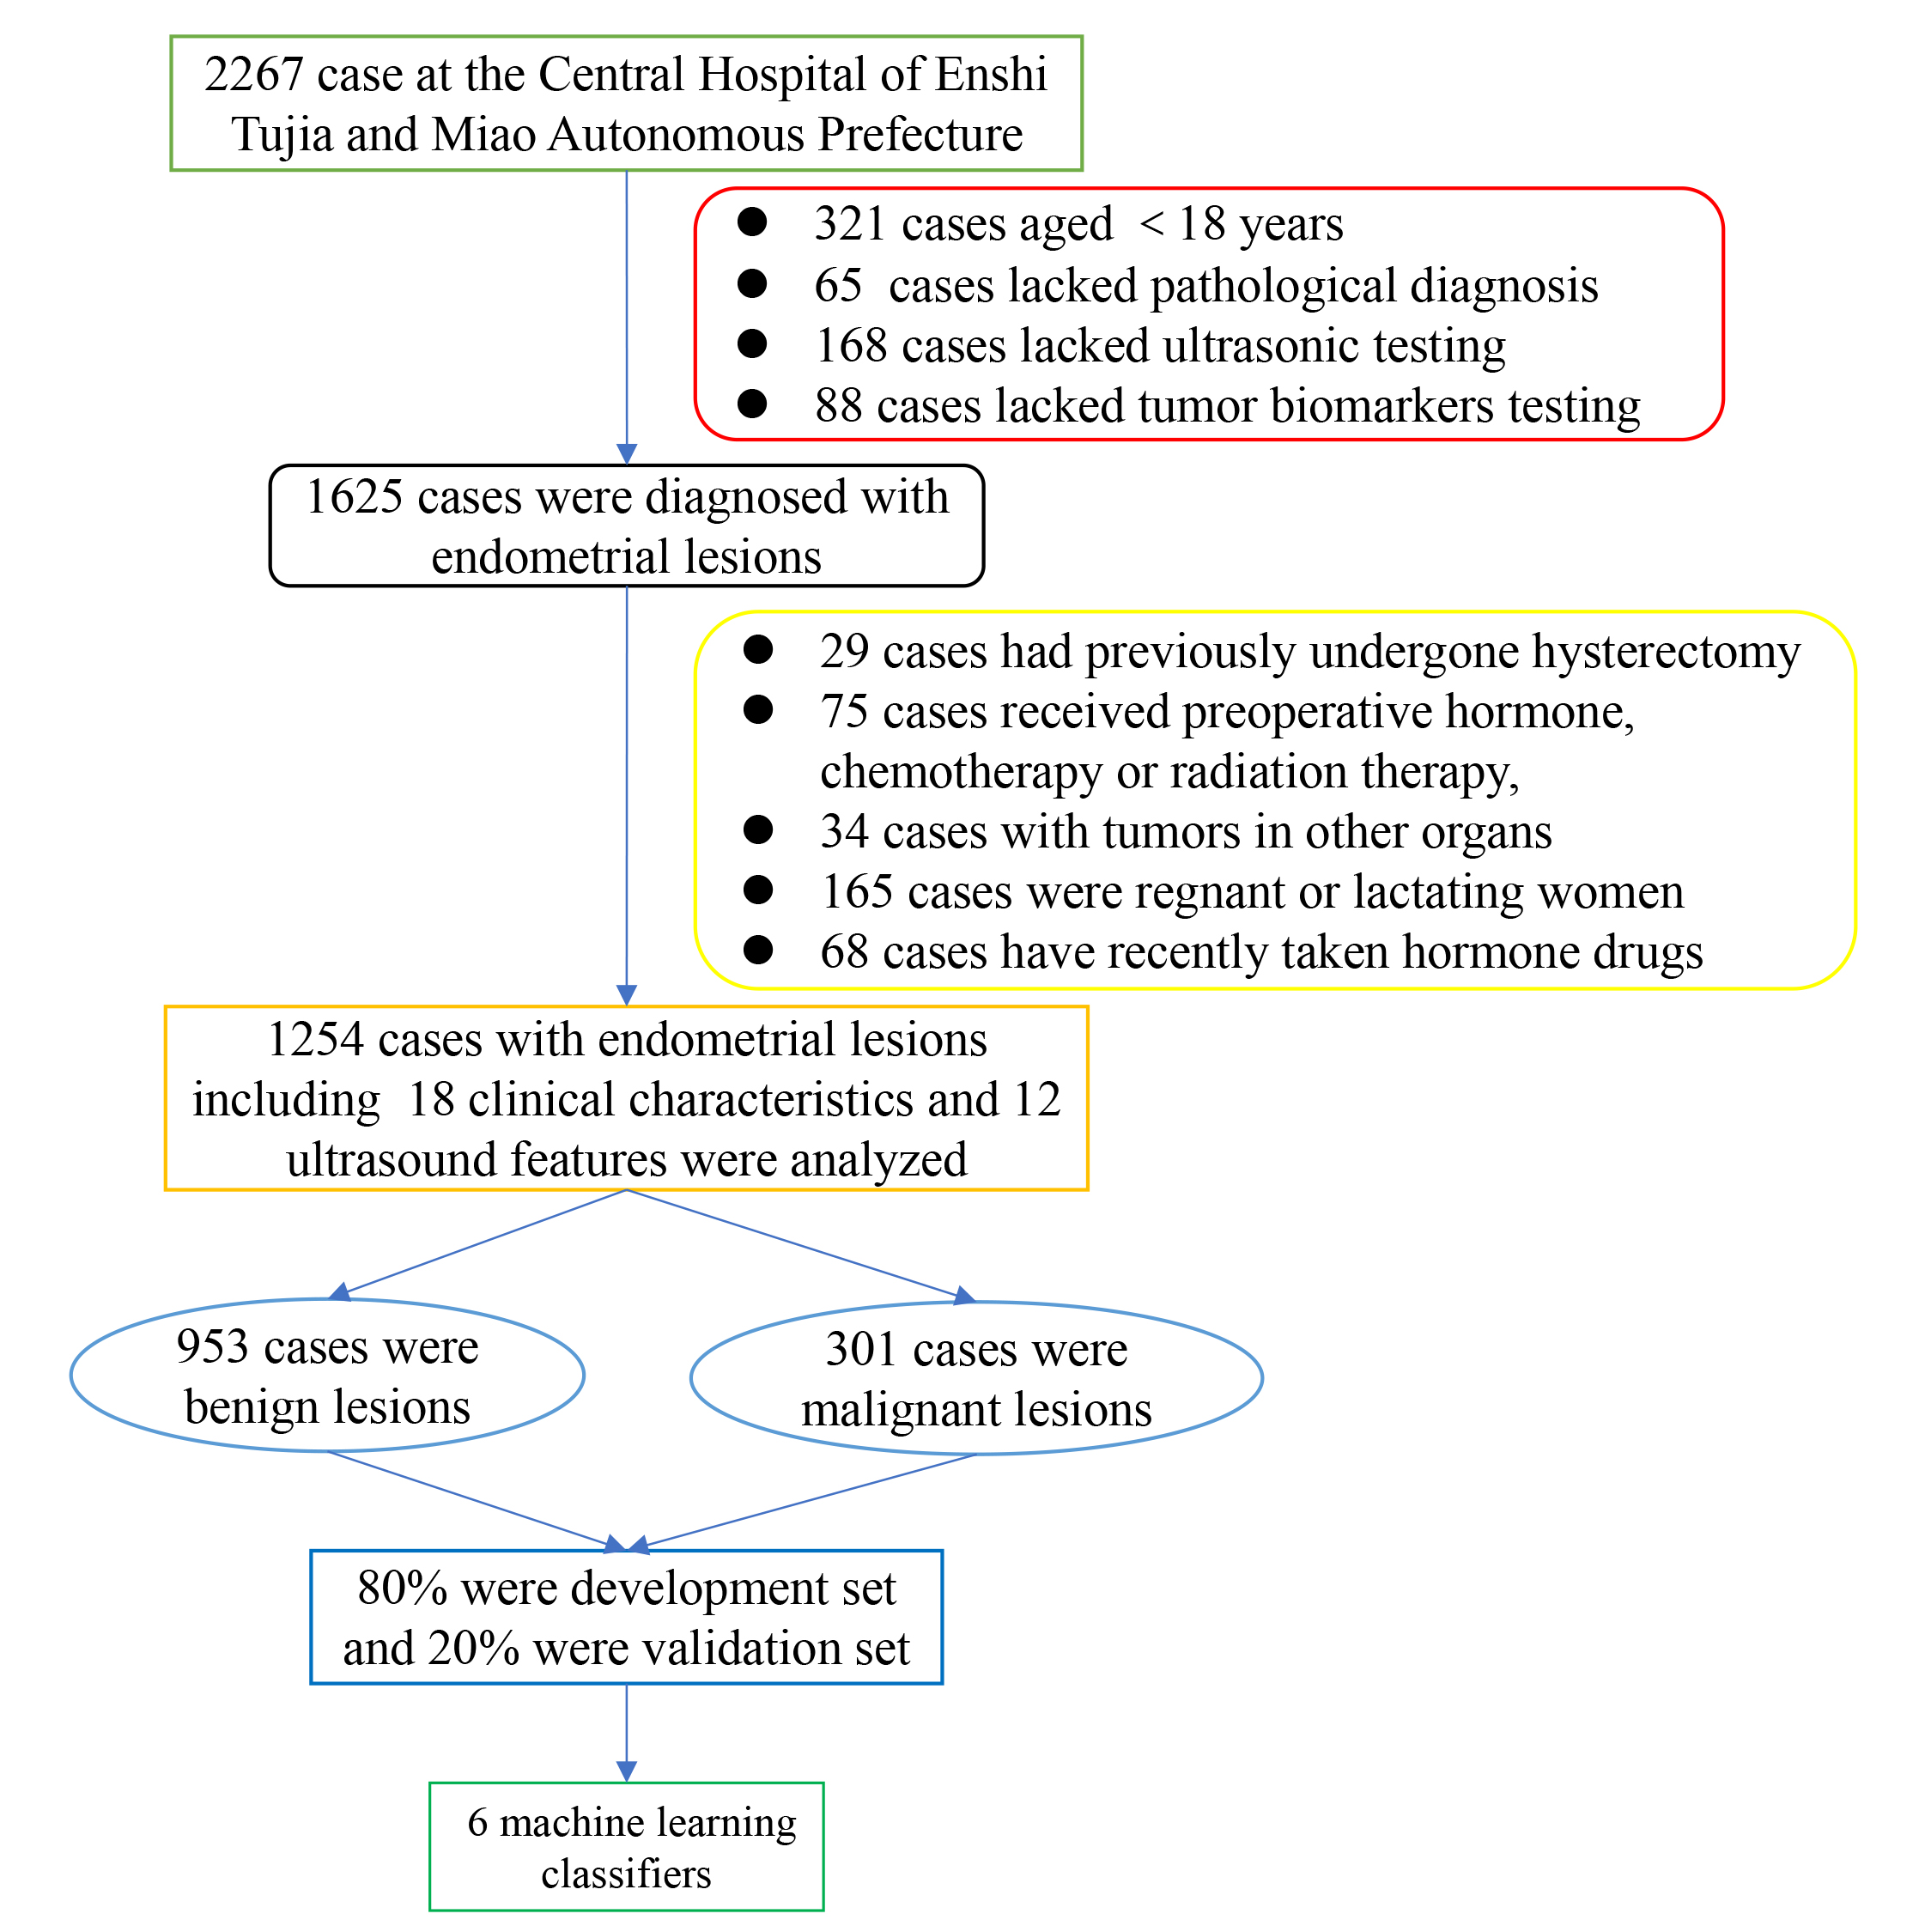 Fig. 1.
Flowchart of patient selection.
After collecting patients’ medical histories, tumor marker examinations and ultrasonic testing, eighteen clinical characteristics including age, body mass index (BMI), gravidity, parity, abortion, breastfeeding status, menopause status, menstrual regularity, irregular bleeding of the vagina, contact bleeding, leucorrhea with blood, hypogastralgia, hypertension, diabetes, CA125, CA15-3, CA19-9 and HE4 [3, 20] and twelve ultrasound features including uniform endometrial echogenicity, endometrial midline appearance, endometrial–myometrial junction, “bright edge”, intracavity fluid, color score, vascular pattern, arterial pulsatility index, resistance index, end-diastolic flow rate, peak flow rate, and average flow rate were included in our study [5, 20]. Especially, regarding the very differences in hormone levels and endometrium appearances of premenopause compared to postmenopause, and menopause status was also taken into consideration [3].
The two-dimensional vaginal ultrasound was performed on all patients according to the international endometrial tumor analysis (IETA) expert consensus recommendation. Ultrasound features for benign and malignant lesions were defined by the IETA [21, 22]. DC-3/DC-3T model ultrasonic instruments (GE, Boston, MA, USA) with a probe frequency of 7.5 MHz were used for vaginal examinations. All ultrasound examinations and measurements were performed by a senior sonographer with 10 years of experience.
Feature selection plays a crucial role in machine learning tasks to reduce the dimensionality of the feature space, improve model generalization, and identify important features related to the target variable [23]. This study adopted feature selection methods based on domain knowledge and statistical analysis [24]. First, based on domain knowledge, features relevant to tumor diagnosis and prediction, such as age, BMI index, medical history, clinical features, and structural ultrasound features, were selected. Second, correlation analysis was performed to calculate the correlation coefficients between each feature and benign/malignant tumors. Selecting features that are significantly correlated with endometrial lesions reduce redundant information and improves model performance.
The ITK-SNAP software (http://www.itksnap.org) was utilized to segment the region of interest (ROI) of lesions. Two sonographers with 10 years of experience manually segmented the ROIs by selecting the most representative the ultrasound image (DICOM format) with the largest solid components. Discrepancies were solved by being re-segmented by a senior sonographer with 20 years of experience. All sonographers were blinded to the specific histopathological type and other futures.
The original ultrasonic images and sketched ROIs images were imported into the A.K. software version 3.0.0 (GE Healthcare, Waukesha, Wisconsin, USA). Then, the original image and ROI images of each patient were automatically matched. We adopted nonlinear intensity transformation on image voxels, Gaussian Laplace filter and eight wavelet transform to obtain high-throughput features. A total of 1130 characteristics of seven categories were extracted: (1) histogram parameters; (2) morphology; (3) gray level co-occurrence matrix (GLCM); (4) gray-level run-length matrix (GLRLM); (5) gray-level size zone matrix (GLSZM); (6) neighboring gray-tone difference matrix (NGTDM), and (7) gray-level dependence matrix (GLDM).
Subsequently, univariate logistic regression analysis was used to select candidate features, and 46 features were included. Then, Person’s rank correlation coefficient was also used to calculate the correlation between features, and one of the features with correlation coefficient greater than 0.9 between any two features was retained, and 27 features were retained. Finally, the least absolute shrinkage and selection operator (LASSO) regression analysis were applied for selection of final features in the training set, and retaining only those with a p value of less than 0.05. Ultimately, a total of 11 ultrasound radiomics features were utilized to establish the models (Fig. 2).
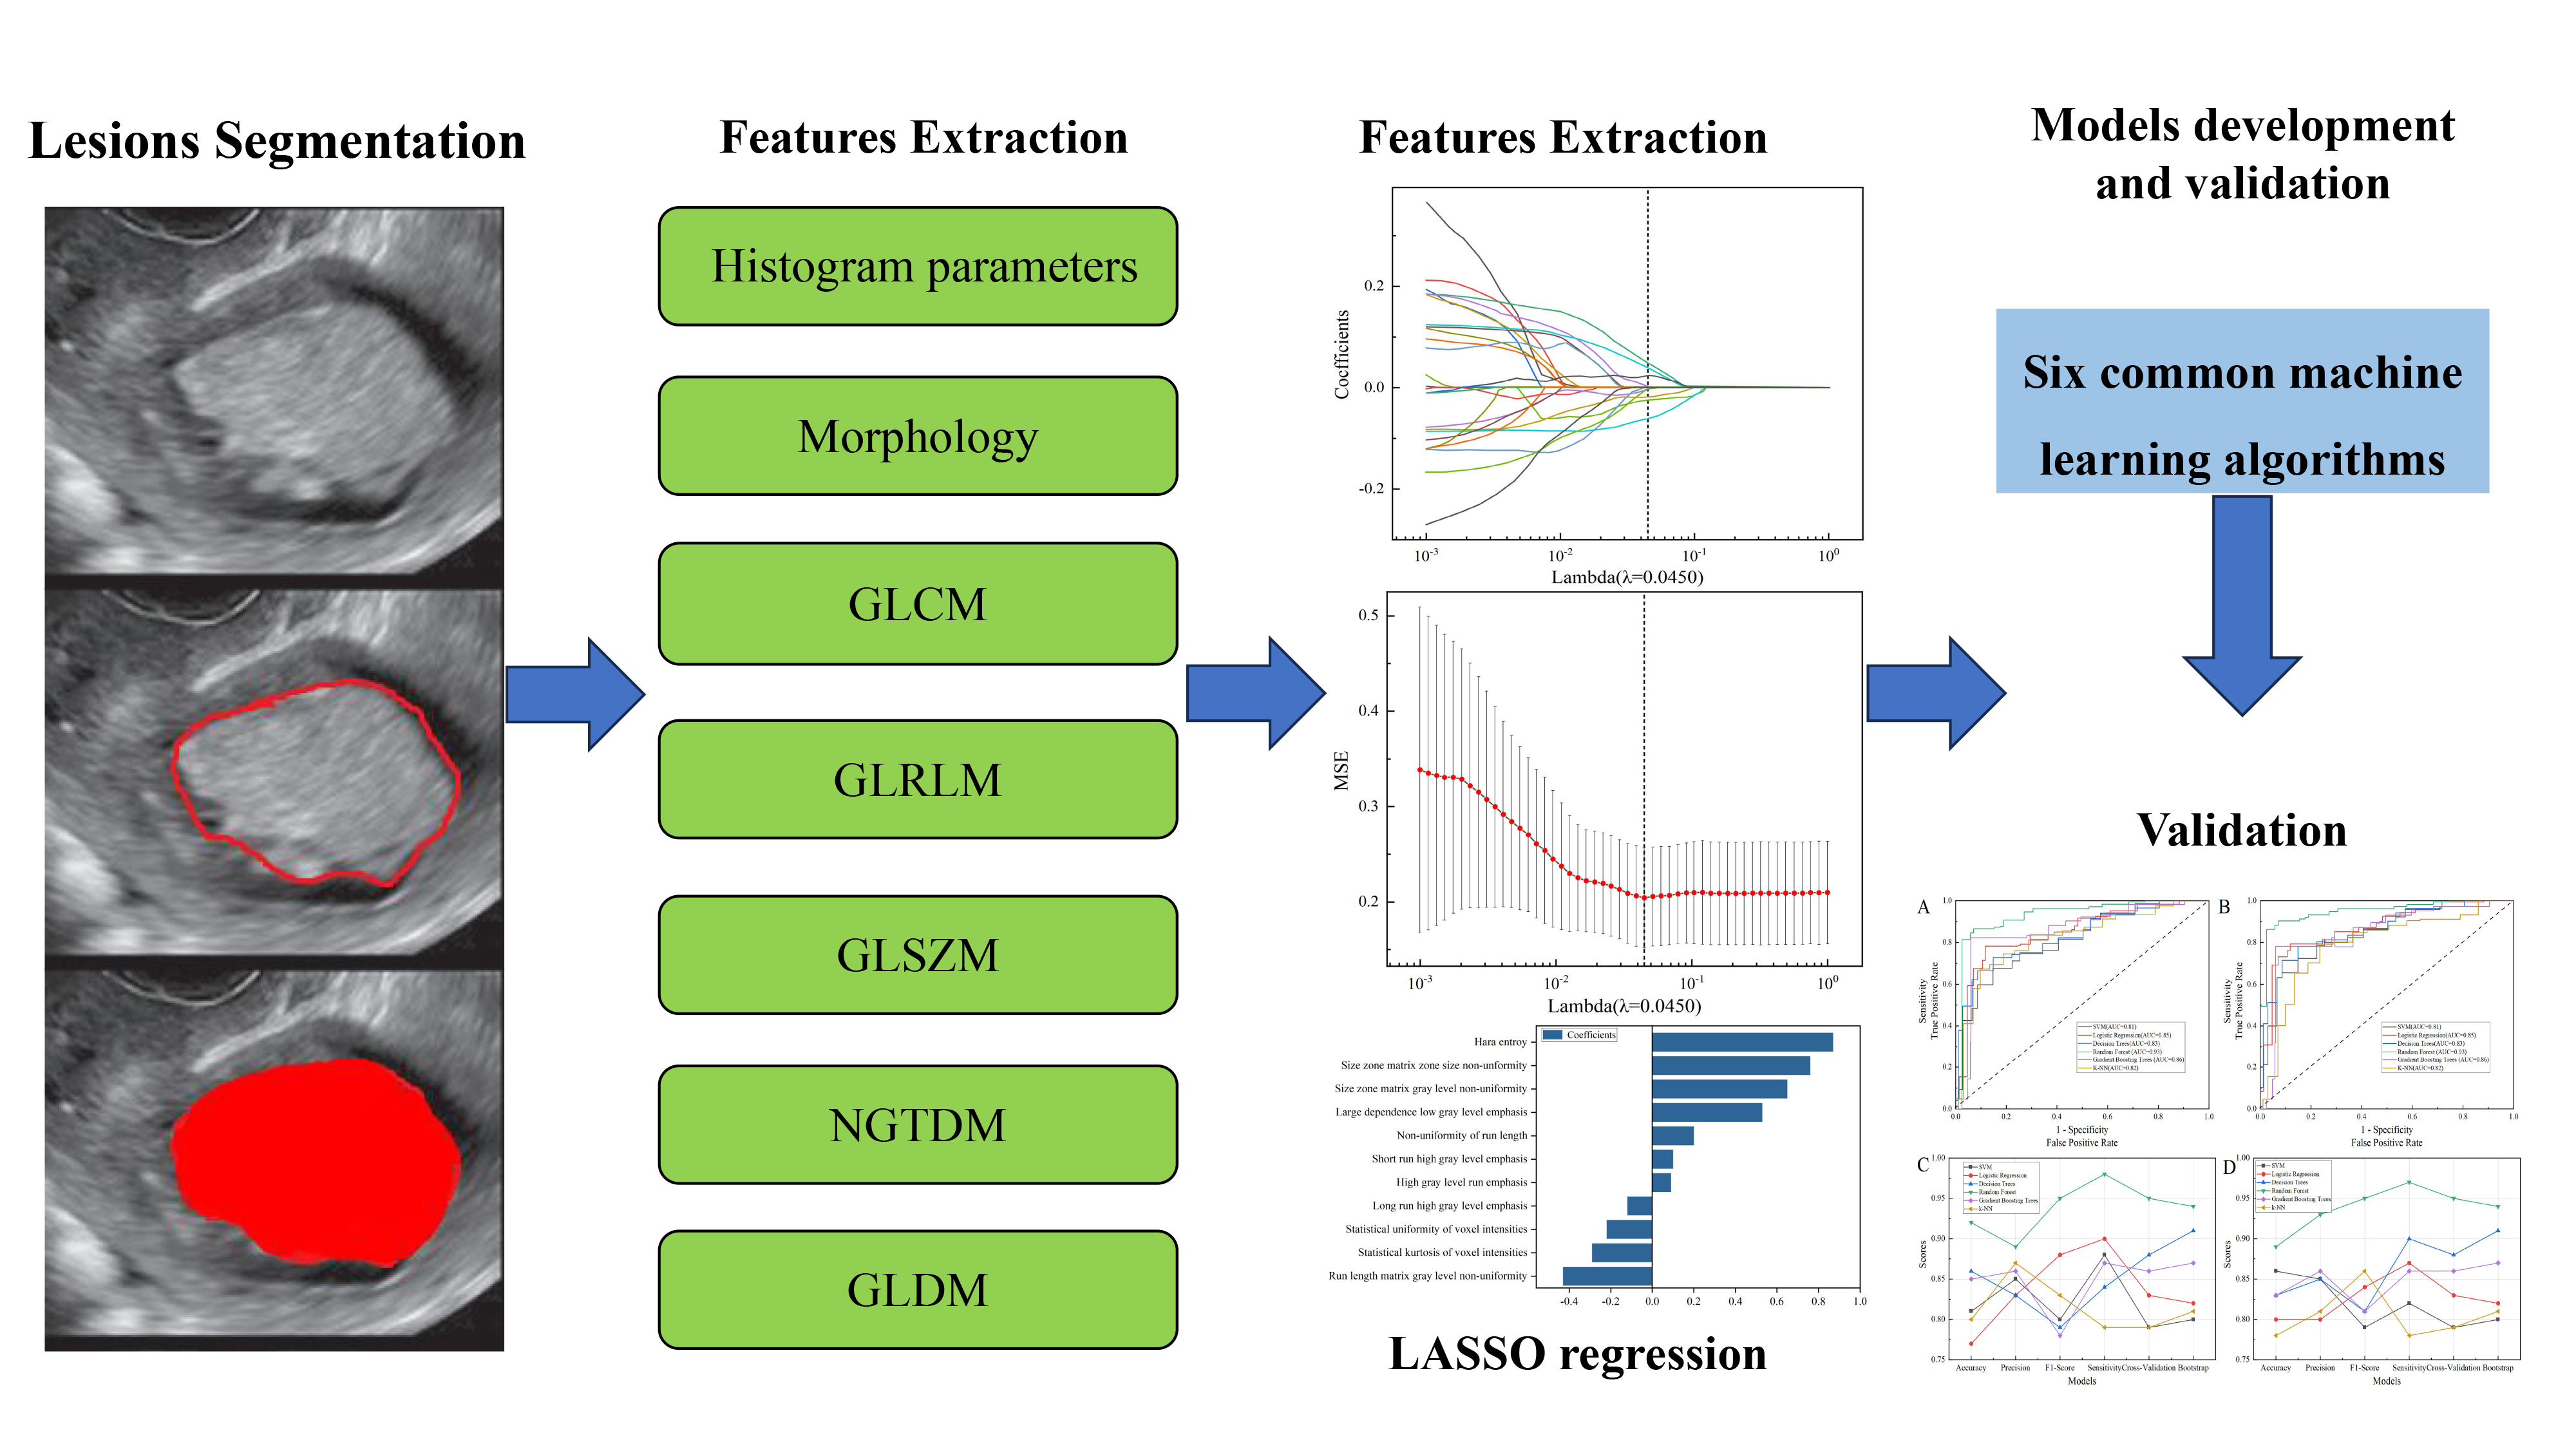 Fig. 2.
Flowchart of ultrasonic image processing. GLCM, gray level co-occurrence matrix; GLRLM, gray-level run-length matrix; GLSZM, gray-level size zone matrix; NGTDM, neighboring gray-tone difference matrix; GLDM, gray-level dependence matrix; LASSO, least absolute shrinkage and selection operator; MSE, mean squared error; SVM, support vector machine; k-NN, k-nearest neighbor.
From the large pool of supervised or unsupervised learning-based classification algorithms available, this study employed six classic machine learning models for training and testing. These models included the Support Vector Machine (SVM), Logistic Regression, Decision Tree, Random Forest, Gradient Boosting Tree, and the k-nearest neighbor (k-NN), all of which are widely used in modeling and classification.
During the model training process, 80% of the benign and malignant groups were randomly selected to make up the training sets, and ten-fold cross-validation was performed. The development sets were randomly divided into ten equal parts, where the nine parts was used to training sets and one part was iteratively excluded for test purposes. The remaining 20% of the groups comprised the validation sets and used grid search to select the best hyperparameter settings [25]. The training dataset was applied to fit the model, while selecting and tuning using the validation set obtained the models’ predictive ability in identifying benign and malignant tumors.
Bootstrap is a resampling method with replacement used to estimate the distribution of sample statistics. Bootstrap average accuracy is the average of accuracies obtained through bootstrap resampling, providing a more robust evaluation of model performance. And cross-validation average score, accuracy, precision, F1-score, sensitivity and area under the curve (AUC) were also used to evaluate performance of our models.
GraphPad Prism software version 9.5 (GraphPad Software Inc., San Diego, CA, USA)
was used for all statistical analyses in this study. Normality was first tested
using the Shapiro-Wilk test. Subsequently, quantitative data was expressed as
mean and interquartile range (IQR). An independent sample t-test
compared normal distributions, and the Mann-Whitney U test was suitable for data
with abnormal distributions. Nevertheless, categorical variables were expressed
as percentages (%). The Chi-square test or Fisher’s exact test was utilized to
compare classification variable data. p
This study included 1254 patients, and the mean age at ultrasonic imaging examination in benign lesions group and malignant lesions group was 39 years (IQR: 38–40 years), 56 (IQR: 54–58 years). Table 1 details clinical variables and demographics. There were 953 (76%) patients with benign lesions, including 451 cases of endometrial polyps, 165 cases of intrauterine adhesions, 145 cases of endometrial simple hyperplasia, 103 cases of endometrial polypoid hyperplasia, 46 cases of endometrial complex hyperplasia, 35 submucous myomas, and 8 cases of endometritis. Additionally, there were 301 (24%) malignant lesions, including 169 cases of endometrioid adenocarcinoma, 63 cases of endometrial atypical hyperplasia, 30 cases of endometrial carcinoma, 14 cases of endometrial infiltrating adenocarcinoma, 10 cases of uterine carcinosarcoma, 10 cases of serous adenocarcinoma of endometrium, 3 cases of endometrial low-grade squamous intraepithelial lesion, and 2 cases of giant cell type high-grade undifferentiated sarcoma of uterus.
| Variate | Benign lesions | Malignant lesions | p value | |
| (N = 953) | (N = 301) | |||
| Age (years) | 39 (38–40) | 56 (54–58) | ||
| Body mass index (BMI) (kg/m2) | 22 (22–22) | 23 (22–24) | ||
| Gravidity (times) | 2 (2–2) | 2 (2–3) | ||
| Parity (times) | 2 (2–2) | 2 (2–2) | ||
| Abortion (times) | 0 (0–0) | 0 (0–1) | 0.004 | |
| Breast feeding | 0.851 | |||
| Yes | 484 (50.79%) | 151 (50.17%) | ||
| No | 469 (49.21%) | 150 (49.83%) | ||
| Menopause status | ||||
| Premenopause | 824 (86.46%) | 125 (41.53%) | ||
| Postmenopaus | 129 (13.54%) | 176 (58.47%) | ||
| Menstrual regularity | 0.001 | |||
| Yes | 522 (54.77%) | 133 (44.19%) | ||
| No | 431 (45.23%) | 168 (55.81%) | ||
| Irregular bleeding of the vagina | ||||
| Yes | 103 (10.81%) | 67 (22.26%) | ||
| No | 850 (89.19%) | 234 (77.74%) | ||
| Contact bleeding | ||||
| Yes | 93 (9.76%) | 62 (20.60%) | ||
| No | 860 (90.24%) | 239 (79.40%) | ||
| Leucorrhea with blood | ||||
| Yes | 78 (8.18%) | 55 (18.27%) | ||
| No | 875 (91.82%) | 246 (81.73%) | ||
| Hypogastralgia | 0.936 | |||
| Yes | 122 (12.80%) | 38 (12.62%) | ||
| No | 831 (87.20%) | 263 (87.38%) | ||
| Hypertension | 0.218 | |||
| Yes | 46 (4.83%) | 20 (6.64%) | ||
| No | 907 (95.17%) | 281 (95.36%) | ||
| Diabetes | 0.039 | |||
| Yes | 27 (2.83%) | 16 (5.32%) | ||
| No | 926 (97.17%) | 285 (94.68%) | ||
| CA125 | ||||
| – | 919 (96.43%) | 271 (90.03%) | ||
| + | 34 (3.57%) | 30 (9.97%) | ||
| CA15-3 | ||||
| – | 916 (96.12%) | 264 (87.71%) | ||
| + | 37 (3.88%) | 37 (12.29%) | ||
| CA19-9 | ||||
| – | 919 (96.43%) | 258 (85.71%) | ||
| + | 34 (3.57%) | 43 (14.29%) | ||
| HE4 | ||||
| – | 905 (94.96%) | 267 (88.70%) | ||
| + | 48 (5.04%) | 34 (11.30%) | ||
p
The database comprises 1160 features belonging to four different categories: 18 features from demographic features, 12 features from structural ultrasound features, and 1130 ultrasound radiomics features extracted from A.K. software. Finally, 36 features were selected to build six models, including 15 clinical variables and demographics features including age, BMI, gravidity, parity, abortion, menopause status, menstrual regularity, irregular bleeding of the vagina, contact bleeding, leucorrhea with blood, diabetes, CA125, CA15-3, CA19-9, and HE4 (Table 1), and 10 structural ultrasound features including uniform endometrial echogenicity, endometrial–myometrial junction, intracavity fluid, color score, vascular pattern, arterial pulsatility index, resistance index, end diastolic flow rate, peak flow rate, and average flow rate (Table 2), and 11 ultrasound radiomics features of large dependence low gray level emphasis, non-uniformity of run length, size zone matrix gray level non-uniformity, statistical kurtosis of voxel intensities, statistical uniformity of voxel intensities, run length matrix gray level non-uniformity hara entroy, high gray level run emphasis, long run high gray level emphasis, size zone matrix zone size non-uniformity and short run high gray level emphasis after the univariate logistic regression, Person’s rank correlation coefficient and LASSO regression analysis (Table 3 and Fig. 3). Table 2 details the structural ultrasound features, and the details of ultrasonographic radiomics features were shown in Table 3.
| Variate | Benign lesions | Malignant lesions | p value | |
| Total | 953 | 301 | ||
| Uniform endometrial echogenicity | ||||
| Yes | 94 (9.86%) | 6 (1.99%) | ||
| No | 859 (90.14%) | 295 (98.01%) | ||
| Endometrial midline appearance | 0.580 | |||
| Linear | 264 (27.70%) | 90 (29.91%) | ||
| Non–linear | 201 (21.09%) | 65 (21.59%) | ||
| Irregular | 243 (24.50%) | 65 (21.59%) | ||
| Not defined | 245 (25.71%) | 81 (26.91%) | ||
| Endometrial–myometrial junction | ||||
| Regular | 859 (90.14%) | 84 (27.91%) | ||
| Irregular | 19 (1.99%) | 6 (1.99%) | ||
| Interrupted | 42 (4.41%) | 137 (45.51%) | ||
| Not defined | 33 (3.46%) | 74 (24.59%) | ||
| “bright edge” | 0.378 | |||
| Yes | 463 (48.58%) | 155 (51.50%) | ||
| No | 490 (51.42%) | 146 (48.50%) | ||
| Intracavity fluid | 0.022 | |||
| No fluid | 859 (90.14%) | 254 (84.39%) | ||
| Anechoic echogenicity | 29 (3.04%) | 16 (5.32%) | ||
| Ground glass | 33 (3.46%) | 20 (6.64%) | ||
| “Mixed” echogenicity | 32 (3.36%) | 11 (3.65%) | ||
| Color score | ||||
| 1 point | 423 (44.39%) | 39 (12.96%) | ||
| 2 points | 391 (41.03%) | 44 (14.63%) | ||
| 3 points | 132 (13.85%) | 31 (10.30%) | ||
| 4 points | 6 (0.63%) | 137 (45.51%) | ||
| Vascular pattern | ||||
| No flow | 239 (25.08%) | 2 (0.66%) | ||
| Single vessel (without branching) | 274 (28.75%) | 8 (2.66%) | ||
| Single vessel (with branching) | 124 (13.01%) | 31 (10.30%) | ||
| Scattered vessels | 150 (15.74%) | 62 (20.60%) | ||
| Circular vessels | 139 (14.59%) | 26 (8.64%) | ||
| Multiple vessels (focal origin) | 18 (1.89%) | 81 (26.91%) | ||
| Multiple vessels (multifocal origin) | 9 (0.94%) | 91 (30.23%) | ||
| Arterial pulsatility index (PI) | 0.90 (0.87–0.92) | 0.31 (0.28–0.33) | ||
| Resistance index (RI) | 0.60 (0.59–0.61) | 0.27 (0.24–0.28) | ||
| End diastolic flow rate (EDV), cm/s | 8.40 (8.05–8.68) | 17.33 (17.20–17.63) | ||
| Peak flow rate (PSV), cm/s | 20.43 (20.18–20.73) | 23.52 (23.12–23.91) | ||
| Average flow rate (VM), cm/s | 13.44 (13.31–13.59) | 20.24 (19.85–20.36) | ||
p
| Variables | p value |
| Large dependence low gray level emphasis | |
| Non-uniformity of run length | 0.035 |
| Size zone matrix gray level non-uniformity | |
| Statistical kurtosis of voxel intensities | 0.012 |
| Statistical uniformity of voxel intensities | 0.022 |
| Run length matrix gray level non-uniformity | 0.033 |
| Hara entroy | |
| High gray level run emphasis | |
| Long run high gray level emphasis | 0.041 |
| Size zone matrix zone size non-uniformity | |
| Short run high gray level emphasis | 0.018 |
p
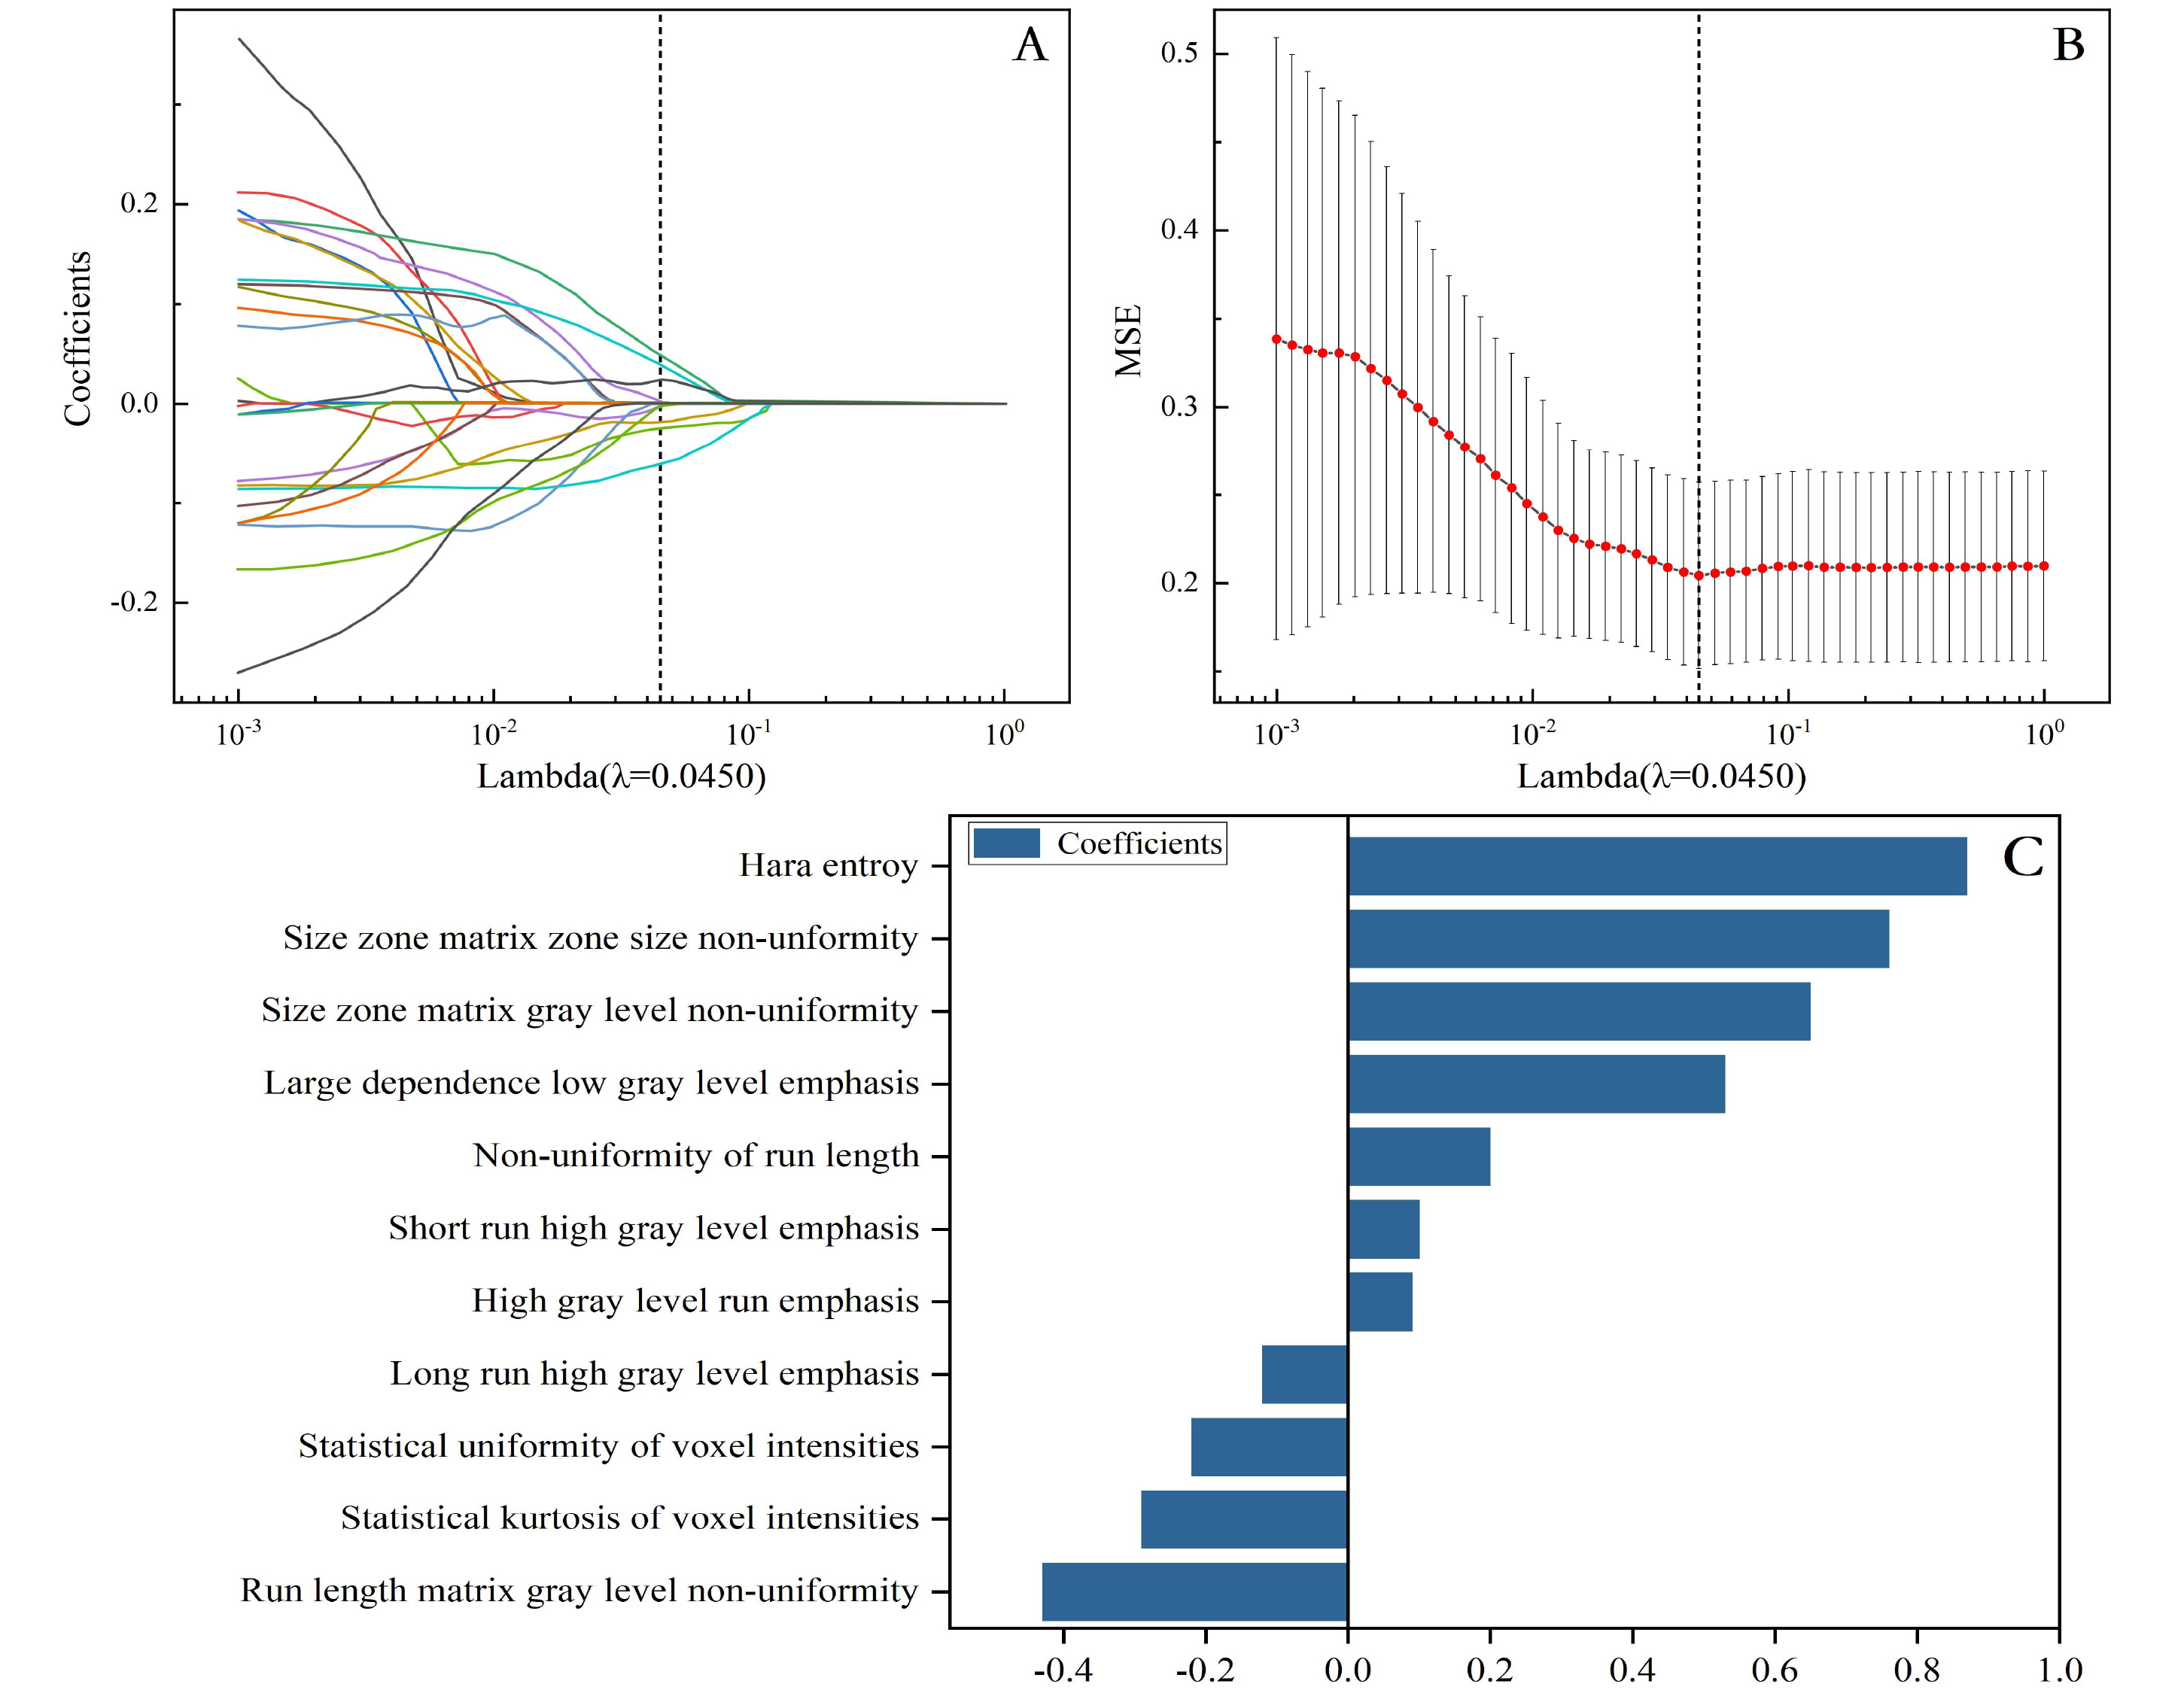 Fig. 3.
Radiomic feature selection based on LASSO algorithm. Ten-fold cross-validation coefficients and MSE (A,B). The final features included the prediction model (C). MSE, mean squared error.
Six different machine learning models were established to identify benign and malignant changes in endometrial tissue, including SVM, Logistic Regression, Decision Tree, Random Forest, Gradient Boosting Tree, and k-NN. Our results showed that the accuracy of these six models were 86%, 80%, 83%, 89%, 83% and 78%, respectively (Table 4), and the Random Forest model perform best. Besides, the Random Forest models also achieved perfect compared to other six models with precision of 93%, sensitivity of 97%, F1-score of 95%, and AUC of 95%, as well as a 10-fold cross-validation average score of 95% and bootstrap average accuracy of 94%, implying flawless classification in the test set, which means Random Forest classifier can be comprehensive and applicable to identify malignant changes in endometrial tissue. Table 4 and Fig. 4 showcase the results of the performance metrics.
| Models | Acc | Pre | F1 Score | Sen | AUC | Cross-Validation Avg Score | Bootstrap Validation Accuracy | |
| SVM | Training | 81% | 85% | 80% | 88% | 81% | 79% | 80% |
| Test | 86% | 85% | 79% | 82% | 84% | |||
| Logistic Regression | Training | 77% | 83% | 88% | 90% | 85% | 83% | 82% |
| Test | 80% | 80% | 84% | 87% | 87% | |||
| Decision Trees | Training | 86% | 83% | 79% | 84% | 83% | 88% | 91% |
| Test | 83% | 85% | 81% | 90% | 86% | |||
| Random Forest | Training | 92% | 89% | 95% | 98% | 93% | 95% | 94% |
| Test | 89% | 93% | 95% | 97% | 95% | |||
| Gradient Boosting Trees | Training | 85% | 86% | 78% | 87% | 86% | 86% | 87% |
| Test | 83% | 86% | 81% | 86% | 85% | |||
| k-NN | Training | 80% | 87% | 83% | 79% | 82% | 79% | 81% |
| Test | 78% | 81% | 86% | 78% | 79% |
Avg, average; Acc, accuracy; Pre, precision; Sen, sensitivity; AUC, area under the curve; SVM, support vector machine; k-NN, k-nearest neighbor.
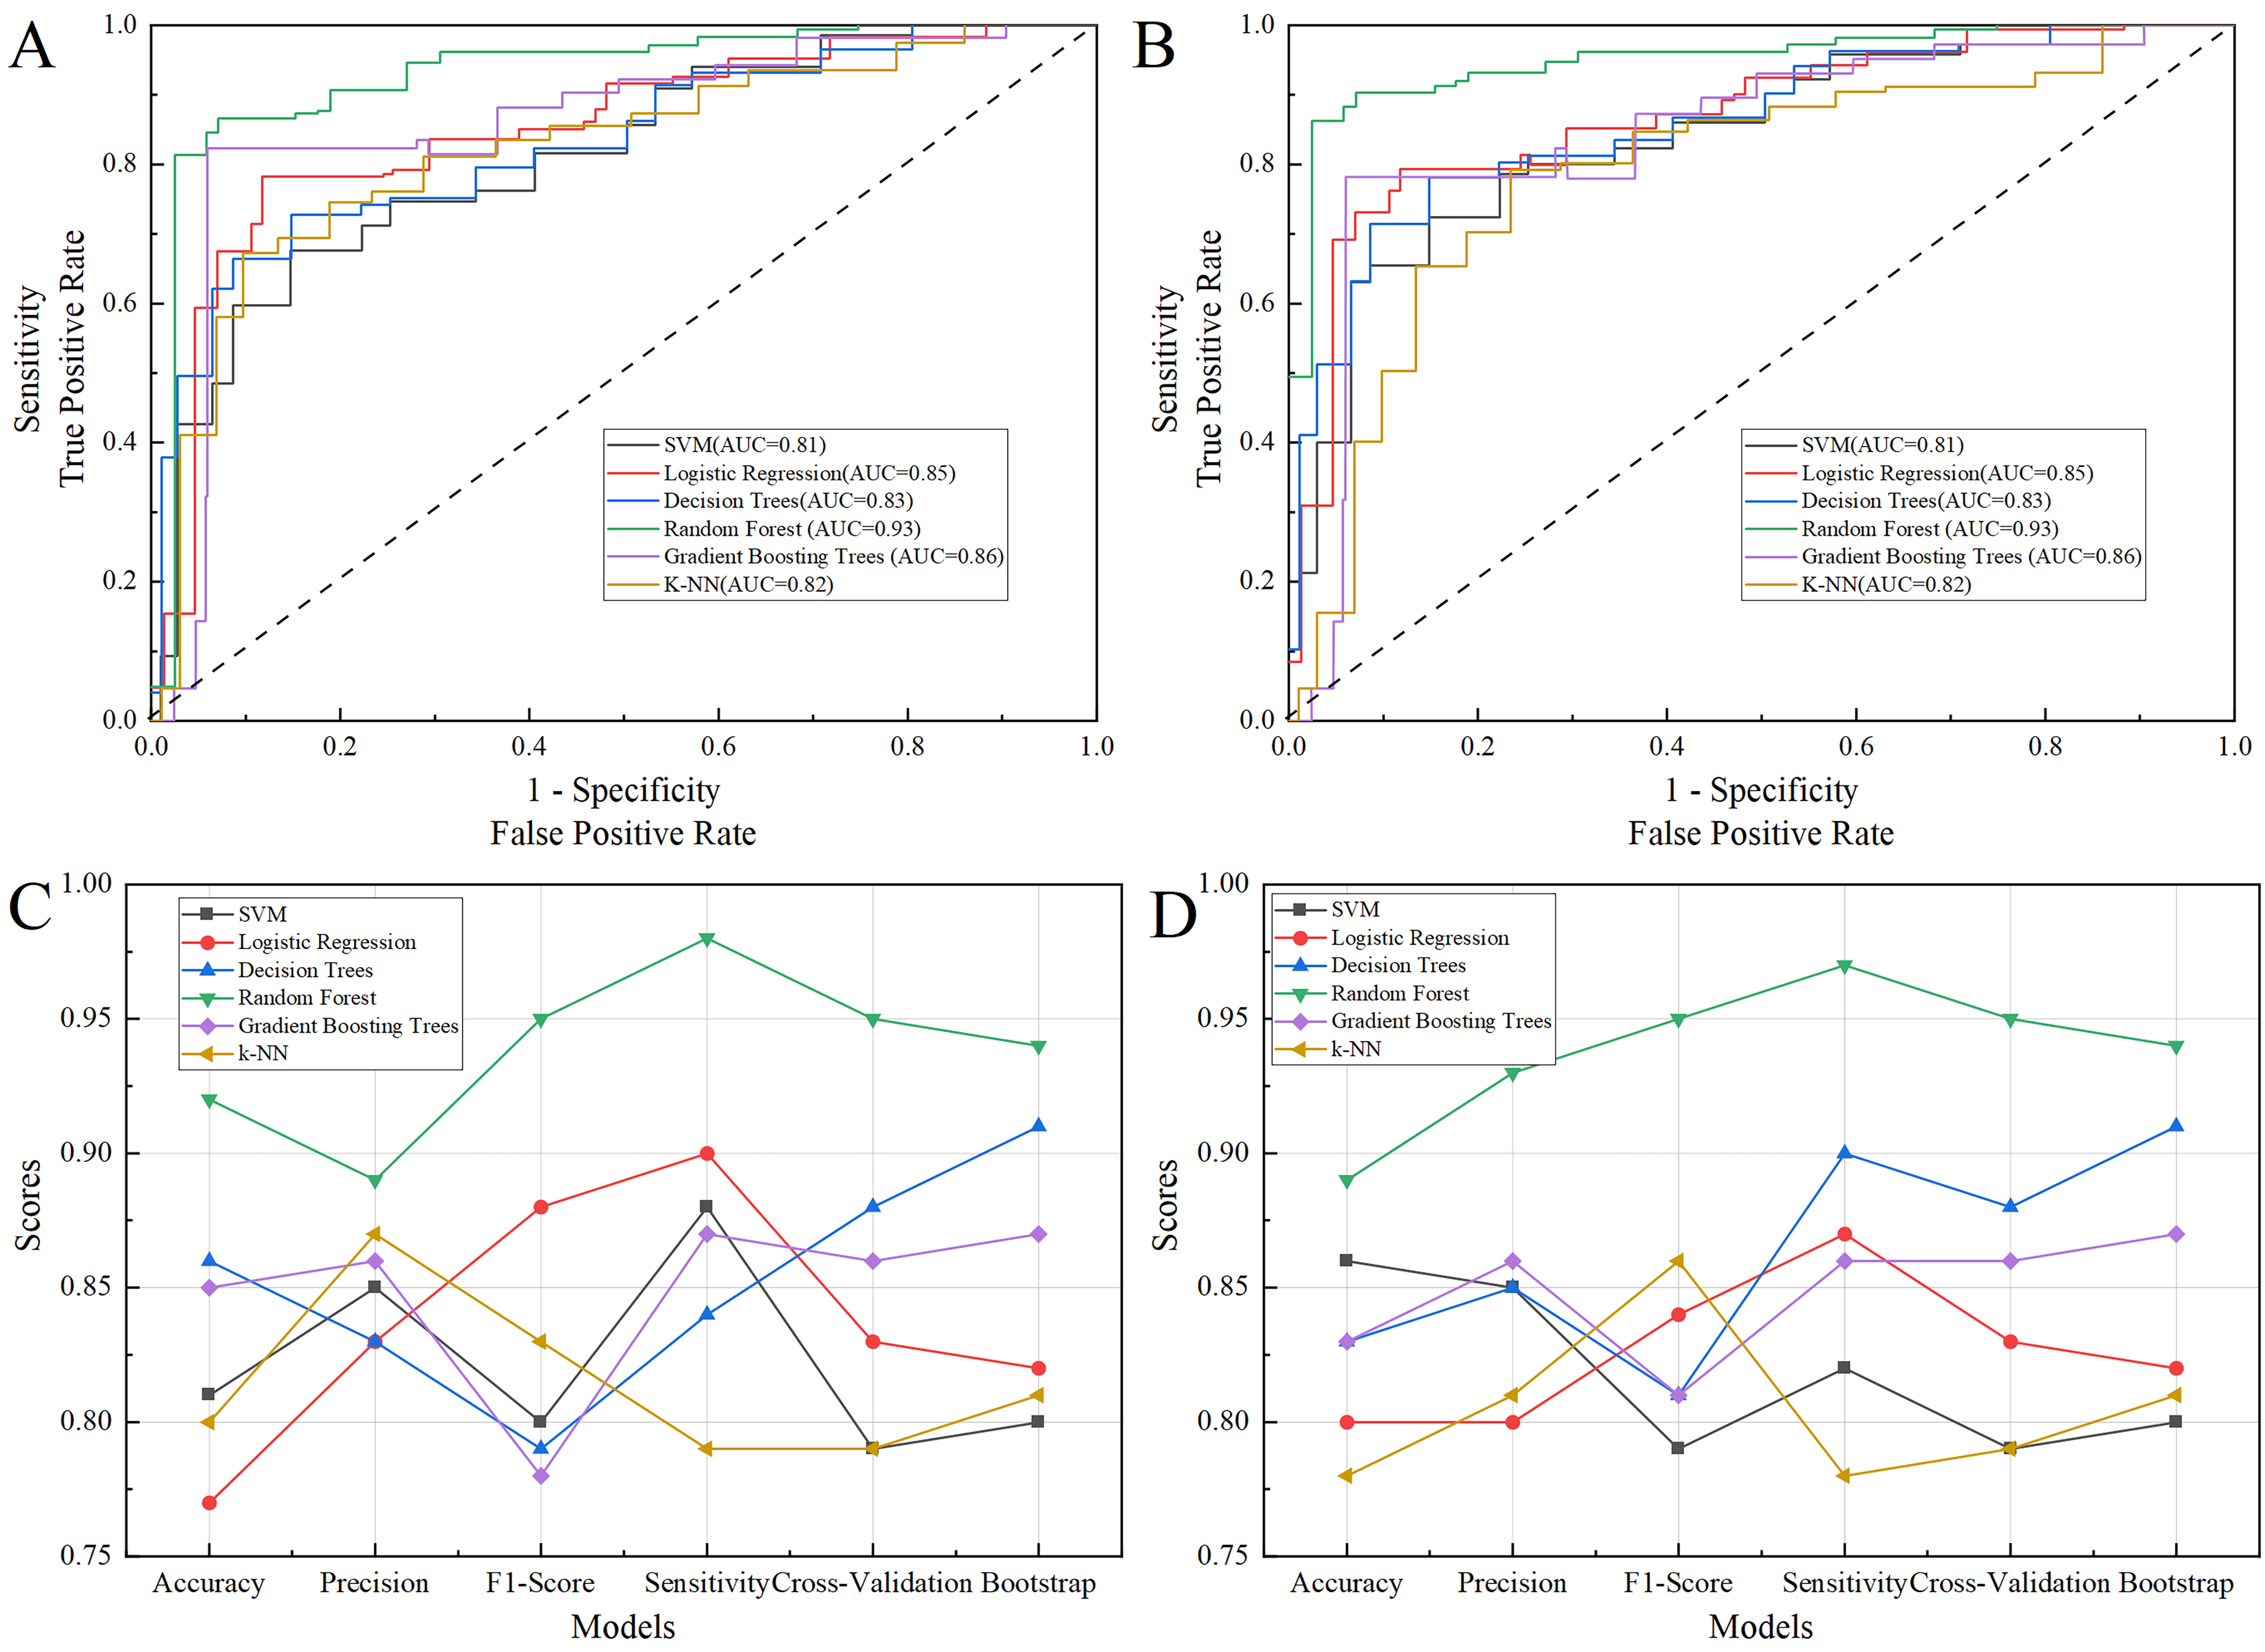 Fig. 4.
The performance of six machine learning models of accuracy, precision, sensitivity, F1 Score, AUC, as well as a cross-validation average score and bootstrap validation accuracy. (A) The ROC of training set. (B) The ROC of test set. (C) The performance of six machine learning models in training set. (D) The performance of six machine learning models in test set. AUC, area under the curve; ROC, receiver operator characteristic curve; SVM, support vector machine; k-NN, k-nearest neighbor.
In this study, we first extracted ultrasound radiomics features, and found models that cooperated radiomics features with clinical parameters improved the accuracy and precision of identifying endometrial lesions. Then, six common machine learning algorithms were built and validated, including SVM, Logistic Regression, Decision Tree, Random Forest, Gradient Boosting Tree, and k-NN, to identify benign and malignant changes in endometrial tissue. And Random Forest model algorithms demonstrated excellent performance in identifying benign and malignant changes in endometrial tissue. The model provided an important reference for improving accuracy of early diagnosis and treatment effects of endometrial cancer.
This innovative research addresses the need for early diagnosis and the application of machine learning algorithms to distinguish benign and malignant endometrial lesions. The potential of these algorithms to enhance clinical diagnosis and treatment decisions is significant, offering new opportunities to revolutionize medical practice and improve women’s health outcomes. By exploring and comparing the performance of various machine learning models, this study seeks to provide valuable insight for the medical community, ultimately paving the way for more precise and effective management of endometrial cancer. Previous studies have explored ultrasound diagnosis of endometrial malignant lesions, but failed to extract radiomics features [3, 20]. And another study developed and evaluated various machine learning model utilizing non-invasive clinical parameters for the classification of endometrial non-benign lesions in postmenopausal women, and the Random Forest demonstrated superior recognition capabilities compared to other models [26]. However, the radiomics features were not included. Clinical and demographic characteristics can also be used in assisting diagnosis. The clinical risk factors for malignancy in our study were retrospective. A systematic review of published literature associated these clinical risk factors with endometrial malignancy lesions based on different study populations, sample sizes, and demographic characteristics [9, 27]. For example, Friberg et al. [28] conducted a meta-analysis including sixteen studies and found that diabetes was associated with an increased risk of endometrial cancer (relative risk [RR] 2.10, 95% confidence interval [CI] 1.75–2.53). Additionally, recent study suggests obesity is an independent predictor of endometrial cancer. The occurrence of endometrial carcinoma in women with a BMI greater than 30 kg/m2 was four times higher than in normal women [9].
Ultrasound plays a significant role in the field of obstetrics and gynecology, especially in endometrial tissues. The transvaginal ultrasound examination is noninvasive, cheap, effective, well-tolerated, and can be widely used in clinical practice, and the anatomical characteristics and blood flow signals can be comprehensively scanned [29]. Our study extracted the structural and blood flow signal ultrasound features and ultrasoundbased radiomics features. Structural ultrasound features (e.g., endometrial midline appearance: non-linear and no “bright edge” sign) reflect the lesion structure well, while blood flow parameters assess the myometrial invasion [3, 30, 31]. Ultrasound radiomics features reflecting the texture information and intra-lesion homogeneity marker of the lesions, have been demonstrated to be closely related to genetic and biological features of the lesions [32]. Ultrasound radiomics has been widely used in the field of cancer, including endometrial cancer [12, 13, 32]. An European multicenter study [12] shown that radiomics have some ability to predict high-risk endometrial cancer, and developed and external validated a clinical-ultrasound radiomics model for discriminating high-risk and low-risk endometrial cancers from other endometrial cancers. Huang et al. [13] established a nomogram integrating ultrasound radiomics features and clinical parameters for predicting the prognosis of patients with endometrial cancer. Therefore, our study tentatively explored building a comprehensive prediction model by integrating multi-modal, multi-dimensional, and comprehensive data.
In clinical applications, machine-learning algorithms offer vast potential for identifying benign and malignant lesions of endometrial cancer. They can assist clinicians in early diagnosis and improve accuracy and precision while reducing misdiagnoses and missed diagnoses [33]. Particularly, the Random Forest model may show superior performance in distinguishing complex benign and malignant lesions. Furthermore, machine-learning algorithms have broad applications in the diagnosis, prediction, and treatment decisions associated with other gynecological diseases [34]. For instance, they can be used in the early detection and prediction of gynecological malignancies such as breast and ovarian cancers, providing personalized treatment plans [35].
Although this study demonstrated excellent performance in benign and malignant lesion identification in endometrial cancer, there are potential biases and limitations. First, this is a large sample, single-center study, thus, multicenter and external validation is needed. Second, pathological diagnosis is still the gold standard, however, more features need to be incorporated to build a comprehensive model in early stage, especially using MRI. Third, data quality and sample size are crucial for the diagnosability of machine learning algorithms. Additionally, the interpretability of the algorithms remains a concern, as the black-box models’ (e.g., SVM) decision-making process is difficult to explain, potentially limiting their use in clinical applications [36].
Future improvement methods and research directions should include a multicenter study, optimizing data preprocessing, a larger sample size and external validation to ensure the quality and balance of data. Second, further feature selection and extraction methods can be explored, and domain knowledge should be incorporated to enhance feature representation. Finally, deep-learning methods to discover more complex features and patterns from large-scale data, research on model interpretability, and reliable support for algorithmic clinical decision-making should be considered.
In conclusion, our study identified clinical features, structural ultrasound features and ultrasound radiomics features from malignant endometrial lesions, and built multiple machine learning algorithms based on this data. Based on our internal validation result, the best models were the Random Forest models. Thus, we suggest using the Random Forest models that combine clinical and ultrasound features, which could significantly improve early diagnosis accuracy and assist clinical decision-making in clinical practice.
The datasets analyzed during the current study are available from the corresponding author on reasonable request.
SSL, JLW and JH designed the study and acquired the data. LZ, JLW, HW and QXA analyzed ultrasound recordings. SSL worked on clinical preprocessing and machine learning process and drafted the manuscript. XYW analyzed and interpreted the data. XYW, JH and QXA revised the manuscript. All authors revised this draft, read, and approved the final manuscript. All authors have participated sufficiently in the work and agreed to be accountable for all aspects of the work.
The study was conducted in accordance with the Declaration of Helsinki, and the protocol was approved by the Ethics Committee of Central Hospital of Enshi Tujia and Miao Autonomous Prefecture (approval number: 2023-010-02). The retrospective data was from a medical database, and the participant’s identities were kept anonymous and the information in this study was kept strictly confidential. All subjects gave their informed consent for inclusion before they participated in the study.
We would like to thank the staff members at Department of Medical Ultrasound at the Central Hospital of Enshi Tujia and Miao Autonomous Prefecture for their assistance with this research study and we would like to express our most profound gratitude to our patients and their families.
This research received no external funding.
The authors declare no conflict of interest.
Publisher’s Note: IMR Press stays neutral with regard to jurisdictional claims in published maps and institutional affiliations.