


 , Yeping Wang 1,*
1 Department of Gynecology and Obstetrics, Wenzhou Third Clinical Institute Affiliated to Wenzhou Medical University/Third Affiliated Hospital of Shanghai University/Wenzhou People’s Hospital, 325000 Wenzhou, Zhejiang, China
2 School of Medicine, Shanghai University, 200444 Shanghai, China
3 Department of Clinical Laboratory, Wenzhou Third Clinical Institute Affiliated to Wenzhou Medical University/Third Affiliated Hospital of Shanghai University/Wenzhou People’s Hospital, 325000 Wenzhou, Zhejiang, China
Abstract
The objective of this study was to extract maternal plasma D-dimer test results from a large medical records dataset and to establish a reference level for pregnant women in our center. This study aimed to investigate the role and efficacy of D-dimer levels for predicting complications in high-risk pregnant women.
The clinical data of 19,117 women who delivered at Wenzhou People’s Hospital between January 1, 2020, and September 30, 2022, were retrospectively analyzed. A total of 74,401 D-dimer test results were extracted from the laboratory information system. Following data screening and matching, 7692 records of D-dimer test results for healthy pregnant women and 19,005 records for pregnant women with complications were selected. D-dimer reference values were calculated for early pregnancy (1–13 weeks gestation), mid-pregnancy (14–27 weeks gestation), late pregnancy (28–36 weeks gestation), and the end of pregnancy (37–41 weeks gestation). A logistic regression model was used to plot receiver operating characteristic (ROC) and determine cut-off values for predicting pregnancy complications in each phase.
The mean D-dimer levels in the healthy pregnancy group were 0.56 mg/L in early pregnancy, 1.08 mg/L in mid-pregnancy, 1.48 mg/L in late pregnancy, and 1.89 mg/L at the end of pregnancy. D-dimer levels were greater in the complication group (which contains 11 common pregnancy disorders, including premature rupture of membranes (PRM), gestational diabetes mellitus (GDM), gestational hypertension (GHP), preeclampsia (PE), placental abnormalities, thyroid dysfunction, hemorrhage, thrombophilia, fetal macrosomia, preterm delivery, and infections) than in the healthy group in all pregnancy phases, with statistically significant differences observed in early, medium, and the end of pregnancy. D-dimer levels showed good diagnostic performance in predicting pregnancy complications in early pregnancy (area under the curve (AUC) = 0.71, cut-off value = 0.87, odds ratio: 7.12, 95% confidence interval (CI): 5.41–9.36, p-value = 0.000).
The reference range of D-dimer increases with the progression of gestational phases and demonstrates predictive efficacy for high-risk pregnancy complications during early pregnancy.
Keywords
- D-dimer
- pregnancy complications
- reference levels
- predictive efficacy
- longitudinal study
Venous thromboembolism (VTE) is one of the most common and serious complications in pregnant women, with a severe case mortality rate of 0.02% [1]. The incidence of VTE in pregnant women ranges from 0.5‰ to 2‰, which is four times greater than that in nonpregnant women [2]. VTE is particularly prevalent during the postpartum period and late pregnancy [3].
Currently, the diagnosis of VTE relies on patient history, physical examination,
ancillary tests, and diagnostic imaging methods such as angiography and vascular
ultrasound. These methods are expensive and carry risks, including potential harm
to the fetus and the possibility of false-negative imaging, which may delay
diagnosis [4]. Consequently, the plasma D-dimer (DD) assay is widely used in
clinical settings for assessing the risk of pulmonary embolism and deep vein
thrombosis [5]. Due to its high sensitivity and negative predictive value, the
D-dimer assay is valuable for ruling out venous thromboembolic disease [6].
Recent study have also demonstrated that D-dimer levels are important for
diagnosing disseminated intravascular coagulation (DIC) [7].
Importantly, D-dimer levels increase
progressively during pregnancy, making the adoption of a plasma D-dimer level
Plasma D-dimer is a specific degradation product of cross-linked fibrin formed by fibrinolytic enzymes, which sensitively reflects the coagulation and fibrinolytic status in vivo [9]. Currently, no clear and uniform standard for D-dimer levels during pregnancy exists, as a result, different doctors interpret and use D-dimer levels differently in clinical practice [10]. Some clinicians may overmedicate due to the fear of thrombophilia, while others may overlook the hypercoagulable state of pregnancy, resulting in missed diagnoses [11].
Given the existence of more than 20 types of plasma D-dimer monoclonal antibodies and the use of more than 30 detection methods in clinical practice, the lack of a uniform standard and poor comparability between various test results are significant challenges [12]. The reference intervals provided by various reagent vendors are intended for healthy nonpregnant populations, thus limiting the application of a D-dimer reference range in pregnancy; therefore, it is imperative to establish different reference intervals for different physiological stages and assays [13]. There is an urgent clinical need to determine the normal reference range for plasma D-dimer levels for each stage of pregnancy by studying the reference range of plasma D-dimer levels in healthy singleton pregnant women [14].
This study aimed to detect D-dimer levels in healthy singleton pregnant women in different phases of pregnancy and observe their pregnancy outcomes through a longitudinal study with large sample sizes at different stages (early pregnancy, mid-pregnancy, late pregnancy, and end-pregnancy). The goal of this study was to develop reference ranges for D-dimer levels in each phase of pregnancy for healthy singleton pregnant women in this region. Additionally, this study sought to explore the role of plasma D-dimer levels in diagnosing high-risk pregnancy complications, providing clinicians with a more accurate diagnostic basis.
This study retrospectively analyzed the clinical data of 19,117 women who delivered at Wenzhou People’s Hospital between January 1, 2020 and September 30, 2022. A total of 74,401 D-dimer test results were extracted from the laboratory information system. After data screening and matching based on patient identification numbers (IDs), records lacking clinical diagnoses were excluded. Consequently, we selected 7692 D-dimer test results from healthy pregnant women and 19,005 records from pregnant women with complications for analysis. The flow chart of data screening is as follows figure (Fig. 1). D-dimer reference values were calculated for early pregnancy (1–13 weeks gestation), mid-pregnancy (14–27 weeks gestation), late pregnancy (28–36 weeks gestation), and the end of pregnancy (37–41 weeks gestation). This study was approved by the Ethics Committee of Wenzhou People’s Hospital (2020; NO. 265).
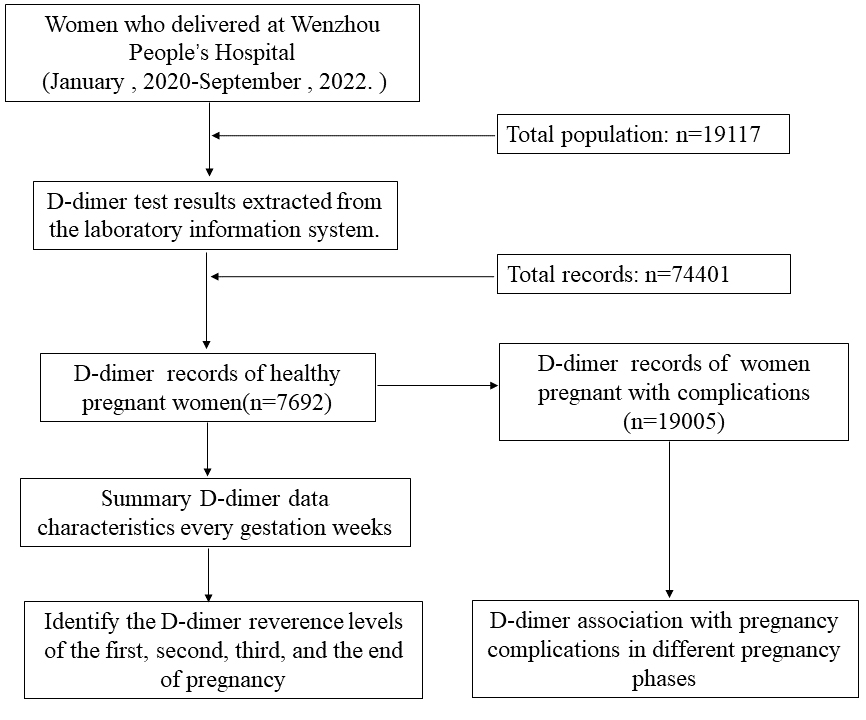 Fig. 1.
The flow chart of data screening.
The inclusion criteria for healthy pregnant women were as follows: singleton pregnancy; full-term live birth; no pregnancy complications or maternal complications; aged 18–40 years; and undergone regular obstetric examinations and delivered in this unit. The exclusion criteria for healthy pregnant women were as follows: a history of VTE before pregnancy or a family history of VTE; pre-pregnancy hypertension, diabetes mellitus, hepatic or renal disease, or cardiovascular or cerebral vascular disease; a history of hemorrhagic disorders, autoimmune disorders, etc.; use of oral aspirin or heparin therapy during pregnancy; a nonfull term birth; and fetal malformations.
The pregnancy complications group included women with 11 common pregnancy disorders, including premature rupture of membranes (PRM), gestational diabetes mellitus (GDM), gestational hypertension (GHP), preeclampsia (PE), placental abnormalities, thyroid dysfunction, hemorrhage, thrombophilia, macrosomia, preterm delivery, and infections.
Peripheral blood was collected from all study subjects during the four pregnancy phases, and 1.8 mL of venous blood was drawn from the examined population using vacuum tubes containing 0.109 mol/L sodium citrate for anticoagulation.
The samples were centrifuged at 3000 r/min for 10 min after collection, and all the samples were examined within 2 h after blood collection. The specific testing method was based on the operation procedure of the ACL TOP750 automatic blood coagulation analyzer from Wolfen (Barcelona, Spain), using the original reagents designed for this analyzer.
After the test was completed, the D-dimer levels of healthy singleton pregnant women were compared to determine whether there was any difference in D-dimer levels among the different phases, and the normal reference range for D-dimer levels in different phases of pregnancy was clarified for healthy singleton pregnant women.
For each gestational period, the data were divided into control and disease groups. Normality was tested using the Shapiro-Wilk test. Based on the normality of the data, either an independent samples t test or the Mann-Whitney U test was used to assess differences in D-dimer levels. For the normality test, the Shapiro-Wilk test was used; for the parametric test, the independent samples t test was used; and for the nonparametric test, the Mann-Whitney U test was used. The results, including p values for normality tests, test types, and p values/statistics from difference tests, were stored and printed for each gestational period. To evaluate the impact of gestational phases and age on D-dimer levels, an analysis of variance (ANOVA) was conducted to evaluate the impact of gestational phases, age, and their interaction on D-dimer levels.
For data visualization, the following packages in R version 4.4.1 (R Foundation for Statistical Computing, Vienna, Austria) were used: reshape2, ggplot2, ggridges, ggsci, and hrbrthemes. The data were read from a comma-separated values (CSV) file and visualized using box plots and violin plots to show D-dimer level distributions across gestational periods.
To predict receiver operating characteristic (ROC) curves and determine diagnostic cut-off values in Python, the following steps were used: data preparation: the dataset was filtered to obtain unique gestational periods; ROC curve calculation: ROC curves were computed using roc_curve from sklearn.metrics (https://github.com/scikit-learn (The scikit-learn developers ,BSD License)); Youden’s J statistic: optimal cut-off values were determined by calculating Youden’s J statistic (J = true positive rate (TPR) – false positive rate (FPR)), and the threshold that maximized J was identified. Visualization: ROC curves were plotted using matplotlib.pyplot (https://matplotlib.org/ (NumFOCUS, Austin, TX, USA)), and the area under the curve (AUC) was calculated. Cut-off values: optimal D-dimer cut-off values were printed for each gestational period. This approach identified optimal diagnostic thresholds for D-dimer levels across different gestational periods using Python 3 environments (Wilmington, DE, United States).
We screened 7692 D-dimer test results from completely healthy pregnant women and
performed time-ordered slices of the pregnancies and calculated the mean,
standard deviation, 5% quartile, 50% quartile, and 95% quartile of D-dimer
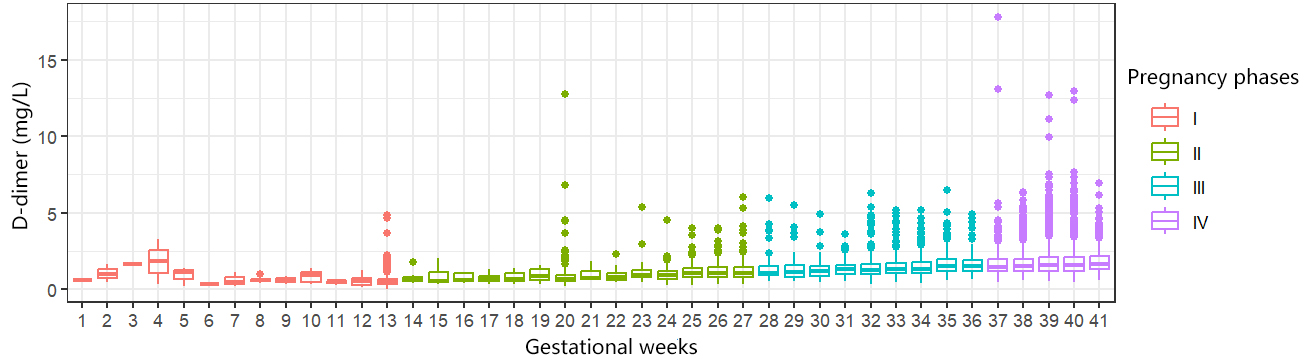
levels from week 1 to week 41 of pregnancy. We found that the D-dimer levels of
healthy pregnant women increased with the duration of gestation (Fig. 2), and
except for some pregnant women with large deviations in the number of samples,
all of the means during pregnancy were greater than the current reference D-dimer
levels for the normal population (
 Fig. 2.
D-dimer levels in the healthy pregnancy group at different gestational weeks.
| Week | n | mean | SD | Fixed centile | ||
| 5th | 50th | 95th | ||||
| 1 | 2 | 0.61 | 0.06 | 0.57 | 0.61 | 0.65 |
| 2 | 3 | 1.02 | 0.58 | 0.52 | 0.97 | 1.56 |
| 3 | 1 | 1.66 | — | 1.66 | 1.66 | 1.66 |
| 4 | 3 | 1.81 | 1.50 | 0.46 | 1.82 | 3.15 |
| 5 | 3 | 0.93 | 0.61 | 0.33 | 1.14 | 1.38 |
| 6 | 1 | 0.33 | — | 0.33 | 0.33 | 0.33 |
| 7 | 4 | 0.60 | 0.41 | 0.25 | 0.50 | 1.07 |
| 8 | 4 | 0.64 | 0.24 | 0.44 | 0.59 | 0.91 |
| 9 | 2 | 0.61 | 0.35 | 0.38 | 0.61 | 0.83 |
| 10 | 6 | 0.84 | 0.43 | 0.32 | 0.95 | 1.31 |
| 11 | 4 | 0.47 | 0.15 | 0.30 | 0.51 | 0.60 |
| 12 | 22 | 0.57 | 0.32 | 0.19 | 0.51 | 1.19 |
| 13 | 700 | 0.55 | 0.40 | 0.20 | 0.47 | 1.11 |
| 14 | 10 | 0.77 | 0.39 | 0.45 | 0.69 | 1.41 |
| 15 | 9 | 0.81 | 0.58 | 0.35 | 0.53 | 1.75 |
| 16 | 11 | 0.73 | 0.29 | 0.42 | 0.62 | 1.11 |
| 17 | 23 | 0.75 | 0.25 | 0.42 | 0.74 | 1.13 |
| 18 | 15 | 0.79 | 0.30 | 0.45 | 0.69 | 1.26 |
| 19 | 9 | 0.95 | 0.46 | 0.40 | 0.87 | 1.58 |
| 20 | 390 | 0.84 | 0.83 | 0.36 | 0.70 | 1.55 |
| 21 | 8 | 1.00 | 0.50 | 0.62 | 0.77 | 1.79 |
| 22 | 16 | 0.93 | 0.50 | 0.49 | 0.79 | 1.76 |
| 23 | 24 | 1.22 | 1.02 | 0.53 | 0.92 | 2.76 |
| 24 | 119 | 1.01 | 0.50 | 0.48 | 0.93 | 1.67 |
| 25 | 263 | 1.13 | 0.49 | 0.58 | 1.03 | 2.03 |
| 26 | 465 | 1.20 | 0.53 | 0.58 | 1.07 | 2.22 |
| 27 | 360 | 1.21 | 0.61 | 0.62 | 1.09 | 2.14 |
| 28 | 111 | 1.35 | 0.80 | 0.67 | 1.08 | 2.37 |
| 29 | 44 | 1.49 | 1.09 | 0.57 | 1.11 | 3.99 |
| 30 | 72 | 1.34 | 0.72 | 0.62 | 1.18 | 2.39 |
| 31 | 250 | 1.35 | 0.50 | 0.70 | 1.29 | 2.32 |
| 32 | 509 | 1.44 | 0.73 | 0.66 | 1.28 | 2.64 |
| 33 | 436 | 1.47 | 0.66 | 0.73 | 1.33 | 2.57 |
| 34 | 336 | 1.52 | 0.68 | 0.76 | 1.34 | 2.68 |
| 35 | 181 | 1.68 | 0.83 | 0.80 | 1.51 | 3.42 |
| 36 | 138 | 1.67 | 0.75 | 0.86 | 1.50 | 2.94 |
| 37 | 174 | 1.85 | 1.71 | 0.89 | 1.48 | 3.82 |
| 38 | 714 | 1.80 | 0.97 | 0.91 | 1.50 | 4.00 |
| 39 | 1149 | 1.95 | 1.21 | 0.88 | 1.61 | 4.37 |
| 40 | 946 | 1.88 | 1.17 | 0.87 | 1.55 | 4.01 |
| 41 | 155 | 2.01 | 1.10 | 0.88 | 1.66 | 4.12 |
SD, standard deviation.
We used cross-validation of maternal age and pregnancy phases, showing that age
has limited effect on D-dimer levels across different pregnancy stages (Fig. 3).
The effect of pregnancy phases on D-dimer levels was significant (Df (degrees of
freedom) = 3, Sum Sq (squares) = 23.317, Mean Sq = 7.772,
F-statistic value = 73.786, p-value
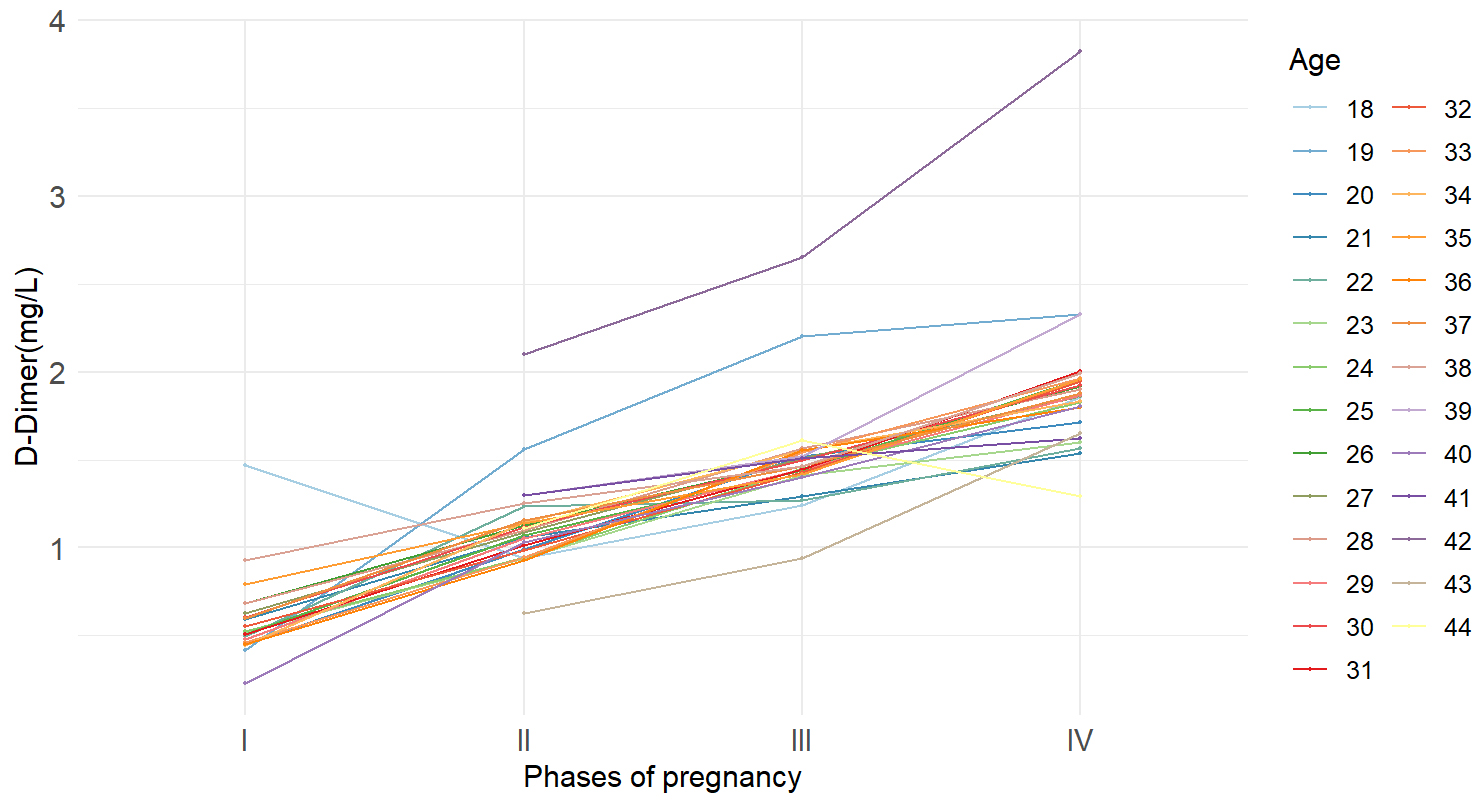 Fig. 3.
The interaction between pregnancy phases and age on D-dimer levels.
| Df | Sum Sq | Mean Sq | F value | p-value ( | |
| Pregnant phases | 3 | 23.317 | 7.772 | 73.786 | |
| Age | 1 | 0.103 | 0.103 | 0.980 | 0.325 |
| Pregnant phases: age | 3 | 0.204 | 0.068 | 0.647 | 0.587 |
| Residuals | 95 | 10.007 | 0.105 |
***p-values
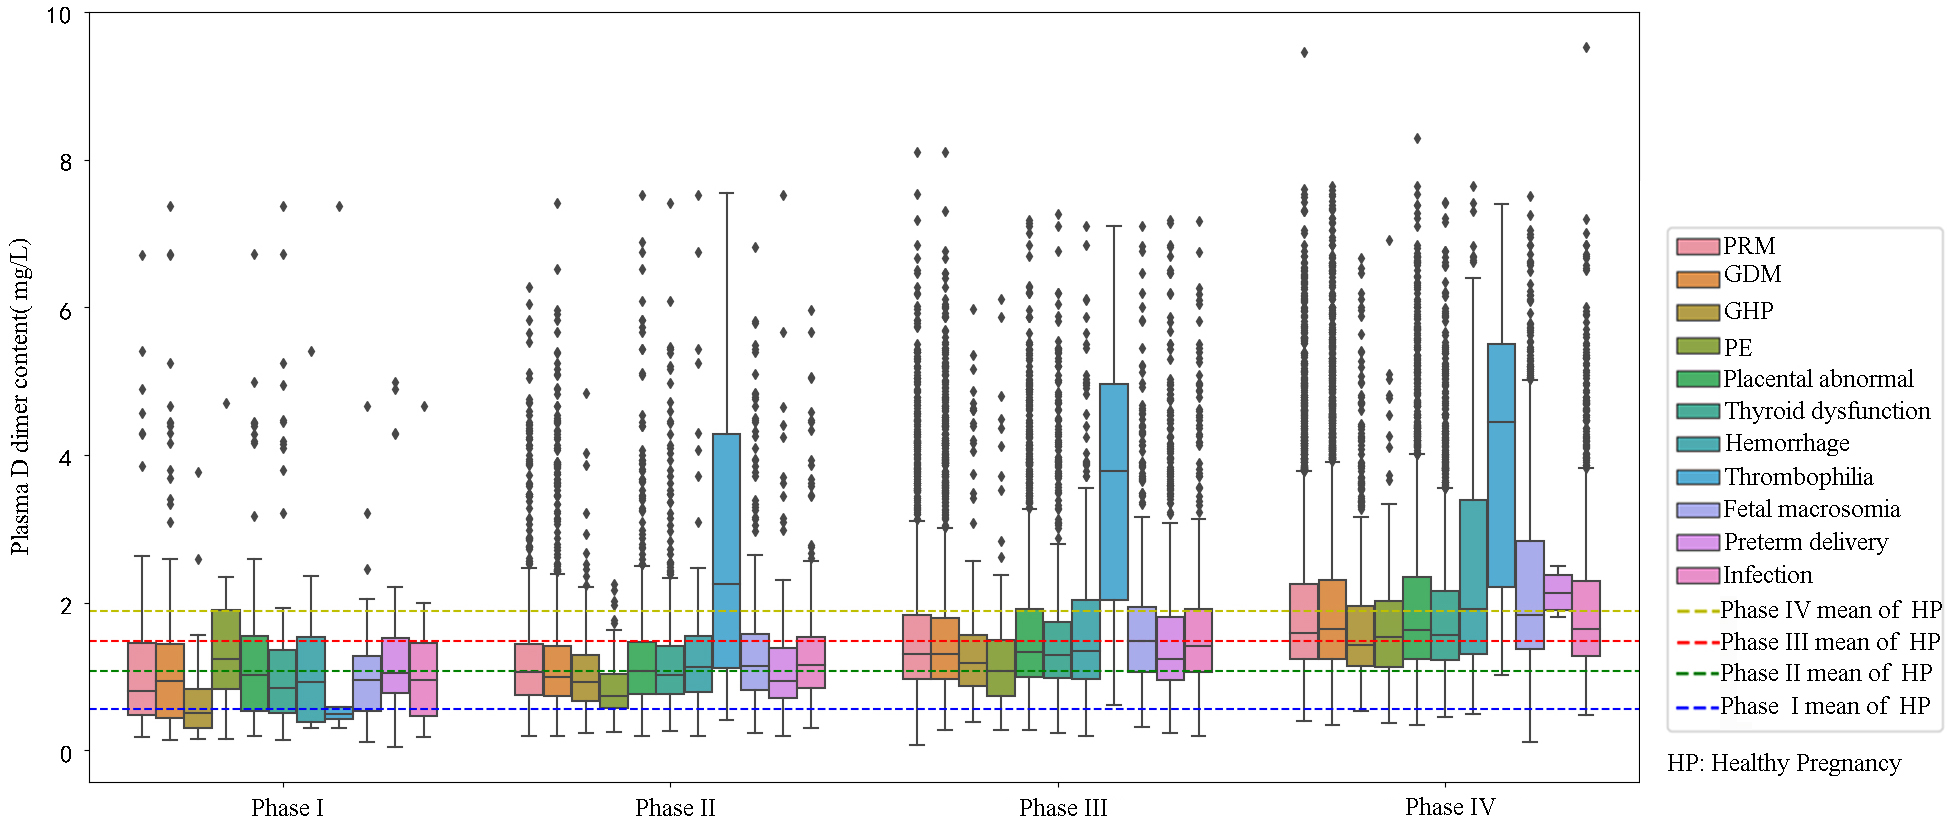
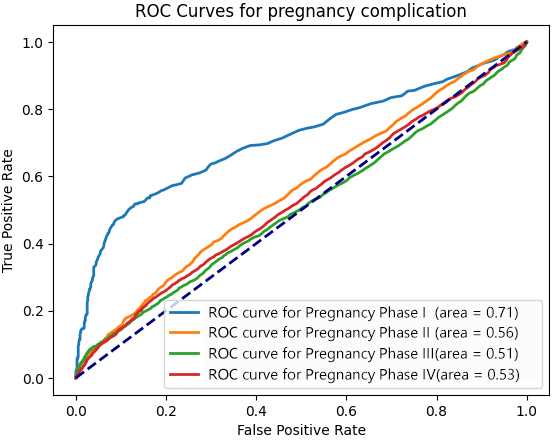
A total of 19,005 D-dimer test results from pregnant women with pregnancy complications covering 11 common disorders: premature rupture of membranes (PRM), gestational diabetes mellitus (GDM), gestational hypertension (GHP), preeclampsia (PE), placental abnormalities, thyroid dysfunction, hemorrhage, thrombophilia, macrosomia, preterm delivery, and infections across four phases were screened (Fig. 4). Statistical analysis indicated that D-dimer levels were higher in pregnant women with complications compared to healthy pregnant women in early pregnancy, medium pregnancy, and the end of pregnancy (Table 3). D-dimer levels showed predictive effect on pregnancy complications in early pregnancy (AUC = 0.71, cutoff value = 0.87, odds ratio: 7.12, 95% confidence interval (CI): 5.41–9.36, p-value = 0.000) (Fig. 5).
 Fig. 4.
D-dimer levels in the pregnancy complication group at different phases of pregnancy. PRM, premature rupture of membranes; GDM, gestational diabetes mellitus; GHP, gestational hypertension; PE, preeclampsia; HP, healthy pregnant.
 Fig. 5.
D-dimer levels in the pregnancy complication group at different phases of pregnancy. ROC, receiver operating characteristic.
| Groups | Phase I* | Phase II* | Phase III | Phase IV* | ||||||||
| n | mean | SD | n | mean | SD | n | mean | SD | n | mean | SD | |
| Healthy pregnancy | 755 | 0.56 | 0.41 | 1722 | 1.08 | 0.64 | 2077 | 1.48 | 0.72 | 3138 | 1.89 | 1.18 |
| Pregnancy complications | 506 | 1.20 | 1.23 | 4320 | 1.26 | 0.94 | 6427 | 1.66 | 1.77 | 7752 | 2.11 | 1.84 |
| Hemorrhage | 21 | 1.16 | 1.15 | 159 | 1.36 | 1.02 | 263 | 1.77 | 1.26 | 245 | 2.44 | 1.58 |
| GDM | 195 | 1.22 | 1.19 | 1546 | 1.22 | 0.81 | 2140 | 1.58 | 1.02 | 2624 | 2.09 | 1.31 |
| GHP | 33 | 0.78 | 0.75 | 295 | 1.06 | 0.59 | 432 | 1.35 | 0.79 | 592 | 1.79 | 1.09 |
| Eclampsia | 8 | 1.6 | 1.44 | 81 | 0.86 | 0.46 | 145 | 1.32 | 0.97 | 113 | 1.81 | 1.1 |
| Macrosomia | 42 | 1.08 | 0.84 | 397 | 1.41 | 1.01 | 573 | 1.74 | 1.06 | 838 | 2.32 | 1.37 |
| Preterm delivery | 38 | 1.39 | 1.24 | 378 | 1.14 | 0.74 | 803 | 1.61 | 1.14 | - | - | - |
| Thrombus | 5 | 1.84 | 3.1 | 47 | 2.76 | 1.86 | 61 | 3.65 | 1.67 | 64 | 4.22 | 1.89 |
| Thyroid gland | 65 | 1.45 | 1.65 | 671 | 1.24 | 0.84 | 966 | 1.58 | 1.03 | 1194 | 1.96 | 1.2 |
| Placenta-related diseases | 100 | 1.36 | 1.24 | 908 | 1.27 | 0.87 | 1369 | 1.68 | 1.12 | 1520 | 2.11 | 1.35 |
| PRM | 133 | 1.16 | 1.08 | 1247 | 1.24 | 0.77 | 1878 | 1.58 | 1 | 2033 | 2.06 | 1.29 |
| Infection | 45 | 1.02 | 0.78 | 443 | 1.31 | 0.77 | 656 | 1.65 | 0.98 | 868 | 2.08 | 1.25 |
* p
It is widely accepted that plasma D-dimer levels serve as a sensitive indicator for screening thromboembolic diseases during pregnancy and the postpartum period [15]. However, many healthcare organizations still use general population standards for D-dimer testing due to a lack of large-scale survey data on plasma D-dimer levels during pregnancy, often resulting in excessive medical treatments [16]. Therefore, this study utilized electronic medical records and laboratory test data from pregnant women in our center to establish the reference range of D-dimer levels during different stages of pregnancy through big data analysis. Additionally, it aimed to investigate the correlation between D-dimer levels and various pregnancy complications. This research provides a valuable reference for D-dimer levels in the pregnant population and offers clinicians a more comprehensive understanding of its distribution pattern, thereby facilitating the use of this marker as a guide for disease management in pregnant individuals.
Recent studies on plasma D-dimer levels during pregnancy have been reported. For
instance, Dai et al. [17] aimed to address changes in plasma D-dimer
levels and established reference values for the first, second, and third
trimesters as 0–0.969 mg/L, 0–2.14 mg/L, and 0–3.28 mg/L. They also discussed
the relationship between D-dimer and other coagulation indexes during pregnancy,
including prothrombin time (PT), activated partial thromboplastin time (APTT),
thrombin time (TT), and fibrinogen (Fib), leading to the establishment of
pregnancy-specific reference intervals. Similarly, Sallih et al. [18]
conducted a study on 92 pregnant Malaysian women, establishing reference ranges
for D-dimer levels in different pregnancy phases. They established the following
median D-dimer levels (and reference ranges) during pregnancy: control at 0.27
mg/L (
Although the role of D-dimer levels in the development of VTE during pregnancy is controversial, D-dimer levels are still used by a considerable number of clinicians in practical clinical work and have been used in recent studies as an auxiliary indicator for the prediction of pregnancy complications and adverse pregnancy outcomes [19, 20]. However, study have also shown that D-dimer levels have a limited role in the prediction of the occurrence of pregnancy complications [21]. Considering that blood is in a state of hypercoagulation during pregnancy, the levels of blood coagulation factors and fibrinogen increase in the blood due to the special physiological state of pregnant women [22]. Additionally, due to anatomical changes, with the gradual increase in uterine volume during pregnancy, compression of the inferior vena cava and iliac veins gradually increases, resulting in poor venous return to the lower extremities and iliac veins, and the risk of VTE development is increased in comparison with that of the general population [23]. However, previous study lacked a monitoring process that emphasizes the dynamic physiological changes throughout the entire pregnancy period, the management and delineation of boundaries between different phases are relatively vague, and there is no diagnostic boundary or time anchorage point that can be used to diagnose pregnancy complications [24].
In this study, we discussed the value of D-dimer in risk management for high-risk pregnant women. We grouped and staged pregnant women with complications and healthy pregnant women in different phases using D-dimer levels. The high-risk pregnancy factors were screened based on previous research involving machine learning [25]. The present study also emphasized the clear temporal sequence in the predictive effect of D-dimer levels on various pregnancy complications. For example, in early pregnancy, elevated D-dimer levels tend to predict the development of complications, while in mid and late pregnancy, the predictive value diminishes. This highlights the importance of D-dimer in managing high-risk pregnancies in the early stages. Actively controlling D-dimer levels within the normal range is beneficial for managing pregnancy risks. It is crucial to consider the reference value of D-dimer levels in the context of the pregnancy period, especially at the end of pregnancy when D-dimer levels increase rapidly. Therefore, including the week of gestation as a key factor in discussing the predictive effect of D-dimer levels on pregnancy complications is essential. Although, this study coincided with the coronavirus disease 2019 (COVID-19) pandemic, its impact on D-dimer data in the pregnant population we studied was limited due to strict control measures and regional vaccination policies, but further research is needed to fully understand the impact of COVID-19 and vaccination on D-dimer levels in pregnant women.
In summary, by screening big data from medical records, we calculated the mean D-dimer levels for each gestational week and established normal reference intervals for different pregnancy phases. This baseline is essential for clinical testing application and beneficial for managing pregnant women’s health. We also explored D-dimer levels’ predictive value in high-risk pregnancies, providing guidance for managing high-risk pregnant women early in pregnancy.
D-dimer reference intervals for pregnant women in different phases can be established through the analysis of data from the Medical Records Big Data Bureau. D-dimer levels may serve as an indicator of potential complications in high-risk pregnancies, particularly in the early gestational stages.
The data used in this study are available to share with other researchers upon reasonable request and approval from the authors. For details on data and code sharing, please contact the corresponding author.
YW led the concept and design of the study, edited and reviewed the manuscript. LP conducted data acquisition, while QD managed quality control of the data. HZ carried out data analysis and interpretation, and oversaw the final review of the manuscript. WW performed the statistical analysis and drafted the manuscript. All authors contributed to editorial changes in the manuscript. All authors read and approved the final manuscript. All authors have participated sufficiently in the work and agreed to be accountable for all aspects of the work.
In accordance with the Declaration of Helsinki, all patient information in this article was reviewed and approved by the Medical Ethics Committee of Wenzhou People’s Hospital (2020; No. 265) with extensive informed consent.
We would like to express our gratitude to all those who helped us during the writing of this manuscript. Thanks to all the peer reviewers for their opinions and suggestions.
This work was supported by the Health Science and Technology Project of Zhejiang Province, China (2024KY1629), the Wenzhou Major Science and Technology Innovation Project (ZY2021025), and the Wenzhou Basic Scientific Research Project (Y2020081).
The authors declare no conflict of interest.
References
Publisher’s Note: IMR Press stays neutral with regard to jurisdictional claims in published maps and institutional affiliations.