
†These authors contributed equally.
Academic Editor: Carmela Rita Balistreri
Background: Valvular heart disease (VHD) is a major precipitating factor of atrial fibrillation (AF) that contributes to decreased cardiac function, heart failure, and stroke. Stroke induced by VHD combined with atrial fibrillation (AF-VHD) is a much more serious condition in comparison to VHD alone. The aim of this study was to explore the molecular mechanism governing VHD progression and to provide candidate treatment targets for AF-VHD. Methods: Four public mRNA microarray datasets were downloaded and differentially expressed genes (DEGs) screening was performed. Weighted gene correlation network analysis was carried out to detect key modules and explore their relationships and disease status. Candidate hub signature genes were then screened within the key module using machine learning methods. The receiver operating characteristic curve and nomogram model analysis were used to determine the potential clinical significance of the hub genes. Subsequently, target gene protein levels in independent human atrial tissue samples were detected using western blotting. Specific expression analysis of the hub genes in the tissue and cell samples was performed using single-cell sequencing analysis in the Human Protein Atlas tool. Results: A total of 819 common DEGs in combined datasets were screened. Fourteen modules were identified using the cut tree dynamic function. The cyan and purple modules were considered the most clinically significant for AF-VHD. Then, 25 hub genes in the cyan and purple modules were selected for further analysis. The pathways related to dilated cardiomyopathy, hypertrophic cardiomyopathy, and heart contraction were concentrated in the purple and cyan modules of the AF-VHD. Genes of importance (CSRP3, MCOLN3, SLC25A5, and FIBP) were then identified based on machine learning. Of these, CSRP3 had a potential clinical significance and was specifically expressed in the heart tissue. Conclusions: The identified genes may play critical roles in the pathophysiological process of AF-VHD, providing new insights into VHD development to AF and helping to determine potential biomarkers and therapeutic targets for treating AF-VHD.
Atrial fibrillation (AF) is the most prevalent arrhythmia within the general population [1]. Morbidity and mortality linked to AF represent a significant public health burden worldwide [2]. There are multiple factors contributing to AF, including valvular heart disease (VHD), hypertension, age, obesity, and diabetes [3, 4]. VHD is a significant cause of arrhythmia and stroke. Stroke induced by AF-VHD is a more serious condition compared to VHD alone [5, 6]. However, the mechanism for the development of VHD into AF-VHD is not yet fully understood. It is therefore essential to investigate the pathogenesis and clarify the precise molecular mechanisms involved in AF-VHD progression.
Lamirault et al. [7] identified the gene expression profile associated with human AF-VHD. In their study, ight atrial appendages in 11 patients with AF-VHD and 7 patients with sinus rhythm with VHD (SR-VHD) undergoing open heart surgery were included in cardiac-specific microarray analysis. The results indicated that 169 genes were differentially expressed between the two groups. Notably, cysteine- and glycine-rich protein 3 (CSRP3) was found to be highly expressed in AF-VHD and involved in cardiac contraction. Furthermore, Yan et al. [8] and Li et al. [9] screened key immune-related genes in AF-VHD. Liu et al. [10] also identified feature genes for AF with VHD using integrative transcriptomic, proteomic, and machine learning approaches. In our study, by contrast, we merged related datasets and used weighted gene co-expression network analysis (WGCNA), a statistical method that is similar to cluster analysis but is more biologically meaningful, and machine learning methods to identify specific biomarkers [11, 12]. Even though many studies have investigated AF-VHD markers, specific predictive biomarkers are still lacking to enable early detection. The communicative regulatory mechanisms of AF-VHD also remain poorly understood.
In the present study, co-expression networks were constructed using the dataset GSE115574’s expression profile to identify key modules and hub genes related to AF with VHD. The genes were then subjected to gene ontology (GO) and Kyoto Encyclopedia of Genes and Genomes (KEGG) ontology enrichment analyses. Subsequently, important genes (CSRP3, Transient Receptor Potential Channel Mucolipin 3 (MCOLN3), solute carrier family 25 member 5 (SLC25A5), and FGF1 intracellular binding protein (FIBP)) were identified using a machine learning approach and their potential clinical significance was determined. Notably, the clinical significance of CSRP3 and MCOLN3 was statistically significant. Functional enrichment results showed that CSRP3 has a strong association with heart development and MCOLN3 is linked to the calcium channel complex. Additionally, the available literature indicated that CSPR3 is closely involved in the process of cardiac hypertrophy [13, 14]. These observations may link AF with dilated or hypertrophic cardiomyopathy, providing novel evidence for the diagnosis and treatment of AF with VHD in a clinical setting.
Gene Expression Ominibus (GEO, https://www.ncbi.nlm.nih.gov/geo/) was used to extract the raw datasets and included if datasets met the following criteria. (1) The expression profiling was acquired by array; (2) The experimental platform belonged to GPL570 platform; (3) Data sets should include gene expression profiles of human left or right atria tissues; (4) All experiments included controls and the minimum sample size used was three.
Based on the criteria mentioned above, four publicly microarray datasets (GSE79768, GSE115574, GSE14975 and GSE41177) were filtered and downloaded. In the GSE115574 dataset, the expression matrix of a total of 59 samples was acquired from the human atrial tissue, containing 15 patients diagnosed with AF-VHD, and 15 with SR-VHD. Left atrial appendage and right atrial appendage samples (except 1 patient) were obtained from each patient. In GSE79768, a total of 7 patients with AF-VHD and 6 with SR-VHD provided atrial tissue samples. GSE14975 contained 5 atrial tissue samples from AF-VHD patients and 5 from SR-VHD control. The GSE41177 dataset included 16 patients with persistent AF receiving valvular surgery and 3 patients diagnosed with SR with VHD.
Furthermore, Probe IDs were mapped to gene symbols in each dataset by extracting
them from the respective platform file. The microarray data
preprocessing, containing normalization and background correction, was conducted
by applying the “Affy” package in R [15]. Then, using the
“sva” package of the R software (version 3.6.3) to merge and batch
normalization four datasets. Afterwards, the “limma” package
was used to identify the DEGs between the AF-VHD and SR-VHD. The statistical
cutoff values were an absolute log
In order to explore the biological function of the DEGs and genes in key
modules, GO analysis and a KEGG terms enrichment analysis were performed using
Metascape tool (http://metascape.org) and ClusterProfiler (version 3.6.0)
software in R language [16, 17]. Enrichment significance thresholds were set at
an adjust p-value below 0.05. Furthermore, Gene set enrichment analysis
(GSEA) was performed by clusterProfiler (R package) and GSEA
plots were visualized by “gseaplot” package [18]. Results
with a
Based on the median absolute deviation of the genes, we selected the top 5000
genes for WGCNA using the R package “WGCNA” [19, 20]. Biological networks were
constructed with a value of 9 for the soft thresholding parameter to satisfy the
scale-free assumption (linear regression model fitting index R
The module membership (MM) was also calculated, which was regarded as the degree
of association between the ME and the gene expression matrix. Then, the
intramodular hub genes were identified based on gene significance (GS)
The TF-miRNA regulatory network was constructed by overlapping TF-hub genes and miRNA-hub genes using the Network-Analyst database (http://www.networkanalyst.ca) and then visualized by performing Cytoscape (version 3.7.2) [23, 24, 25] (TF, transcription factor).
We performed least absolute shrinkage and selection operator (LASSO) regression by applying the “glmnet” package in R software to identify the candidate predictive features based on a generalized linear model [26]. Moreover, we constructed Random Forest (RF) Model to identify the important variables by using “Random Forest” package [27]. Finally, we screened real hub gene signatures by intersecting gene signatures from the LASSO and RF.
The association analysis between hub genes was performed by using the spearman rank correlation coefficient, illustrated by heat-map. To screen out the potential clinical significance of hub genes, the receiver operating characteristic curve (ROC) was created using “pROC” packages [28]. A multivariate regression formula was built based on the hub genes’ expression value and their regression coefficients under the merged datasets. Finally, a nomogram was constructed based on the selected predictive factors identified by using the “rms” package in R to predict the prevalence of AF-VHD. Calibration curves were plotted to evaluate the difference between the predicted probability and the actual probability. In addition, a decision curve analysis (DCA) can be used to measure the net benefit of a predictive model [29].
Left atrial appendages were obtained from 6 VHD patients with AF and 5 VHD patients with SR undergoing open heart surgery. Patients with hyperthyroidism, diabetes, hypertension and infectious diseases were excluded from our study. After the surgical operation, liquid nitrogen was immediately applied to the tissue specimens. Human participants in the studies were reviewed and approved by the ethics committee of the Guangdong General Hospital, Guangdong Academy of Medical Sciences (No. GDREC2017111H). A signed informed consent form was provided to all patients and their legal representatives.
The experiment was conducted based on the procedure reported as previously [30]. Antibodies used were mentioned as follows: anti-CSRP3 antibody [1:1000, Abcam Cat# ab172952]; anti-MCOLN3 antibody [1:1000, Thermo Fisher Invitrogen Cat# PA5-109339]; anti-GAPDH antibody [1:5000, Proteintech Cat# 60004-1-lg].
We used Human Protein Atlas (HPA) (https://www.proteinatlas.org/) tool to validate the mRNA and protein expression levels of the hub genes in all tissues. The Single Cell Type Atlas part in HPA as used to illustrate the expression of hub genes in single specific cell types [31].
A description of the bioinformatic analyses appeared in corresponding
subsections. In all cases,
values were expressed as means and standard deviations (SD), and Student’s
t-test was used to determine pairwise statistical significance of the
differences between two group means. A p-value
The flowchart for the study analysis strategy is shown in Fig. 1. Fourteen modules of co-expressed genes were identified via weighted gene correlation network analysis. The cyan and purple modules were identified as the most clinically significant. GO and KEGG analyses were performed on both modules, with similar processes being carried out on the hub genes within the key modules. Crucial candidate genes were identified by intersecting the hub genes in WGCNA and common DEGs in merged datasets. TF-crucial genes and miRNA-crucial gene networks were visualized using Cytoscape. Machine learning methods, including Lasso and random forest, were implemented to select the potential significant genes and to construct a diagnosis prediction model. The ROC curve and DCA were utilized on this prediction model to assess the predictive power. Then, protein expression levels of important genes in AF-VHD were verified using western blot analysis. Specific expression analysis of hub genes in tissue and cell samples was performed to identify specific biomarkers.
 Fig. 1.
Flowchart of the analysis strategy.
Datasets GSE115574, GSE41177, GSE79768, and GSE14975 were included in the analysis. Based on the screening criteria, 819 genes in the merged datasets were screened out as common DEGs, of which 725 genes were up-regulated and 94 genes were down-regulated (Fig. 2A). DEGs were ranked according to the fold change expression, and the top 40 were represented using a heatmap (Fig. 2B).
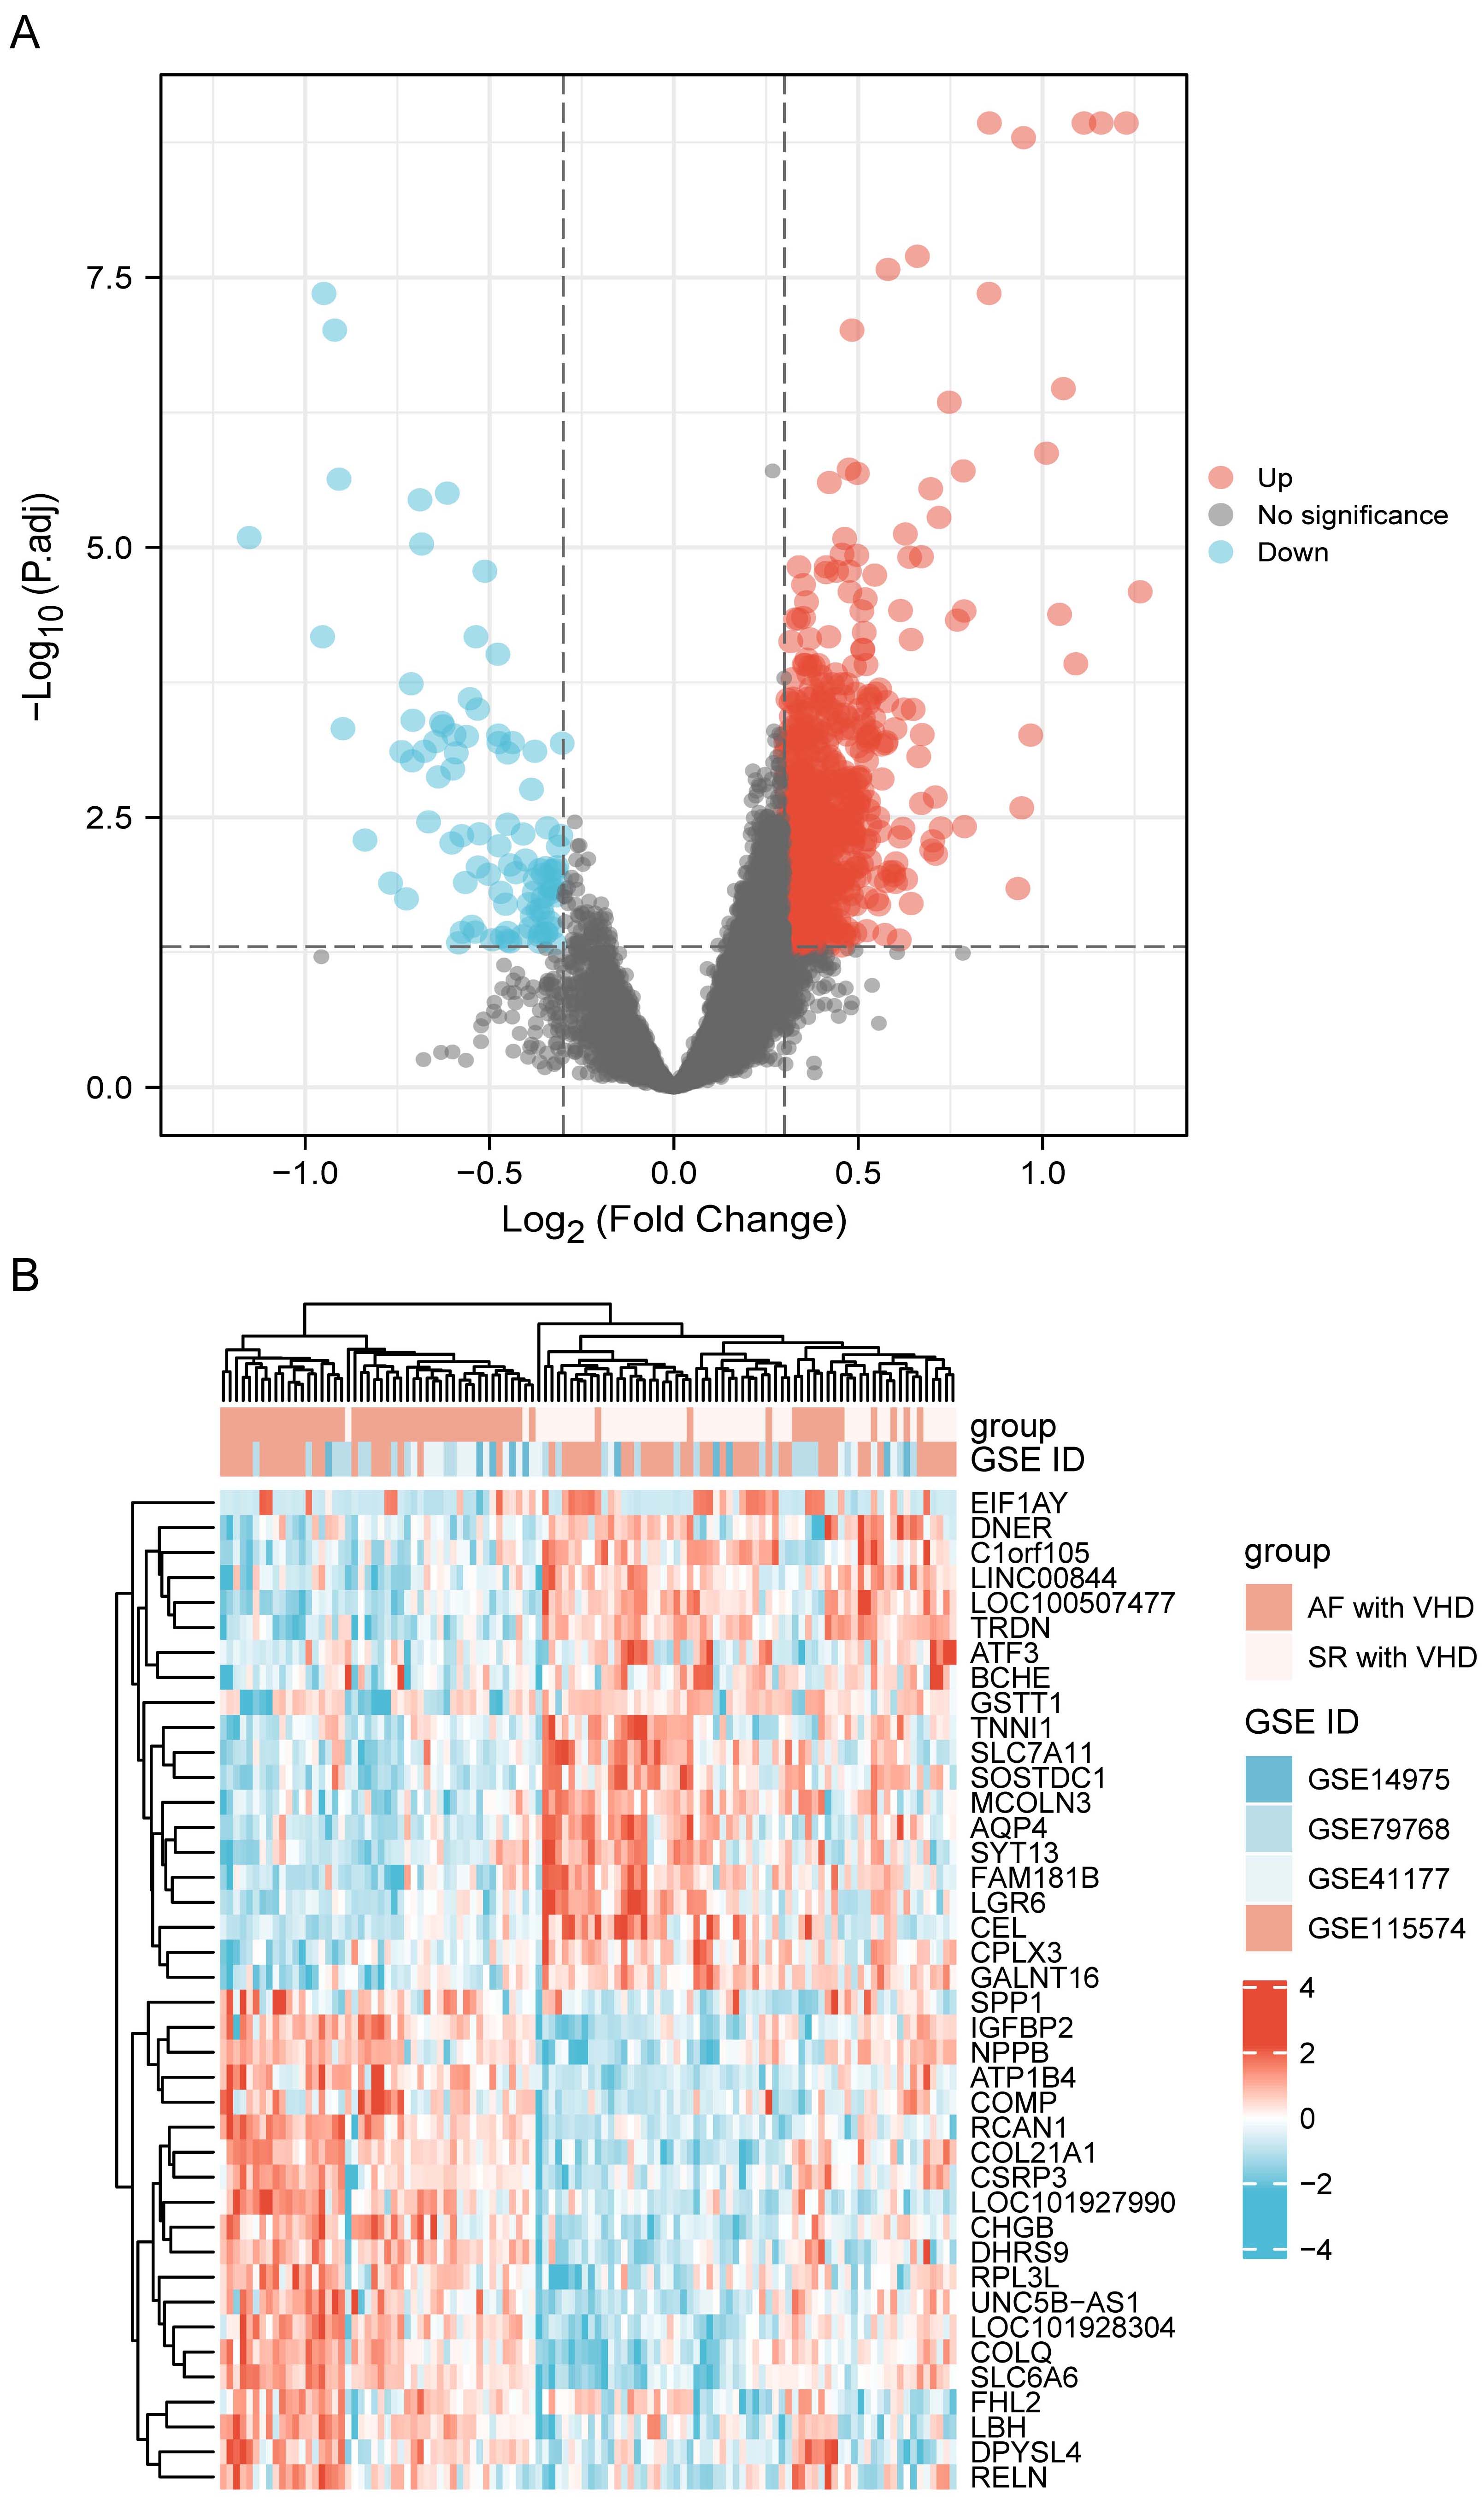 Fig. 2.
DEG identification. (A) Volcano plot visualization of differentially expressed genes and their statistical significance. The red dots indicate up-regulated genes, and the blue dots indicate down-regulated genes. (B) Heatmap showing expression profiles of top 40 DEGs. DEGs, differentially expressed genes.
A ll DEGs were used in functional annotation analyses. The top five significant terms were displayed in bubble plots according to their adjusted p-values (Fig. 3A,B). The GO terms were associated with the molecular functions (MFs), cellular components (CCs), and biological processes (BPs). Those linked with MFs included extracellular matrix structural constituent, extracellular matrix structural conferring tensile strength, IgG binding, electron activity, and heparin binding. CCs included collagen-containing extracellular matrix, mitochondrial inner membrane, endoplasmic reticulum lumen, and collagen trimer. BPs included extracellular matrix organization, collagen fibril organization, neutrophil activation, and neutrophil-mediated immunity (Fig. 3A). Terms of the enriched KEGG pathway are represented in Fig. 3B, including the phagosome, Fc gamma R-mediated phagocytosis, regulation of actin cytoskeleton, carbon metabolism, and the advanced glycation end products (AGEs) and its synergetic receptor-AGEs-RAGE signaling pathway in diabetic complications. Detailed results are summarized in the Supplementary Tables 1,2. The top 6 BP enrichment terms were determined by their adjusted (adj) p-values and BgRatio values. and chord plots were used (Fig. 3C) in order to better understand the molecular functions of DEGs and the potential biological processes in which they could be involved. GSEA was performed based on all genes (Fig. 3D). The AF-VHD groups were enriched in terms of class I major histocompatibility complex (MHC)-mediated antigen presentation, neutrophil degranulation, platelet activation signaling and aggregation, and extracellular matrix organization.
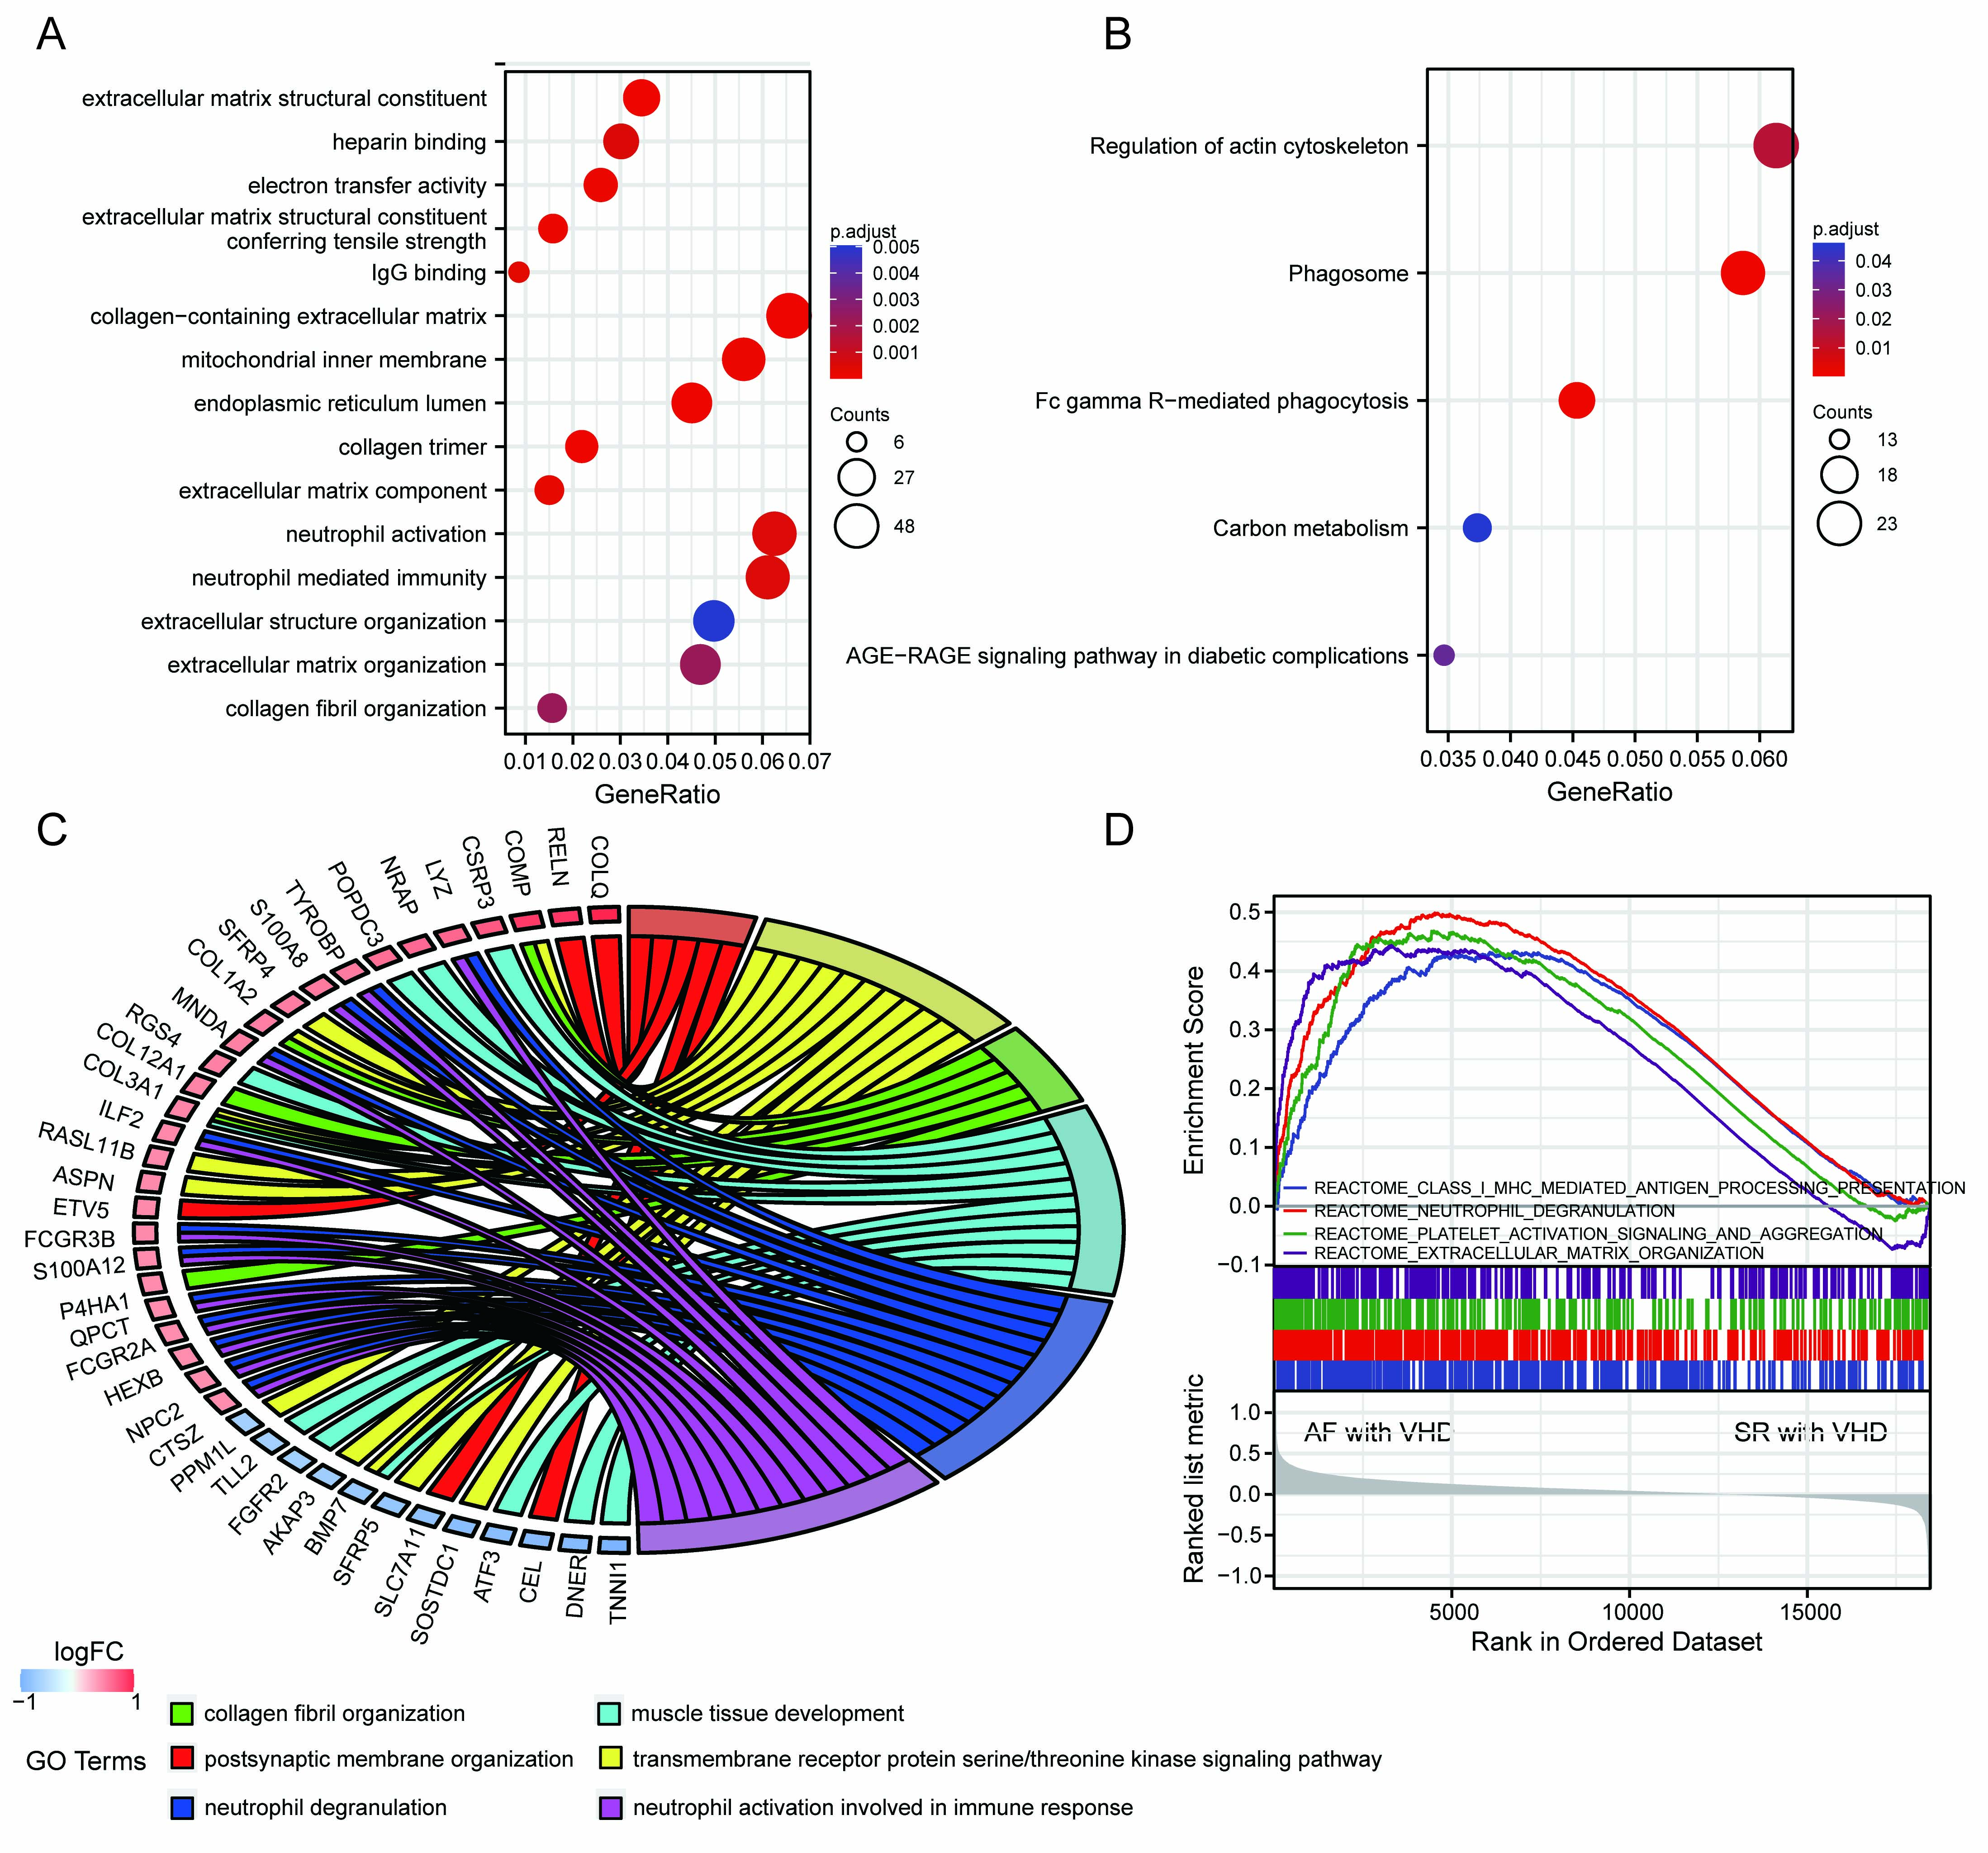 Fig. 3.
Functional enrichment analysis of DEGs and GSEA results. (A) GO term enrichment with top five significant adjusted p-values for DEGs illustrated in relation to biological process, molecular function, and cellular component. (B) Top five enriched KEGG pathways for DEGs. (C) Chord plots for gene enrichment analysis. (D) GSEA plots.
Two outliers (Sample15/GSM3182694; Sample26/GSM3182705) were
observed (Supplementary Fig. 1) in the atrium samples in GSE115574. A
total of 26 AF with VHD samples and 31 SR with VHD samples were included in the
analysis after discarding the outliers. To satisfy the scale-free assumption of
the constructed biological networks, the soft threshold power
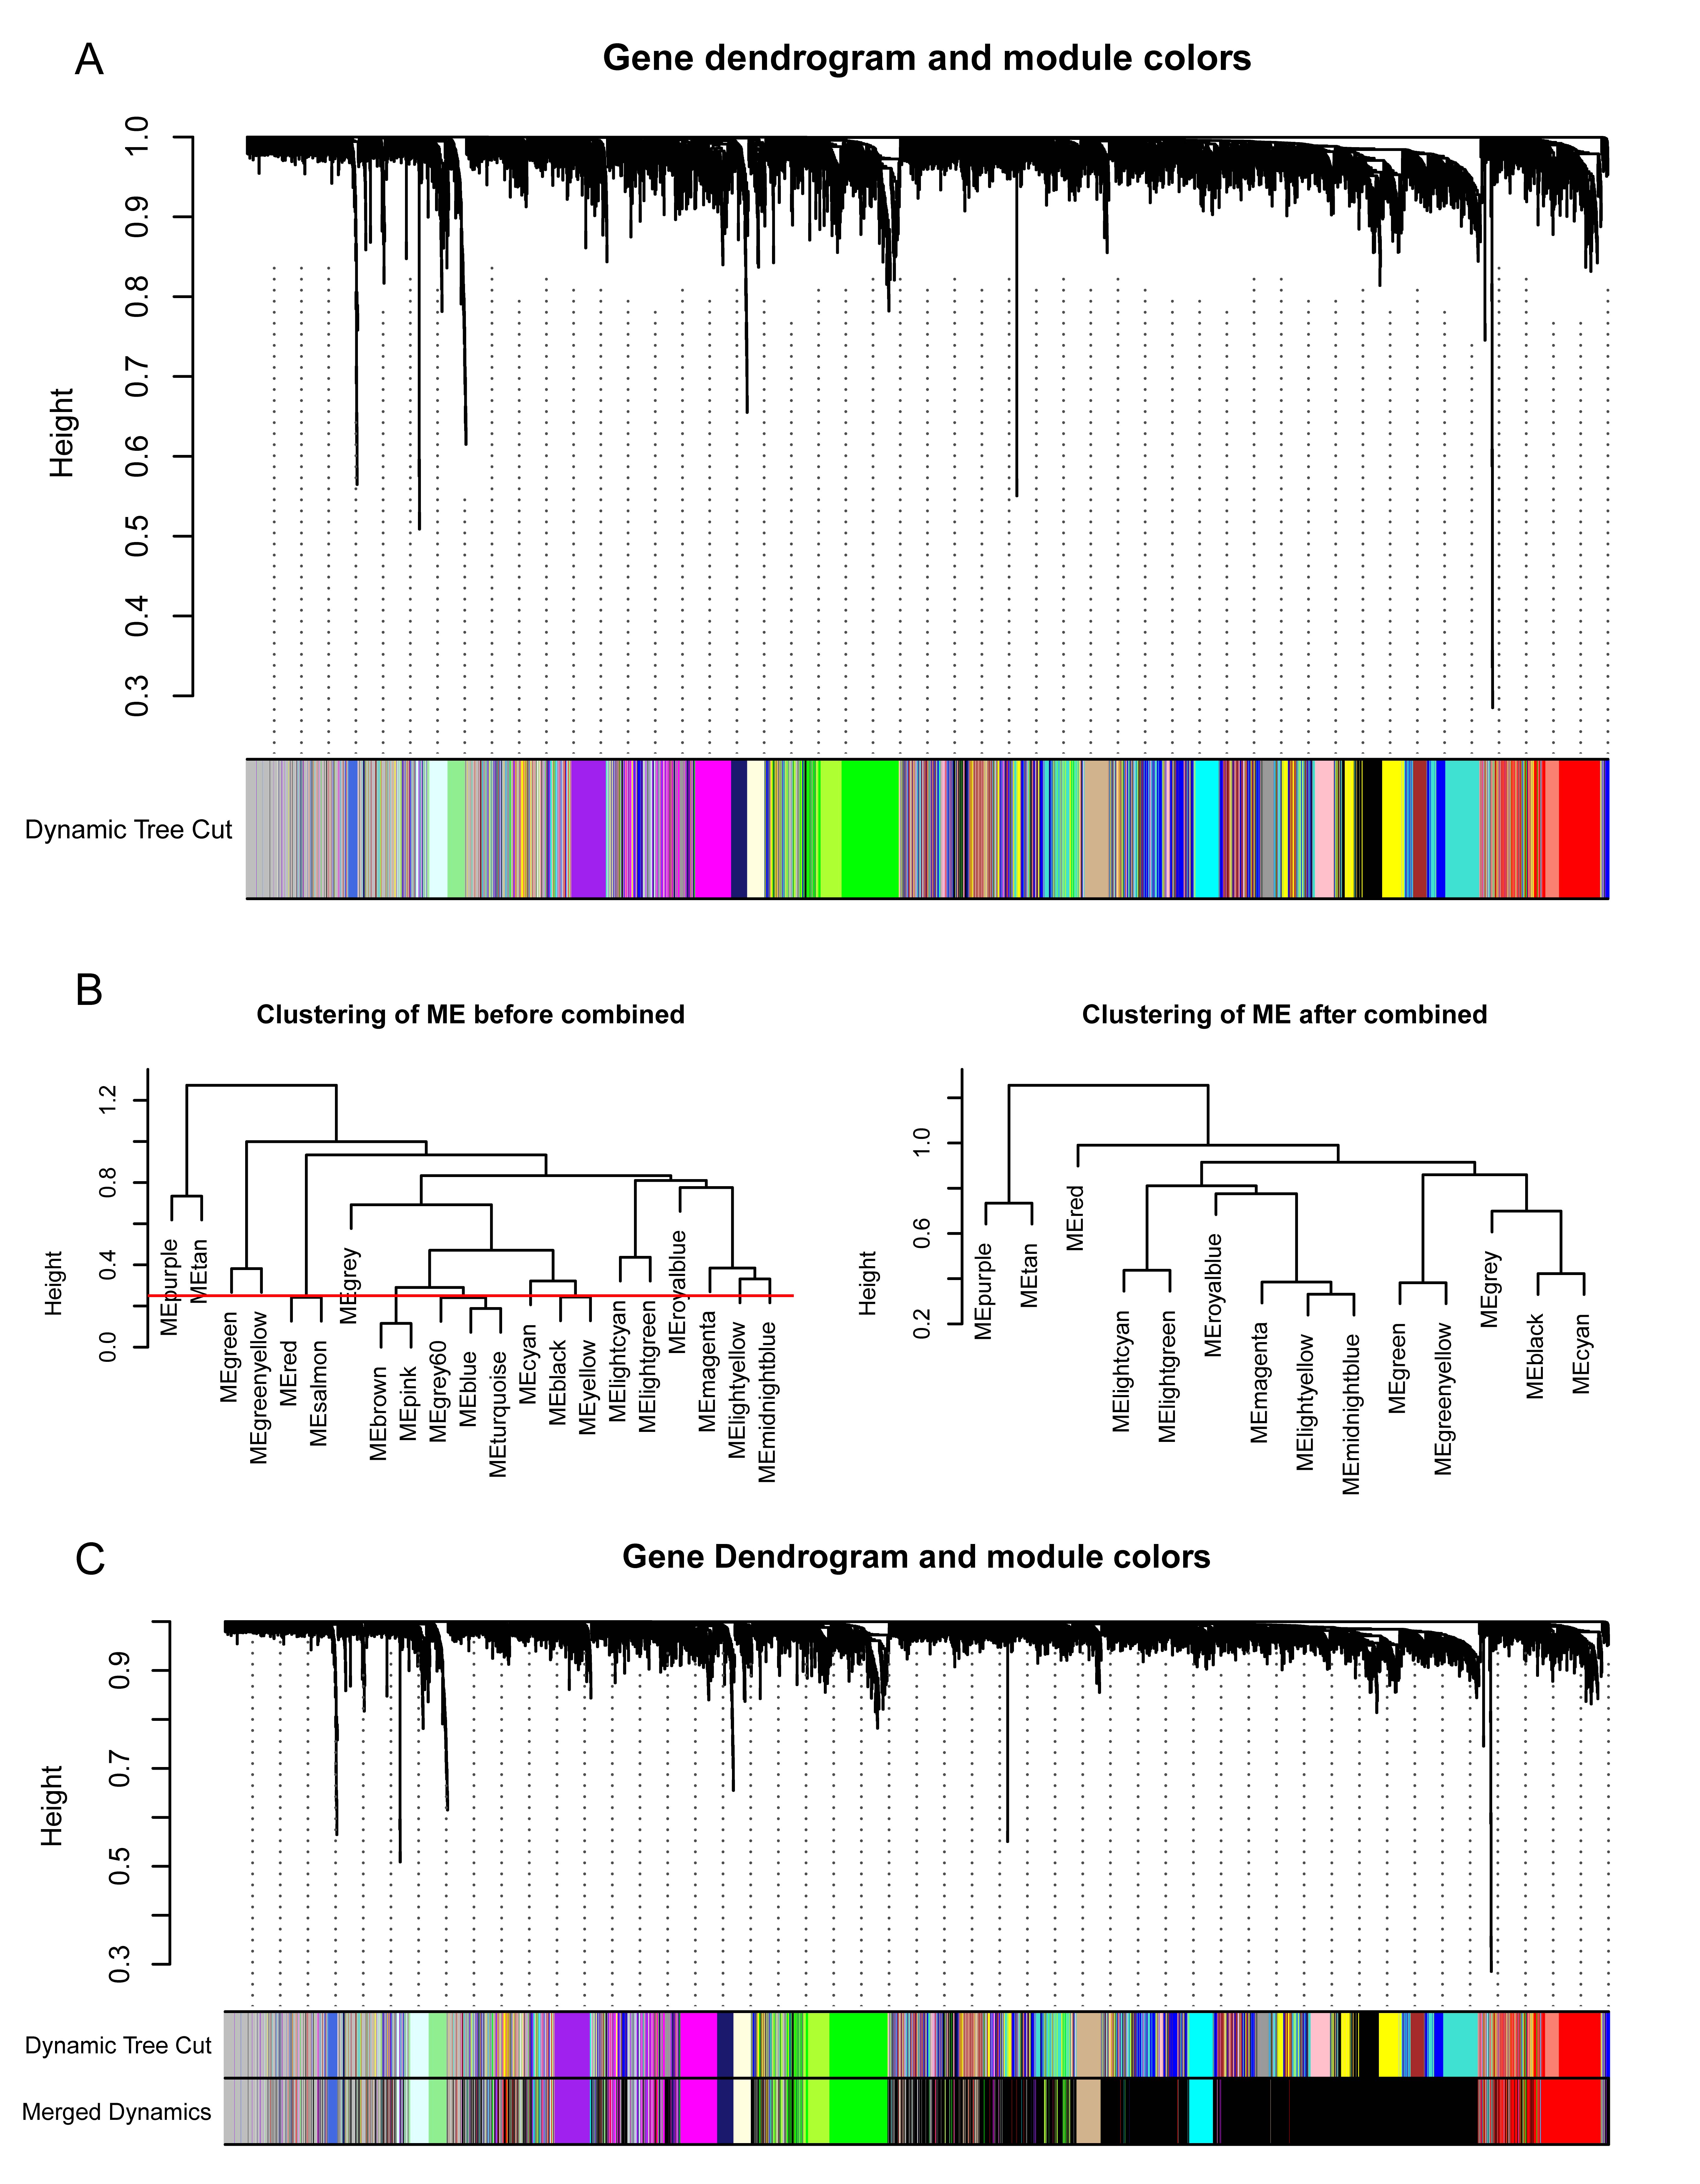 Fig. 4.
Construction of weighted gene co-expression network of AF-VHD and SR-VHD samples. (A) Gene dendrograms and modules were acquired using average linkage hierarchical clustering with dissimilarity according to topological overlap. Color beneath each row is a reflection of module assignment; there are different colors for different modules. (B) Dendrogram clustering was performed with 0.25 as height to identify similar modules. (C) After dynamic tree cutting and merging, 14 gene modules were obtained.
The module-trait relationships illustrate the correlation between the available
clinical features (disease status, tissue site) and each module in GSE115574 by
calculating the value of MS (Fig. 5A). Notably, the ME of the cyan module (r =
0.54, p = 1
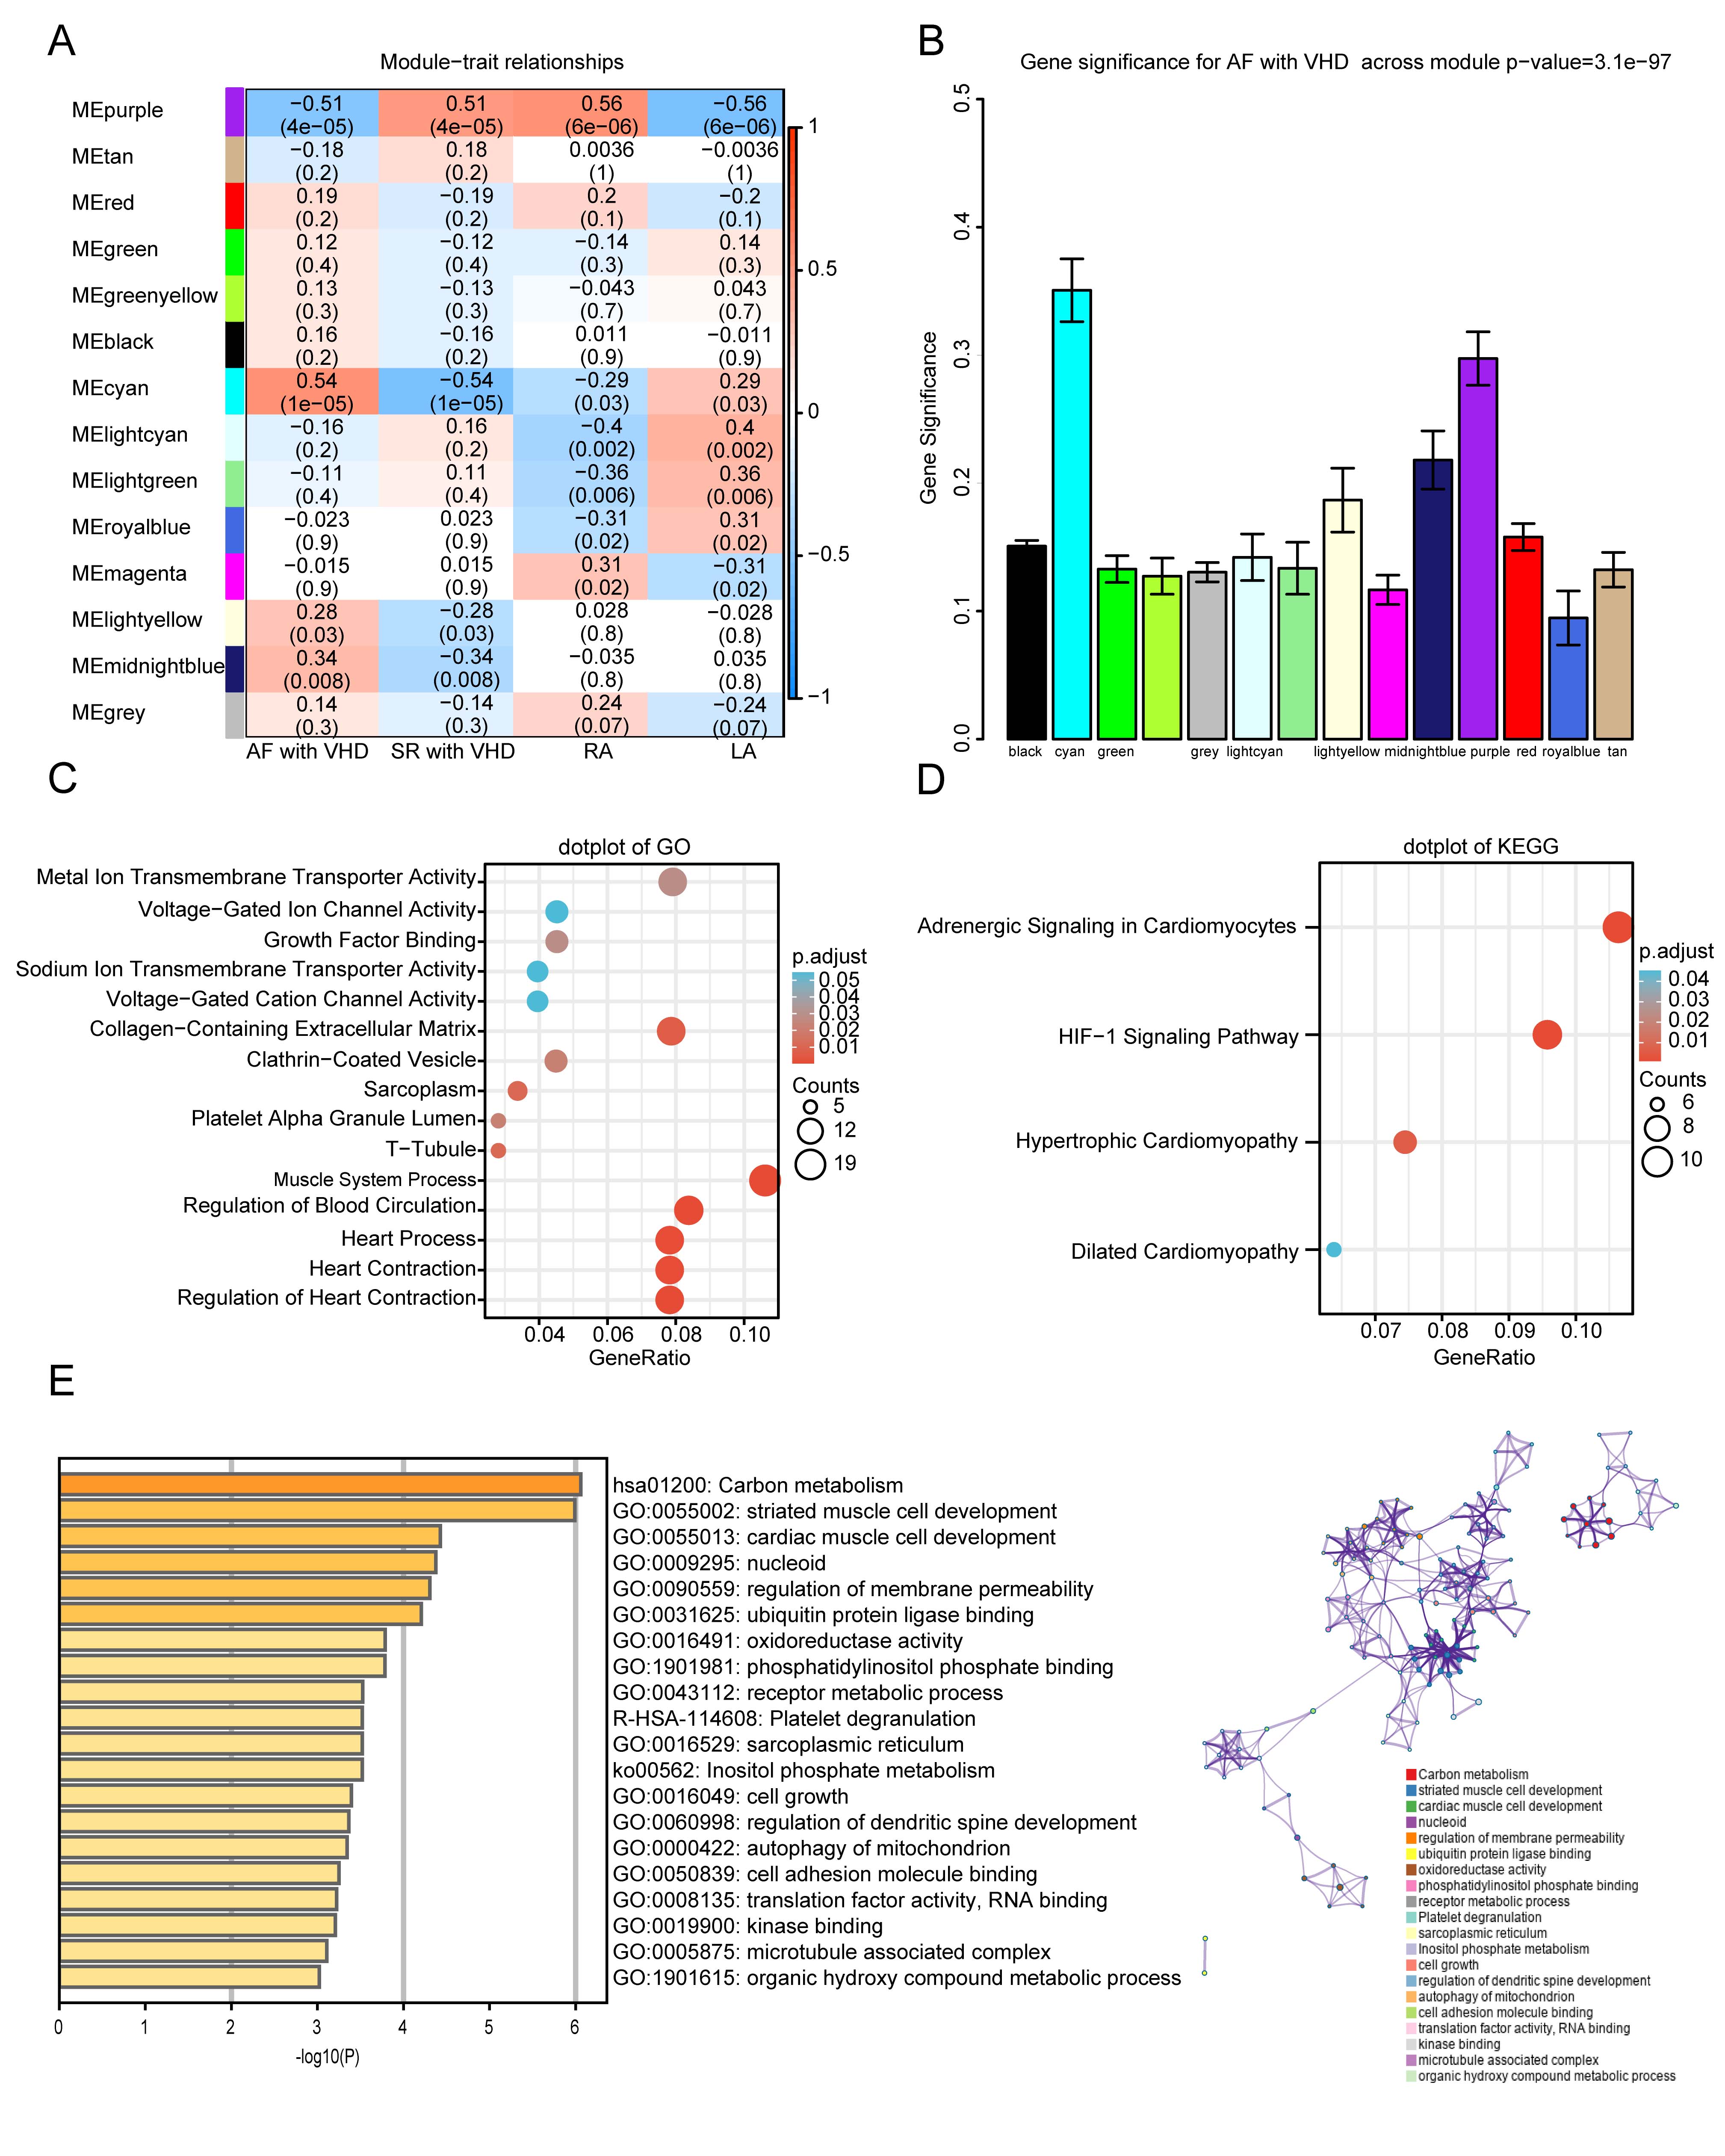 Fig. 5.
Functional enrichment of the key module. (A)
Module-trait relationship plot. There is one row for each
module eigengene and one column for each trait. Correlation coefficients and
p-values are displayed in each cell. Red represents a positive
correlation, and blue represents a negative correlation. RA, right atrium; LA,
left atrium. (B) Bar plot of module significance (MS) defined
as the average absolute value of gene significance (GS) for all genes in a
module. The cyan and purple modules are the most promising. (C,D) GO enrichment
and KEGG analyses for purple module. (C) Top five
GO category terms of biological process (BP), cellular component (CC), and
molecular function (MF) were identified. (D) Top four terms of KEGG analysis. A
p-value (adjusted)
 Fig. 6.
Identification of hub genes in the key module. (A) Scatterplot of disease status for gene
significance (GS) vs. disease status for module membership (MM) in cyan module.
(B) Scatterplot of GS vs. MM for purple module. Hub genes were screened based on
the following criteria: GS
GO and KEGG analyses were performed to gain a deeper understanding of the biological functions of genes in the cyan and purple modules. The GO results showed that genes in the purple module were mainly clustered in MF, CC, and BP, including “metal ion transmembrane transporter activity”, “voltage-gated ion channel activity”, “sarcoplasm”, “T-tubule”, “muscle system process”, “regulation of blood circulation”, and “regulation of heart contraction” (Fig. 5C). In addition, KEGG analysis of genes in the purple modules showed that they were mainly enriched in the following terms: adrenergic signaling in cardiomyocytes, HIF-1 signaling pathway, hypertrophic cardiomyopathy, and dilated cardiomyopathy (Fig. 5D). The top five terms from the Metascape analysis of the cyan module included carbon metabolism, striated muscle cell development, cardiac muscle cell development, nucleoid, and regulation of membrane permeability. The top 20 cluster-enriched sets are shown in Fig. 5E.
In order to screen the candidate hub genes for further analysis, DEGs of the combined datasets (GSE115574, GSE41177, GSE79768, and GSE41177) were overlapped with the hub genes in the key modules using a Venn diagram. A total of 15 candidate hub genes were identified (Fig. 7A). They were mainly enriched in the Mitogen-Activated Protein Kinase (MAPK) signaling pathway (gene ratio 4/10), arrhythmogenic right ventricular cardiomyopathy (gene ratio 3/10), dilated cardiomyopathy, cardiac muscle contraction (gene ratio 2/10), structural constituent of muscle, calcium channel activity (gene ratio 4/14), and calcium ion transmembrane transporter activity (gene ratio 3/14; Fig. 7B). To determine which TFs and miRNAs may be responsible for the altered candidate hub gene expression, transcription factor and miRNA analyses were performed using NetworkAnalyst. A total of 61 TFs and 96 miRNAs were identified (Fig. 7C). The correlation between 11 hub genes was determined using Spearman’s rank test. A positive correlation was observed between CSRP3 and SLC25A5 (Fig. 7D).
 Fig. 7.
Overlap of genes in key modules with DEGs and construction of TF-miRNA networks. (A) Venn diagram represents unique and shared genes between common DEGs in merged datasets and hub genes in WGCNA. A total of 15 candidate hub genes were identified. (B) Functional enrichment analysis of candidate hub genes. (C) TF-miRNA regulatory network. Red rectangle represents hub genes, blue V represents TFs, and green triangle represents miRNAs. (D) Heatmap with Spearman’s correlations among 11 hub genes.
Lasso and RF analyses were performed to screen signatures within 15 candidate
hub genes in AF-VHD. First, the Lasso algorithm identified ten
signatures—CSRP3, MCOLN3, SLC25A5, FIBP,
ABCF1, ACTN2, ASTN2, CACNA2D2,
OTOGL, and DUSP3—under the condition of the best penalty
parameter (
 Fig. 8.
Identification of real hub gene signatures using machine
learning. (A) Lasso coefficient profiles of the key genes in AF-VHD. Coefficients
are illustrated via corresponding fraction deviance. (B) Selection of tuning
parameter in Lasso regression models. This is a plot of the
binomial deviance metrics (the y-axis) against log(
The ROC analysis was conducted to further validate the diagnostic value of the hub genes in merged datasets. The results demonstrated that CSRP3 (Area Under Curve, AUC 0.843), MCOLN3 (AUC 0.771), SLC25A5 (AUC 0.795), and FIBP (AUC 0.735) had a general ability to discriminate between AF with VHD and SR with VHD (Fig. 9A). Multiple biomarkers were combined as a sensitive screening index for AF-VHD in order to improve the diagnosis sensitivity. A combined diagnosis model of four vital genes was used to show that the AUC value of AF-VHD reached 0.866 (95% confidence interval (CI): 0.798–0.935; Fig. 9B). Calibration curves revealed that the diagnosis model had a good performance when predicting AF-VHD incidence (Fig. 9C). The blue line in the DCA curve remained above the gray and black lines between 0 and 0.8, implying that decisions based on the diagnosis model may be beneficial to AF-VHD patients (Fig. 9D). A nomogram was established using the RMS package for the diagnosis of AF-VHD based on the four crucial genes (CSRP3, MCOLN3, SLC25A5 and FIBP) (Fig. 9E).
 Fig. 9.
Identification of crucial genes and evaluation of their clinical
significance. (A) ROC analysis for individual
MCOLN3, CSRP3, SLC25A5, and FIBP genes in
AF-VHD vs. SR-VHD in merged datasets. (B) Estimation of clinical diagnostic
efficacy of four crucial gene signature (AUC = 0.866, 95% CI = 0798–0.935)
(Logistic regression model = –20.0615 + 1.838
Four genes were selected to calculate the risk score according to their
coefficients, where risk score = –20.0615 + 1.838
 Fig. 10.
CSRP3 is specifically expressed in the heart. (A) Risk score distribution, disease status, and gene expression values of final predictors in the combined datasets. Dotted black line represents the median risk score cutoffs for classifying patients as high- or low-risk. Blue dots represent SR-VHD, and red dots represent AF-VHD. Heatmap showing gene expression values for corresponding sample. (B) Risk score differences between SR-VHD and AF-VHD. (C,D) CSRP3 and MCOLN3 protein expression levels were analyzed and quantified in atrial tissue from AF-VHD and SR-VHD patients. (E) In human tissue, CSRP3 expression was predominantly found in heart and skeletal muscle. (F) The mRNA levels of CSRP3 expression in different cell types showed that CSRP3 was mainly expressed in cardiomyocytes.
AF is one of the most common tachyarrhythmias observed in the clinic. It increases patient morbidity and mortality, imposes an economic burden on patients, and seriously affects their quality of life [32]. VHD dramatically increases the risk of AF [33, 34]. Nevertheless, the mechanism for development of VHD into AF-VHD is still not completely understood. Therefore, it is essential to investigate the progression of AF-VHD and to identify specific biomarkers and potential therapeutic targets.
Based on previous studies, it has been shown that immune infiltration and atrial fibrosis are involved in the pathophysiological process of AF-VHD [8, 9, 10]. However, despite much work in this field, accurate and specific diagnostic biomarkers for AF-VHD are lacking. Our study identified four such biomarkers: CSRP3, MCOLN3, SLC25A5, and FIBP. CSRP3 and MCOLN3 in particular have important biological and clinical implications.
Microtubule-associated
protein CSRP3, affiliated with the
cysteine-rich protein (CSRP/CRP) family, is expressed
in both cardiac and muscle tissue. CSRP3 plays a pivotal role in the
development and maintenance of cardiac cytoarchitectural organization [35, 36].
It was found to be differentially expressed in AF-VHD and
potentially related to myocardial contractility [7]. Evidence
has shown that CSRP3 mutations can result in both hypertrophic
cardiomyopathy (HCM) and dilated cardiomyopathy (DCM) in patients [34, 35]. HCM
and DCM have been shown to be related to the occurrence and development of AF,
which indirectly revealed that CSRP3 might be connected to the
development of AF-VHD. Li et al. [36] also
demonstrated that cardiomyocytes derived from human embryonic
stem cells with CSRP3 deficiency mimic heart failure (HF) 30 days after
differentiation, increasing reactive oxygen species generation and exhibiting
mitochondrial damage and impaired Ca
SLC25A5, also known as ANC3 or ANT2, is a member of the mitochondrial carrier subfamily of solute carrier protein genes. SLC25A5 is highly expressed in high energetic demand organs, such as the heart, kidney, liver, and spleen, contributing to mitochondrial energy metabolism regulation and apoptosis prevention [37, 38]. However, the role of SLC25A5 in AF is unknown. In our study, we found that SLC25A5 is positively correlated with CSRP3, indicating that SLC25A5 might also participate in the process of myocardial hypertrophy.
MCOLN3, also known as
TRPML3, is a gene with the highest correlation with AF-VHD among the
crucial genes. MCOLN3/TRPML3 is a
cation channel permeable to Ca
FIBP interacts directly with the fibroblast growth factor 1 (FGF1) [42]. FIBP is known to be involved in the FGF receptor signaling pathway and platelet aggregation [42, 43]. Although few studies have reported on the effect of FIBP on AF or VHD, Lu et al. [44] demonstrated that FGF1 might be involved in AF via modification of oxidative stress and sodium/calcium homeostasis, suggesting that FIBP may genetically interact with FGF1 to regulate the development of AF.
Our study has some limitations. First, due to the limited sample size derived from the public database, further research with a larger sample size should be conducted to strengthen the conclusion. Second, the biological and molecular functions of these molecules will need to be determined through further experimental studies.
In ysummary, four crucial genes (CSRP3, MCOLN3, SLC25A5, and FIBP) associated with development of AF-VHD were identified using comprehensive bioinformatics yanalysis. Based on their biological function and clinical value, these genes may be associated with the pathophysiological process of AF-VHD. These findings can facilitate the diagnosis and development of novel therapeutic targets for clinical disorders involving AF-VHD.
The raw datasets were available from the GEO database (http://www.ncbi.nlm.nih.gov/geo/; GSE115574, GSE41177, GSE79768 and GSE14975).
Conception and design—QL, SL, YX and FR; Collection and assembly of data—QL, SL, XL, JH and YF; Data analysis and interpretation—QL, YL and HY; Manuscript writing—QL, SL, XL, JH, YF, HY, YL, CD, SW, YX and FR. All authors read and approved the final manuscript.
The authors are accountable for aspects of the work in ensuring that questions related to the accuracy or integrity of any part of the work are appropriately investigated and resolved. The studies involving human participants were reviewed and approved by the ethics committee of Guangdong General Hospital, Guangdong Academy of Medical Sciences (No. GDREC2017111H). The patients/participants provided their written informed consent to participate in this study.
This study used data or information from the GEO database. We thanked the GEO database for the provided data.
This work was supported by grants from the National Natural Science Foundation of China (Nos. 81870254 and 81670314), and the High-level Hospital Construction Plan (No. DFJH201808 and DFJH201925).
The authors declare no conflict of interest.
Publisher’s Note: IMR Press stays neutral with regard to jurisdictional claims in published maps and institutional affiliations.