
Academic Editor: Dinesh Kalra
Background: Patients with severe aortic valve stenosis (AS) frequently
present with pulmonary hypertension (PH). The gold standard for detection of
pulmonary hypertension is right heart catheterization, which is not routinely
performed as a preoperative standard in cardiology centers today, neither before
surgical valve replacement nor before transcatheter aortic valve replacement
(TAVR) procedure. Echocardiographic determination of systolic pulmonary artery
pressure (sPAP) provides an opportunity to assess the presence or absence of PH.
The aim of the present study was to investigate the extent to which plasma levels
of common cardiovascular biomarkers behave in patients with severe AS and an sPAP
In 48–75% of patients, severe aortic valve stenosis (AS) is associated with pulmonary hypertension (PH), limiting the long-term survival of these patients [1, 2, 3, 4]. The pathophysiological cause is progressive concentric hypertrophy of the left ventricle, which leads to a decrease of compliance and relaxation, thus limiting diastolic function. This leads to an increase of enddiastolic left ventricular filling pressure and subsequently an increase of pulmonary venous pressure. In the course of the disease this may be further aggravated by secondary mitral regurgitation. This causes a so-called vascular remodeling and thus a consecutive pressure increase in the pulmonary arteries, the post-capillary PH.
According to current European Society for Cardiology (ESC) guidelines [5], the
gold standard for the detection of PH is and remains invasive right heart
catheterization with determination of mean pulmonary artery pressure (mPAP) and
pulmonary artery wedge pressure (PAWP). By definition, PH is not present if mPAP
Echocardiography plays a crucial role in obtaining non-invasive information
about the possible presence of PH. As a measure of the existence of PH, systolic
pressure gradient derived over a tricuspid valve regurgitation, plus estimated
right atrial pressure (RAP), provide information. A systolic pulmonary artery
pressure (sPAP)
To strengthen the significance of sPAP as an important non-invasive parameter,
in the present study, patients with severe AS planned for TAVR procedure were
examined echocadiographically for the potential presence of PH (sPAP
Suppression of tumorigenicity (ST2) belongs to the Toll-like/IL-1 receptor family and exists in two different forms, one as a transmembrane form (ST2L) and the other as a soluble form (sST2) [7]. ST2L interacts with IL-33 as a ligand-receptor complex and acts in a complex signaling cascade against cardiac remodeling and fibrotic remodeling processes. However, high mechanical stress responses in the heart and lungs result in increased secretion of sST2 from alveolar epithelial cells and cardiac myocytes. These bind with higher affinity to Interleukin (IL)-33 and thus prevent cardioprotective signaling. High plasma sST2 levels are therefore associated with an increased risk of adverse outcomes in patients with severe AS, heart failure and PH [8, 9].
GDF-15 is a member of the transforming growth factor-beta (TGF-
H-FABP is a cytoplasmic protein secreted by cardiomyocytes in the context of acute ischemic heart disease. At the molecular level, H-FABP is involved in lipid metabolism, transporting fatty acids from the cell membrane to mitochondria for eventual oxidation [14]. This biomarker has already found its way into clinical practice, as it is already available as a rapid test to diagnose myocardial infarction at an earlier stage [15].
IGF-BP2 is an important member of the insulin-like growth factor family regulating the activity of the insulin-like growth factor (IGF) in most tissues and organs including liver, heart, CNS and reproductive organs [16]. IGF-BP2 exerts an inhibitory effect on the growth hormone IGF-1, which has a cardioprotective function by downregulating the renin-angiotensin-aldosterone system [17]. Elevated IGF-BP2 levels, through IGF-1 inhibition, thus lead to a consecutive unopposed renin-angiotensin-aldosterone effect, resulting in cardiac remodeling and left ventricular dysfunction [18].
suPAR is the soluble form of the cell membrane protein urokinase-type Plasminogen Activator Receptor (uPAR), is released into the blood during inflammation of any kind and therefore provides information about inflammatory activity in the human body. Numerous studies have described increased plasma concentrations in patients with coronary heart disease, myocardial infarction and chronic heart failure [19].
BNP is a cardiac hormone, which is released by cardiomyocytes in the course of stretching processes of the left ventricle. Especially in patients with pressure and volume overload, the plasma concentration of BNP is significantly increased. Evidence based, it is already handled as a relevant heart failure biomarker in clinical practice. Patients with moderate to severe AS showed significantly increased mortality at higher BNP plasma concentrations compared to patients with baseline BNP at follow-up [20].
Troponin is a relevant protein complex consisting primarily of three subunits. Two of them, troponin T and troponin I are specifically formed in the myocardium and are relevantly involved in the interaction of actin and myosin filaments. Any form of damage to cardiac myocytes will result in increased release of troponin. This is exploited clinically for early detection of myocardial infarction [21].
Between 2016 and 2018, 179 patients with severe, primary degenerative AS planning for TAVR procedure were enrolled in current study. Corresponding data analyses were performed at Paracelsus Medical University Hospital Salzburg and Kepler University Hospital Linz in accordance to to principles of the Declaration of Helsinki and Good Clinical Practice.
Transthoracic echocardiography was performed using common ultrasound devices
(iE33 and Epiq 5; Philips Healthcare, Hamburg, Germany). Severe AS was classified
according to current valid guidelines of European Society for Cardiology
measuring. An AV Vmax (maximal velocity over aortic valve) of 4.0 m/s, an AV
dpmean (mean pressure gradient over aortic valve)
Blood samples were obtained on the day of hospitalization and thus one day before the actual TAVR procedure under fasting conditions using a vacuum-containing system. The collection tubes were centrifuged, the plasma obtained was separated from the blood components and then frozen at –80 °C to analyze the total of 179 samples at similar time points under same conditions.
Plasma levels of sST2, GDF-15, H-FABP, IGF-BP2 and suPAR were measured by using enzyme-linked immunosorbent assay (ELISA) kits (sST2: Duoset DY523, GDF-15: DY957, H-FABP: DY1678, IGF-BP2: DY674, suPAR: DY807, R&D Systems, Minneapolis, MN, USA). Instructions of the manufactures were performed for adequate preparation of reagents. In summary, serum samples and standard protein were loaded onto the wells of ELISA plates (Nunc MaxiSorp flat-bottom 96 well plates, VWR International GmbH, Vienna, Austria) and incubated for two hours. The plates were treated with Tween 20/PBS solution (Sigma Aldrich, St. Louis, MO, USA) and subsequently a biotin-labeled antibody was added. The subsequent incubation time was another two hours. A washing process again was performed and streptavidin-horesradish-peroxidase solution was added to the wells. A color reaction was generated after adding tetramethylbenzidine (TMB; Sigma Aldrich, St. Louis, MO, USA). Optical density was determined at 450 nm on an ELISA plate-reader (iMark Microplate Absorbance Reader, Bio-Rad Laboratories, Vienna, Austria).
Statistical analysis was performed using SPSS (Version 25.0, SPSS Inc., Armonk, NY, USA).
First of all, the Kolmogorov-Smirnov test was applied to test variables for
normal distribution. Normally distributed metric data was expressed as mean
To determine an optimal cut-off value of examined cardiovascular biomarkers
according to a prediction of an sPAP
Correlation analysis was performed using Pearson’s rank-correlation coefficient to draw conclusions about a relationship between echocardiographic sPAP and cardiovascular biomarkers.
Kaplan-Meier curves were carried out to detect overall 1-year survival of
patients in dependence of sPAP, whereby the currently accepted classification
into three severity levels (I: sPAP
At last, a univariate Cox proportional hazard regression model was used to
calculate hazard ratio (HR) and 95% confidence interval (CI) for several
influencing factors associated with 1-year-mortality in patients undergoing TAVR
procedure. For better comparability, a z-transformation was absolved for metric
data. Afterwards, multivariate Cox regression was performed to assess independent
predictors of mortality. Therefore, again covariates associated with mortality in
the univariate analysis (p
A p-value
A total of 179 patients with severe AS from the University Hospitals of Salzburg
and Linz were included in the study. Echocardiographically, 82 patients (45.8%)
showed an sPAP
Table 1 shows the collected baseline characteristics of the overall cohort as
well as those of the classification into patients with sPAP
| Overall cohort | sPAP |
sPAP |
|||||
| n = 179 | n = 82 | n = 97 | |||||
| Clinical data | p-value | ||||||
| Age (years) - mean |
82.7 | 4.8 | 81.6 | 4.8 | 83.7 | 4.6 | 0.277 |
| Gender (male) - % | 50.8 | 51.2 | 50.5 | 0.925 | |||
| Weight (kg) - mean |
71.5 | 11.1 | 73.1 | 14.8 | 70.6 | 6.0 | 0.003 |
| Height (cm) - mean |
166.2 | 7.3 | 165.1 | 9.2 | 166.8 | 3.0 | 0.556 |
| BMI (kg/m |
25.9 | 3.7 | 27.1 | 4.5 | 25.1 | 3.0 | 0.518 |
| NYHA - median |
3.0 | 1.0 | 3.0 | 1.0 | 3.0 | 0.8 | 0.122 |
| STSScore - mean |
3.0 | 1.5 | 2.6 | 1.3 | 3.3 | 1.5 | 0.025 |
| Concomitant disease | p-value | ||||||
| Diabetes mellitus - % | 23.5 | 20.7 | 25.8 | 0.428 | |||
| Arterial Hypertension - % | 78.8 | 76.8 | 80.4 | 0.559 | |||
| CVD - % | 72.1 | 73.2 | 71.1 | 0.847 | |||
| CVD - 1 vessel - % | 23.5 | 24.4 | 22.7 | 0.891 | |||
| CVD - 2 vessels - % | 8.4 | 4.9 | 11.3 | 0.103 | |||
| CVD - 3 vessels - % | 11.7 | 9.8 | 13.4 | 0.398 | |||
| Myocardial infarction - % | 3.4 | 2.4 | 4.1 | 0.542 | |||
| Atrial fibrillation - % | 38.0 | 28.0 | 46.4 | 0.012 | |||
| Pacemaker - % | 6.7 | 4.9 | 8.2 | 0.369 | |||
| Malignancy - % | 21.2 | 24.4 | 18.6 | 0.342 | |||
| Stroke - % | 6.7 | 6.1 | 7.2 | 0.768 | |||
| pAVK - % | 5.6 | 3.7 | 7.2 | 0.302 | |||
| COPD - % | 9.5 | 8.5 | 10.3 | 0.687 | |||
| Echocardiography | p-value | ||||||
| LVEF (%) - mean |
55.0 | 10.9 | 56.7 | 8.6 | 53.6 | 12.4 | 0.054 |
| LVEDD (mm) - mean |
5.1 | 4.1 | 4.6 | 0.7 | 5.4 | 5.2 | 0.402 |
| IVSd (mm) - mean |
15.0 | 3.0 | 14.9 | 3.0 | 15.0 | 2.9 | 0.761 |
| AV Vmax (m/s) - mean |
4.6 | 3.0 | 4.4 | 0.6 | 4.9 | 4.2 | 0.301 |
| AV dPmean (mmHg) - mean |
49.5 | 12.6 | 48.4 | 11.8 | 50.5 | 13.3 | 0.300 |
| AV dPmax (mmHg) - mean |
79.5 | 19.4 | 78.2 | 18.0 | 80.7 | 20.7 | 0.407 |
| TAPSE (mm) - mean |
21.7 | 3.8 | 23.1 | 3.2 | 20.8 | 3.9 | 0.008 |
| AVI |
16.2 | 17.1 | 15.5 | 0.868 | |||
| MVI |
25.1 | 15.9 | 33.0 | 0.009 | |||
| TVI |
18.4 | 6.1 | 28.9 | ||||
| Laboratory data | p-value | ||||||
| Creatinine (mg/dL) - median |
1.0 | 0.4 | 0.9 | 0.3 | 1.1 | 0.5 | 0.015 |
| BNP (pg/mL) - median |
2020.0 | 3879.2 | 1195 | 1024.2 | 3369 | 4978 | |
| cTnI (pg/mL) - median |
23.0 | 19.8 | 16.0 | 13.5 | 27.0 | 18.5 | 0.039 |
| Hkt (%) - median |
38.2 | 8.9 | 41.2 | 6.7 | 37.4 | 8.9 | 0.019 |
| Hb (g/dL) - median |
12.7 | 2.5 | 13.1 | 2.3 | 12.3 | 3.2 | 0.014 |
| CK (U/L) - median |
59.0 | 73.0 | 74.0 | 117.0 | 59.0 | 68.8 | 0.220 |
| sST2 (pg/mL) - median |
13847.7 | 8084.5 | 11563.7 | 6708.6 | 16467.1 | 10606.6 | 0.010 |
| GDF-15 (pg/mL) - median |
638.8 | 1000.4 | 357.2 | 683.2 | 785.9 | 1034.8 | 0.005 |
| H-FABP (ng/mL) - median |
0.5 | 1.9 | 0.4 | 1.3 | 0.5 | 2.4 | 0.069 |
| IGF-BP2 (pg/mL) - median |
145518.7 | 150848.9 | 94235.2 | 137450.8 | 203352.4 | 169893.4 | 0.029 |
| suPAR (pg/mL) - median |
3458.1 | 1682.7 | 3000.5 | 1127.4 | 3951.6 | 1468.3 | 0.018 |
| sPAP, systolic pulmonary artery pressure; BMI, body mass index; CVD, cardiovascular disease; LVEF, left ventricular ejection fraction; LVEDD, left ventricular end-diastolic diameter; IVSd, interventricular septal thickness at diastole; AV Vmax, maximal velocity over aortic valve; AV dpmean, mean pressure gradient over aortic valve; AV dpmax, maximal pressure gradient over aortic valve; TAPSE, tricuspid annular plane systolic excursion; AVI, aortic valve insufficiency; MVI, mitral valve insufficiency; TVI, tricuspid valve insufficiency; BNP, brain natriuretic peptide; cTnI, cardiac Troponin I; CK, creatine kinase; sST2, soluble suppression of tumorigenicity-2; GDF-15, growth/fifferentiation of factor-15; H-FABP, heart-type fatty-acid binding protein; IGF-BP2, insulin like growth factor binding protein 2; suPAR, soluble urokinase-type plasminogen activator receptor; SD, standard deviation; IQR, interquartile range. | |||||||
The overall cohort had a mean age of 82.7
Patients with an sPAP
Fig. 1 provides an overview of the corresponding plasma concentrations of the
determined cardiovascular biomarkers depending on the sPAP obtained (
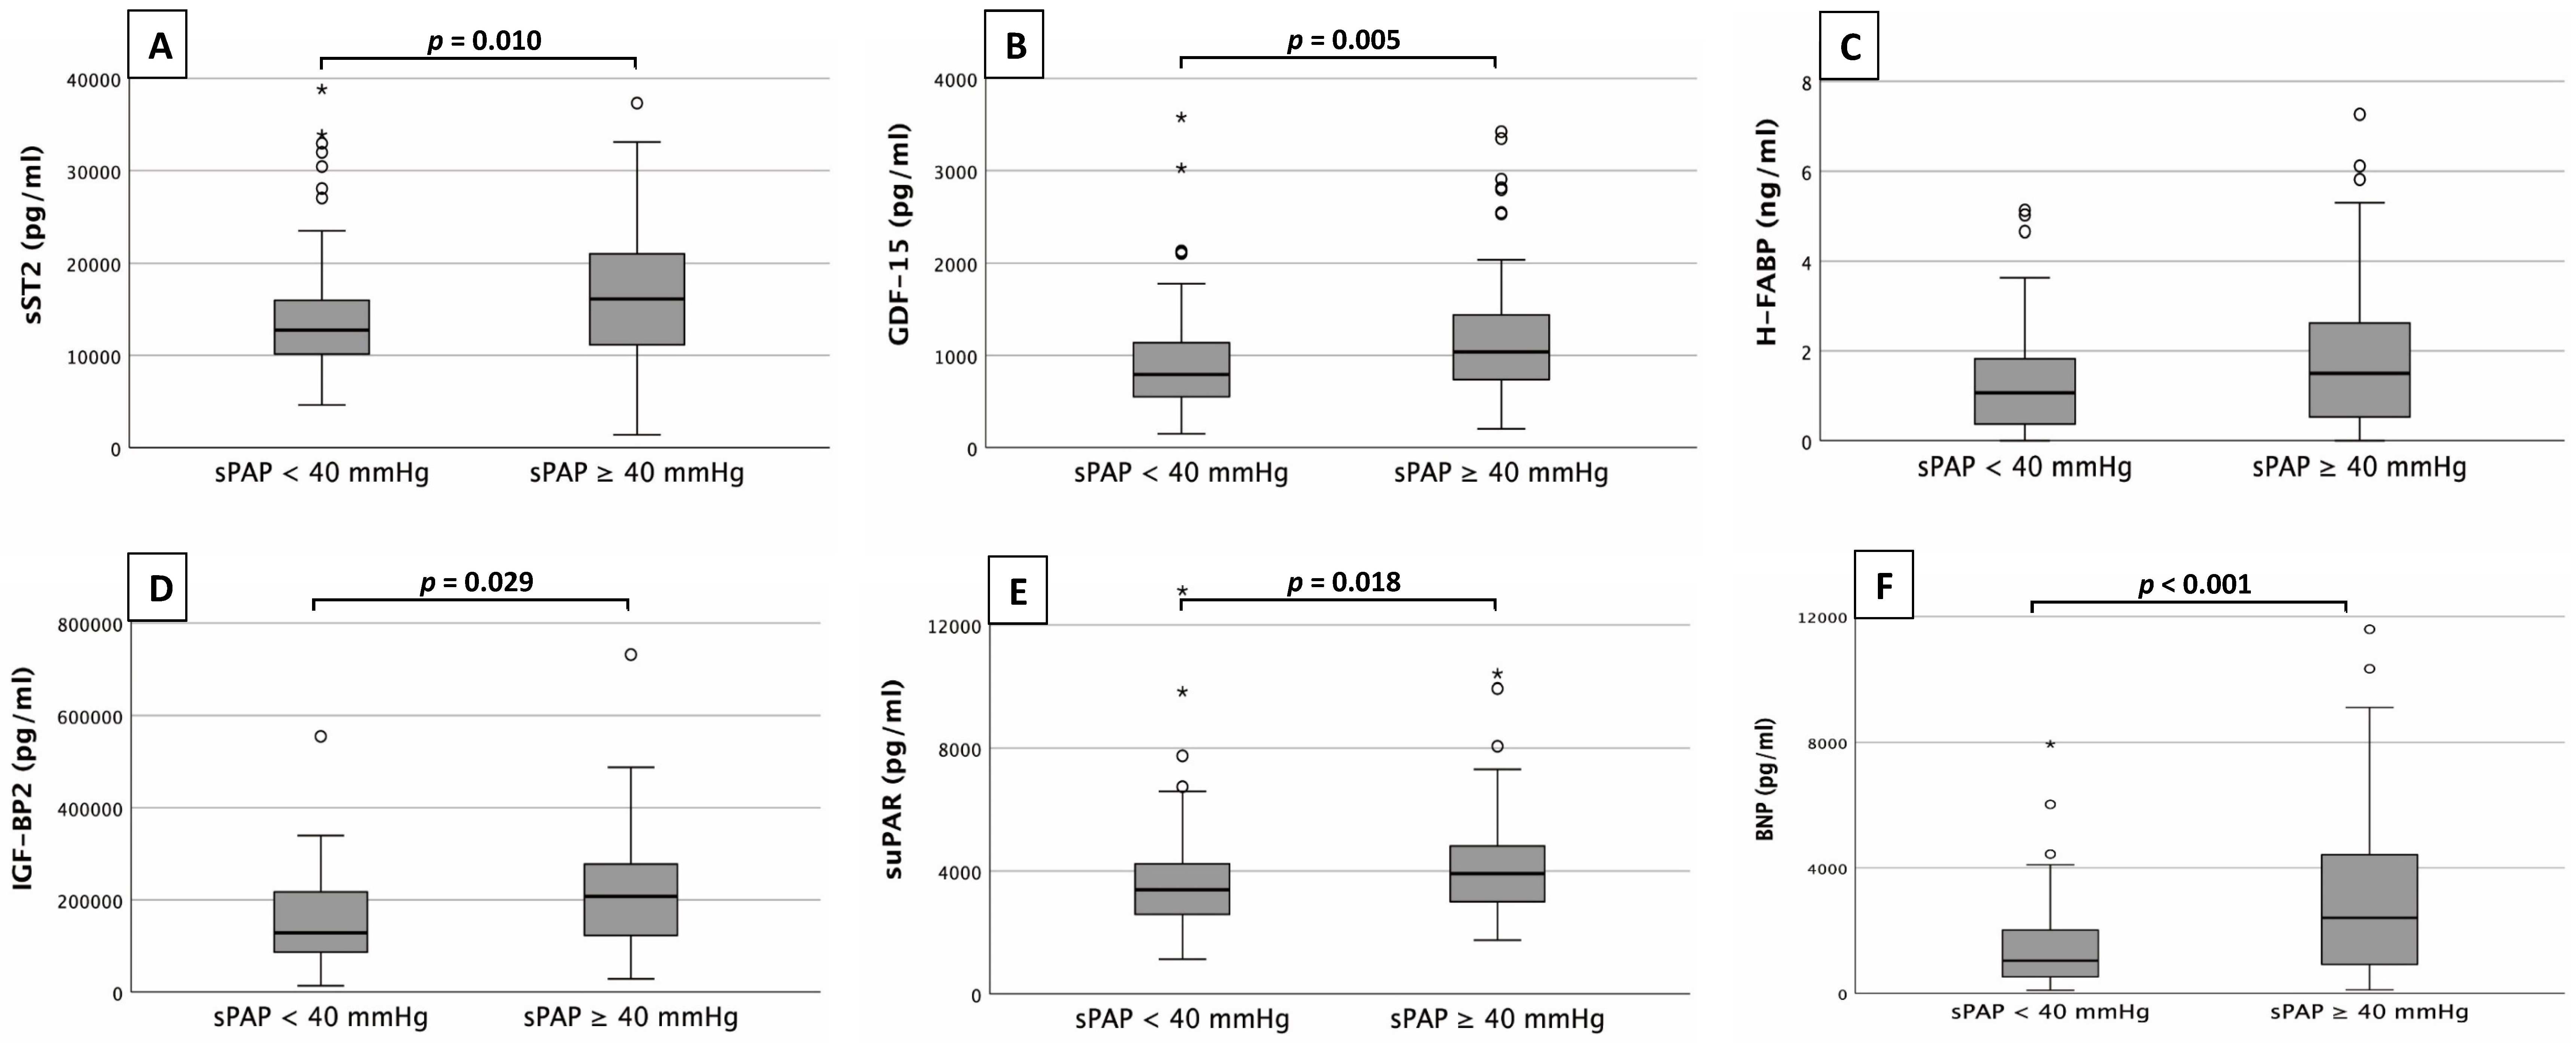 Fig. 1.
Biomarker analysis. Serum concentrations of sST2 (A),
GDF-15 (B), H-FABP (C), IGF-BP2 (D), suPAR (E)
and BNP (F) in patients with an sPAP
sST2 (Fig. 1A) showed significantly higher plasma concentrations in patients
with an sPAP
Only H-FABP (Fig. 1C) did not show significant differences between the sPAP
groups (0.5
To analyze sST2, GDF-15, H-FABP, IGF-BP2 and suPAR as potential biomarkers for
prediction of an sPAP
 Fig. 2.
AUROC analysis of biomarkers. AUROC analyses of sST2 (A), GDF-15 (B), H-FABP (C), IGF-BP2 (D), suPAR (E) and BNP (F) for prediction of sPAP
This analysis identified an sST2 plasma level (Fig. 2A) of 16045.84 pg/mL as an
optimal cut-off value concerning an sPAP
Pearson’s correlation analysis between sPAP and the corresponding biomarkers sST2, GDF-15, H-FABP, IGF-BP2, suPAR and BNP is shown in Fig. 3. Pearson’s correlation coefficient (r) was used to describe potential associations.
 Fig. 3.
Correlation of sPAP and biomarkers. Correlation analyses between sPAP and cardiovascular biomarkers of sST2 (A), GDF-15 (B), H-FABP (C), IGF-BP2 (D), suPAR (E) and BNP (F).
Correlation analysis revealed a significant, but moderate linear relationship
between sPAP and BNP (r: 0.367; p
Kaplan-Maier curves were performed with regard to 1-year survival in dependence of severity of sPAP (Fig. 4).
 Fig. 4.
Kaplan-Meier curves for detection of 1-year survival in
dependence of several risk groups. I: sPAP
Patients with an sPAP
To investigate several influencing variables concerning 1-year mortality after TAVR, a univariate and multivariate Cox proportional hazard regression was presented (Table 2).
| 1-year mortality Cox regression analysis | Univariate | Multivariable | ||
| Hazard Ratio (95% CI) | p-value | Hazard Ratio (95% CI) | p-value | |
| Age | 1.028 (0.978–1.082) | 0.278 | ||
| Gender (male) | 1.148 (0.710–1.856) | 0.574 | ||
| Weight | 1.040 (0.988–1.095) | 0.135 | ||
| BMI | 1.122 (0.960–1.312) | 0.149 | ||
| NYHA |
0.787 (0.411–1.509) | 0.471 | ||
| STS-Score | 1.161 (0.869–1.550) | 0.313 | ||
| Diabetes mellitus | 1.042 (0.595–1.827) | 0.886 | ||
| Arterial Hypertension | 1.163 (0.623–2.172) | 0.635 | ||
| CVD (all) | 1.416 (0.797–2.516) | 0.235 | ||
| CVD - 1 vessel | 1.250 (0.714–2.188) | 0.435 | ||
| CVD - 2 vessels | 0.812 (0.325–2.028) | 0.656 | ||
| CVD - 3 vessels | 0.362 (0.113–1.155) | 0.086 | 0.669 (0.075–5.971) | 0.719 |
| Myocardial infarction | 0.965 (0.236–3.942) | 0.960 | ||
| Atrial fibrillation | 1.376 (0.844–2.242) | 0.200 | ||
| Pacemaker | 1.573 (0.719–3.443) | 0.257 | ||
| Malignancy | 0.866 (0.473–1.586) | 0.641 | ||
| Stroke | 1.028 (0.374–2.825) | 0.957 | ||
| pAVK | 0.690 (0.217–2.198) | 0.531 | ||
| COPD | 1.506 (0.746–3.041) | 0.253 | ||
| LVEF | 0.997 (0.975–1.019) | 0.799 | ||
| LVEDD | 0.940 (0.619–1.428) | 0.772 | ||
| IVSd | 1.158 (1.068–1.257) | 0.962 (0.662–1.397) | 0.838 | |
| AV Vmax | 0.971 (0.833–1.132) | 0.706 | ||
| AV dpmean | 1.008 (0.989–1.028) | 0.403 | ||
| AV dpmax | 1.002 (0.990–1.015) | 0.747 | ||
| TAPSE | 0.947 (0.832–1.078) | 0.412 | ||
| sPAP | 1.020 (1.004–1.036) | 0.015 | 1.024 (0.985–1.065) | 0.238 |
| AVI |
0.648 (0.307–1.366) | 0.254 | ||
| MVI |
0.563 (0.288–1.103) | 0.094 | 0.331 (0.056–1.962) | 0.223 |
| TVI |
0.588 (0.268–1.289) | 0.185 | ||
| Creatinine | 1.403 (0.738–2.666) | 0.301 | ||
| BNP | 0.996 (0.780–1.272) | 0.975 | ||
| cTnI | 1.453 (1.099–1.921) | 0.009 | 1.598 (1.174–2.174) | 0.003 |
| Hkt | 0.981 (0.935–1.030) | 0.445 | ||
| Hb | 0.967 (0.843–1.108) | 0.626 | ||
| CK | 0.970 (0.746–1.263) | 0.823 | ||
| sST2 | 1.178 (0.935–1.483) | 0.164 | ||
| GDF-15 | 1.082 (0.854–1.372) | 0.513 | ||
| H-FABP | 1.008 (0.795–1.277) | 0.948 | ||
| IGF-BP2 | 1.473 (1.107–1.960) | 0.008 | 1.550 (1.122–2.140) | 0.008 |
| suPAR | 0.905 (0.694–1.180) | 0.461 | ||
| BMI, body mass index; CVD, cardiovascular disease; LVEF, left ventricular ejection fraction; LVEDD, left ventricular end-diastolic diameter; IVSd, interventricular septal thickness at diastole; AV Vmax, maximal velocity over aortic valve; AV dpmean, mean pressure gradient over aortic valve; AV dpmax, maximal pressure gradient over aortic valve; TAPSE, tricuspid annular plane systolic excursion; sPAP, systolic pulmonary artery pressure; AVI, aortic valve insufficiency; MVI, mitral valve insufficiency; TVI, tricuspid valve insufficiency; BNP, brain natriuretic peptide; cTnI, cardiac Troponin I; CK, creatine kinase; sST2, soluble suppression of tumorigenicity-2; GDF-15, growth/fifferentiation of factor-15; H-FABP, heart-type fatty-acid binding protein; IGF-BP2, insulin like growth factor binding protein 2; suPAR, soluble urokinase-type plasminogen activator receptor. | ||||
The result of univariate analyses showed agreement (p
This was one of the first studies on patients with severe AS in which an attempt was made to investigate the context between the expression of cardiovascular biomarkers and the severity of sPAP in order to draw conclusions about the presence of PH.
In several studies of severe AS patients with additional right heart catheter
measurements, PH was detected in 48–75%. Echocardiographically, an sPAP
Plasma concentrations of cTnI, BNP, sST2, GDF-15, IGF-BP2, suPAR, and BNP were
significantly increased in patients with an sPAP
sST2, IGF-BP2, and suPAR were studied for the first time in the constellation with severe AS and echocardiographically detected PH. Geenen et al. [31] reported on the expression of sST2 based on patients with different etiologies of PH. They came up with significantly higher levels of sST2 in their collective primarily compared with healthy subjects, but also with higher plasma concentrations depending on the severity of the respective disease process. The excessive release of growth factors (IGF-BP2 in this case) during lung remodeling processes in the setting of post-capillary PH is also not surprising. Yang et al. [32] found markedly increased plasma concentrations of IGF-BP2 in two independent pulmonary artery hypertension (PAH) collectives. In conclusion, the levels of suPAR measured here could also be consistent with current literature. Mirna et al. [33] provided evidence of increased plasma concentrations of suPAR in particular as a relevant indicator of post-capillary PH.
H-FABP—in contrast to all other biomarkers—did not show significantly increased plasma concentrations in the “PH group”. A possible explanation could be that H-FABP is organotropic and secreted almost exclusively by cardiomyocytes, whereas the other investigated biomarkers are partly produced in several organs by different cell types. Since H-FABP is mainly released during myocardial injuries such as myocardial infarction or acute heart failure, higher plasma levels of H-FABP are also observed in severe AS [34]. However, no additional significant stimulus for cardiomyocytes to secrete greater amounts of H-FABP is created by pulmonary remodeling processes that occur. Nevertheless, a tendency to higher concentrations due to the additional right ventricular load in the context of PH can be detected.
With regard to the results of AUROC analyses, a comparison with Gumauskiene ̵̇ et al. [29] is again useful. Their GDF-15 and NT-proBNP analyses showed similar ROC curves as in our study. Because of the higher sPAP value of 45 mmHg, the cut-off value of GDF-15 with 3393 pg/mL was higher than in our group (1117 pg/mL). The BNP cut-off value for the presence of PH was 2248 pg/mL, which is relevantly higher than the cut-off levels (58–190 pg/mL) compiled by Parikh et al. [35] for the prediction of symptoms in the setting of severe AS. Here, it is clear how a consequent right heart strain arising from PH influences the secretion of BNP. Regarding sST2, a relevant cut-off value of 16,045 pg/mL was shown. This value was also higher compared to a study of our own working group [36] on patients of another collective with severe AS (cut-off value 10,070 pg/mL for the prediction of 1-year mortality). For H-FABP, no significant cut-off value could be derived based on the hypothesis mentioned above. As significant as almost all biomarker cut-off values in the AUROC analyses may be at first glance, it becomes clear at second glance when considering the respective sensitivities and specificities that their use in clinical routine is not practicable. The use of a solitary biomarker determination with a sensitivity of 51% and a specificity of 76% (as an example sST2 in present study) would not be clinically useful and would only waste resources. Of all biomarkers studied, BNP and cTnI showed the best results with a Youden index of 0.36 each. However, BNP and cTnI are increased in numerous cardiac diseases such as acute or chronic heart failure or cardiomyopathies of any kind [37]. Even severe AS alone without left ventricular decompensation is already a stimulus for increased BNP or cTnI release [30]. Therefore, it is not surprising that the sensitivity and thus the discriminatory power between severe AS without PH and severe AS with PH is not given.
Correlations between sPAP and various cardiovascular biomarkers were performed.
The results were sobering. Only for BNP (r: 0.367; p
The present study is based on data from a small cohort over a circumscribed time period (2016–2018). Biomarker levels were only measured at baseline without statement regarding expression after TAVR procedure. Additionally, technical pitfalls in echocardiographic measurements which lead to misclassifications should always be conceded, even if examinations were performed by experienced clinical investigators.
There is still scarce information about predictors of post-capillary PH in patients with severe AS concerning non-invasive ways. The sPAP is ultimately a solid marker from the echocardiographic side to roughly assess the presence or absence of PH. Nevertheless, correct derivation of TRV is prone to error because it depends on the sound quality and the experience of the examiner. From this point of view, laboratory determinations of cardiovascular biomarkers to concretize possible PH, which is crucial for the long-term survival of patients with severe AS, may possibly provide guidance. Larger study populations with combined biomarker scores are needed to further refine cut-off values. But also the respective expression of singular biomarkers should be investigated with regard to possible “confounders” such as reduction of LVEF, diastolic dysfunction, severity of aortic valve stenosis in dependencies of AV Vmax, AV dpmean, AVdpmax as well as valve opening area.
Authors EB, CK, VP, DF, RR, CR, JüK, JöK, MH and HB have given substantial contributions to the conception or the design of the manuscript. Authors CS, UCH and ML have provided supervision and advice for analysis and interpretation of the data. All authors have participated to drafting the manuscript. All authors read and approved the final version of the manuscript.
The study protocol was approved by the local ethics committees of the Paracelsus Medical University Salzburg (415-E/1969/5-2016) and the Johannes Kepler University Linz (E-41-16). Written informed consent for study participation was available from all patients.
We express our gratitude to the patient who agreed to participate at this study.
This research received no external funding.
The authors declare no conflict of interest. Michael Lichtenauer is serving as one of the Guest editors of this journal. We declare that Michael Lichtenauer had no involvement in the peer review of this article and has no access to information regarding its peer review. Full responsibility for the editorial process for this article was delegated to Dinesh Kalra.
Publisher’s Note: IMR Press stays neutral with regard to jurisdictional claims in published maps and institutional affiliations.