
Academic Editor: Carmela Rita Balistreri
Background: Determination of disease activity in Takayasu
arteritis (TAK) is crucial for clinical management but challenging. The value of
different magnetic resonance imaging (MRI) characteristics for the assessment of
disease activity remains unclear. This study investigated the imaging findings of
the thoracic aortic wall and elasticity by using a comprehensive 3.0 T MRI
protocol. Methods: We prospectively enrolled 52 consecutive TAK
patients. TAK activity was recorded according to the ITAS2010. All the patients
underwent thoracic aortic MRI. The luminal morphology of the thoracic aorta and
its main branches were quantitatively evaluated using a contrast-enhanced
magnetic resonance angiography (MRA) sequence. The maximum wall thickness of the
thoracic aorta, postcontrast enhancement ratio, and aortic wall edema were
analyzed in each patient through pre- and post-enhanced T1-weighted and
T2-weighted imaging. Pulse-wave velocity (PWV) of the thoracic aorta was
calculated using a four-dimensional flow technique. Results: The majority of the 52 patients had type V disease (34.62%, 18/52). Among all
the MRI indicators of the thoracic aorta, the area under the curve was the
largest for the maximal wall thickness (0.804, 95% confidence interval [CI] =
0.667–0.941). The maximal wall thickness (93.33%, 95% CI = 68.1%–99.8%)
exhibited the highest sensitivity with a cutoff value of 3.12 mm. Wall edema
(84.00%, 95% CI = 63.9%–95.5%) presented the highest specificity. A positive
correlation was noted between PWV and patients’ age (r = 0.54, p
Takayasu arteritis (TAK) is a form of large-vessel vasculitis of unknown etiology. Precise examination of disease activity in patients with TAK is crucial for management. Disease remission should be achieved and maintained prior to and after surgery [1].
Evaluation of disease activity in patients with TAK remains clinically challenging. The National Institute of Health activity criteria [2] and the Birmingham Vasculitis Activity Score (BVAS) [3] have been traditionally used to examine disease activity. In the past decade, a new Indian Takayasu clinical activity score (ITAS2010) was developed for assessing TAK activity on the basis of clinical symptoms and laboratory findings determined using the BVAS [4]. However, inconsistency was noted in a substantial proportion of patients with TAK in terms of their active symptoms, serum acute phase reactant levels, and radiological inflammation. Hence, the accuracy of the clinical activity score remains suboptimal.
Various imaging modalities including ultrasonography, computed tomography
angiography (CTA), magnetic resonance imaging (MRI), and
This prospective single-center study was approved by our institutional review
board. Written informed consent was obtained from each participant.
Between June 2014 and December 2018, we enrolled 52 consecutive
patients, including 18 first diagnosed and 34 revisited patients with TAK in this
study. The definitive diagnosis of TAK was based on the 1990 American College of
Rheumatology criteria [14]. TAK activity was examined according to the ITAS2010
[4]. All patients had been treated with glucocorticoids and immunosuppressive
agents. High dose glucocorticoid therapy (40–60 mg/day) was used for induction
of remission in the active TAK patients. Once remission occurred, the
glucocorticoid dose was tailored to a target dose of 15–20 mg/day within 2–3
months and to
 Fig. 1.
Flowchart for the selection and analysis of patients with TAK (n = 52). After excluding 9 patients, a total of 52 cases with TAK were included in the analysis.
All MRI examinations were performed using a 3.0 T MRI scanner (Verio, Siemens, Erlangen, Germany) equipped with a 32-channel surface-phased-array coil. The coil was placed beneath the mandible bone encompassing the whole thorax. As shown in Fig. 2, a 30-min comprehensive aortic MRI protocol was designed for the patients with TAK including dark-blood T2WI; contrast-enhanced magnetic resonance angiography (CE-MRA); pre, early, and delayed gadolinium enhanced T1-weighted imaging (T1WI); and 4D flow sequence.
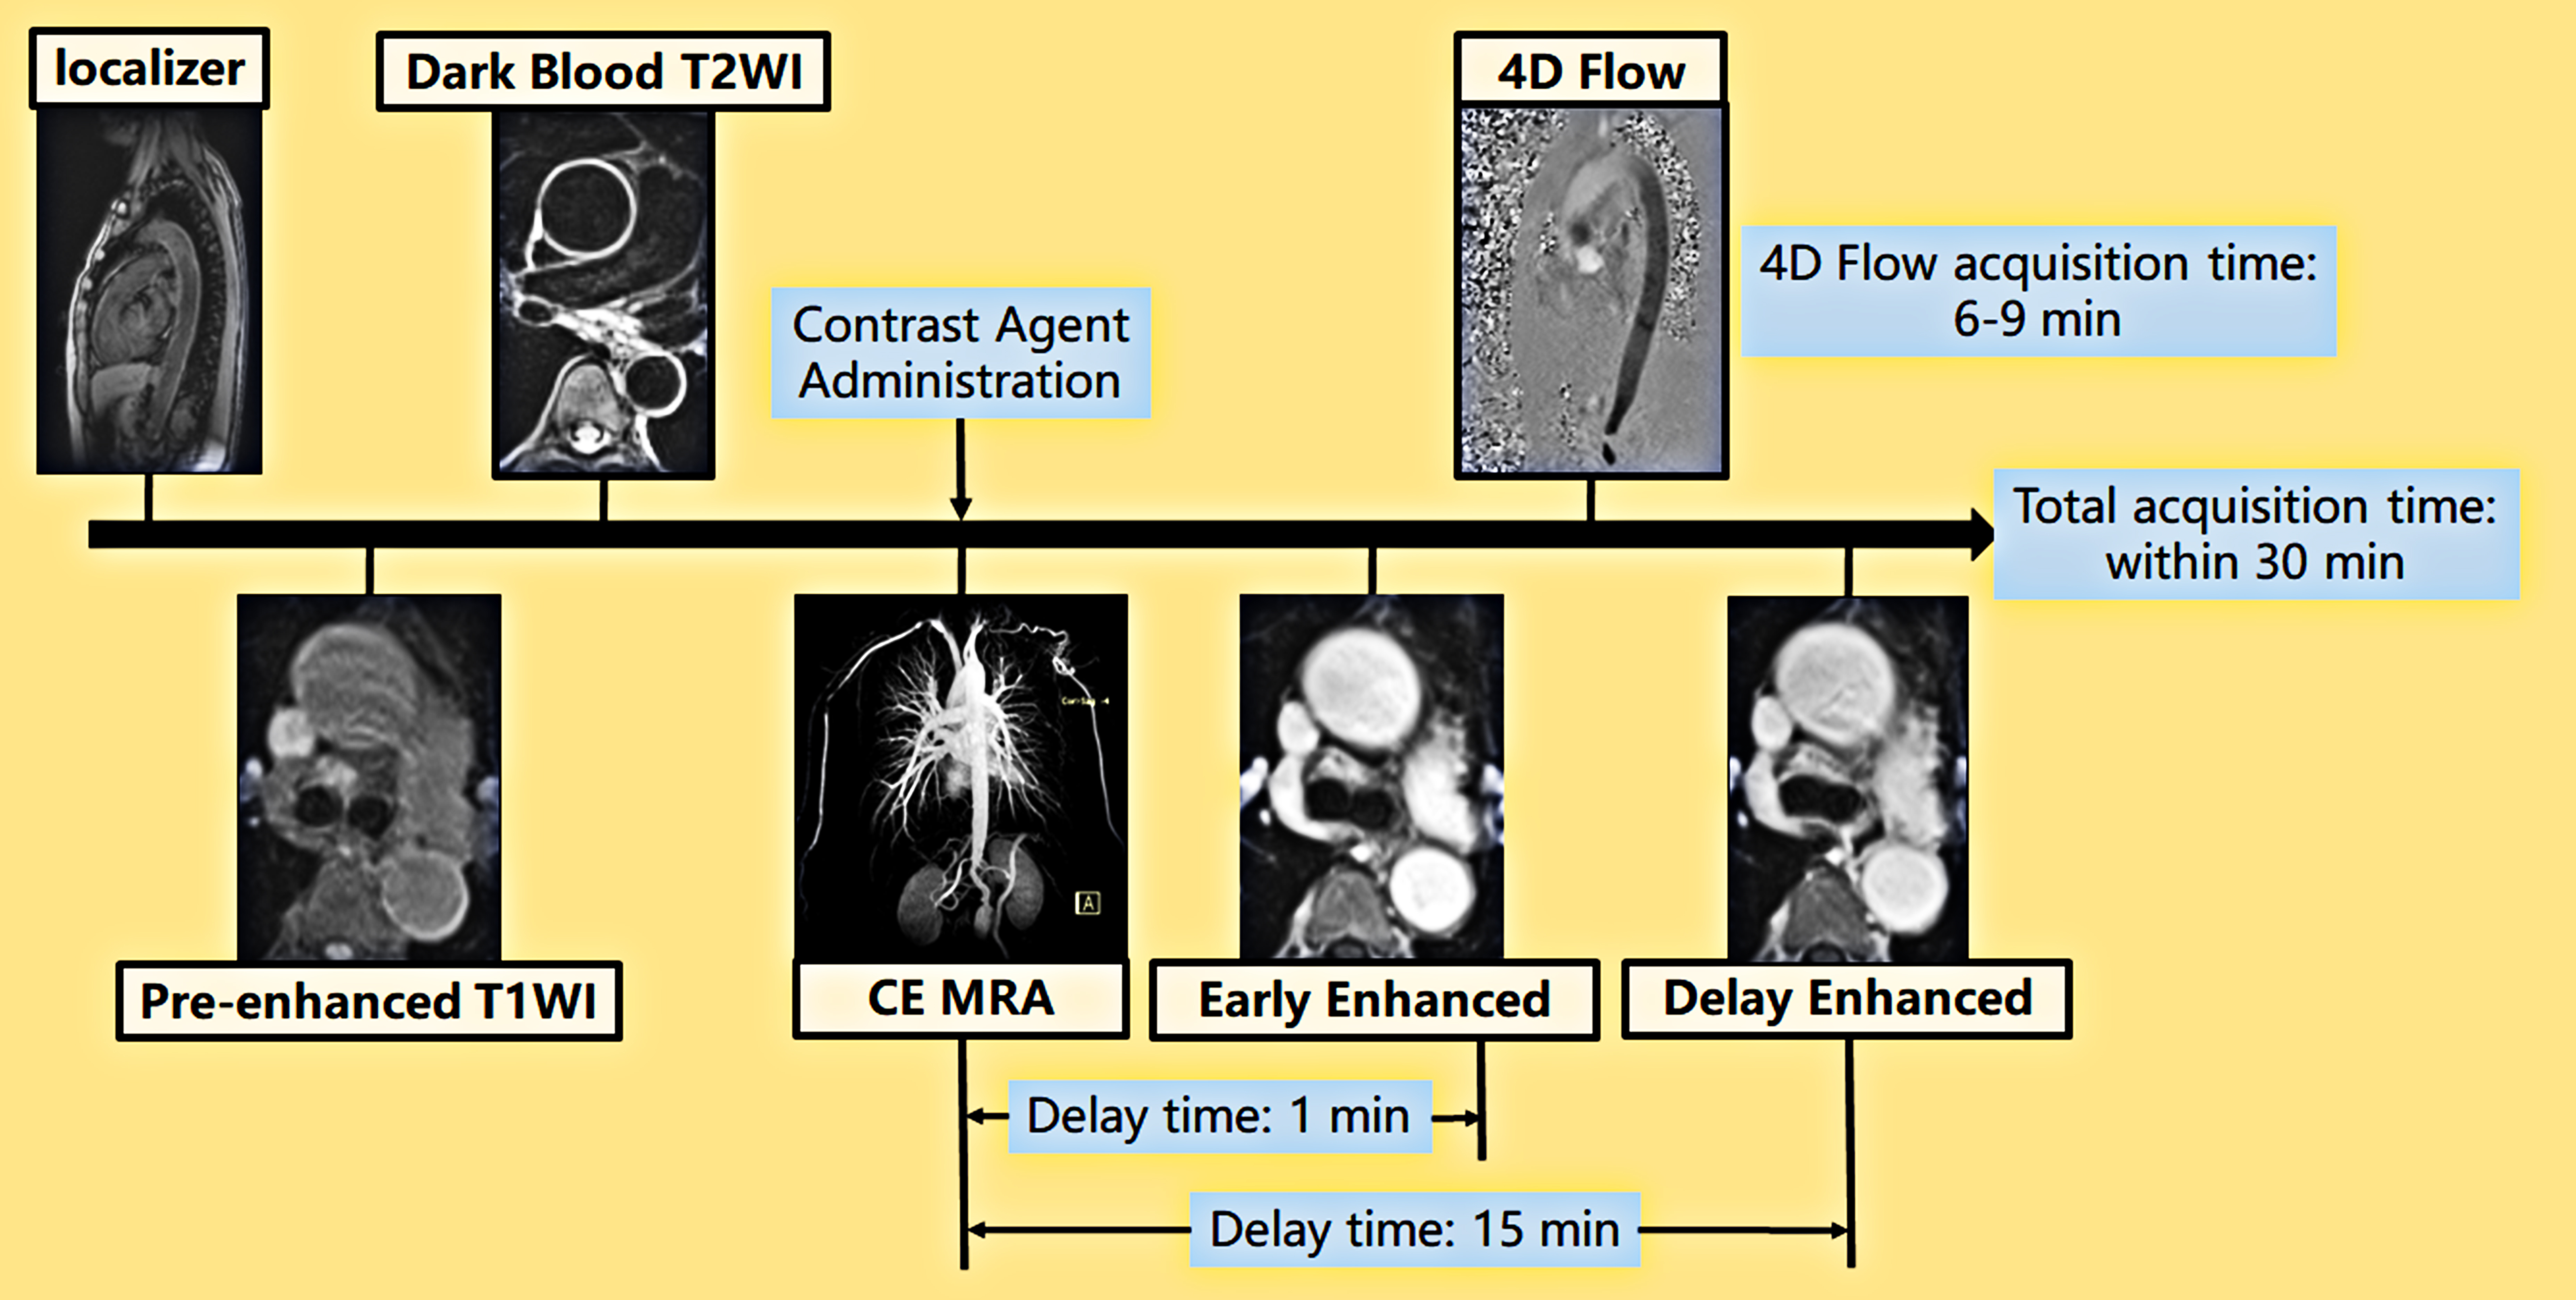 Fig. 2.
Comprehensive aortic MRI protocol for patients with TAK. Pre-enhanced T1WI and dark-blood T2WI with transversal orientation performed after localization. CE-MRA was performed using the bolus-tracking sequence after contrast injection. Early and late enhanced T1WI were performed 1 and 15 min after contrast injection, respectively, with the repetition of pre-enhanced T1WI. Within the delayed period, a 4D flow sequence was performed for a duration of 6–9 min.
Dark-blood T2WI was performed in the axis orientation with a fat sat
turbo spin echo (TSE) sequence (thickness = 5 mm, slice gap = 0
mm, time to echo/time to repetition (TE/TR) = 79.0 ms/4891.9 ms, field of view
(FOV) = 38
A breath-holding 3D gradient-echo (fast low-angle shot, FLASH) sequence
(TE/TR = 1.1 ms/3.1 ms, FOV = 38.0
For T1WI, a three-dimensional fat-sat-gradient recall echo volumetric
interpolated breath-hold examination (VIBE; TE/TR = 1.4 ms/3.9 ms, FOV = 38.0
The 4D flow sequence covered the whole thoracic aorta with oblique coronal
orientation in prospectively ECG-gated and navigation techniques (temporal
resolution = 47.2 ms, slice thickness = 1.8 mm, TE/TR = 2.8 ms/47.2 ms, FOV = 34.0
All the acquired images were evaluated by a radiologist (N.Z.) with 11 years of experience in cardiovascular imaging. The radiologist was blinded to clinical findings.
Image postprocessing and evaluation were performed on a Siemens workstation (SyngoMMWP VE40A, Siemens Med Service Software, Erlangen, Germany). Stenosis and dilation of different arterial segments were evaluated by comparing the diameter of the diseased segment with the luminal diameter of the adjacent normal-caliber arterial segment. Pathological entities of each arterial segment were classified as stenosis, occlusion, and dilatation. Ten arterial segments were evaluated for each patient including bilateral subclavian arteries, brachiocephalic trunk (BT), bilateral common carotid arteries (CA), bilateral vertebral arteries (VA), ascending aorta (AA), aortic arch, and descending aorta (DA).
Image postprocessing and evaluation were performed on a Siemens workstation (SyngoMMWP VE40A, Siemens Med Service Software). The following parameters were evaluated:
• Maximum wall thickness of the thoracic aorta: The aortic wall thickness was examined at the thickest site in thoracic aorta by using dark-blood T2WI.
• Postcontrast enhancement ratio: Regions of interest (ROIs) with a size of 5 to 12 pixels were set on the thickest aortic wall in pre-, early, and delay enhanced T1WI, avoiding the adjacent intra- and extra-luminal tissue and artifact. Additional ROIs were designated on the left erector spinae muscle at the same slice. The signal intensity ratio (SIR) and enhanced SIR (ESIR) of the aortic wall to the adjacent muscle were calculated as follows.
where SI
where SI
• Aortic wall edema: The presence of aortic wall edema was considered when a high SI was noted in the thickened aortic wall on dark-blood T2WI.
The 4D flow data were analyzed using a specialized module from CVI42 software (V5.13.7, Circle, Calgary, AB, Canada) [16]. After offset correction and antialiasing during preprocessing, the entire thoracic aorta was segmented and centerline extraction was semiautomatically performed through manual modification. Subsequently, for quantitative analysis, aortic 4D flow data were acquired from the aortic root to the distal descending aorta. A semiautomatic contour detection algorithm with manual verification was used to identify the aortic plane perpendicular to the aortic centerline. PWV was automatically calculated for each patient after placing two planes at the aortic root and distal descending aorta, respectively (Fig. 3).
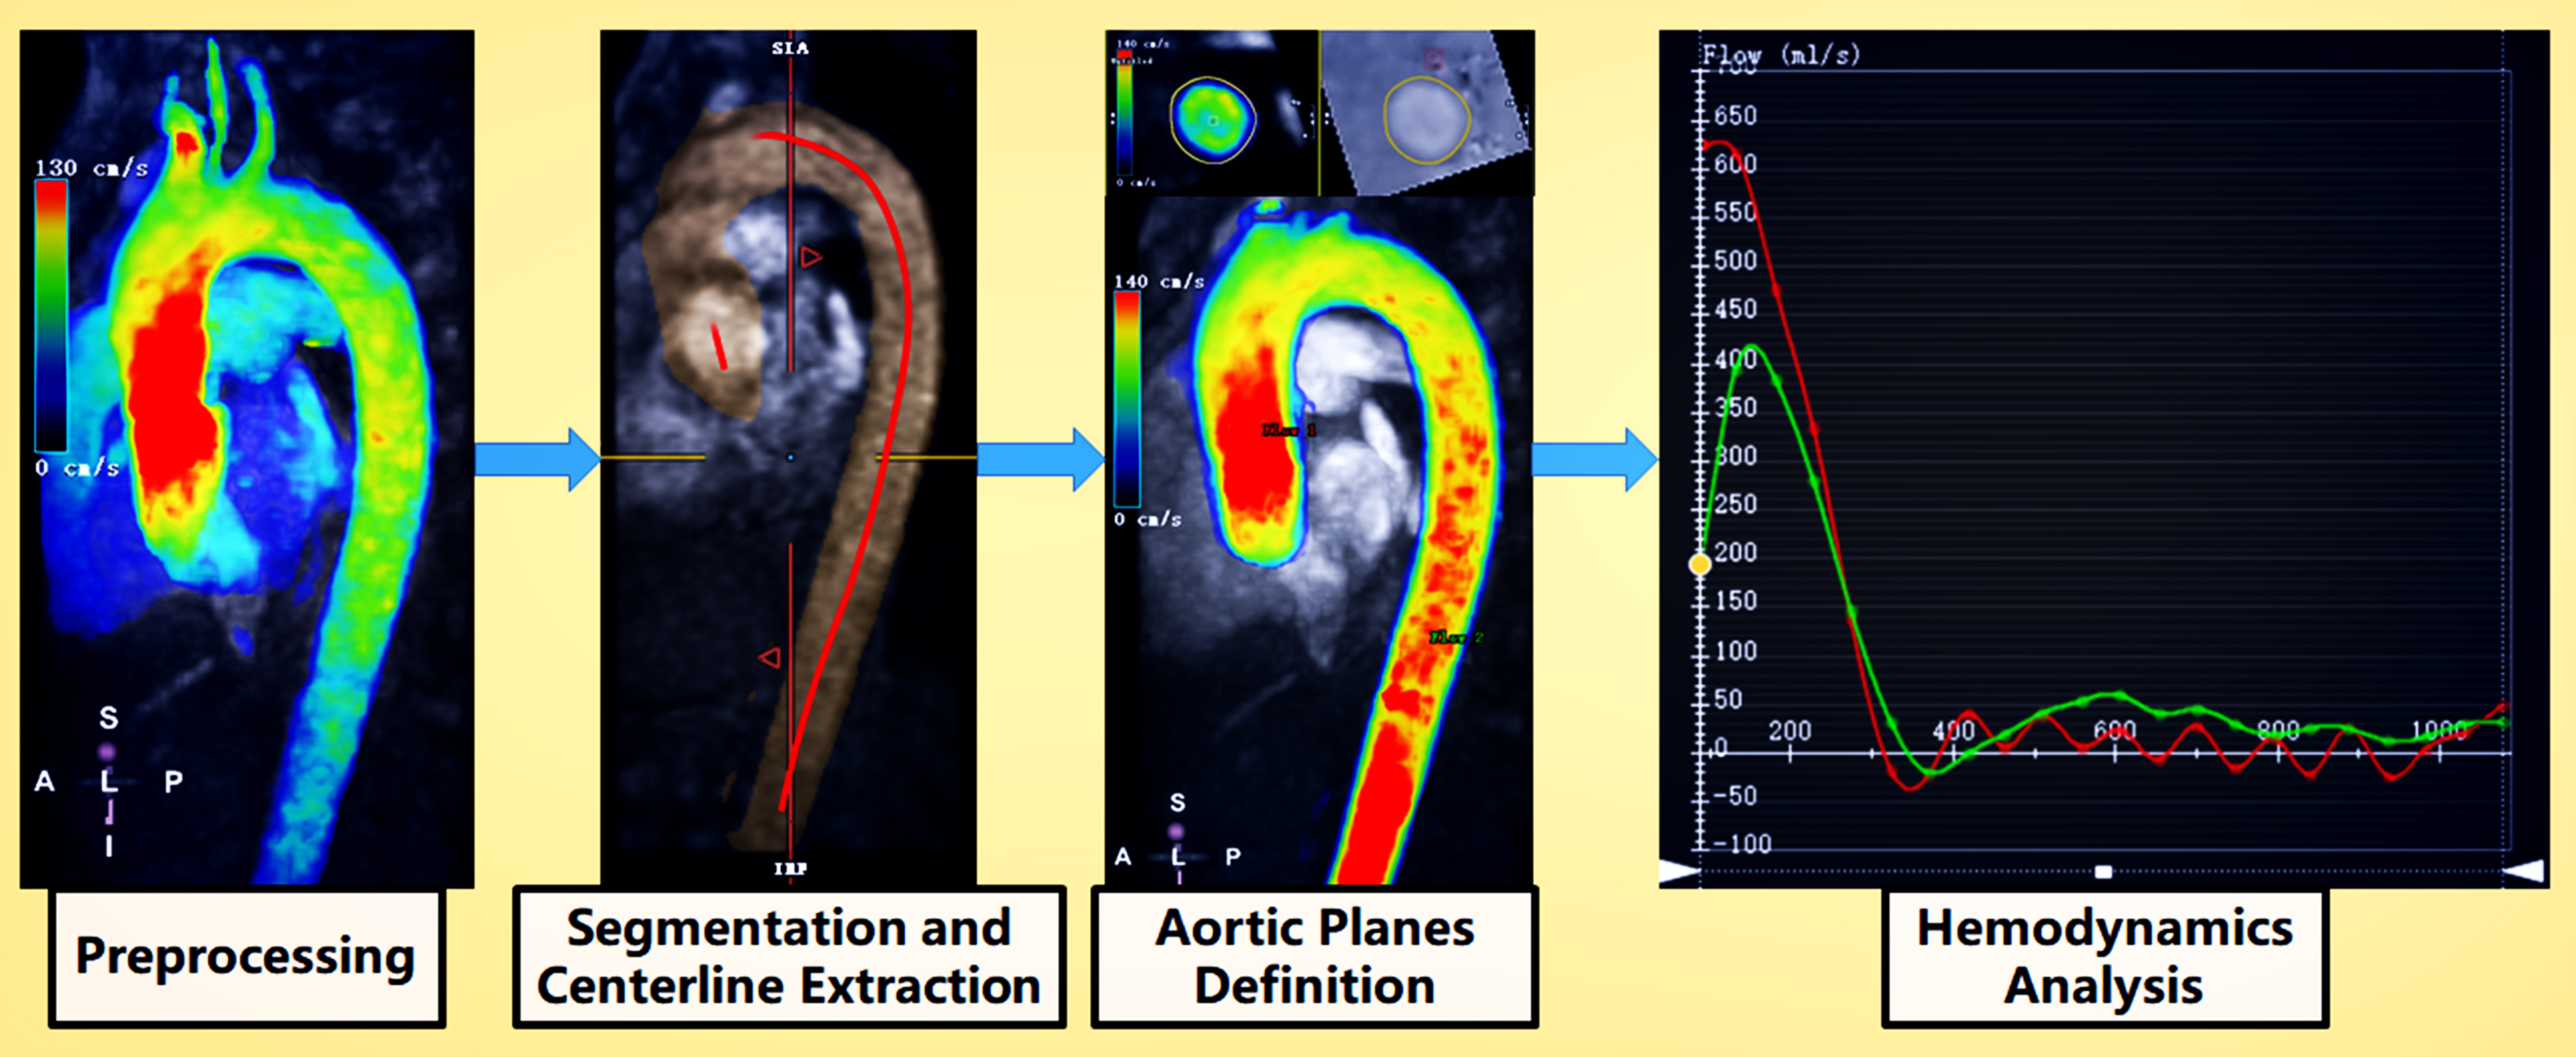 Fig. 3.
4D flow MRI analysis workflow. During preprocessing, the vessel area was masked for offset correction. Then, an antialiasing algorithm was used if the aliasing artifact existed in the flow region. Segmentation and centerline extraction were performed to define one mask with a threshold and the manual modification of the flow region. The centerline of the aorta was determined using the 2-point or multipoint method. Aortic plane selection: An appropriate plane of the aorta perpendicular to the centerline was selected and the contour of the aorta was manually modified. Hemodynamic analysis: Hemodynamic parameters (e.g., flow and velocity) were automatically acquired through the defined planes. PWV was automatically calculated using the phase shifting of profiles and the length between two planes along the centerline.
Statistical analysis was performed using MedCalc statistical software, version
20.019 (MedCalc Software Ltd, Ostend, Belgium). Continuous variables are
expressed as the mean
A total of 52 patients were enrolled in this study including 23 and 29 patients
with active and inactive TAK, respectively, according to ITAS2010/ITAS.A. The
majority of the patients were classified as type V (34.62%, 18/52), followed by
type IIb (26.92%, 14/52). In this cohort, 94.23% (49/52) of the patients were
women with a mean age of 38.19
| Parameter | Total (n = 52) | Active (n = 23) | Inactive (n = 29) | p | |
| Demographics | Female, n (%) | 49 (94.23) | 21 (91.30) | 28 (96.55) | 0.836 |
| Age (y) | 38.19 |
39.30 |
37.31 |
0.574 | |
| Disease duration (y) | 6.77 |
7.50 |
6.23 |
0.747 | |
| ESR (mm/h) | 11.70 |
17.83 |
7.46 |
0.000 | |
| CRP (mg/L) | 7.61 |
17.20 |
0.97 |
0.000 | |
| Takayasu Clinical Activity Score | ITAS2010, median (IQR) | 3.00 (0.25–8.50) | 6.00 (4.00–11.50) | 0.00 (0.00–1.00) | 0.000 |
| ITAS.A, median (IQR) | 4.00 (1.00–10.00) | 9.00 (5.00–11.50) | 0.00 (0.00–1.00) | 0.000 | |
| Classification | I, n (%) | 9 (17.31) | 2 (8.70) | 7 (24.14) | 0.348 |
| IIa, n (%) | 5 (9.62) | 3 (13.04) | 2 (6.90) | ||
| IIb, n (%) | 14 (26.92) | 5 (21.74) | 9 (31.03) | ||
| III, n (%) | 5 (9.62) | 2 (8.70) | 3 (10.34) | ||
| IV, n (%) | 1 (1.92) | 0 (0.00) | 1 (3.45) | ||
| V, n (%) | 18 (34.62) | 11 (47.83) | 7 (24.14) | ||
| IQR, interquartile range; ESR, erythrocyte sedimentation rate; CRP, C-reactive protein. | |||||
A total of 520 arterial segments were evaluated in the 52 patients. Arterial pathologies were noted in 193 segments (96 and 97 segments in the active and inactive groups, respectively), including 123 stenosed, 51 occlusive, and 19 dilated segments. The left subclavian artery (44/52, 84.62%) was the most commonly involved segment, followed by the right subclavian artery (38/52, 73.08%) and the left common carotid artery (33/52, 63.46%). Arterial dilation was more common in the aorta (12 segments) including 7 segments of the ascending aorta, 2 segments of the aortic arch, and 3 segments of the descending aorta. Table 2 presents the details of these pathologies.
| Arteries | Degree of stenosis | Total (n = 52) | Active (n = 23) | Inactive (n = 29) |
| RSCA | stenosis | 23 (44.23) | 13 (56.52) | 10 (34.48) |
| occlusion | 10 (19.23) | 3 (13.04) | 7 (24.14) | |
| dilatation | 5 (9.62) | 1 (4.35) | 4 (13.79) | |
| LSCA | stenosis | 23 (44.23) | 14 (60.87) | 9 (31.03) |
| occlusion | 20 (38.46) | 10 (43.48) | 10 (34.48) | |
| dilatation | 1 (1.92) | 1 (4.35) | 0 | |
| BT | stenosis | 10 (19.23) | 4 (17.39) | 6 (20.69) |
| occlusion | 1 (1.92) | 1 (4.35) | 0 | |
| dilatation | 1 (1.92) | 0 | 1 (3.45) | |
| RCA | stenosis | 15 (28.85) | 6 (26.09) | 9 (31.03) |
| occlusion | 7 (13.46) | 4 (17.39) | 3 (10.34) | |
| dilatation | 0 | 0 | 0 | |
| LCA | stenosis | 25 (48.08) | 12 (52.17) | 13 (44.83) |
| occlusion | 8 (15.38) | 4 (17.39) | 4 (13.79) | |
| dilatation | 0 | 0 | 0 | |
| RVA | stenosis | 6 (11.54) | 4 (17.39) | 2 (6.90) |
| occlusion | 2 (3.85) | 1 (4.35) | 1 (3.45) | |
| dilatation | 0 | 0 | 0 | |
| LVA | stenosis | 4 (7.69) | 3 (13.04) | 1 (3.45) |
| occlusion | 3 (5.77) | 1 (4.35) | 2 (6.90) | |
| dilatation | 0 | 0 | 0 | |
| AA | stenosis | 1 (1.92) | 1 (4.35) | 0 |
| occlusion | 0 | 0 | 0 | |
| dilatation | 7 (13.46) | 5 (21.74) | 2 (6.90) | |
| Aortic arch | stenosis | 2 (3.85) | 1 (4.35) | 1 (3.45) |
| occlusion | 0 | 0 | 0 | |
| dilatation | 2 (3.85) | 1 (4.35) | 1 (3.45) | |
| DA | stenosis | 14 (26.92) | 4 (17.39) | 10 (34.48) |
| occlusion | 0 | 0 | 0 | |
| dilatation | 3 (5.77) | 2 (8.70) | 1 (3.45) | |
| RSCA, right subclavian artery; LSCA, left subclavian artery; BT, brachiocephalic trunk; RCA, right common carotid artery; LCA, left common carotid artery; RVA, right vertebral artery; LVA, left vertebral artery; AA, ascending aorta; DA, descending aorta. | ||||
The maximum wall thickness of the thoracic aorta was significantly larger in the
active group (3.89
| Parameters | Total (n = 52) | Active (n = 23) | Inactive (n = 29) | p | |
| Thickness (mm) | 3.39 |
3.89 |
3.00 |
0.009 | |
| Edema, n (%) | 18 (34.6) | 13 (56.5) | 5 (17.2) | 0.003 | |
| Early enhanced | SIR | 1.36 |
1.50 |
1.20 |
0.126 |
| ESIR | 1.75 |
2.63 |
1.11 |
0.013 | |
| Delay enhanced | SIR | 1.86 |
1.95 |
1.76 |
0.189 |
| ESIR | 3.71 |
4.04 |
3.35 |
0.313 | |
| PWV (m/s) | 8.55 |
10.45 |
7.20 |
0.016 |
 Fig. 4.
MRI findings of a 32-year-old female patient with active TAK with an ITAS2010 score of 10, an ESR of 14 mm/h, and a CRP level of 32.16 mg/L. (A,B) CE-MRA showed occlusive lesions at the LSCA, RCA, and right renal artery. Significant stenosis was observed at the RSCA. (C) T2WI showed a thickened descending aortic wall with obvious edema. The thickness of the descending aortic wall was 4.65 mm. (D–F) Early and delay enhancement of the thickened descending aortic wall were observed with an early SIR of 2.20, an early ESIR of 5.46, a delay SIR of 2.95, and a delay ESIR of 6.84.
The PWV of the thoracic aorta in this cohort was 8.55
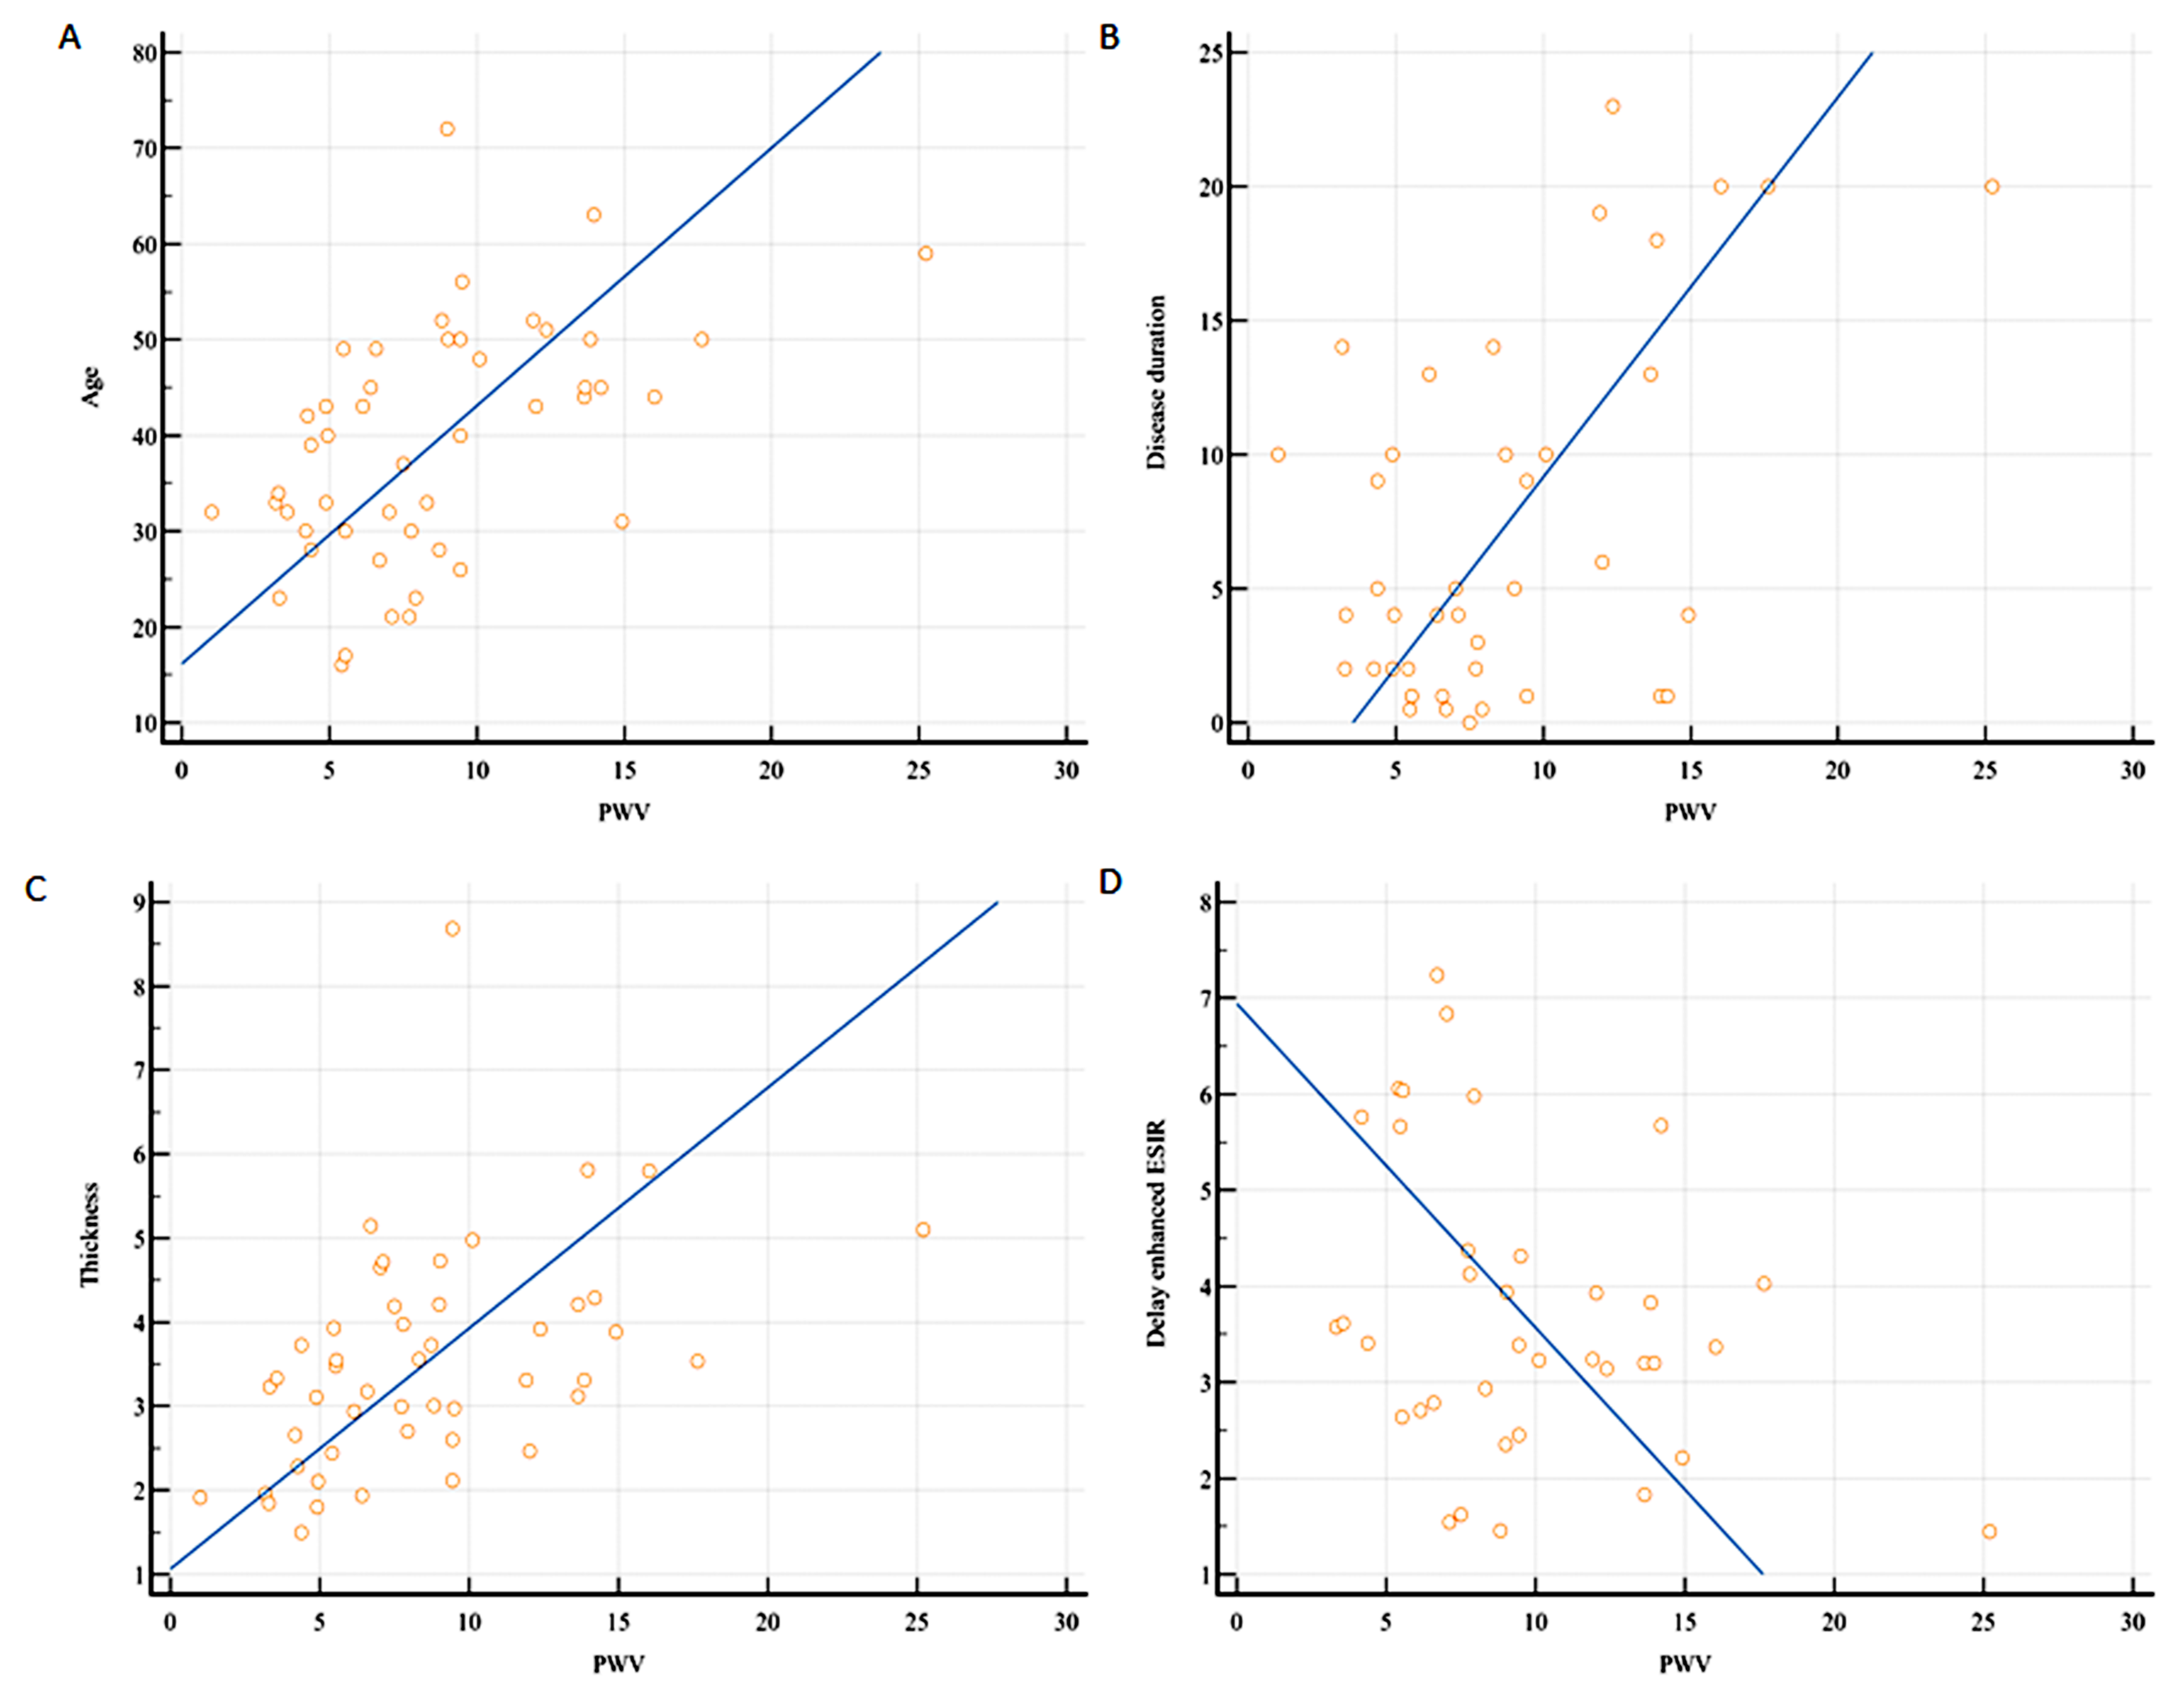 Fig. 5.
Correlation between PWV and different parameters. (A–C)
A positive correlation existed between PWV and patient’s age (r = 0.54, 95% CI =
0.27–0.73, p
Among all the MRI indicators of the thoracic aorta, the area under the curve (AUC) was the largest for the maximal wall thickness (0.804, 95% CI = 0.667–0.941). According to the ROC curve analysis of these MRI indicators, the cutoff values of the maximal wall thickness, early enhanced ESIR, and PWV were 3.12 mm, 1.13, and 6.4 m/s, respectively. On the basis of these cutoff values, the maximal wall thickness exhibited the highest sensitivity for the determination of active TAK (93.33%, 95% CI = 68.1%–99.8%), whereas wall edema demonstrated the highest specificity (84.00%, 95% CI = 63.9%–95.5%; Table 4).
| Parameter | AUC (95% CI) | Sensitivity (95% CI) | Specificity (95% CI) | Cut off value | p |
| Thickness (mm) | 0.804 (0.667–0.941) | 93.33 (68.1–99.8) | 60.00 (38.7–78.9) | 3.12 | 0.001 |
| Edema | 0.753 (0.587–0.919) | 66.67 (38.4–88.2) | 84.00 (63.9–95.5) | - | 0.001 |
| Early enhanced ESIR | 0.723 (0.565–0.880) | 66.67 (38.4–88.2) | 64.00 (42.5–82.0) | 1.13 | 0.006 |
| PWV (m/s) | 0.723 (0.566–0.879) | 86.67 (59.5–98.3) | 56.00 (34.9–75.6) | 6.4 | 0.006 |
| ESR (mm/h) | 0.851 (0.733–0.969) | 77.78 (52.4–93.6) | 84.62 (65.1–95.6) | 20 | 0.001 |
| CRP (mg/L) | 0.808 (0.647–0.969) | 69.23 (48.2–85.7) | 83.33 (58.6–96.4) | 5 | 0.001 |
ESR (0.851, 95% CI = 0.733–0.969) and CRP levels (0.808, 95% CI = 0.647–0.969) were superior to the MRI indicators of the thoracic aorta for determining the clinical activity of TAK (Fig. 6).
 Fig. 6.
AUC determined through the ROC analysis of MRI indicators. ESR (0.851, 95% CI = 0.733–0.969) and CRP (0.808, 95% CI = 0.647–0.969) were superior to each thoracic aortic wall characteristic for the assessment of TAK activity. Among all MRI findings, AUC was the largest for the maximal wall thickness (0.804, 95% CI = 0.667–0.941).
In this study, we used a comprehensive MRI protocol of the thoracic aorta to determine the morphological and functional characteristics of the aortic wall. We examined whether these characteristics can be used to assess disease activity in 52 patients with TAK. The maximal wall thickness was the most favorable indicator for determining TAK activity with the highest sensitivity. Aortic wall edema can be used as a specific marker to detect TAK activity with high specificity. Compared with delay enhancement, early-enhanced ESIR was a better indicator of TAK activity. Furthermore, by using the 4D flow technique, aortic PWV could be determined to detect active TAK with high sensitivity.
Accurate assessment of TAK activity is crucial for clinical management but remains challenging with the current approaches. Studies have investigated TAK activity by using different imaging modalities. Ultrasound is a convenient and cheap imaging method that is the most widely used in clinical practice to evaluate the peripheral arteries of patients with TAK. Characteristic thickening of the carotid arterial wall is an accurate diagnostic clue for TAK disease. The maximum intima-media thickness and contrast-enhanced ultrasound can be reliable indicators for detecting disease activity. However, the difficulty of aortic wall assessment limits the usage of ultrasound in patients with TAK with aorta involvement. CTA allows the visualization of the lumen and wall of variable arteries in the whole body. The high spatial resolution of CTA enables the quantitative assessment of morphological characteristics. Arterial wall thickness, wall enhancement, low-attenuation ring, and aortic positive remodeling are the indicators of TAK activity. Use of ionizing radiation and iodinated contrast agents raise concerns in patients with TAK with renal dysfunction or those requiring regular follow-up imaging. FDG-PET is the most sensitive imaging modality for detecting active local inflammatory changes in the aortic and peripheral arterial wall [8, 9]. However, the use of FDG-PET is hindered by its high cost, ionizing radiation, low specificity, and low spatial resolution.
Because of its ability to accurately examine soft tissue characteristics and the availability of a range of dedicated sequences, MRI has been widely used in clinical practice for the assessment of TAK activity [8]. Similar to CTA, MRI enables accurate whole-body vascular characterization [17]. Stenosis, occlusion, and dilation of systemic arteries can be quantitatively evaluated through MRA. Information on the involved arterial site, extent, and degree can be obtained with high reproducibility. With the development of the MRI technique, 2D or 3D multi-weighted vessel wall imaging can be used for examining the whole-body vascular structure. Thus, MRI is useful for early diagnosis, activity assessment, and relapse identification in patients with TAK. Functional evaluation of the aorta, including its hemodynamic and elasticity, can provide additional information regarding activity and prognosis. Hence, a comprehensive MRI protocol was used in this study for examining patients with TAK.
TAK is a form of large-vessel arteritis including the aorta, aortic primary
branches, coronary arteries, and pulmonary arteries. Active arterial lesions can
be solitary, diffuse, or multiple. Thus, for accurate TAK activity assessment,
arteries in the whole body should be evaluated. Difficulty in examining all
diseased arterial segments can lead to a decreased sensitivity of TAK activity
assessment. Because of the time-consuming nature and magnetic field inhomogeneity
of the 3.0 T system, only the thoracic aortic wall was evaluated for determining
the clinical activity of the patients with TAK in this study. Although the
majority of the patients in the cohort had type V disease (34.62%, 18/52) with
the simultaneous involvement of the carotid arteries, thoracic aorta, and
abdominal aorta, the largest AUC of MRI indicators reached 0.804 (95% CI =
0.667–0.941) in the maximal thoracic aortic wall thickness. When considering the
whole aorta, in a CTA study [7], the AUC of the maximal aortic wall thickness for
determining TAK activity reached 0.906 (95% CI = 0.850–0.946). In addition to
the aorta, carotid intima-media thickness measured through ultrasound and
Arterial wall thickening, edema, and contrast enhancement were correlated with
active vascular inflammation in patients with TAK, as determined through MRI
[10, 17, 20, 21, 22, 23, 24, 25, 26]. When FDG-PET was used to determine activity, aortic wall edema
with a high SI on T2WI was independently associated with FDG uptake [27]. In this
study, the diagnostic accuracy of thoracic aortic wall edema for TAK activity was
evaluated by performing ROC analysis. The AUC reached 0.753 (95% CI =
0.587–0.919) with a sensitivity of 66.67% (95% CI = 38.4%–88.2%) and a
specificity of 84.00% (95% CI = 63.9%–95.5%). Yang et al. [10]
demonstrated that low b-value DWI was superior to T2WI in identifying aortic wall
inflammation in patients with active TAK. The findings of TAK activity assessment
performed using arterial wall contrast enhancement have been inconsistent. Most
of the researchers have indicated that aortic wall contrast enhancement on MRI
findings is suggestive of active TAK [10, 21, 22, 28, 29]. Kato et al. [26]
reported that 30-min late gadolinium enhancement (LGE) with the Look–Locker
inversion-recovery sequence was useful for the detection of arterial wall
involvement. However, TAK activity could not be determined through LGE. The
inconsistency in the results may be due to the use of varying delay scan times,
imaging techniques, and definitions of active TAK. Choe et al. [28]
observed the early (delay within 5 min), intermediate (delay of 5–10 min), and
late (delay of 10–20 min) contrast enhancement patterns of the aortic wall in
patients with TAK by using spin-echo T1WI images. Increased enhancement was noted
in patients with active TAK on early, intermediate, and late enhanced scans.
However, only the early contrast enhancement of the aortic wall was
well-correlated with the ESR (r = 0.78, p
Aortic PWV evaluated using the 4D flow technique was a potential indicator of
TAK activity and prognosis. Brachial-ankle and carotid-femoral PWV were
correlated with TAK disease activity [12, 13]. Similar to arteriosclerosis,
brachial-ankle PWV levels in patients with TAK were associated with major adverse
cardiac events [31]. Because stenotic and occlusive lesions usually occur in the
peripheral arteries in patients with TAK, aortic PWV derived from MRI can reflect
arterial elastic function more accurately compared with brachial-ankle or
carotid-femoral PWV. In this study, thoracic aortic PWV was significantly
increased in the active TAK group (10.45
This study has several limitations. First, this was a single-center study. The sample size was relatively small. Second, no follow-up MRI images were available for this cohort. Future studies with large sample sizes and follow-up data are warranted. Third, only the thoracic aorta was evaluated in this study. Whole-body MRI including the whole aorta, carotid artery, and pulmonary artery might determine TAK disease activity more accurately.
MRI enables the comprehensive evaluation of the morphological and functional features of the aortic wall that can be used for determining TAK disease activity. Among all the MRI parameters, aortic maximal wall thickness was the most accurate indicator of TAK activity. The early phase was superior to the delay phase for aortic wall enhancement analysis to determine TAK activity. Except for age and the disease duration, aortic wall thickening and fibrosis can be pathological factors for affecting arterial elastic function in patients with TAK.
NZ, LP and JL—propose the concept. JL, LX and ZW—designed the research study. NZ and YL— acquired, analyzed and interpreted the data. NZ and LP—prepared the original draft. ZS and ZW—provided review and editing of the manuscript. All authors have read and agreed to the published version of the manuscript.
The study was conducted in accordance with the Declaration of Helsinki, and approved by the Institutional Review Board (or Ethics Committee) of BEIJING ANZHEN HOSPITAL, CAPITAL MEDICAL UNIVERSITY (2022023X). All subjects gave their informed consent for inclusion before they participated in the study.
Not applicable.
This study was supported by grants from Beijing Scholar 2015 (ZW), the National Natural Science Foundation of China (U1908211), the Capital’s Funds for Health Improvement, and Research Foundation of China (2020-1-1052).
The authors declare no conflict of interest. Zhonghua Sun is serving as one of the Editorial Board members/Guest editors of this journal. We declare that Zhonghua Sun had no involvement in the peer review of this article and has no access to information regarding its peer review. Full responsibility for the editorial process for this article was delegated to Carmela Rita Balistreri.