
Academic Editors: Jerome L. Fleg and Giuseppe Coppolino
Background: Patients that undergo renal transplantation (RT) often
suffer from high rates of cardiovascular disease-related mortality, yet, most of
the studies focus on coronary angiography performed as screening to entry in a
waiting list and not, as for clinical indication, after renal
transplantation. Methods: This study
examined coronary angiography findings from 45 patients with functional renal
grafts for over 6 months that were analyzed in Anzhen Hospital (Beijing, China)
from 2014–2019. For comparison purposes, we additionally examined coronary
angiography findings from 45 age- and
sex-matched patients undergoing chronic dialysis due to end-stage renal disease
(ESRD). We used the SYNTAX score to gauge coronary artery disease (CAD) severity.
Results: The duration of ESRD in
patients in the RT group was significantly longer than for that
of patients in the dialysis
comparison group (19.31
Individuals suffering from end-stage renal disease (ESRD) are at an elevated risk of prematurely developing cardiovascular disease (CVD) as a result of altered sodium or fluid homeostasis, atherosclerotic inflammation, and pronounced calcification [1]. ESRD patients with CVD exhibit significant reductions in both their short- and long-term survival.
Renal transplantation (RT) of kidney graft from a healthy donor remains one of the primary viable treatments for ESRD patients suffering from a loss of renal function [2, 3]. The rates of RT recipient survival have been steadily rising in recent years owing to advances in patient care and the development of increasingly reliable immunosuppressive drug regimens that can improve graft acceptance. Despite these advances, however, cardiovascular complications remain the leading factor adversely impacting the postoperative survival of RT patients [4, 5]. Indeed, RT patients typically exhibit a wide range of cardiovascular risk factors associated with the elevated rates of CVD in this patient population, including general risk factors and additional factors that are more specifically associated with the renal failure and transplantation process [6]. Despite its serious association with mortality in RT patients, there have been insufficient studies conducted to date characterizing postoperative coronary artery disease (CAD) in this patient population. Immunosuppressive drug regimens have been shown to aggravate a number of CAD-related risk factors including diabetes, hypertension, and hyperlipidemia. However, transplantation is also associated with the regression of uremia-associated risk factors. RT patients are also likely to have an extensive history of risk factors including prolonged renal disease, prior transplant rejection, pre-existing CVD, and history of dialysis, all of which can increase the risk of CAD development. Once it arises, CAD can be very difficult to treat effectively in RT patients, making it very important that the etiology and manifestation of this condition be better clarified in this at-risk population [7, 8]. However, recent studies have also shown that RT patients exhibit lower rates of CVD than do patients undergoing long-term dialysis.
The goal of the present study was to characterize angiographic findings associated with CAD in RT patients following kidney transplantation and to compare these findings to those of patients undergoing long-term dialysis. In addition, we sought to identify any correlations between angiographic findings and patient clinicopathological characteristics.
Approximately 90,000 individuals underwent coronary angiography (CAG) in Anzhen Hospital (Beijing, China) during the study period from 2014–2019. Of these patients, 56 (0.06%) had a history of undergoing RT. Of these patients, we then enrolled individuals that had had a functioning graft for 6 or more months prior to CAG into the present study. When patients had undergone more than one angiographic assessment during the study period, only the initial examination was used for analyses. Based on these criteria, we ultimately identified a group of 45 RT patients that had undergone CAG during this study period.
Over this same study period, 90 ESRD patients undergoing dialysis (hemodialysis
or peritoneal dialysis) had also been subjected to CAG at our institution.
Following the exclusion of patients that had been undergoing dialysis for
For each patient, basic demographic data were collected. In addition, patients were assessed for the presence of CAD-associated risk factors smoking, hyperlipidemia, diabetes, and essential hypertension (EH). Total ESRD and dialysis duration between the time of RT and CAG were also determined. Prior to CAG, plasma creatinine levels were measured in order to estimate glomerular filtration rate (eGFR) based upon the Modification of Diet in Renal Disease equation formula.
EH and diabetes were diagnosed in patients based upon previously reported
criteria [9]. A minimum of two systolic blood pressure readings
CAG is currently the gold standard approach to diagnosing CAD, and as such two
experienced cardiologists reviewed the CAG analyses of all patients in the
present study. The SYNTAX scoring system was used to assess coronary lesion
severity, and the number of stenotic coronary arteries was similarly assessed.
Furthermore, the calcification of identified lesions was classified as being
either none/mild or moderate/severe, as discussed in previous studies [10].
Numbers of coronary artery lesions were determined via enumeration of those
coronary vessel segments with a diameter of
Both univariate and multivariate analyses were used to assess the relationship between specific clinicopathological variables, SYNTAX scores, and CAD severity in RT patients.
Patients in the dialysis and RT groups had been matched according to age and
gender distributions, with matching having been conducted without consideration
for CAG findings. Continuous variables are given as means
Student’s t-tests, Spearman’s rank correlation coefficient, chi-squared
Pearson correlation tests, and multivariate regression analyses were used to
compare values in the present study, with p
The characteristics of patients prior to matching are compiled in Table 1.
Those patients in the RT group were significantly younger than were those in the
dialysis (57.04
| Total | ESRD | RT | p value | |
| n = 146 | n = 90 | n = 56 | ||
| Age, years | 60.02 |
61.88 |
57.04 |
0.003 |
| BMI, kg/m |
24.11 |
24.38 |
23.68 |
0.236 |
| SBP, mmHg | 128.77 |
131.37 |
124.60 |
0.020 |
| DBP, mmHg | 74.48 |
74.17 |
74.99 |
0.621 |
| Smoke, n (%) | 63 (43.15) | 37 (41.11) | 26 (46.42) | 0.528 |
| Drinking, n (%) | 25 (17.12) | 19 (21.11) | 6 (10.71) | 0.105 |
| DM | 59 (40.41) | 39 (43.33) | 20 (35.71) | 0.362 |
| Hypertension | 125 (85.62) | 78 (86.67) | 47 (83.93) | 0.647 |
| Hyperlipidaemia | 76 (52.05) | 46 (51.11) | 30 (53.57) | 0.772 |
| Family history of CVD | 4 (2.73) | 3 (3.33) | 1 (1.79) | 0.578 |
| TC, mmol/L | 3.97 |
3.76 |
4.30 |
0.002 |
| TG, mmol/L | 1.91 |
1.83 |
2.03 |
0.392 |
| LDL-C, mmol/L | 2.24 |
2.11 |
2.44 |
0.016 |
| HDL-C, mmol/L | 0.95 |
0.89 |
1.04 |
0.004 |
| EF (%) | 57.42 |
55.49 |
60.54 |
0.002 |
| Aspirin | 115 (78.77) | 73 (81.11) | 42 (75.00) | 0.380 |
| Clopidogrel | 104 (71.23) | 68 (75.56) | 36 (64.29) | 0.144 |
| Statin | 107 (73.29) | 72 (80.00) | 35 (62.50) | 0.020 |
| 82 (56.16) | 51 (56.67) | 31 (55.36) | 0.877 | |
| Years of ESRD | 14.36 |
11.45 |
19.04 |
|
| Years of dialysis | 6.19 |
5.29 |
7.62 |
0.021 |
| Years of RT | 10.29 |
|||
| History of PCI | 33 (22.60) | 16 (17.78) | 17 (30.36) | 0.077 |
| Values are given as mean | ||||
Following matching, there were no differences in age and family history of CVD
distributions between the dialysis and RT groups (Table 2). However, patients in
the RT group exhibited higher rates of hyperlipidemia, EH, diabetes, and smoking
relative to the dialysis group. RT patients also had a significantly longer total
ESRD duration (19.31
| ESRD | RT | p value | |||||||
| Total | CAG | PCI | CABG | Total | CAG | PCI | CABG | ||
| n = 45 | n = 6 | n = 38 | n = 1 | n = 45 | n = 9 | n = 32 | n = 4 | ||
| Age, years | 59.06 |
59.25 |
59.39 |
49 | 59.06 |
59.71 |
59.09 |
57.33 |
1 |
| BMI, kg/m |
24.82 |
23.95 |
24.86 |
22.22 | 25.50 |
28.22 |
25.06 |
22.38 |
0.562 |
| SBP, mmHg | 133.83 |
143.75 |
132.55 |
137.00 | 124.29 |
137.33 |
120.73 |
131.40 |
0.082 |
| DBP, mmHg | 75.91 |
80.75 |
74.65 |
89.00 | 73.36 |
76.33 |
72.55 |
81.75 |
0.422 |
| Smoke, n (%) | 10 (22.22) | 3 (50.00) | 7 (18.42) | 0 (0.00) | 23 (51.11) | 2 (22.22) | 20 (62.50) | 1 (25.00) | 0.004 |
| Drinking, n (%) | 7 (15.56) | 2 (33.33) | 5 (46.49) | 0 (0.00) | 0 (0.00) | 0 (0.00) | 0 (0.00) | 0 (0.00) | 0.006 |
| DM | 14 (31.11) | 0 (0.00) | 14 (36.84) | 0 (0.00) | 20 (44.44) | 4 (44.44) | 16 (50.00) | 0 (0.00) | 0.192 |
| Hypertension | 29 (64.44) | 4 (66.67) | 25 (65.79) | 0 (0.00) | 43 (95.56) | 8 (88.89) | 31 (96.88) | 4 (100.00) | |
| Hyperlipidaemia | 20 (44.44) | 2 (33.33) | 18 (47.37) | 0 (0.00) | 30 (66.67) | 8 (88.89) | 19 (59.38) | 3 (75.00) | 0.034 |
| Family history of CVD | 1 (2.22) | 0 (0.00) | 1 (2.63) | 0 (0.00) | 1 (2.22) | 0 (0.00) | 1 (3.13) | 0 (0.00) | 1 |
| TC, mmol/L | 4.02 |
3.82 |
4.04 |
5.15 | 4.18 |
4.35 |
4.12 |
3.39 |
0.528 |
| TG, mmol/L | 2.13 |
1.80 |
2.20 |
4.73 | 2.01 |
1.83 |
1.54 |
1.48 |
0.820 |
| LDL-C, mmol/L | 2.30 |
2.15 |
2.28 |
2.75 | 2.32 |
2.63 |
2.23 |
0.85 |
0.875 |
| HDL-C, mmol/L | 0.87 |
0.91 |
0.86 |
0.77 | 1.06 |
1.04 |
1.06 |
0.74 |
0.008 |
| Cr (mg/dL) | 10.66 |
10.66 |
11.84 |
0.94 | 1.72 |
2.42 |
1.17 |
1.28 |
|
| eGFR (mL/min/1.73 m²) | 6.37 |
5.16 |
6.21 |
6.14 | 69.24 |
59.69 |
70.98 |
86.98 |
|
| EF (%) | 55.18 |
64 |
53.78 |
63 | 62.50 |
54.00 |
63.90 |
59.33 |
0.043 |
| Aspirin | 40 (88.89) | 4 (66.67) | 35 (92.11) | 1 (100.00) | 34 (75.56) | 5 (55.56) | 26 (81.25) | 3 (75.00) | 0.098 |
| Clopidogrel | 34 (75.56) | 4 (66.67) | 29 (76.32) | 1 (100.00) | 35 (77.78) | 8 (88.89) | 24 (75.00) | 3 (75.00) | 0.083 |
| Statin | 40 (88.89) | 4 (66.67) | 36 (94.74) | 0 (0.00) | 26 (57.78) | 8 (88.89) | 15 (46.88) | 3 (75.00) | 0.001 |
| 28 (62.22) | 4 (66.67) | 23 (60.53) | 1 (100.00) | 30 (66.67) | 6 (66.67) | 22 (68.75) | 2 (50.00) | 0.660 | |
| Years of ESRD | 11.43 |
16.25 |
10.47 |
11.00 | 19.31 |
18.53 |
20.71 |
19.60 |
|
| Years of dialysis | 5.34 |
6.50 |
3.29 |
4.00 | 7.86 |
8.27 |
5.14 |
6.13 |
0.034 |
| Years of RT | - | - | - | - | 10.13 |
10.85 |
9.86 |
9.97 |
- |
| Values are given as mean | |||||||||
CAG findings for patients in this study prior to matching are compiled in Table 3. Patients in the RT group had
one-, two-, and three-vessel disease in 50.0%,
35.7%, and 14.3% of cases compared to 35.6%, 40.0% and
24.4% in dialysis group, respectively, whereas in the dialysis group the
incidence of left main disease (8.9%) were higher than RT group with scale of
0.0%. The dialysis group also had a significantly higher SYNTAX score (18.09
| Total | ESRD | RT | p value | ||
| n = 146 | n = 90 | n = 56 | |||
| Number of target vessels | |||||
| One | 42 (28.77) | 32 (35.56) | 28 (50.00) | 0.085 | |
| Two | 56 (38.36) | 36 (40.00) | 20 (35.71) | 0.605 | |
| Three | 30 (20.25) | 22 (24.44) | 8 (14.29) | 0.140 | |
| CTO | 57 (39.04) | 43 (47.78) | 14 (25.00) | 0.006 | |
| LM | 8 (5.48) | 8 (8.89) | 0 (0.00) | 0.022 | |
| SYNTAX score | 16.82 |
18.09 |
14.79 |
0.044 | |
| Lesion calcification, n (%) | |||||
| None to mild | 90 (61.64) | 51 (56.67) | 39 (69.64) | 0.117 | |
| Moderate to severe | 56 (38.36) | 39 (43.33) | 17 (30.36) | 0.117 | |
| Values are given as mean | |||||
CAG findings in study subjects after matching are shown in Fig. 1 and Table 4,
which listed the angiographic characteristics after matching. Patients in the RT
group had one-, two-, and three-vessel disease in 48.9%, 37.8%, and 8.9% of
cases compared to 31.1%, 44.4% and 17.8% in dialysis group, while rates of
left main disease between the dialysis group and RT group are same before
matching. Consistently, the SYNTAX score of patients in the dialysis group (17.76
 Fig. 1.
Angiographic characteristics after matching. RT, renal transplantation; One, 1-vessel disease; Two, 2-vessels disease; Three, 3-vessels disease; CTO, chronic total occlusion; LM, left main disease.
| ESRD | RT | p value | ||||||||
| Total | CAG | PCI | CABG | Total | CAG | PCI | CABG | |||
| n = 45 | n = 6 | n = 38 | n = 1 | n = 45 | n = 9 | n = 32 | n = 4 | |||
| History of PCI | 10 (22.22) | 2 (33.33) | 8 (21.05) | 0 (0.00) | 8 (17.78) | 1 (11.11) | 7 (21.88) | 0 (0.00) | 0.598 | |
| Number of target vessels | ||||||||||
| One | 14 (31.11) | 3 (50.00) | 11 (28.95) | 0 (0.00) | 22 (48.89) | 3 (33.33) | 12 (37.50) | 0 (0.00) | 0.085 | |
| Two | 20 (44.44) | 0 (0.00) | 20 (52.63) | 0 (0.00) | 17 (37.78) | 1 (11.11) | 16 (56.25) | 0 (0.00) | 0.520 | |
| Three | 8 (17.78) | 0 (0.00) | 7 (18.42) | 1 (100.00) | 4 (8.89) | 0 (0.00) | 0 (0.00) | 4 (100.00) | 0.215 | |
| CTO | 23 (51.11) | 0 (0.00) | 17 (44.74) | 0 (0.00) | 4 (4.44) | 0 (0.00) | 2 (6.25) | 2 (50.00) | ||
| LM | 4 (8.89) | 0 (0.00) | 4 (10.53) | 0 (0.00) | 0 (0.00) | 0 (0.00) | 0 (0.00) | 0 (0.00) | 0.041 | |
| SYNTAX score | 17.76 |
16.00 |
18.03 |
34 | 12.57 |
8.67 |
13.63 |
35.26 |
0.03 | |
| Lesion calcification, n (%) | ||||||||||
| None to mild | 16 (35.56) | 1 (16.67) | 15 (39.47) | 0 (0.00) | 32 (71.11) | 8 (88.89) | 23 (71.88) | 1 (25.00) | 0.002 | |
| Moderate to severe | 29 (64.44) | 5 (83.33) | 23 (60.53) | 1 (100.00) | 13 (28.89) | 1 (11.11) | 9 (28.13) | 3 (75.00) | 0.001 | |
| Values are given as mean | ||||||||||
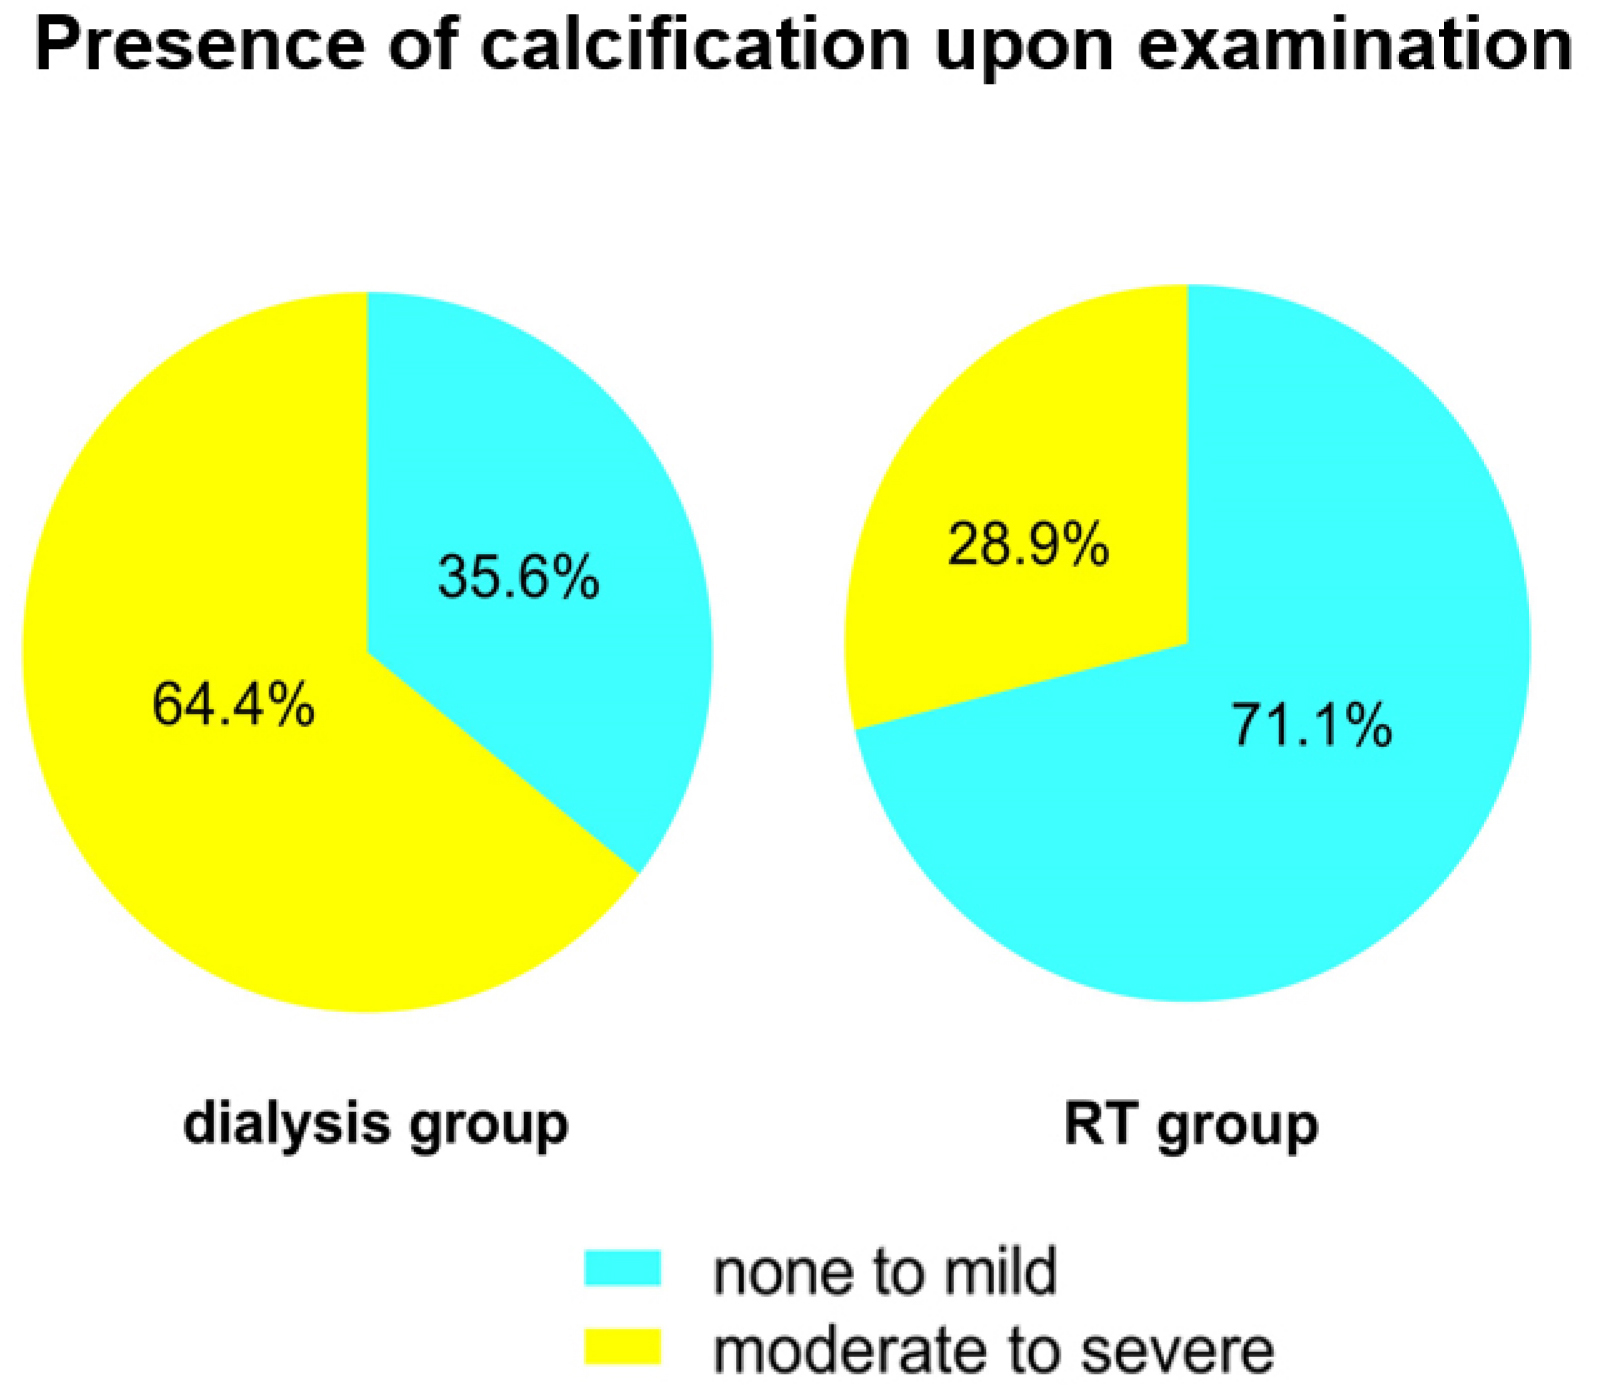 Fig. 2.
Calcification in angiography after matching. RT, renal transplantation.
 Fig. 3.
Therapeutic distribution after matching. PCI, percutaneous coronary intervention; CABG, coronary artery bypass grafting; RT, renal transplantation.
In a univariate analysis of the RT group, we found SYNTAX scores to be
significantly correlated with history of smoking (p = 0.009),
hyperlipidemia (p = 0.004), and total ESRD duration (p
| Variable | R | p value |
| Age | –0.045 | 0.743 |
| Gender | 0.045 | 0.743 |
| BMI | 0.209 | 0.122 |
| SBP | 0.161 | 0.236 |
| DBP | –0.066 | 0.628 |
| Smoking | 0.347 | 0.009 |
| Drinking | 0.069 | 0.613 |
| DM | 0.128 | 0.347 |
| Hypertension | 0.166 | 0.221 |
| Hyperlipidaemia | 0.434 | 0.001 |
| CVD | 0.108 | 0.429 |
| TC | 0.059 | 0.667 |
| TG | 0.091 | 0.504 |
| LDL-C | –0.036 | 0.795 |
| HDL-C | 0.089 | 0.514 |
| Cr | 0.164 | 0.226 |
| eGFR | 0.005 | 0.972 |
| EF% | –0.111 | 0.416 |
| Years of ESRD | 0.714 | |
| Years of dialysis | 0.501 | |
| Years of RT | 0.426 | 0.001 |
| BMI, Body Mass Index; CVD, cardiovascular disease; DBP, diastolic blood pressure; DM, diabetes mellitus; eGFR, estimate glomerular filtration rate; HDL-C, high-density lipoprotein cholesterol; LDL-C, low-density lipoprotein cholesterol; RT, renal transplantation; SBP, systolic blood pressure; Cr: Creatinine; TC, total cholesterol; TG, triglyceride; EF, ejection fraction. | ||
In a multivariate analysis that incorporated all variables found to be
significant in the abovementioned univariate analysis, we found that total ESRD
duration (p
To our knowledge, this is the first angiographic study of CAD findings in RT patients in the Chinese Han population. In this analysis, we found that RT patients exhibited lower postoperative CAD severity as assessed via CAG relative to patients undergoing long-term dialysis. This severity analysis was based upon the use of SYNTAX scores, which are commonly used as an objective means of assessing CAD severity [11]. Work by Yan et al. [12] found SYNTAX scores to be negatively correlated with eGFR, emphasizing the relationship between these scores and patient kidney functionality. In the present report, we found that RT patients had a mean SYNTAX score of 12.57 whereas patients undergoing long-term dialysis had a higher score of 17.76. While the score we detected in the dialysis group was lower than that in another previous study (20.6) [13], our RT group score was similar to that reported in this same previous analysis (13.3). We observed higher rates of three-vessel or left main disease among patients in the dialysis group, consistent with previous studies. Interestingly, we found that CAD was less severe on average among patients in the RT group, even though their average ESRD duration (19.3 years) was longer than that of patients in the dialysis group (11.4 years).
Determination of optimal treatments for CAD patients depends in part on determining the degree of lesion calcification in these individuals [14]. Vessel calcification can be challenging to negotiate, while dilation of calcified lesions can be difficult, resulting in suboptimal PCI outcomes even when more advanced interventional strategies are employed [15]. When bypass grafts anastomosed onto calcified vessels, their patency may also be significantly reduced. chronic kidney disease (CKD) patients typical exhibit significant coronary artery calcification [16, 17]. Work by Rosas et al, [18] for example, found that even the majority of asymptomatic patients exhibited significant coronary artery calcification at time of RT when examined via computed tomography. In this study, we detected moderately to severely calcified lesions in 28.8% of RT group patients, with this frequently being slightly below that observed in chronic dialysis patients (64.4%; p = 0.001). These calcification rates are lower than those previously reported among RT and ESRD patients in other countries [12, 13], suggesting that genetic or environmental factors may account for these differences. As the ESRD duration in RT patients was longer than that in patients in the dialysis group, these results may suggest that transplantation is protective against further vascular calcification.
There have not been sufficient studies conducted to date assessing the optimal strategies for managing CAD in RT patients. Work by Ferguson et al. [19] found that patients with CKD that underwent PCI or CABG before or after RT had acceptable short- and long-term outcomes. Similarly, research conducted by Herzog et al. [20] detected satisfactory long-term outcomes in RT patients following revascularization procedures, with the best outcomes being for patients treated via CABG using the internal mammary artery. In the present study, CAG results led to the recommendation for RT patients to undergo PCI, CABG, and medical therapy in 84.4%, 2.2%, and 13.3% of cases, respectively, whereas in the dialysis group these rates were 71.1%, 8.9%, and 20.0%, respectively. Relative to other similar studies [12, 13], we observed a significantly higher rate of patients undergoing PCI and a lower frequency of patients undergoing CABG.
The specific etiology of CAD in RT patients remains to be fully characterized [21]. Immunosuppressive drugs taken by these patients are known to impact CAD-related risk factors such as hypertension, hyperlipidemia, and diabetes incidence [22]. However, RT- and uremia-related factors may also influence the onset of CAD in this patient population [23]. Soveri et al. [24] found that they were able to analyze ALERT trial results in order to develop a means of calculating the cardiovascular risk of RT patients, with the resultant risk score being influenced by patient age, diabetes status, creatinine levels, smoking history, time on renal replacement therapy, and history of coronary heart disease. Partially consistent with this, in our small 45 RT patient cohort, we found CAD severity to be significantly correlated with patient smoking status, hyperlipidemia, and total ESRD duration. Multiple previous studies have shown that diabetes, hyperlipidemia, and smoking status are all linked to CAD incidence in the general population and among RT patients [25, 26, 27, 28]. CKD is also independently associated with CAD risk through both traditional and uremia-associated risk factors [29, 30]. Rates of atherosclerosis are therefore expected to rise significantly with duration of kidney disease, even among functioning graft recipients.
RT patients are known to be at a uniquely high risk of CAD relative to other patient populations [8, 21]. Although transplantation improved eGFR in treated individuals, it can lead to increased cardiovascular risk, with the metabolic impact of immunosuppressive drug regimens being a major contributor to this risk profile [19]. Even so, RT remains preferable to dialysis in ESRD patients as it is associated with longer survival and better overall quality of life.
There are multiple limitations to the present study. For one, this was a retrospective single-center analysis with a relatively small study population size. In addition, this was a study specifically of RT patients that had undergone CAG due to some clinical indication, and these results may thus not apply to other RT patients. Since the major coronary lesions been treated, the comparison in CAG findings between RT patients with history of PCI and dialysis patients might be very tenuous. In addition, as our dialysis group was designed to match our RT group, findings may not be generalizable to other patients undergoing dialysis. What’s more, the different CAD severity is probably not associated with the transplantation because 6 months without dialysis are not an adequate time for an improvement of the CAD. The data may not support a correlation of benefits of renal transplantation and CAD. Lastly, we lack any data to assess clinical outcomes in patients within this study population.
This study revealed that RT patients had a lower average CAD severity than did age- and sex-matched counterparts undergoing long-term dialysis treatment. Interestingly, this was true even though these RT patients had a longer average ESRD duration than did patients in the dialysis group. These RT patients exhibited high rates of coronary artery calcification, and many were proscribed to undergo PCI based upon CAG findings. Further studies will be needed to determine the optimal clinical treatment strategies from effectively managing CAD in this at-risk patient population.
BG, Blood Glucose; BMI, Body Mass Index; CABG, Coronary Artery Bypass Grafting; CAD, Coronary Artery Disease; CAG, Coronary Angiography; CKD, chronic kidney disease; CVD, Cardiovascular Disease; DBP, Diastolic Blood Pressure; DM, Diabetes Mellitus; eGFR, estimate glomerular filtration rate; ESRD, end-stage renal disease; HDL-C, High-Density Lipoprotein Cholesterol; LDL-C, Low-Density Lipoprotein Cholesterol; LM, left main disease; PCI, Percutaneous Coronary Intervention; RT, renal transplantation; SBP, Systolic Blood Pressure; Cr Creatinine; TC, Total Cholesterol; TG, Triglyceride; EF, ejection fraction.
GYZ, JLW, YYL and YJZ designed the research study. GYZ performed the research. GYZ and JLW analyzed the data. YJZ and YYL revised this paper. All authors read and approved the final manuscript.
All subjects gave their informed consent for inclusion before they participated in the study. The study was conducted in accordance with the Declaration of Helsinki, and the protocol was approved by the Ethics Committee of Beijing Anzhen Hospital (approval number: 2022024X).
We thank all our colleagues at the department of Cardiology, Beijing Anzhen Hospital, Capital Medical University.
YJZ was supported by National Key Research and Development Program of China (2017YFC0908800), Beijing Municipal Health Commission (Grant No. PXM2020_026272_000002 and Grant No. PXM2020_026272_000014) and Natural Science Foundation of Beijing, China (Grant No. 7212027).
The authors declare no conflict of interest.