
Academic Editors: Ichiro Wakabayashi and Klaus Groschner
Background: Although red cell distribution width (RDW) is associated with
increased cardiovascular mortality, the relationship between an elevated RDW and
cardiovascular mortality among various ASCVD risk groups is unknown. Methods: We
utilized the National Health and Nutrition Examination Survey (NHANES) III, which
uses a complex, multistage, clustered design to represent the civilian,
community-based US population. Out of 30,818 subjects whose data were entered
during the 1988–1994 period, 8884 subjects over 40 years of age, representing a
weighted sample of 85,323,902 patients, were selected after excluding missing
variables. The ACC/AHA pooled cohort equation (PCE) was used to calculate
atherosclerotic cardiovascular disease (ASCVD) risk, and low (
Red cell distribution width (RDW), a marker of red cell size variation, was described as a prognostic marker in heart failure patients using the data from the CHARM (Candesartan in Heart Failure: Assessment of Reduction in Mortality and Morbidity) program and the Duke Databank approximately one decade ago [1]. Additionally, prior observational studies have shown that increased RDW is associated with all-cause, cardiovascular mortality [2], post-procedure outcomes [3, 4] and atrial fibrillation [5, 6, 7, 8]. Inflammation and oxidative stress are proposed mechanisms that are known to be associated with both abnormally increased RDW and increased cardiovascular disease risk [9, 10].
The 2019 American College of Cardiology/American Heart Association (ACC/AHA)
prevention guidelines recommend using ACC/AHA pooled cohort equation to determine
atherosclerotic cardiovascular disease risk (ASCVD) and guide management [11].
The widely used ACC/AHA pooled cohort equation uses traditional cardiovascular
risk factors including age, sex, smoking status, diabetes mellitus (DM),
hypertension (HTN), and serum cholesterol values to determine cardiovascular (CV)
disease risk. Evidence from the Justification for the Use of Statins in
Prevention: an Intervention Trial Evaluating Rosuvastatin (JUPITER) trial [12],
the Canakinumab Antiinflammatory Thrombosis Outcome Study(CANTOS) trial [13] and
the Colchicine Cardiovascular Outcomes Trial (COLCOT) [14] support the role of
inflammation in CV disease pathogenesis in addition to traditional risk factors
as described above. High-sensitivity C-reactive protein (hs-CRP) level
The National Health and Nutrition Examination Survey (NHANES) III is a survey designed by the National Center of Health Statistics (NCHS) conducted between 1988–1994 using a complex, multistage, clustered design to represent the civilian, community-based United States population [17]. More information on survey methods is available at https://wwwn.cdc.gov/nchs/nhanes/nhanes3/default.aspx. In brief, a comprehensive home interview was conducted using predesigned questionnaires, followed by physical examination and collection of blood samples at the mobile examination centers by trained professionals. In total, data for 30,818 were available in the original sample that included all subjects ages two months and above. For the present analysis, subjects with age less than 40 years (n = 20,637) were excluded, and those with missing pooled cohort equation variables, RDW, CRP, and mortality data (n = 1297) were excluded. In addition, we excluded patients younger than 40 years as these patients were not included in the derivation and validation of the AHA/ACC pooled cohort equation [18]. A final sample of 8884 was analyzed in this study. Analytical guidelines published by NCHS were followed, and appropriate sample weights were used in the final analysis. The final weighted sample analyzed represented 85,323,902 subjects. NHANES III data was used for follow-up.
Age, race, and sex were self-reported and included in the household screening
questionnaire of the NHANES III survey. DM was defined as serum hemoglobin A1c
The primary endpoint was cardiovascular mortality. NCHS obtained mortality data of NHANES III subjects through multiple sources, including the national death index, centers for Medicaid and Medicare, United States renal data system, and social security administration data. Cause of death was extracted from death certificates, and all underlying causes of death were converted into ICD-10 codes. ICD-10 codes (I00-I09, I11, I13, I20-I51) were used for cardiovascular mortality. This mortality data was available in the NCHS data linkage file. Follow-up data were available until December 31, 2015. The analytic guidelines published by NCHS were used for data linkage and analysis [21].
Baseline characteristics of the study population were described using means
Univariate sub-distribution hazards for cardiovascular mortality were calculated in each of the ASCVD risk groups for age, blood pressure, HDL, total cholesterol, BMI, vitamin B12, serum iron as continuous variables, and DM, smoking status, sex, CKD stage, serum CRP and race as categorical variables. Variables with a significant cardiovascular mortality subdistribution hazard in at least one of the ASCVD risk groups were age, diabetes, smoker, HDL, sex, serum CRP, CKD stage, and race. All these variables were included in the final multivariate model. The cumulative incidence function (CIF) provides incidences in the presence of competing events [24]. Cumulative incidence function and estimates were calculated in all the ASCVD risk groups for cardiovascular mortality. Further, CIF was plotted. All analyses were completed in SAS version 9 (Cary, NC), and all plots were obtained using R version 3.6.1.
The total NHANES weighted sample of 85,323,902 subjects was analyzed. These
subjects were divided into three groups based on the ASCVD 10-year risk. The
low-risk group (
| Risk groups based on 10-year ASCVD risk | p-value | ||||
| 7.5–20% (25.5%) | |||||
| Age (yrs) | Median [IQR] | 47.33 [43.08–53.67] | 61.50 [55–67.08] | 74 [68.33–79.42] | |
| Sex | Female n (%) | 27652603 (63.23%) | 8798623 (40.38%) | 8786393 (44.37%) | |
| Race | White n (%) | 38362982 (87.72%) | 18821174 (86.38%) | 17458398 (88.16%) | |
| Black n (%) | 3589330 (8.20%) | 2436824 (11.18%) | 1919149 (9.69%) | ||
| Others n (%) | 1780880 (4.07%) | 530001 (2.44%) | 425164 (2.15%) | ||
| Diabetes n (%) | 1430517 (3.27%) | 2624252 (12.04%) | 5829079 (29.44%) | ||
| Hemoglobin g/dL | Mean |
13.92 |
14.41 |
14.11 |
|
| RDW | Mean |
12.96 |
13.16 |
13.42 |
|
| Total cholesterol mg/dL | Median [IQR] | 206 [183–234] | 224 [199–252] | 223 [194–251] | |
| HDL Cholesterol mg/dL | Median [IQR] | 51 [43–63] | 45 [37–55] | 45 [36–57] | |
| Systolic blood pressure mmHg | Median [IQR] | 119 [111–128] | 132 [121–143] | 145 [133–158] | |
| Hemoglobin | 13153 (0.03%) | 0 | 902 (0.005%) | ||
| 7.1–13 n (%) | 260612 (0.59%) | 72598 (0.33%) | 131516 (0.66%) | ||
| 43459426 (99.37%) | 21715402 (99.67%) | 19670292 (99.33%) | |||
| CRP | 579144 (1.32%) | 840706 (3.86%) | 859139 (4.34%) | ||
| Smoker n (%) | 8741595 (19.98%) | 7406220 (33.99%) | 4158321 (21%) | ||
| Event | Alive/censored n (%) | 37473967 (85.69%) | 11805312 (54.18%) | 2865528 (14.47%) | |
| Cardiovascular n (%) | 932658 (2.13%) | 2114952 (9.7%) | 5022520 (25.36%) | ||
| Others n (%) | 5326566 (12.18%) | 7867735 (36.11%) | 11914663 (60.17%) | ||
| RDW | 3570331 (8.16%) | 2938791 (13.49%) | 3973997 (20.07%) | ||
| 13–14 n (%) | 12221866 (27.94%) | 7638467 (35.05%) | 7487279 (37.81%) | ||
| 27940994 (63.89%) | 11210741 (51.45%) | 8341435 (42.12%) | |||
| Follow up in years | Median [IQR] | 19.58 [18.17–21.17] | 18.25 [13.5–20.25] | 10.5 [5.833–16] | |
In the low ASCVD risk cohort (10-year ASCVD risk cohort
| Parameter | ASCVD risk |
ASCVD risk 7.5–20 | ASCVD risk | ||||
| Hazard | Pr |
Hazard | Pr |
Hazard | Pr | ||
| Ratio | Ratio | Ratio | |||||
| (95% Hazard Ratio Confidence Limits) | (95% Hazard Ratio Confidence Limits) | (95% Hazard Ratio Confidence Limits) | |||||
| Univariable analysis | |||||||
| RDW |
3.048 (3.029–3.067) | 2.417 (2.409–2.426) | 1.166 (1.164–1.169) | ||||
| RDW 13–14 | 2.740 (2.728–2.752) | 1.258 (1.254–1.262) | 1.029 (1.027–1.031) | ||||
| Multivariable analysis |
|||||||
| RDW |
2.794 (2.775–2.812) | 2.016 (2.008–2.024) | 1.180 (1.177–1.183) | ||||
| RDW 13–14 | 2.381 (2.370–2.392) | 1.152 (1.149–1.156) | 1.043 (1.041–1.045) | ||||
| CRP |
0.181 (0.175–0.187) | 1.399 (1.390–1.407) | 1.124 (1.119–1.129) | ||||
| CKD5 | 0.000 (0.000–0.000) | 0.725 (0.713–0.736) | 0.138 (0.135–0.141) | ||||
| CKD4 | 0.000 (0.000–0.000) | 2.019 (1.992–2.046) | 0.827 (0.819–0.835) | ||||
| CKD3 | 1.486 (1.473–1.498) | 0.815 (0.810–0.820) | 0.715 (0.709–0.720) | ||||
| CKD2 | 1.109 (1.101–1.117) | 0.656 (0.652–0.660) | 0.652 (0.647–0.657) | ||||
| Male | 1.156 (1.149–1.162) | 1.316 (1.312–1.320) | 1.346 (1.344–1.349) | ||||
| Non-diabetic | 0.168 (0.167–0.169) | 0.514 (0.512–0.516) | 0.898 (0.896–0.900) | ||||
| Non-smoker | 0.246 (0.245–0.247) | 0.578 (0.576–0.580) | 1.582 (1.578–1.587) | ||||
| White | 0.164 (0.163–0.165) | 17.862 (17.174–18.577) | 1.819 (1.805–1.833) | ||||
| Black | 0.243 (0.241–0.245) | 13.804 (13.268–14.361) | 1.523 (1.510–1.536) | ||||
| Age in yrs | 1.095 (1.095–1.096) | 1.075 (1.075–1.075) | 1.019 (1.019–1.019) | ||||
| HDL | 0.995 (0.995–0.995) | 1.002 (1.002–1.002) | 0.999 (0.999–0.999) | ||||
| Cumulative incidence function | ||||||
| Cardiovascular mortality | ||||||
| ASCVD risk |
ASCVD risk 7.5–20% | ASCVD risk |
||||
| RDW | 10 year | 20 year | 10 year | 20 year | 10 year | 20 year |
| 1.3% | 4% | 7.7% | 17.7% | 16.8% | 28.1% | |
| 13–14 | 1.2% | 3.6% | 4.1% | 9.6% | 15% | 25.2% |
| 0.4% | 1.3% | 3.3% | 7.7% | 14.6% | 24.6% | |
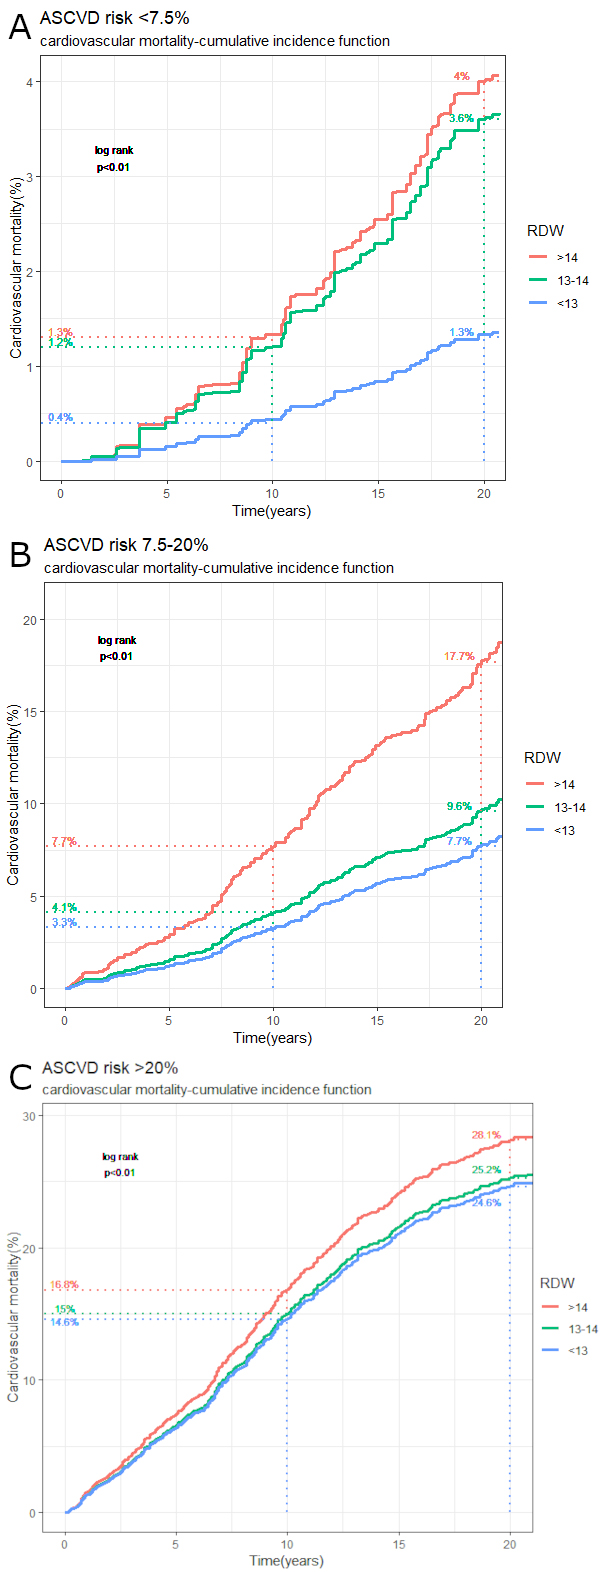 Fig. 1.
Cumulative incidence function (CIF) plot with 10-year and
20-year CIF estimates for cardiovascular mortality. (A) Low-risk ASCVD cohort
(10-year ASCVD risk
In the intermediate ASCVD risk cohort (10-year ASCVD risk cohort 7.5–20%), the
subdistribution hazard ratio (HR) for cardiovascular mortality was 2.41 (95% CI:
2.41–2.42, p
In the high ASCVD risk cohort (10-year ASCVD risk cohort
Our study shows that an RDW greater than 14 is associated with higher
cardiovascular mortality in all ASCVD risk cohorts. However, it was the
intermediate-risk group, where we found a remarkable difference in cardiovascular
mortality for patients with RDW
The pooled cohort equation is derived from multiple historical cohorts. This equation utilizes age, sex, blood pressure, DM, smoking status, and cholesterol. It is internally validated [18]. Even after taking all the risk factors into account, an elevated RDW greater than 14 was still associated with cardiovascular mortality. The working group behind the AHA/ACC pooled equation noted that several novel markers were not included in the equation due to insufficient evidence or lack of additional benefit [18]. CRP, a marker of inflammation, and CKD stage were included in our model to further account for this limitation of the pooled cohort equation and to see if their addition would decrease RDW impact on the outcomes. Even with the addition of these variables to the multivariate regression model, RDW greater than 14 had a significant association with an increase in cardiovascular mortality among the various subgroups.
Compared to the NHANES 2007-10 sample, our study population contains a more significant proportion of high-risk subjects (23.2% vs. 10.2%) but has a comparable number of intermediate-risk subjects (25.5% vs. 24.6%) [18]. This difference is likely due to better risk factor management in newer NHANES samples and inclusion of adults younger than 70 years.
To our knowledge, RDW association with cardiovascular mortality has not been studied previously within the different ASCVD risk categories. However, RDW has been studied in the same dataset previously and has been shown to be associated with increased cardiovascular and all-cause mortality when tested in the NHANES sample as a whole [2]. This finding is replicated in our study (Fig. 1), but it is also expanded to the different subgroups. RDW has been shown to be associated with increased coronary artery disease risk and can increase the predictive value of the Framingham risk score [25, 26]. However, these analyses did not account for competing risks posed by other causes of death and were unweighted [24]. In addition, RDW has been shown to be associated with poor cardiovascular fitness, increased mortality in peripheral arterial disease patients, and macrovascular complications in diabetes, and all of those are known to be associated with increased cardiovascular mortality [18, 27, 28, 29, 30, 31]. With the increasing use of PCE in clinical practice to estimate cardiovascular risk, the additional utility of using RDW to estimate the risk for cardiovascular mortality in patients where PCE can be used was unknown. The results of our study add to the increasing evidence of the prognostic importance of RDW as a marker of inflammation and oxidative stress in cardiovascular disease and specifically to cardiovascular mortality and therefore may help identify individuals at high cardiovascular mortality risk within the PCE calculated ASCVD subgroups.
Cardiovascular risk reduction strategies in subjects with high cardiovascular
disease risk are clear and involve risk factor optimization and management of
chronic conditions, including lipid lowering with statins prescriptions [11].
However, in the intermediate-risk group, statin initiation is usually a shared
decision since benefits are unclear [32]. It is essential to identify patients at
higher risk of having major adverse cardiovascular outcomes among this
intermediate-risk population [11]. Concerning that, the most striking finding of
our analysis probably was our results for the intermediate-risk group, which
represented 25.5% of the study population. The cardiovascular mortality was
significantly higher when RDW
Current guidelines recommend evaluating for risk-enhancing factors when the 10-year ASCVD risk calculated by pooled cohort equations is 7.5–20%, which should be followed by shared decision-making about risk and the benefits of starting statins [11]. Currently, red cell distribution is not included in the list of risk-enhancing factors.
Given the increasing evidence regarding the role of the red cell distribution width in cardiovascular disease [34] and our results, we think that future studies should try to examine whether they can confirm our findings regarding RDW utility in prognostication and risk stratification for cardiovascular mortality and if therapies such as the use of statin medications significantly decrease risk in those patients with elevated RDW values which are believed to be related to inflammatory/oxidative stress.
NHANES survey follows a complex multistage design to represent the non-institutionalized population of the United States. Therefore, we believe that our results have high generalizability and may have potential clinical value.
Our study has a number of limitations. First, we looked only at cardiovascular mortality and not other outcomes. Second, subjects may have developed various additional cardiovascular risk factors during the follow-up period, which may have influenced the mortality rates. Third, CRP values were not high sensitivity CRP values which makes them suboptimal. Fourth, single RDW values were taken since serial measurements were not available. Fifth, LDL cholesterol values were not available for a large number of patients in the study population and could not be included in the analysis. Finally, socioeconomic status and ethnicity have not been adjusted for in the current analysis.
Our study demonstrated that an increase in RDW greater than 14 was associated with significantly increased cardiovascular mortality in all ASCVD risk groups using the NHANES III database between 1988–1994, especially in the low and the intermediate-ASCVD risk cohort where RDW had the highest impact. Therefore, RDW may be a potential risk enhancer, similar to hs-CRP and in lieu of hs-CRP, especially for the intermediate-ASCVD risk population of people in the United States. An elevated RDW believed to be related to inflammatory and oxidative stress factors may become clinically helpful to further risk stratify individuals for cardiovascular mortality in conjunction with the use of the ASCVD risk assessment. Further validation of our study results is required.
AK, RTF—Conceptualization; AK, DGK, JM, RTF—Methodology; AK, DGK—Statistical analysis; AK, DKG—Investigation; AK, DGK, GG, JM, RTF, GS—Writing original draft and revision; AK—Visualization; RTF—Supervision.
Appropriate consent was taken from all subjects by NHANES III surveyors. Institutional Review Board of the Centers for Disease Control and Prevention approved the NHANES survey. Our study is a secondary data analysis of the initial data collected following the Declaration of Helsinki, and the protocol was approved by the NCHS Research Ethics Review Board (ERB). More information can be found at https://www.cdc.gov/nchs/nhanes/irba98.htm.
Not applicable.
This research received no external funding.
The authors declare no conflict of interest.