
Academic Editor: Jerome L. Fleg
Background: Carotid atherosclerosis is one of the main cerebrovascular
complications in kidney transplant recipients (KTRs). We analyzed the
relationships between carotid intima-media thickness (IMT) and the occurrence and
characteristics of carotid plaques in a cohort of KTRs. Methods: In 500
KTRs (aged 49.9
Carotid atherosclerosis is one of the major cardiovascular (CV) risk factors for the occurrence of an ischemic stroke [1, 2]. Traditional risk factors associated with atherosclerosis are age, male gender, smoking, dyslipidemia, hypertension, and diabetes mellitus [3]. In addition, chronic kidney disease (CKD) has also been shown to be associated with greater carotid intima-media thickness (IMT) and the occurrence of symptomatic ischemic stroke [4, 5] as well as with increased carotid artery stiffness and the presence of calcified plaques [6]. As a consequence, CV mortality is the major cause of death in CKD patients [7]. After successful kidney transplantation, despite the reduction of some risk factors (left ventricular hypertrophy, hypertension), CV disease remains a leading cause of death despite a functioning graft [8].
Quantitative evaluation of atherosclerosis with B-mode ultrasound involves the measurement of carotid intima-media thickness (IMT) and the assessment of carotid plaques. Both these measurements are biologically distinct entities and represent different phenotypes of atherosclerosis [9]. IMT is mainly reflective of hypertensive medial hypertrophy and is only weakly associated with traditional coronary risk factors whereas plaques are more strongly associated with traditional risk factors [10]. In patients with end-stage renal disease, the adverse CV consequences of hyperphosphatemia are most likely mediated via its ability to enhance the development of vascular calcifications [11]. CKD also significantly affects plaque composition [12]. Moreover, in CKD patients the rate of atherosclerotic plaque formation is a strong, independent predictor of CV events [13].
In clinical practice, we observed a significant asymmetry of carotid plaques and a substantial discrepancy between IMT values and the plaque burden in some stable kidney transplant recipients (KTRs). In our previous investigations, several clinical measures and biochemical markers were assessed in three different KTRs cohorts [14, 15, 16]. Based on our prospective kidney transplant database, we retrospectively analyzed IMT and the presence of plaques as markers of carotid atherosclerosis, as well as numerous biochemical and hormonal parameters.
This study enrolled 500 KTRs who attended our out-patient clinic from 2013 to 2017, in whom carotid artery ultrasound with IMT measurement and carotid plaque assessment were performed. Those examinations were part of the protocols of our previous clinical studies [14, 15, 16], and were approved by the Bioethics Committee of the Medical University of Silesia. All participants gave their written informed consent. The study was conducted in accordance with the Declaration of Helsinki. In addition to data retrieved from the prospective transplant center patient registry, carotid ultrasound, including the assessment of IMT and carotid plaques were performed.
Patients were identified as active smokers, when they were currently smoking or they declared the period of non-smoking as being shorter than 5 years.
Body weight and height were measured following standard procedures, and BMI was
calculated in kg/m
Office arterial blood pressure (OBP) was measured three times in the sitting position in the arm without vascular access during the physical examination. Patients whose OBP was equal or above 140/90 mmHg or those who received antihypertensive medication were diagnosed as hypertensives.
Diabetes was diagnosed in accordance with the American Diabetes Association criteria [17].
The duration of renal function insufficiency was estimated, based on the data collected at the time of kidney transplantation (the period of time since the first elevated serum creatinine concentration to the kidney transplantation procedure).
Routine laboratory measurements were performed in the hospital laboratory
(Synchron Cx-9, Beckmann Coulter Inc., Fullerton, CA, US). Plasma
high-sensitivity C-reactive protein (CRP) concentration was measured by
nephelometry (Siemens Healthcare Diagnostics, Deerfield, IL, US) with a limit of
quantification (LoQ) of 0.02 mg/L. Intact plasma parathormon (iPTH) concentration
was measured using the immunoassay method (Abbott Diagnostics, Abbott Park, IL,
US) with a LoQ
Carotid ultrasound was performed using a Siemens machine (Sonoline Antares, Mountain View, CA, USA), equipped with a 4.0–9.0 MHz linear transducer. Carotid arteries were examined with the patient in the supine position with the neck extended. The evaluation included the common, internal, and external carotid arteries, and the carotid bifurcation on each side. The common carotid artery intima-media thickness (IMT) was measured manually within 2 cm proximal to the carotid bulb, omitting any visible plaques. At longitudinal scans, the distal lines representing lamina intima and media were sharply visualized and the electronic calipers were placed to perform the exact IMT measurement. The accuracy of the single measurement was 0.5 mm and 3 consecutive measurements were made on each side, then the results were averaged. The highest value on both sides values was reported as the maximal IMT value. At each location, the carotid bulb and preceding common carotid artery were carefully evaluated in terms of the presence of plaques, which was classified based on the simplified scale: 0—no lesions, 1—non-calcified lesions, 2—at least one calcified lesion, 3—few calcified lesions, 4—carotid bulb heavily covered by calcified lesions. A final plaque score was equal to the highest score from both sides. All carotid sonographic examinations were performed by single investigator (AK).
Post-transplant major adverse cardio- or cerebrovascular events (MACE) were defined as the incidence of myocardial infarct, stroke, or cardiac artery stenting/surgical revascularization.
Kidney graft function was measured by the estimated glomerular filtration rate (eGFR) calculated according to the Modification of Diet in Renal Disease (MDRD) formula.
Statistical analyses were performed using the STATISTICA 13.3 PL for Windows
software package (Tibco Inc., Palo Alto, CA, USA) and MedCalc 18.6 (MedCalc
Software, Ostend, Belgium). Values are presented as means and 95% confidence
intervals or medians with Q1–Q3 values, as appropriate, or frequencies.
Comparisons were performed between 2 groups based on the mean value of maximal
carotid IMT and between 3 groups, defined by the presence and type of carotid
plaques. Based on the presence and type of carotid artery plaques, all study
participants were assigned to the subgroup 1 (no plaques), subgroup 2 (only
non-calcified plaque/plaques) or subgroup 3 (one or more calcified plaque). For
these comparisons, the Student t test and the analysis of variance test
(for quantitative variables) or the
Multivariate backward regression analysis was performed for the variability of IMT value, including potential explanatory variables: age, sex, the presence of coronary artery disease, smoking status, hemoglobin level and the presence of calcified carotid plaques. Multivariate models included variables selected on the basis of group comparison and univariate logistic regression analyses. The stepwise selection method was used.
Multivariate backward regression analysis was also performed for the presence of calcified plaques as dependent variable, including potential explanatory variables: age, sex, BMI, the presence of hypertension, pulse pressure, IMT, coronary artery disease or MACE, smoking status, serum glucose or the presence of hyperuricemia. Another multivariate backward regression analysis was performed for the presence of calcified lesions in a subset of 319 and 146 patients, respectively, i.e., in a cohort of patients with available results of relevant biochemical markers, and included age, the number of antihypertensive drugs, CRP, OPG and sclerostin levels as potential independent variables. In all the statistical tests, the ‘p’ values below 0.05 were considered statistically significant.
The study group consist of 500 stable KTRs, whose clinical characteristics are
presented in Table 1. Mean age at the time of the study was 49.9
| Parameter | Value | |
| N = 500 | ||
| Age at the time of the study [years] | 49.9 (48.8–51.0) | |
| Gender [M/F] | 284/216 | |
| BMI [kg/m |
26.3 (25.9–26.7) | |
| Dialysis vintage [months]* | 25.0 (14.0–42.0) | |
| Time after transplantation [months]* | 86.0 (65.0–117.0) | |
| Retransplant [n (%)] | 42 (8.4) | |
| Hypertension [n (%)] | 445 (89) | |
| MAP [mmHg] | 100.5 (99.5–101.4) | |
| Pulse pressure [mmHg]* | 50.0 (40–60) | |
| Number of antihypertensive drugs [n]* | 2 (1–3) | |
| Structure of hypertensive treatment [n (%)] | ||
| ACE-I/ARB | 143 (28.6) | |
| Beta-blocker | 348 (69.6) | |
| Ca-blocker | 207 (41.4) | |
| Diuretics | 142 (28.4) | |
| Diabetes [n (%)] | 137 (27.4) | |
| Coronary artery disease [n (%)] | 63 (12.6) | |
| Previous MACE [n (%)] | 54 (10.8) | |
| Smoking status [%] | 89 (17.8) | |
| eGFR [mL/min/1.73 m |
49.4 (36.4–68.0) | |
| Proteinuria |
35 (7.0) | |
| Glucose [mmol/L]* | 5.0 (4.7–5.7) | |
| Calcium [mmol/L]* | 2.4 (2.3–2.5) | |
| Phosphate [mmol/L]* | 1.0 (0.9–1.2) | |
| iPTH [pg/mL]* | 107 (69–174) | |
| Cholesterol [mmol/L] | 5.3 (5.2–5.4) | |
| Triglycerides [mmol/L]* | 1.5 (1.0–2.1) | |
| Hyperlipidemia [n (%)] | 265 (53) | |
| Hyperuricemia [n (%)] | 286 (57.1) | |
| Hemoglobin [g%] | 13.5 (13.3–13.7) | |
| Main medications [n (%)] | ||
| Statins/fibrates | 135 (27) | |
| Calcineurin inhibitors [CyA/Tc] | 238 (48)/246 (49) | |
| Glucocorticoids | 305 (61) | |
| Calcium carbonate | 74 (14.8) | |
| Vitamin D | 94 (18.8) | |
| Data presented as means and 95% Confidence Intervals or frequencies, except * medians and Q1–Q3 values. BMI, body mass index; MAP, mean arterial pressure; ACE-I, angiotensin converting enzyme inhibitor; ARB, angiotensin receptor blocker; MACE, major adverse cardio- and cerebrovascular event; eGFR, estimated glomerular filtration rate; iPTH, intact parathormon; CyA, cyclosporine A; Tc, tacrolimus. | ||
In the entire study group, the mean value of carotid IMT, measured with omitting
the visible plaques, was 0.66 (95%: 0.64–0.67) mm, with a range 0.4–1.3 mm.
The median IMT value was 0.6 (Q1–Q3: 0.6–0.7) mm. The maximum intrapatient IMT
difference was 0.6 mm and was observed in 1 study participant. Generally, the
degree of carotid atherosclerosis was similar in both arteries, but in 51
(10.2%) patients a the side-to-side IMT difference
All study participants were divided by using the mean value of maximal carotid
IMT, i.e., 0.66 mm. Table 2 shows the comparison of patients assigned to both
groups. The structure of the primary cause of CKD was similar in both groups. IMT
values were strongly associated with age (R = 0.498; p
| Parameter | Study group according to the mean IMT value | p | Study groups according to the carotid plaque occurrence | p | |||
| IMT max | IMT max | No plaques | Non-calcified | Calcified | |||
| N = 224 | N = 44 | N = 232 | |||||
| N = 280 | N = 220 | ||||||
| Age [years] | 45.3 (43.9–46.6) | 55.8 (54.3–57.3) | 42.7 (41.3–44.1) | 49.3 (45.9–52.8) |
57.0 (55.7–58.3) ### |
||
| Gender [M/F] | 138/142 | 146/74 | 111/113 | 24/20 | 149/83## | ||
| BMI [kg/m |
25.8 (25.2–26.4) | 26.5 (25.9–27.1) | 0.12 | 25.8 (25.1–26.5) | 25.1 (23.8–26.4) | 27.0 (26.4–27.6)# |
|
| Dialysis vintage [months]* | 23 (14–42) | 25 (14–41) | 0.61 | 22 (13–40) | 26 (16–38) | 27 (15–45) | 0.19** |
| Time after transplant [months]* | 85 (52–115) | 87 (70–119) | 0.20 | 87 (57–116) | 79 (25–104) | 86 (70–120) | 0.44** |
| Retransplant [n (%)] | 21 (7.5) | 21 (9.6) | 0.40 | 19 (8.5) | 3 (6.8) | 20 (8.6) | 0.92 |
| Duration of renal insufficiency [years]* | 10 (7–15) | 12 (10–17) | 9.0 (7.0–12.0) | 10.0 (7.5–15.5) | 14.0 (10.0–18.0) | ||
| Hypertension [n (%)] | 240 (85.7) | 200 (90.9) | 0.08 | 190 (84.8) | 37 (84.1) | 218 (94.0)## |
|
| MAP [mmHg] | 101 (100–103) | 99 (98–101) | 100.0 (98–101) | 100 (96–103) | 101 (100–103) | 0.35 | |
| Pulse pressure [mmHg]* | 50 (45–60) | 50 (40–59) | 50 (40–59) | 50 (45–60) | 50 (45–60)### | ||
| Number of antihypertensive drugs [n]* | 2 (1–3) | 2 (1–3) | 0.06 | 2 (1–2) | 2 (1–3) | 2 (1–3)### | |
| Diabetes [n (%)] | 80 (28.5) | 83 (37.8) | 0.03 | 49 (21.9) | 9 (20.4) | 79 (34.1)## | |
| Coronary artery disease [n (%)] | 21 (7.5) | 49 (22.2) | 11 (4.9) | 3 (6.8) | 49 (21.1)### |
||
| Previous MACE [n (%)] | 16 (5.7) | 28 (12.7) | 10 (4.5) | 1 (2.3) | 43 (18.5)### |
||
| Smoking status [%] | 48 (17.1) | 41 (18.6) | 0.66 | 43 (19.2) | 10 (22.7) | 36 (15.5) | 0.40 |
| eGFR [mL/min/1.73 m |
49.0 (36.1–67.7) | 49.7 (37.9–68.8) | 0.46 | 51.7 (38.4–68.3) | 48.3 (38.5–63.0) | 48.5 (34.8–66.9) | 0.28** |
| Proteinuria |
15 (5.4) | 18 (8.2) | 0.21 | 16 (7.1) | 4 (9.1) | 15 (6.5) | 0.82 |
| Glucose [mmol/L]* | 5.0 (4.6–5.5) | 5.2 (4.8–5.8) | 4.9 (4.6–5.5) | 5.0 (4.4–5.4) | 5.3 (4.8–5.9)# | ||
| Calcium [mmol/L]* | 2.39 (2.30–2.50) | 2.36 (2.27–2.45) | 2.4 (2.3–2.5) | 2.4 (2.3–2.4) | 2.4 (2.3–2.5) | 0.25** | |
| Phosphate [mmol/L]* | 1.02 (0.87–1.18) | 10.3 (0.87–1.15) | 0.99 | 1.0 (0.9–1.2) | 1.0 (0.8–1.2) | 1.0 (0.9–1.1) | 0.70** |
| iPTH [pg/mL]* | 99 (68–171) | 100 (60–148) | 0.39 | 104 (70–174) | 105 (70–149) | 111 (66–177) | 0.74** |
| IMT [mm]* | 0.6 (0.5–0.6) | 0.7 (0.7–0.8) | 0.6 (0.5–0.7) | 0.7 (0.6–0.7) | 0.7 (0.6–0.8) | ||
| Cholesterol [mmol/L] | 5.3 (5.2–5.4) | 5.4 (5.2–5.5) | 0.33 | 5.3 (5.1–5.5) | 5.4 (5.0–5.7) | 5.3 (5.2–5.5) | 0.94 |
| Triglycerides [mmol/L]* | 1.5 (1.0–2.0) | 1.5 (1.0–2.2) | 0.59 | 1.4 (1.0–2.0) | 1.5 (1.1–2.0) | 1.6 (1.1–2.2) | 0.49** |
| Hyperlipidemia [n (%)] | 145 (51.8) | 117 (53.2) | 0.76 | 116 (51.8) | 22 (51.2) | 127 (54.7) | 0.75 |
| Hyperuricemia [n (%)] | 151 (52.9) | 135 (61.4) | 0.10 | 116 (51.8) | 19 (43.2) | 151 (65.1)## |
|
| Hemoglobin [g%] | 13.3 (13.0–13.5) | 13.7 (13.5–14.0) | 13.4 (13.1–13.6) | 13.6 (12.5–14.6) | 13.6 (13.3–13.8) | 0.53 | |
| Data presented as means and 95 % Confidence Intervals or frequencies, except
*medians and Q1–Q3 values. Statistics: ANOVA or | |||||||
Univariate logistic regression analyses revealed that age, male sex, the
presence of coronary artery disease or calcified plaques and hemoglobin level
were associated with the presence of IMT
| IMT | Calcified plaques | |||||
| p | p | |||||
| Age [years] | 0.05 | 10.6 | 0.12 | 162.4 | ||
| Male sex | 1.63 | 9.4 | 0.57 | 9.8 | ||
| BMI [kg/m |
0.04 | 0.63 | 0.43 | 0.06 | 8.6 | |
| Hypertension | 0.16 | 0.05 | 0.83 | 1.02 | 10.4 | |
| Pulse pressure [mmHg] | 0.01 | 0.5 | 0.48 | 0.03 | 16.2 | |
| Number of antihypertensive drugs | 0.03 | 0.03 | 0.85 | 0.42 | 30.9 | |
| Coronary artery disease | 1.46 | 4.67 | 1.42 | 12.3 | ||
| Previous MACE | –0.29 | 0.09 | 0.78 | 1.72 | 17.7 | |
| Calcium [mmol/L] | 0.63 | 0.27 | 0.61 | 0.11 | 0.06 | 0.81 |
| Glucose [mmol/L] | 0.03 | 0.09 | 0.76 | 0.12 | 5.7 | |
| Hyperuricemia | –0.30 | 0.38 | 0.54 | 0.62 | 10.4 | |
| Hemoglobin [g%] | 0.16 | 3.05 | 0.06 | 0.04 | 0.98 | 0.33 |
| Duration of renal insufficiency period [years] | –0.04 | 0.81 | 0.39 | 0.10 | 36.9 | |
| IMT [mm] | - | - | - | 4.91 | 54.9 | |
| Calcified plaques | 1.71 | 12.3 | - | - | - | |
| BMI, body mass index; MACE, major adverse cardio- and cerebrovascular event; IMT, carotid intima-media thickness. | ||||||
Multivariate logistic regression analysis in the entire study group showed that
age (r
Among the 500 study patients, 276 (55.2%) had at least one plaque
(non-calcified or calcified) in both carotids. Patients with the presence of
plaques were significantly older [55.8 (54.5–57.0) vs. 42.7 (41.3–44.1)
years; p
Calcified lesions were detected in 32.5% study subjects with an IMT
 Fig. 1.
The distribution of carotid calcified plaques in patients with different IMT max values.
All patients were divided into 3 groups, based on the presence and type of
plaques detected in both carotid arteries. There were 224 (44.8%) patients
without any plaque, 44 (8.8%) patients with only non-calcified plaque/plaques
and 232 (46.4%) patients, in whom at least one calcified lesion was identified.
The clinical characteristics of patients in these study groups are shown in Table 2. There were substantial differences between the study groups. However, except
of age, where a significant increasing trend was noted across all 3 study groups
(p
In general, the occurrence of calcified plaques was associated with the primary
cause of CKD (
Univariate logistic regression analyses revealed that age, male sex, BMI, IMT,
pulse pressure, serum glucose level, the presence of hypertension, coronary
artery disease, previous MACE, hyperuricemia, the number of antihypertensive
drugs and the duration of renal insufficiency period prior to transplantation
were associated with the presence of calcified carotid lesions (Table 3). There
was also a significant relationship between the maximal carotid plaque score and
the duration of the period of renal insufficiency (
Multivariate logistic regression analysis in the entire study group revealed
that age (r
 Fig. 2.
The ROC analysis for recipient age (A) and duration of the period of renal insufficiency (B) which increased the risk for the occurrence of calcified lesions in the cohort of kidney transplant patients.
In 319 study patients, the results of circulating markers of inflammation,
vascular function and calcium-phosphate metabolism were also available. In this
subgroup, there were significantly higher serum CRP levels in patients with
calcified plaques [Me: 3.5 (1.5–7.3) vs. Me: 2.0 (1.2–5.2) mg/L; p
Plasma sclerostin and
Univariate logistic regression analyses revealed that serum CRP level (
The atherosclerotic lesions distribution according to the plaque score and side involved is shown at Fig. 3.
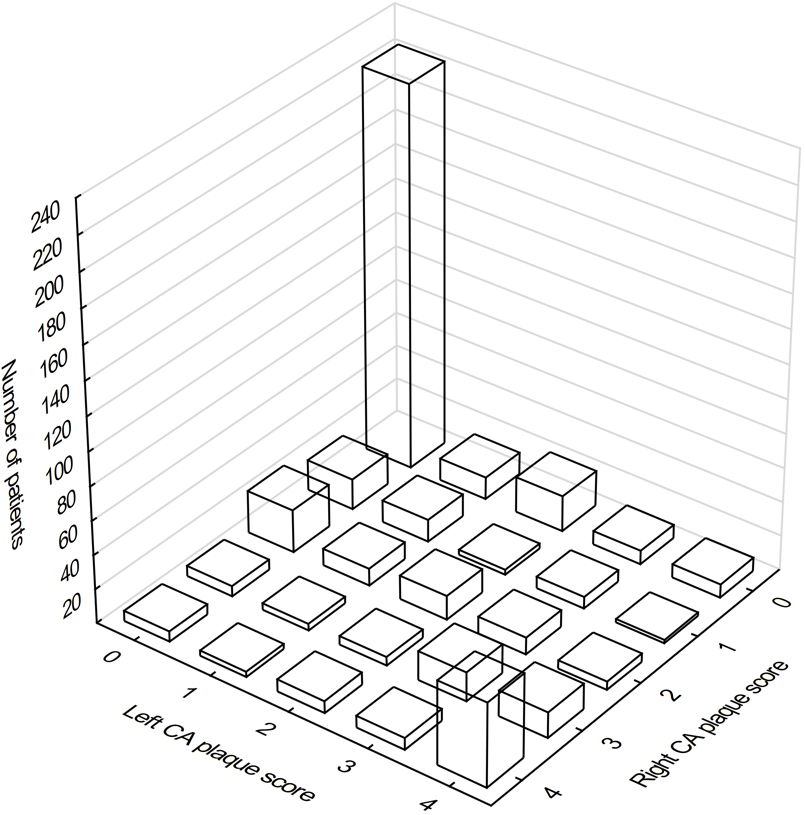 Fig. 3.
The distribution of atherosclerotic lesions in carotid arteries according to the plaque score and side involved. 0 denoted no plaques on the given side, 1—non-calcified lesions, 2—at least one calcified lesion, 3—few calcified lesions, 4—carotid bulb heavily covered by calcified lesions.
Despite the comparable number of patients without any carotid lesion (274 vs.
279 at the right and left side, respectively), only 224 (44.8%) KTRs were free
of plaques at both sides. In the group of 274 KTRs without plaques on the right
side, 50 patients (18.2%) had atherosclerotic lesions on the left side,
including 13 (4.7%) with uncalcified plaques and 37 (13.5%) with calcified
plaques. Notably, 16 (5.8%) patients had an abundantly calcified left carotid
bulb. In this group of 274 subjects, median left IMT was significantly greater in
the subgroups with any ipsilateral plaques [Me: 0.6 (0.6–0.7); p
Out of 279 patients without plaques on the left side, 55 patients (19.7%) had
at least one atherosclerotic lesion on the right side, including 18 (6.5%) with
uncalcified plaques and 37 (13.3%) with calcified plaques. Twelve patients
(4.3%) had a heavily calcified right carotid bulb. Median right IMT was
significantly greater in the subgroups with any ipsilateral plaques [Me: 0.6
(0.6–0.7); p
This study analyzed the characteristics and relationship of two different ultrasound-based measures of carotid atherosclerosis, IMT and carotid plaques, in stable KTRs. In contrast to several previous studies, the IMT measurements were performed manually (to avoid IMT overestimation), which enable us to investigate the two different atherosclerotic carotid entities separately and to define their independent risk factors without overlapping bias. Age and male sex were confirmed as common independent risk factors for the occurrence of both IMT and calcified carotid plaques. Additionally, the presence of coronary artery disease was associated with increased IMT, whereas the duration of the period of pre-transplant renal insufficiency increased the risk for carotid calcified plaques in multivariate analyses. Notably, none out of the numerous analyzed biomarkers was shown to be independently associated with IMT or plaque occurrence in the study cohort. This finding preclude the use of biomarkers as surrogates of carotid atherosclerosis in daily clinical practice. Finally, we also described in detail the asymmetric distribution of carotid lesions and the relationships between IMT and the presence of calcified carotid lesions in KTRs.
IMT is recognized as an useful tool for CV risk stratification and therapy
monitoring [18]. In the Carotid Atherosclerosis Progression Study during a mean
follow-up of 4.2 years, IMT was highly predictive for the incidence of stroke,
myocardial infarction and death [19]. Moreover, for this combined end-point,
hazard ratios were considerably higher in the younger (
Decreased renal function was shown to independently increase IMT (4), even in patients with no known kidney disease and normal and/or moderately decreased eGFR values [25, 26]. Of note, in the Suita Study cohort, multivariable-adjusted carotid IMT was significantly greater in CKD patients only in a hypertensive subgroup [27]. Nevertheless, despite the previously described modest IMT regression observed after kidney transplantation [28], the range of IMT in the present study was similar to the values reported in hemodialysis patients [29], as well as in other KTRs cohorts with comparable recipient age [30, 31]. Notably, in all study subjects, IMT was measured manually by a single investigator, within the optimal location at the far wall below the bulb, omitting any visible local thickening [32]. Otherwise, both the manual and computer-based, automated methods for IMT assessment often yield higher scores, as they may not omit local intimal thickening or plaques [22, 33, 34, 35]. This study protocol was chosen to avoid the above mentioned biases and allowed us to perform a more accurate analysis of interrelationship between IMT and carotid plaque burden. In the analyzed cohort, only a small subgroup showed substantial IMT left-right asymmetry, which is in line with earlier reports [36, 37]. Interestingly, those KTRs were older and were more frequently men compared to the rest of the analyzed cohort.
The assessment of carotid plaques is a distinct measure of atherosclerosis, with advancing age as the most predominant risk factor. With aging, a decrease in fibrous plaques and an increase in atheromatous plaques is observed [38]. This discrepancy may be explained by the differences in arterial remodeling in response to plaque accumulation among the different types of arteries [39]. Carotid bulb geometry was shown to be associated with plaque volume [40, 41]. Moreover, in arteries with plaques, wall shear stress was significantly lower than in the plaque-free vessel and was linked to endothelial dysfunction [42]. This may result in partly asymmetric distribution of carotid calcified lesions that was seen in some study patients, which was also reported in another large non-CKD study [43].
Thus, the assessment of carotid plaques, particularly calcified lesions, using ultrasound may provide additional stroke risk information beyond the measurement of luminal stenosis [44]. In a population-based study, calcified carotid plaques independently increased the risk of combined vascular outcomes, including ischemic stroke, even after adjustment for IMT [45]. The presence of CKD additionally increases the total and calcified plaque burden, both in dialysis and transplant patients [46]. Moreover, the negative association between eGFR and the prevalence of carotid plaques was observed even in patients without CKD [25]. This effect is mainly mediated by phosphate retention, which constitutes an early trigger for the development of secondary hyperparathyroidism and accelerated macrovascular disease [47]. Such a mechanism is further confirmed by a consistent relationship between serum phosphate (even in the normal range) and CVD [48, 49], as well as with multiregional vascular calcification [50], and by the independent relationship between the duration of renal insufficiency (with concomitant impairment of urinary phosphate elimination) and calcified plaques found in the present study. This reciprocal relationship of vascular calcifications within different locations in CKD patients was also confirmed in other studies [22, 29, 51, 52].
In kidney transplant patients, the occurrence of carotid lesions was previously
showed to be associated with age and the occurrence of arterial hypertension
[53]. Importantly, despite satisfactory transplant organ function, substantial
progression of carotid plaques was reported, which was associated with age,
smoking, dialysis vintage and hyperphosphatemia [54]. In the present study we
found that, except for age and male sex, only the duration of pre-transplant
renal insufficiency independently increased the burden of calcified carotid
plaques, and as we excluded the latter variable, only age and previous MACE
remained significant. This is in line with another report, where the severity of
the carotid plaque score was significantly higher in the MACE group than in the
MACE-free group in asymptomatic CKD patients [55]. Similarly, age and coronary
artery calcification score were independently associated with carotid plaques in
dialysis patients [29]. Interestingly, in some reports a significantly greater
plaque prevalence in dialysis patients in comparison with healthy controls was
identified despite similar IMT [45, 56]. It is also worth noticing that in our
cohort, there was a substantial percentage of patients with IMT
Disappointingly, when we analyzed the potential associations of numerous
biochemical or hormonal markers with IMT or the occurrence of carotid plaques,
none of investigated inflammatory, vascular or calcium-phosphate parameters was
confirmed as an independent variable in multivariate analyses. Previously,
atherosclerotic plaque occurrence and progression were found to be associated
with higher IL-6 levels [60] and
The main limitation of our analysis is its cross-sectional character and inclusion of 3 KTRs cohorts. However, there was a high uniformity in the methodology of these 3 cohorts, with all ultrasound examinations performed by a single investigator, using the same measurement protocol. In our study cohort, several clinical characteristics and several biochemical parameters were not available for each of study patients. Only the smoking status at the time of the study was available, whereas we have no data concerning the lifetime smoking habits. This may have explained why smoking was not found to be an independent parameter which influenced IMT or the occurrence of calcified plaques in the univariate or multivariate analyses. Finally, as calcium-phosphate metabolism before and during dialysis therapy is the crucial factor for accelerated calcification of the vessel wall, it would have been important to analyze data concerning the maximum pre-transplant phosphate and iPTH levels, as well as the use and effect of phosphate-lowering regimens, which were not available in our study group.
In this study, we described in detail the distribution of two different atherosclerotic measures—IMT and carotid plaques—in a large cohort of stable kidney transplant recipients. In addition, the profiles of different clinical risk factors associated with both those vascular entities were identified. We large side-to-side differences in IMT values and carotid plaque distribution in a substantial percentage of KTRs, which presents a high epidemiologic burden for carotid and general atherosclerosis. None of the analyzed vascular and calcium-phosphate metabolism biomarkers was associated with any of the carotid atherosclerosis measurements. Due to the high risk for CV complications and death among recipients of successful kidney transplants, the independent assessment of both IMT and calcified carotid lesions should be advocated, as it may increase the ability to identify those KTRs with the highest CV risk.
AK designed the research study. AK, BS, MS and RS performed the research. RF and JC provided help and advice on statistical analysis, manuscript and figures preparation. AK analyzed the data and wrote the manuscript. AW critically reviewed the manuscript. All authors contributed to editorial changes in the manuscript. All authors read and approved the final manuscript.
The study research was conducted as a part of our previous clinical studies, all were accepted by the Bioethics Committee of the Medical University of Silesia (KNW/0022/KB1/81/10, KNW/0022/KB1/93/13, KNW/0022/KB1/35/I/15). All participants gave their written informed consent. The study was conducted in accordance with the Declaration of Helsinki.
Not applicable.
This research received no external funding.
The authors declare no conflict of interest.
Publisher’s Note: IMR Press stays neutral with regard to jurisdictional claims in published maps and institutional affiliations.