
† These authors contributed equally.
Academic Editors: Brian Tomlinson and Takatoshi Kasai
Low left ventricular ejection fraction (LVEF) was always considered a high-risk
factor for surgery. A growing number of patients with preoperative low LVEF have
undergone cardiac surgery in recent years. The transition of postoperative LVEF
and its correlation with short-term outcomes is not yet clear. We retrospectively
collected the clinical data of cardiac surgery patients with low preoperative
LVEF (
Left ventricular ejection fraction (LVEF) is the most frequently used indicator of cardiac function [1, 2]. Patients with low preoperative LVEF are at high risk in cardiac surgery, with associations with substantially elevated postoperative morbidity and mortality [3, 4]. With improvements to surgical procedures and the use of various circulatory support devices and drugs, outcomes after cardiac surgery have improved over time, leading to a decrease in surgical contraindications and broad adjustment in the range of preoperative risk assessment [5, 6]. The safety of cardiac surgery among patients with preoperative cardiac insufficiency has been well established by several studies [7, 8, 9].
A large number of studies have verified the correlation between preoperative LVEF and patient prognosis, but little attention has been paid to the transition of postoperative LVEF. LVEF is usually monitored on an ongoing basis to evaluate the outcome of the surgery and the patients’ recovery of cardiac function, sometimes as reference for transfer out of the intensive care unit (ICU) or discharge [10, 11]. Patients with shorter-term changes in LVEF after surgery are of concern to clinicians, especially those who already had low LVEF before surgery. Studies have shown that the LVEF of some patients does not improve from surgery but decreases in the early postoperative period, confusing clinicians about surgical and patient outcomes [12, 13]. Further studies have revealed that preoperative LVEF may be affected by the structural compensation of the heart itself or other factors that cannot fully reflect actual cardiac function [14, 15]. The prognostic value of LVEF and its short-term changes among cardiac surgery patients remains understudied in the real world. Questions concerning low LVEF in patients need answering to guide treatment decisions.
The aim of this study was to investigate the change in LVEF and prognosis of patients with low preoperative LVEF after cardiac surgery. At the same time, we explored the predictive value of postoperative LVEF for patient prognosis.
This retrospective cohort study enrolled patients with preoperative low LVEF who underwent cardiac surgery between 1 January and 31 December 2018 in Zhongshan Hospital, Shanghai, China. Patients younger than 18 years of age and pregnant patients were excluded from the study.
All patients underwent formal two-dimensional echocardiography less than 2 weeks prior to surgery and at least twice after surgery during hospitalization. Patients received standard anesthetic care and monitoring during the procedure and were transferred to the intensive care unit (ICU) after surgery. Standard care was provided by intensivists, respiratory therapists and ICU nurses. Standard therapy included fluid management, airway management, vasoactive medications, and inotropic and mechanical circulatory support according to hemodynamic status. The decision to discharge from the ICU was made by intensivists, based on the patient’s general condition. Data were collected from the electronic medical records during hospitalization.
Preoperative characteristics, including patient demographics and comorbidities were collected retrospectively. The latest measurement of preoperative LVEF (LVEF_Pre), first measurement of postoperative LVEF (LVEF_First), lowest level of postoperative LVEF (LVEF_Low), and last measurement of postoperative LVEF (LVEF_Last) were recorded. Laboratory measurements including creatinine, cardiac troponin T (cTnT), and N-terminal pro-brain natriuretic peptide (NT-proBNP) and were measured pre-operatively and within 24 h after the surgery. In addition, we collected information about patients’ procedures, supportive therapies (such as intra-aortic balloon pump, renal replacement therapy and inhaled nitric oxide), and clinical outcomes during hospitalization. All data were obtained from the patients’ electronic medical record system.
The LVEF and tricuspid annular plane systolic excursion (TAPSE) values were measured using echocardiography, and the LVEF was evaluated using Simpson’s biplane method. Comorbid conditions were evaluated using the Charlson Comorbidity Index. EuroSCORE was used to calculate the predicted operative mortality for patients undergoing cardiac surgery. APACHE II was used to evaluate the severity of the patient’s condition after patients were transferred to ICU following surgery. These scores were evaluated by the intensivists.
Preoperative low LVEF was defined as the latest measurement of preoperative
echocardiography showing LVEF of
Discrete variables were expressed as numbers and percentages and compared using
the Fisher’s exact test. According to the normality of the data, continuous
variables were expressed as mean
A two-piecewise linear regression model was applied to examine the threshold
effect of the LVEF on the composite endpoint using a smoothing function. The
threshold level (i.e., turning point) was determined by trial and error,
including by selection of turning points along a pre-defined interval and then
choosing the turning point that gave the maximum model likelihood. A log
likelihood ratio test was conducted to compare the one-line linear regression
model with a two-piecewise linear model. Statistical tests were two-tailed, and a
value of p
A total of 4402 patients received cardiac surgery in 2018 and were admitted to the ICU in Zhongshan Hospital, of whom 123 patients had low LVEF preoperatively. The median age of the patients was 59 (IQR 53–68) years and 97 patients (78.9%) were male. Patients who underwent aortic valvuloplasty or valve replacement surgery (47.2%) comprised the highest percentage, followed by coronary artery bypass surgery (40.7%) and mitral valvuloplasty or valve replacement (32.5%). The median duration of mechanical ventilation was 2 (IQR 1–3) days, 20 patients (13%) received postoperative intra-aortic balloon pump (IABP) support, 10 patients (4.1%) received renal replacement therapy (RRT), 18 patients (8.9%) received noninvasive ventilation (NIV) after extubation, and 12 patients (8.9%) required tracheotomy (Table 1).
| All patients (n = 123) | Composite outcome negative (n = 88) | Composite outcome positive (n = 35) | p value | ||
| Age (years), median (range) | 59 (53–68) | 60 (52–68) | 59 (55–70) | 0.269 | |
| Sex (male), n (%) | 97 (78.9) | 73 (83.0) | 24 (68.6) | 0.090 | |
| Hypertension, n (%) | 42 (34.1) | 30 (34.1) | 12 (34.4) | 1.000 | |
| Charlson Comorbidity Index, median (range) | 2 (1–3) | 2 (1–3) | 3 (2–4) | 0.009 | |
| APACHE II score, median (range) | 8 (5–11) | 8 (5–10) | 11 (7–14) | 0.002 | |
| EuroSCORE, median (range) | 4 (3–7) | 4 (3–6) | 5 (3–7) | 0.339 | |
| NYHA class, n (%) | 0.429 | ||||
| I | 1 (0.8) | 0 (0.0) | 1 (2.9) | ||
| II | 17 (13.8) | 13 (14.8) | 4 (11.4) | ||
| III | 88 (71.5) | 64 (72.7) | 24 (68.6) | ||
| IV | 17 (13.8) | 11 (12.5) | 6 (17.1) | ||
| Preoperative examinations | |||||
| Creatinine ( |
90 (79–108) | 89 (78–100) | 94 (81–121) | 0.040 | |
| cTnT (ng/mL), median (range) | 0.03 (0.02–0.05) | 0.02 (0.02–0.04) | 0.05 (0.02–0.15) | ||
| NT-proBNP (pg/mL) median (range) | 1865 (1006–4052) | 1562 (1007–3415) | 3114 (1113–5267) | 0.030 | |
| TAPSE |
15 (12.2) | 8 (9.1) | 7 (20.0) | 0.126 | |
| Procedures, n (%) | |||||
| Aortic valvuloplasty or valve replacement | 58 (47.2) | 48 (54.5) | 10 (28.6) | 0.010 | |
| Mitral valvuloplasty or valve replacement | 40 (32.5) | 31 (35.2) | 9 (25.7) | 0.395 | |
| Tricuspid valvuloplasty or valve replacement | 28 (22.8) | 20 (22.7) | 8 (22.9) | 1.000 | |
| Coronary artery bypass surgery | 50 (40.7) | 29 (33.0) | 21 (60.0) | 0.008 | |
| Others | 8 (6.5) | 3 (3.4) | 5 (14.3) | 0.041 | |
| Off-pump surgery | 31 (25.2) | 18 (20.5) | 13 (37.1) | 0.054 | |
| Postoperative examinations | |||||
| Creatinine ( |
116 (92–156) | 106 (90–130) | 156 (120–212) | ||
| cTnT (ng/mL), median (range) | 0.50 (0.31–0.95) | 0.46 (0.26–0.80) | 0.68 (0.39–1.73) | 0.004 | |
| NT-proBNP (pg/mL), median (range) | 4915 (2899–9201) | 3640 (2572–5752) | 12925 (8962–28641) | ||
| TAPSE |
43 (35.0) | 28 (31.8) | 15 (42.9) | 0.296 | |
| LVEF (%), median (range) | |||||
| LVEF_Pre | 37 (33–39) | 37 (34–39) | 35 (30–37) | 0.003 | |
| LVEF_First | 35 (30–42) | 37 (32–44) | 30 (25–35) | ||
| LVEF_Low | 34 (28–41) | 36 (31–42) | 27 (23–33) | ||
| LVEF_Last | 40 (35–45) | 40 (35–45) | 40 (33–43) | 0.222 | |
| Low LVEF, n (%) | |||||
| LVEF_First | 88 (71.5) | 57 (64.8) | 31 (88.6) | 0.008 | |
| LVEF_Low | 92 (74.8) | 61 (69.3) | 31 (88.6) | 0.026 | |
| LVEF_Last | 68 (55.3) | 47 (53.4) | 21 (60.0) | 0.507 | |
| Inotropic or vasopressor drugs | |||||
| Epinephrine, n (%) | 18 (14.6) | 10 (11.4) | 8 (22.9) | 0.104 | |
| Norepinephrine, n (%) | 67 (54.5) | 47 (53.4) | 20 (57.1) | 0.708 | |
| Milrinone, n (%) | 49 (39.8) | 36 (40.9) | 13 (37.1) | 0.700 | |
| Dobutamine, n (%) | 50 (40.7) | 32 (36.4) | 18 (51.4) | 0.125 | |
| Levosimendan, n (%) | 12 (9.8) | 8 (9.1) | 4 (11.4) | 0.954 | |
| Supportive therapies | |||||
| IABP, n (%) | 16 (13.0) | 4 (4.5) | 12 (34.3) | ||
| RRT, n (%) | 5 (4.1) | 2 (2.3) | 3 (8.6) | 0.139 | |
| iNO, n (%) | 3 (2.4) | 1 (1.1) | 2 (5.7) | 0.195 | |
| Length of mechanical ventilation (day), median (range) | 2 (1–3) | 1 (1–2) | 5 (2–8) | ||
| Noninvasive ventilation, n (%) | 11 (8.9) | 4 (4.5) | 7 (20.0) | 0.012 | |
| Tracheotomy, n (%) | 11 (8.9) | 0 (0.0) | 11 (31.4) | ||
| Length of ICU stay (day), median (range) | 4 (2–7) | 3 (2–5) | 11 (8–14) | ||
| Length of hospital stay (day), median (range) | 17 (13–24) | 15 (11–18) | 28 (20–43) | ||
| Composite outcome: hospital mortality or ICU stay more than 7 days. NYHA, New York Heart Association; cTnT, cardiac troponin T; NT-proBNP, N-terminal pro-brain natriuretic peptide; TAPSE, tricuspid annular plane systolic excursion; LVEF, left ventricular ejection fraction; IABP, intra-aortic balloon pump; RRT, renal replacement therapy; iNO, inhaled nitric oxide; ICU, intensive care unit. | |||||
For 123 patients with preoperative low LVEF, the latest measurement of preoperative LVEF was 37% (IQR 33%–39%). In the first echocardiography after surgery, a total of 88 patients (71.5%) had low LVEF, and the mean LVEF was 35% (IQR 30%–42%). The lowest level of postoperative LVEF in these patients was 34% (IQR 28%–41%), with low LVEF in 92 cases (74.8%). At the final measurement during hospitalization, LVEF increased to 40% (IQR 35%–45%), and the number of low LVEF cases dropped to 68 (55.3%) (Table 1, Fig. 1).
 Fig. 1.
Transition of LVEF during the perioperative period. The colored lines represent LVEF measurements at four time points in individual patients. Box-and-whisker plots are used to depict median, interquartile interval, minimum and maximum.
Of 123 patients, four patients died, giving a mortality rate of 3.3%. The
overall length of ICU stay was 4 days (IQR 2–7 days) and length of hospital stay
was 17 days (IQR 13–24 days). A total of 35 patients (28.5%) met the composite
endpoint of death or ICU
Univariate logistic regression analysis showed that higher preoperative cTnT
(per 0.1 ng/mL, OR = 3.52, 95% CI 1.75–8.51), APACHE II score (OR = 2.01, 95%
CI 1.35–3.16), postoperative cTnT (per 0.1 ng/mL, OR = 1.78, 95% CI
1.24–2.84), and postoperative NT-proBNP (per 10000 pg/mL, OR = 2.78, 95% CI
1.76–4.93) were risk factors for the composite endpoint of death or ICU
 Fig. 2.
Odds ratio and area under the curve of indicators for composite outcome. Each line segment indicates the corresponding Odds ratio and 95% confidence interval for each risk factor.
Two smooth curves were fitted, and the relationship between LVEF_Pre and
LVEF_Low with composite endpoint was assessed. Adjusted smoothed plot shows a
non-linear relationship between composite endpoint and LVEF_Pre (p for
likelihood ratio test (LRT)
| Models | LVEF_Pre | LVEF_ Low | |||
| Adjusted OR (95% CI) | p value | Adjusted OR (95% CI) | p value | ||
| Model I | |||||
| One line slope | 0.85 (0.76–0.94) | 0.83 (0.76–0.91) | |||
| Model II | |||||
| Turning point (K) | 34 | 22 | |||
| 1.01 (0.85–1.21) | 0.88 | 1.93 (0.75–4.96) | 0.17 | ||
| 0.58 (0.42–0.80) | 0.80 (0.72–0.89) | ||||
| LRT | 0.007 | 0.119 | |||
| Model I: linear analysis; Model II: non-linear analysis. p value Adjusted: adjusted for sex, age, APACHE II, EuroSCORE. LRT, likelihood ratio test; LVEF, left ventricular ejection fraction; CI, confidence interval; OR, odds ratio. | |||||
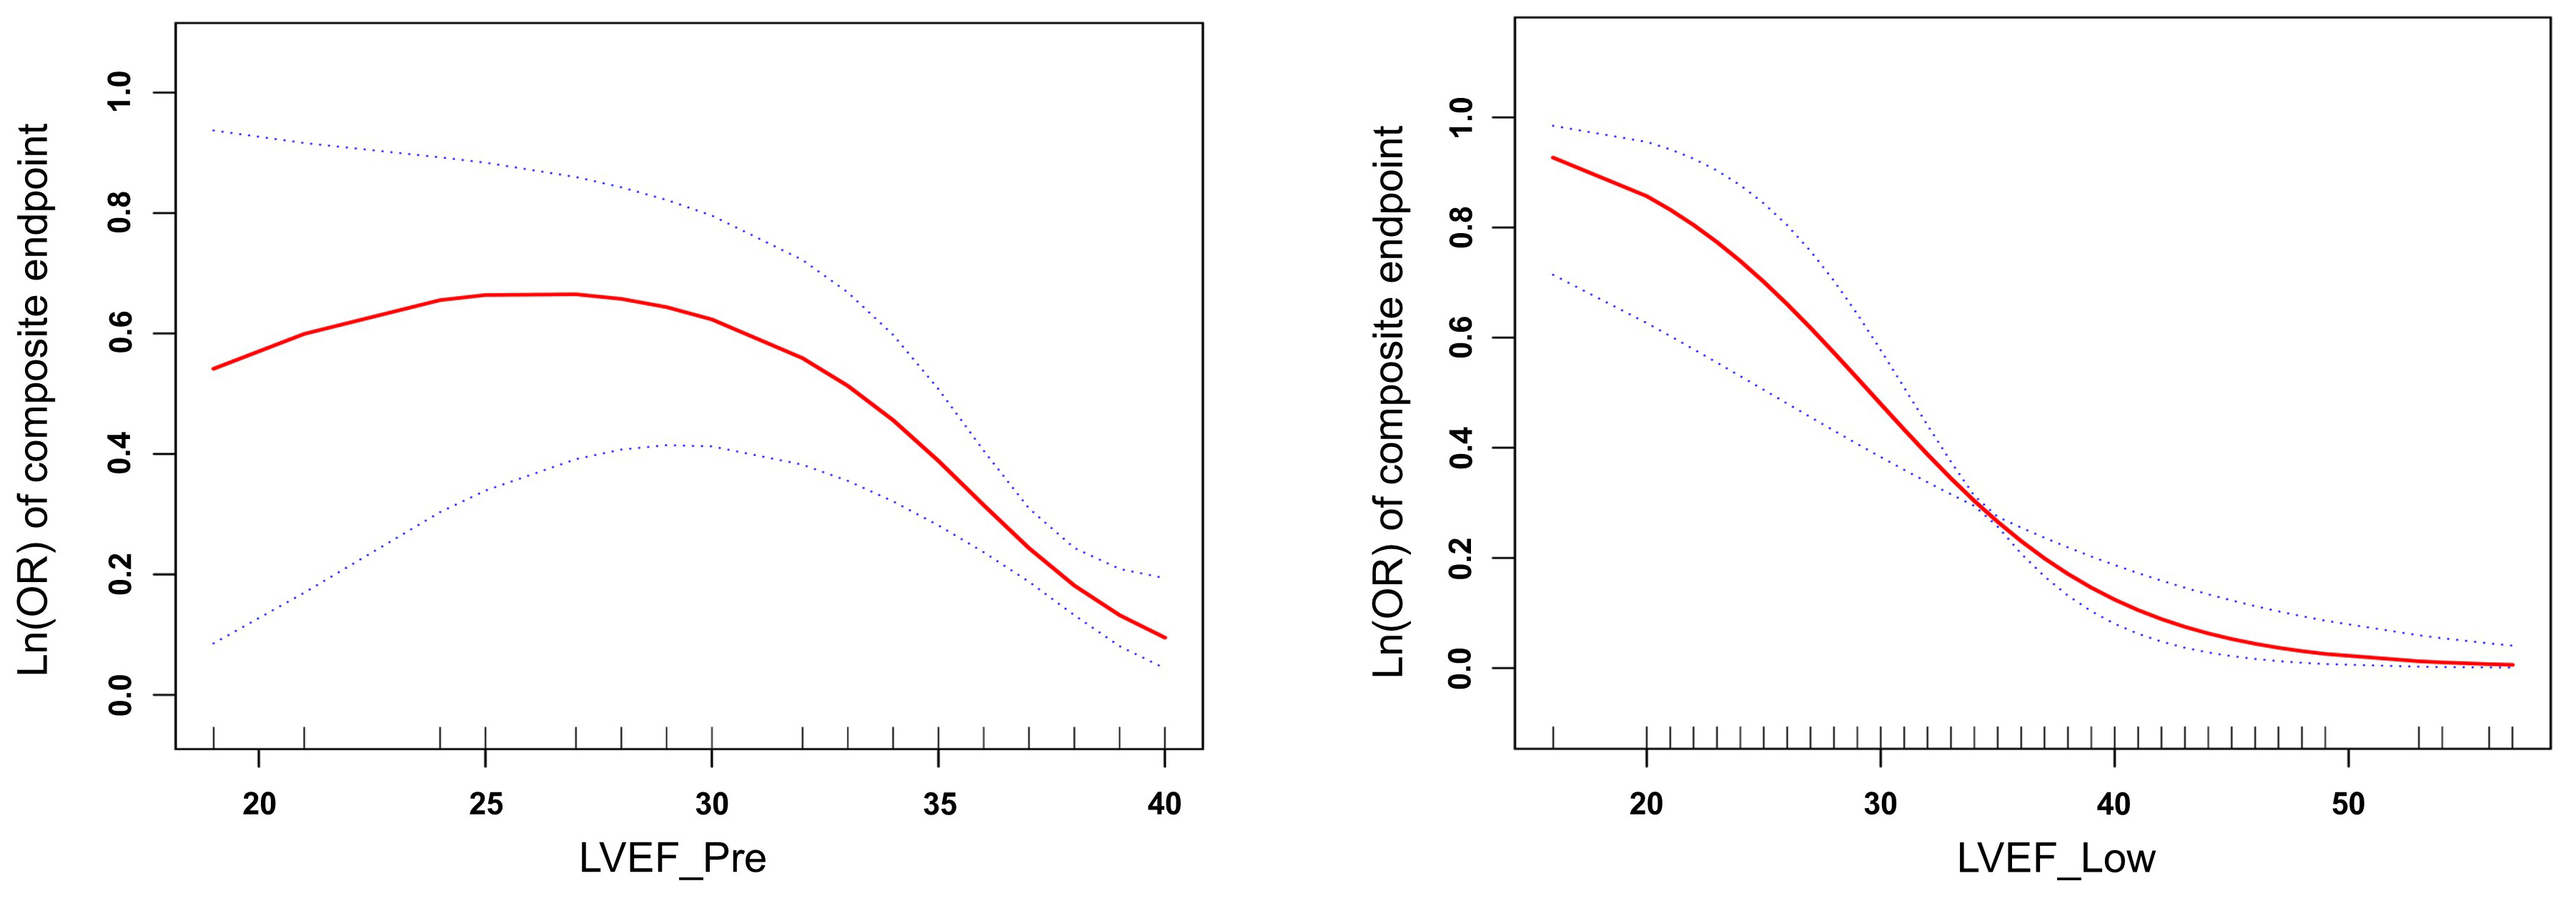 Fig. 3.
Relationship between left ventricle ejection fraction (LVEF) and log odds ratio Ln(OR) of the composite endpoint after controlling for potential confounding variables (adjusted for sex, age, APACHE II, EuroSCORE).
Patients with preoperative low LVEF had increased mortality and postoperative
morbidity after cardiac surgery. In our study, the overall mortality rate was
3.3% and a total of 35 patients (28.5%) met the composite endpoint, which was
similar to reports in the literature. In one cohort study, 781 patients underwent
cardiac surgery with a preoperative LVEF
Owing to the relatively small sample size and few events, only univariate analyses were conducted. Some factors, including pre- and postoperative cTnT, NT-proBNP, APACHE II, and LVEF differed significantly between the groups. These factors might be correlated with poor prognosis. On further analysis of the data, postoperative indicators had larger OR values and larger areas under the ROC curve, which seemed to suggest that postoperative indicators were more closely related to patient outcomes than preoperative indicators [17, 18].
In this cursory statistical study, we found a trend that LVEF decreased after
surgery and then gradually increased. Few studies have focused on the short-term
changes in ventricular performance and LVEF before and after cardiac surgery.
Sugimura et al. [19] reviewed the perioperative and 1-year follow-up
data of 436 patients with primary mitral regurgitation to analyze patients’
postoperative evolution of LVEF and its factors. The result showed that overall
mean LVEF slightly decreased at 1-year follow-up (mean change of LVEF: –2.63%
With further exploration of the relationship between LVEF and prognosis, we
found that an increased log odds ratio (OR) of composite endpoint was linearly
related to the decreased postoperative LVEF, but not significantly linearly
related to preoperative LVEF. Multiple studies have explored the association
between LVEF and prognosis in cardiac surgery patients and have found that
preoperative LVEF was an independent predictor affecting long-term prognosis. In
a study by Furer et al. [22], patients who underwent transcatheter
aortic valve replacement with preoperative LVEF
We believe that postoperative LVEF can better predict the short-term outcomes of patients undergoing cardiac surgery. On the one hand, there is still controversy over whether LVEF reflects true cardiac function. For example, in patients with mitral regurgitation, preoperative LVEF measured by routine echocardiography may underestimate myocardial systolic dysfunction due to structural changes [24]. On the other hand, cardiac surgery is an important factor affecting the prognosis of patients. Postoperative LVEF not only reflects the preoperative cardiac function of patients, but also reflects the effect of cardiac surgery on patients. From further analysis of postoperative LVEF in this study, we recommend that short-term prognosis of patients with preoperative low LVEF should be evaluated according to postoperative LVEF.
There were some limitations that should be addressed in this study. First, this was a retrospective cohort study with a small sample size. The number of patients with low LVEF before cardiac surgery was limited, even though they were enrolled from a large clinical cohort of over 4000 patients. Further investigation of a larger population is required, to increase statistical power and make the current results more convincing. Second, we only focused on patients’ short-term outcomes during their hospitalization. As the long-term follow-up of these patients had not yet started, data on changes to long-term LVEF and prognosis are missing. A larger sample size and more long-term follow-up data would have made our conclusions more comprehensive and meaningful. Third, only Chinese people were included in this study. Whether this conclusion is also applicable to patients of other races needs further verification.
The mortality rate of patients with low preoperative LVEF was very low at a large-volume cardiovascular center. Most patients experience a short decline in LVEF after surgery and then an increase during hospitalization. The lowest postoperative LVEF was associated with short-term prognosis of patients after cardiac surgery.
JZ, JG, JCL, ZL, GWT—Conception and design; ZL, GWT—Provision of study material or patients; JZ, JCL, YJZ, KY, HW—Collection and assembly of data; JZ, JG, JCL, GWT—Data analysis and interpretation; all authors—Manuscript writing; all authors—Final approval of manuscript.
The study was conducted in accordance with the Declaration of Helsinki, and the protocol was approved by the Ethics Committee of Zhongshan Hospital, Fudan University (B2019-075R). Individual consent for this retrospective analysis was waived.
We would like to express our gratitude to all those who helped us during the writing of this manuscript. Thanks to all the peer reviewers for their opinions and suggestions.
This research was funded by grants from Natural Science Foundation of Shanghai (grant number 20ZR1411100), Science and Technology Commission of Shanghai Municipality (grant number 20DZ2261200), National Natural Science Foundation of China (grant number 82070085), Construction Program of Key but Weak Disciplines of the Shanghai Health Commission (grant number 2019ZB0105), Clinical Research Project of Zhongshan Hospital (grant number 2020ZSLC38 and 2020ZSLC27), Smart Medical Care of Zhongshan Hospital (grant number 2020ZHZS01), Project for Elite Backbone of Zhongshan Hospital (grant number 2021ZSGG06), Foundation For Young Researchers of Zhongshan Hospital (grant number 2021ZSQN22, 2021ZSQN71 and 2021ZSQN72).
The authors declare no conflict of interest.
See Table 3 for details.
| LVEF_Pre | LVEF_Low | |||
| OR (95% CI) | p value | OR (95% CI) | p value | |
| Crude | 0.897 (0.825–0.975) | 0.011 | 0.886 (0.836–0.940) | |
| Included one covariate in a separate logistic regression model | ||||
| + Age | 0.899 (0.826–0.977) | 0.012 | 0.883 (0.832–0.937) | |
| + Sex | 0.883 (0.809–0.964) | 0.005 | 0.882 (0.831–0.937) | |
| + Charlson Comorbidity Index | 0.898 (0.824–0.978) | 0.014 | 0.878 (0.828–0.931) | |
| + APACHE II score | 0.899 (0.823–0.982) | 0.018 | 0.893 (0.841–0.948) | |
| + Preoperative Creatinine | 0.897 (0.825–0.975) | 0.011 | 0.881 (0.829–0.935) | |
| + Preoperative cTnT | 0.898 (0.823–0.981) | 0.017 | 0.883 (0.829–0.942) | |
| + Preoperative NT-proBNP | 0.900 (0.826–0.980) | 0.015 | 0.888 (0.838–0.941) | |
| + Coronary artery bypass surgery | 0.905 (0.831–0.987) | 0.024 | 0.876 (0.825–0.941) | |
| + Postoperative Creatinine | 0.895 (0.821–0.975) | 0.011 | 0.881 (0.829–0.936) | |
| + Postoperative cTnT | 0.889 (0.816–0.970) | 0.008 | 0.893 (0.842–0.947) | |
| + Postoperative NT-proBNP | 0.891 (0.814–0.976) | 0.013 | 0.896 (0.840–0.956) | 0.001 |
| + IABP | 0.910 (0.832–0.995) | 0.038 | 0.885 (0.831–0.943) | |
| Included two covariates in a separate logistic regression model | ||||
| + IABP+ Coronary artery bypass surgery | 0.912 (0.833–0.998) | 0.045 | 0.878 (0.823–0.937) | |
| + Age + APACHE II score | 0.899 (0.823–0.982) | 0.018 | 0.891 (0.838–0.946) | |
| + Charlson Comorbidity Index + APACHE II score | 0.901 (0.824–0.984) | 0.021 | 0.884 (0.832–0.939) | |
| + APACHE II score+ Preoperative cTnT | 0.895 (0.815–0.983) | 0.020 | 0.887 (0.830–0.948) | |
| + APACHE II score+ Preoperative NT-proBNP | 0.900 (0.823–0.985) | 0.021 | 0.894 (0.842–0.949) | |