
† These authors contributed equally.
Academic Editor: Takatoshi Kasai
Coronary artery disease (CAD) is the most common cardiovascular disease worldwide. In this study, we investigated the pathogenesis of CAD. We downloaded the GSE98583 dataset, including 12 CAD samples and 6 normal samples, from the Gene Expression Omnibus (GEO) database and screened differentially expressed genes (DEGs) in CAD versus normal samples. Next, we performed functional enrichment analysis, protein-protein interaction (PPI) network, and functional module analyses to explore potential functions and regulatory functions of identified DEGs. Next, transcription factors (TFs) and microRNAs (miRNAs) targeting DEGs were predicted. In total, 456 DEGs were identified in CAD and normal samples, including 175 upregulated and 281 downregulated genes. These genes were enriched in the intestinal immune network for immunoglobulin A production and the mitogen-activated protein kinase signaling pathway (e.g., TGFBR2 and EGF). The PPI network contained 212 genes, and HIST1H2BJ, HIST1H2AC, EGF, and EP300 were hub genes with degrees higher than 10. Four significant modules were identified from the PPI network, with genes in the modules mainly enriched in the inflammatory response, protein ubiquitination involved in ubiquitin-dependent protein catabolic processes, protein transport, and mitochondrial translational elongation, respectively. Two TFs (E2F1 and FOXK1) and five miRNAs (miR-122A, miR-516-5P, miR-507, miR-342, and miR-520F) were predicted to target 112 DEGs. miR-122A reportedly targets both LRP10 and IQGAP1 in the TF-miRNA target regulatory network. The abnormal expression of TGFBR2, EGF, LRP10, and IQGAP1 may be implicated in CAD pathogenesis. Our study provides targets and potential regulators for investigating CAD pathogenesis.
Coronary artery disease (CAD), also known as ischemic heart disease, is a group of diseases that includes sudden cardiac death, myocardial infarction, and stable and unstable angina [1]. CAD is the most common cardiovascular disease and is usually characterized by chest discomfort or chest pain [2]. For CAD, primary risk factors include a lack of exercise, smoking, excessive alcohol consumption, high blood pressure, obesity, depression, and poor diet [3, 4]. Additionally, genetics is considered a risk factor for developing CAD [5]. In clinical practice, CAD can be diagnosed by employing coronary angiography, electrocardiogram, coronary computed tomographic angiography, and cardiac stress testing [6]. In 2015, 110 million CAD cases were reported, leading to 8.9 million deaths, thus making it the leading cause of disease-related deaths globally [7]. Therefore, elucidating mechanisms that underlie CAD is of considerable importance and significance.
Kalirin (KALRN) reportedly inhibits the activities of guanine-exchange
factor and inducible nitric oxide synthase, which play important roles in the CAD
mechanism via the Rho GTPase signaling pathway [8]. Decreased adiponectin and
increased interleukin-6
(IL-6) levels promote CAD progression in epicardial adipose tissues [9, 10]. Moreover, levels of
neuregulin-4 (Nrg4) are found to be inversely related to the development
and severity of CAD [11]. Transforming growth factor-
Microarray studies of human diseases, including CAD, are limited owing to a lack of human disease tissues or appropriate disease models. Peripheral blood plays a crucial role in mediating immune responses, metabolism, and intercellular communication, as well as affords convenient sample collection; accordingly, it is an ideal tissue for biomarker detection [18, 19]. Moreover, gene expression in peripheral blood could reflect CAD severity [20, 21]. Additionally, Taurino et al. [22] revealed that analyzing gene expression in whole blood is useful for detecting genes that determine cardiovascular phenotypes, including those implicated in the pathogenesis and progression of CAD. In the present study, we utilized the microarray dataset GSE98583, contributed by Kumar and Kashyap et al. [23]. In the study by Kumar and Kashyap et al. [23], differentially expressed genes (DEGs) of different disease severities were identified, followed by functional enrichment and other analyses to explore candidate genes and pathways contributing to CAD severity. In the present study, we primarily identified DEGs in CAD and control samples, followed by functional enrichment and prediction of transcription factors (TFs) and microRNAs (miRNAs) regulating these DEGs, to elucidate potential genes and their corresponding regulators involved in CAD pathogenesis. This study will provide deeper insights into the pathogenesis of CAD and provide a theoretical basis for developing targeted therapy.
In the present study, all datasets were downloaded from public databases, which allowed researchers to download and analyze public datasets for scientific purposes. Therefore, ethical approval was not required.
We downloaded and used the microarray
dataset GSE98583 from the Gene Expression Omnibus (GEO,
http://www.ncbi.nlm.nih.gov/geo/) database, which is based on the GPL571
[HG-U133A_2] Affymetrix Human Genome U133A 2.0 Array. The
GSE98583 dataset included 12
whole blood samples from non-diabetic male patients with CAD
based on their coronary angiogram results. Of the 12 patients, 6 presented
single-vessel disease (stenosis
The original CEL files were downloaded and preprocessed using the
R package Oligo (version 1.34.0, http://bioconductor.org/help/search/index.html?q=oligo/,
Johns Hopkins University, Baltimore, MD, USA.) [24]. Data preprocessing
involved data format conversion, filling missing data, background correction, and
data standardization. Next, the probes were annotated and combined with platform
annotation files. Probes that could not be matched to gene
symbols were filtered out. For multiple
probes mapped to one gene symbol, the average value of the probes was obtained as
the expression value of the corresponding gene symbol. Using the R package Limma
(version 3.10.3, http://www.bioconductor.org/packages/release/bioc/html/limma.html,
Walter and Eliza Hall Institute of Medical Research, Melbourne, Australia) [25],
we analyzed DEGs between CAD and control samples. Genes with a P-value
of
Based on the Database for Annotation, Visualization and Integrated Discovery
(DAVID, version 6.8, https://david.ncifcrf.gov/, Laboratory ofHuman
Retrovirology and Immunoinformatic, USA) tool [26],
Gene Ontology (GO) terms [27] and Kyoto
Encyclopedia of Genes and Genomes (KEGG) pathway [28] enrichment analyses were
performed for identified DEGs. The number of genes involved in each term was set
at
Combined with the
STRING
(version 10.0, http://string-db.org/) database
[29], PPI pairs were used to predict proteins encoded by identified DEGs. The PPI
score was set at 0.7. Next, a PPI network was constructed for DEGs using the
Cytoscape software (version 3.2.0, http://www.cytoscape.org,
National Institute of General Medical Sciences, USA) [30].
Using the CytoNCA plug-in (version 2.1.6, http://apps.cytoscape.org/apps/cytonca
Central South University, Changsha, China) [31] in Cytoscape with parameter set
as: without weight, we performed network topology analysis to identify the hub
network nodes. Furthermore, significant modules with a score
Using the iRegulon plug-in (version 1.3, http://apps.cytoscape.org/apps/iRegulon,
Laboratory of Computational Biology, KU Leuven, Belgium) [33] in Cytoscape, we
performed a TF-target prediction for the PPI network nodes. The parameters
“minimum identity between orthologous genes” and “maximum false discovery rate
on motif similarity” were set at 0.05 and 0.001, respectively. Results with a
normalized enrichment score (NES) of
The etiology of several chronic diseases is based on interactions between environmental chemicals and genes regulating physiological processes [35]. The Comparative Toxicogenomics Database (CTD, http://ctdbase.org/, NC State University, Raleigh, NC, USA) is a publicly available database for identifying chemical-gene-disease networks [36]. We conducted a CTD search to identify genes and pathways associated with CAD. Next, we performed a Venn analysis to identify overlapping genes and pathways between the CTD database and the microarray dataset GSE98583.
The distribution of expression values after data normalization is shown in Fig. 1. The medians were at the same level, indicating that data preprocessing results were good. According to the screening threshold, a total of 456 DEGs (175 upregulated and 281 downregulated genes) were identified. The clustering heatmap indicated that DEGs could help distinguish samples with different disease statuses (Fig. 2).
 Fig. 1.
The box diagram presents the distribution of expression values after data normalization. Red and white represent disease samples and control samples, respectively.
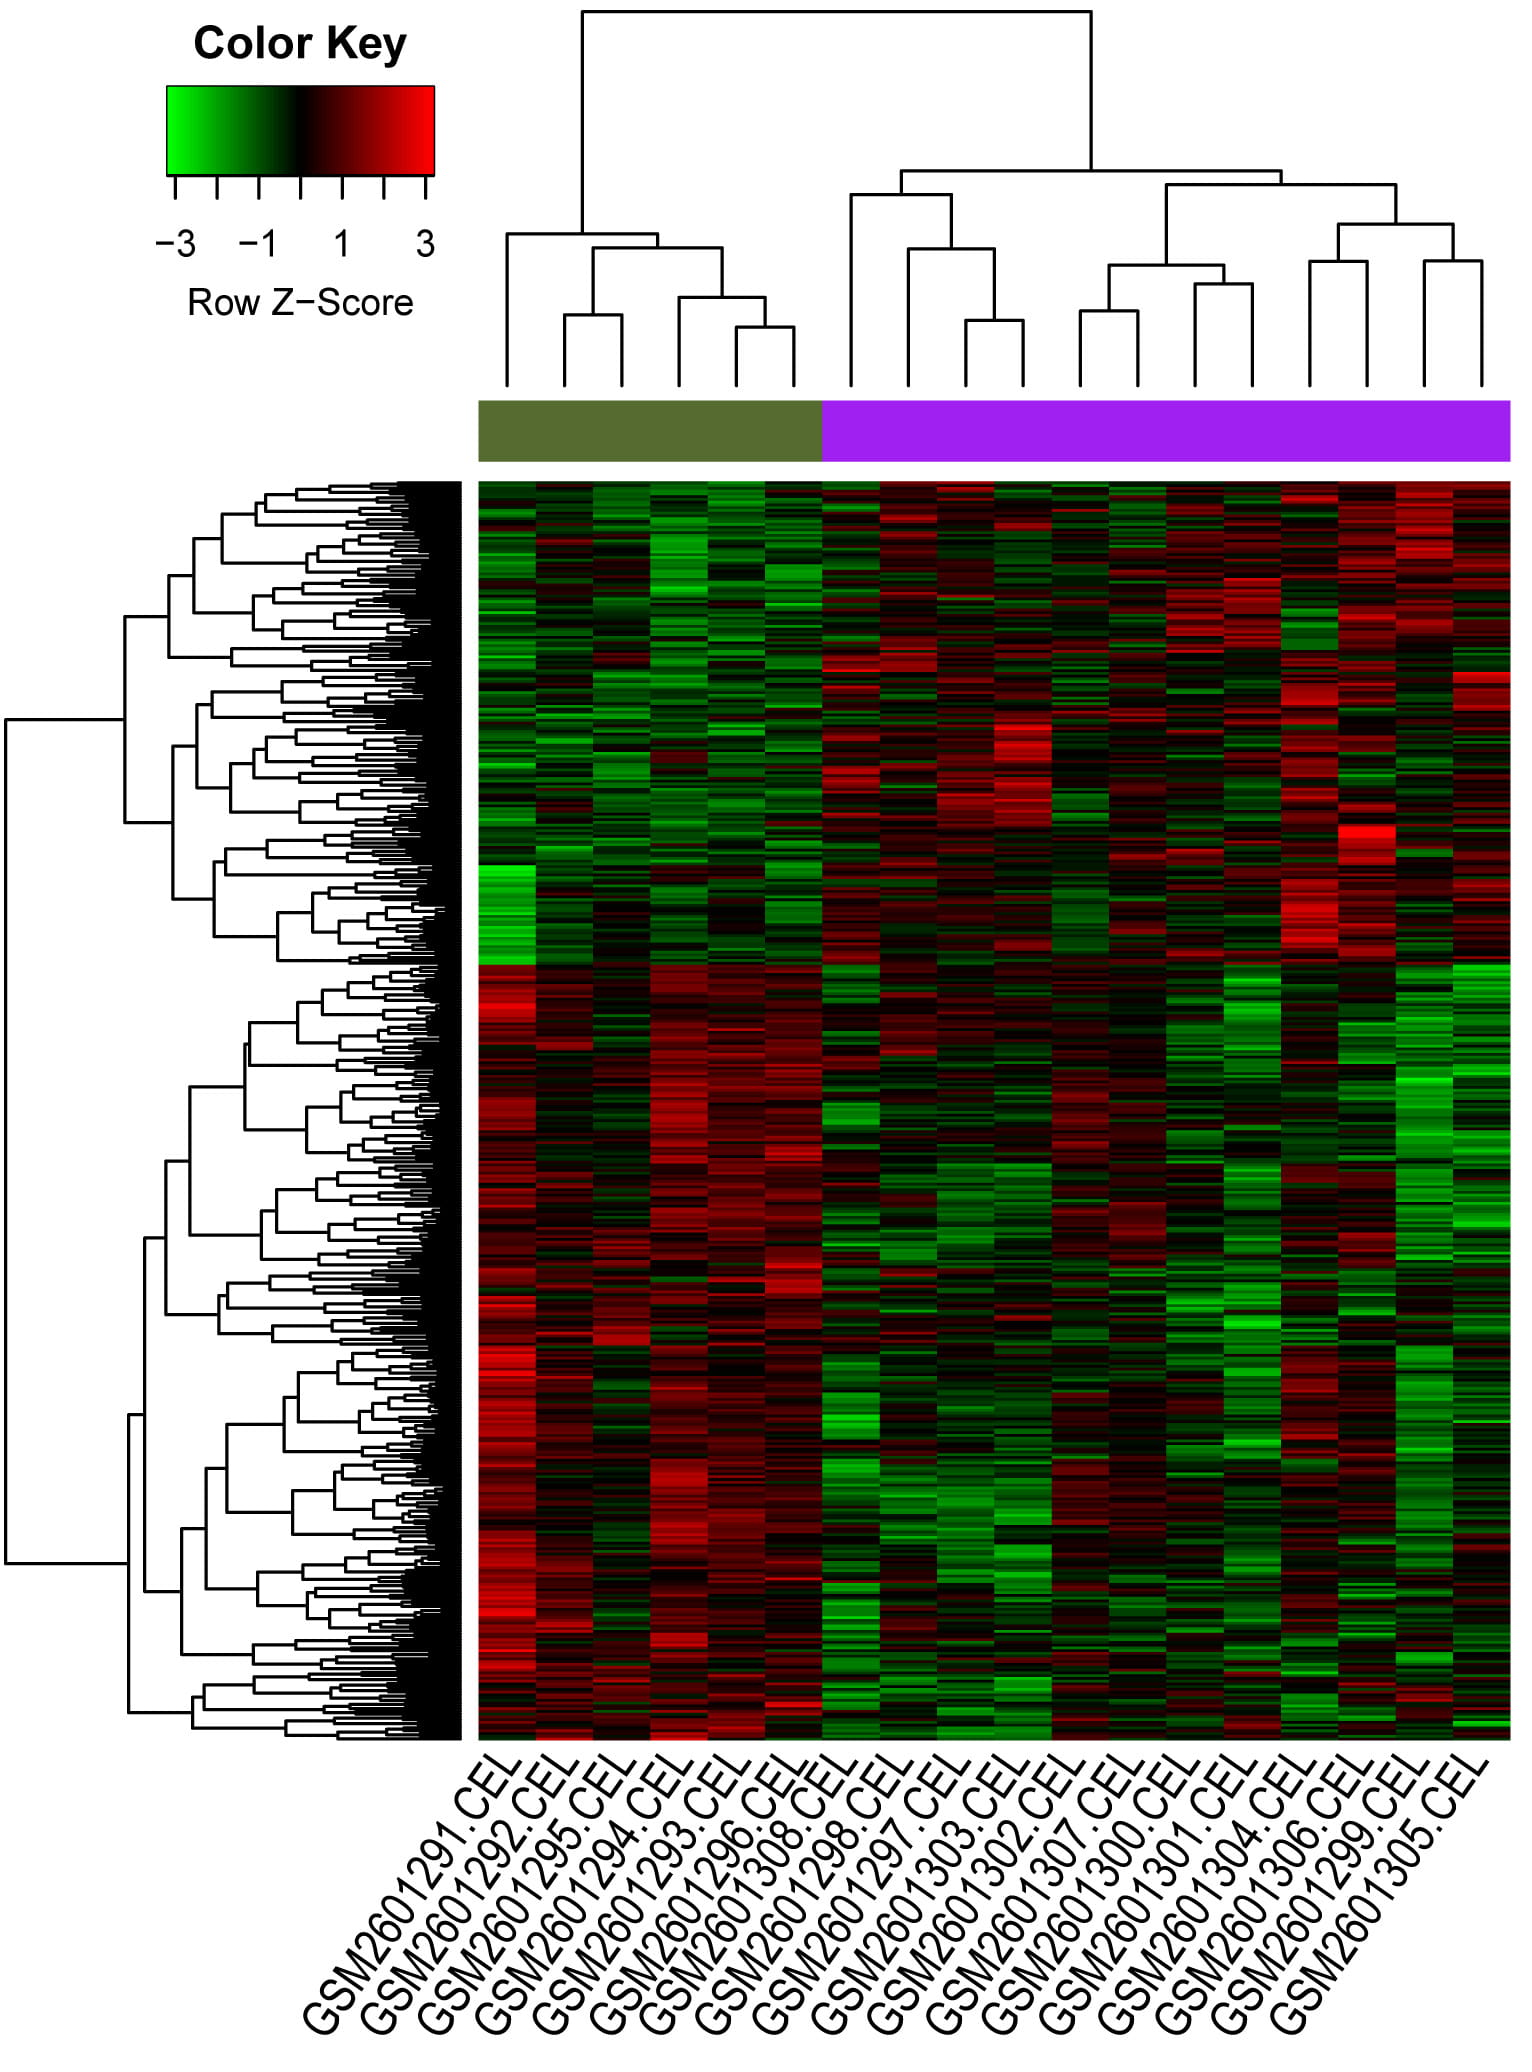 Fig. 2.
The clustering heatmap of the differentially expressed genes (DEGs). Y-axis represents all DEGs, and X-axis represents all samples; the green and purple blocks in upper represent control group and CAD group, respectively.
Multiple GO functional terms were enriched for upregulated and downregulated
genes. For upregulated genes, positive regulation of proteins targeting
mitochondria, the glutathione derivative biosynthetic process, and mitochondrial
translational termination were the primary functional terms that were enriched
(Fig. 3). In contrast, cellular response to mechanical stimulus, centrosome
localization, and thymus development were potential functions of downregulated
genes (top 20 listed, Fig. 4). Meanwhile, the upregulated genes were implicated
in 3 pathways (such as the intestinal immune network for immunoglobulin A (IgA)
production, P = 2.10
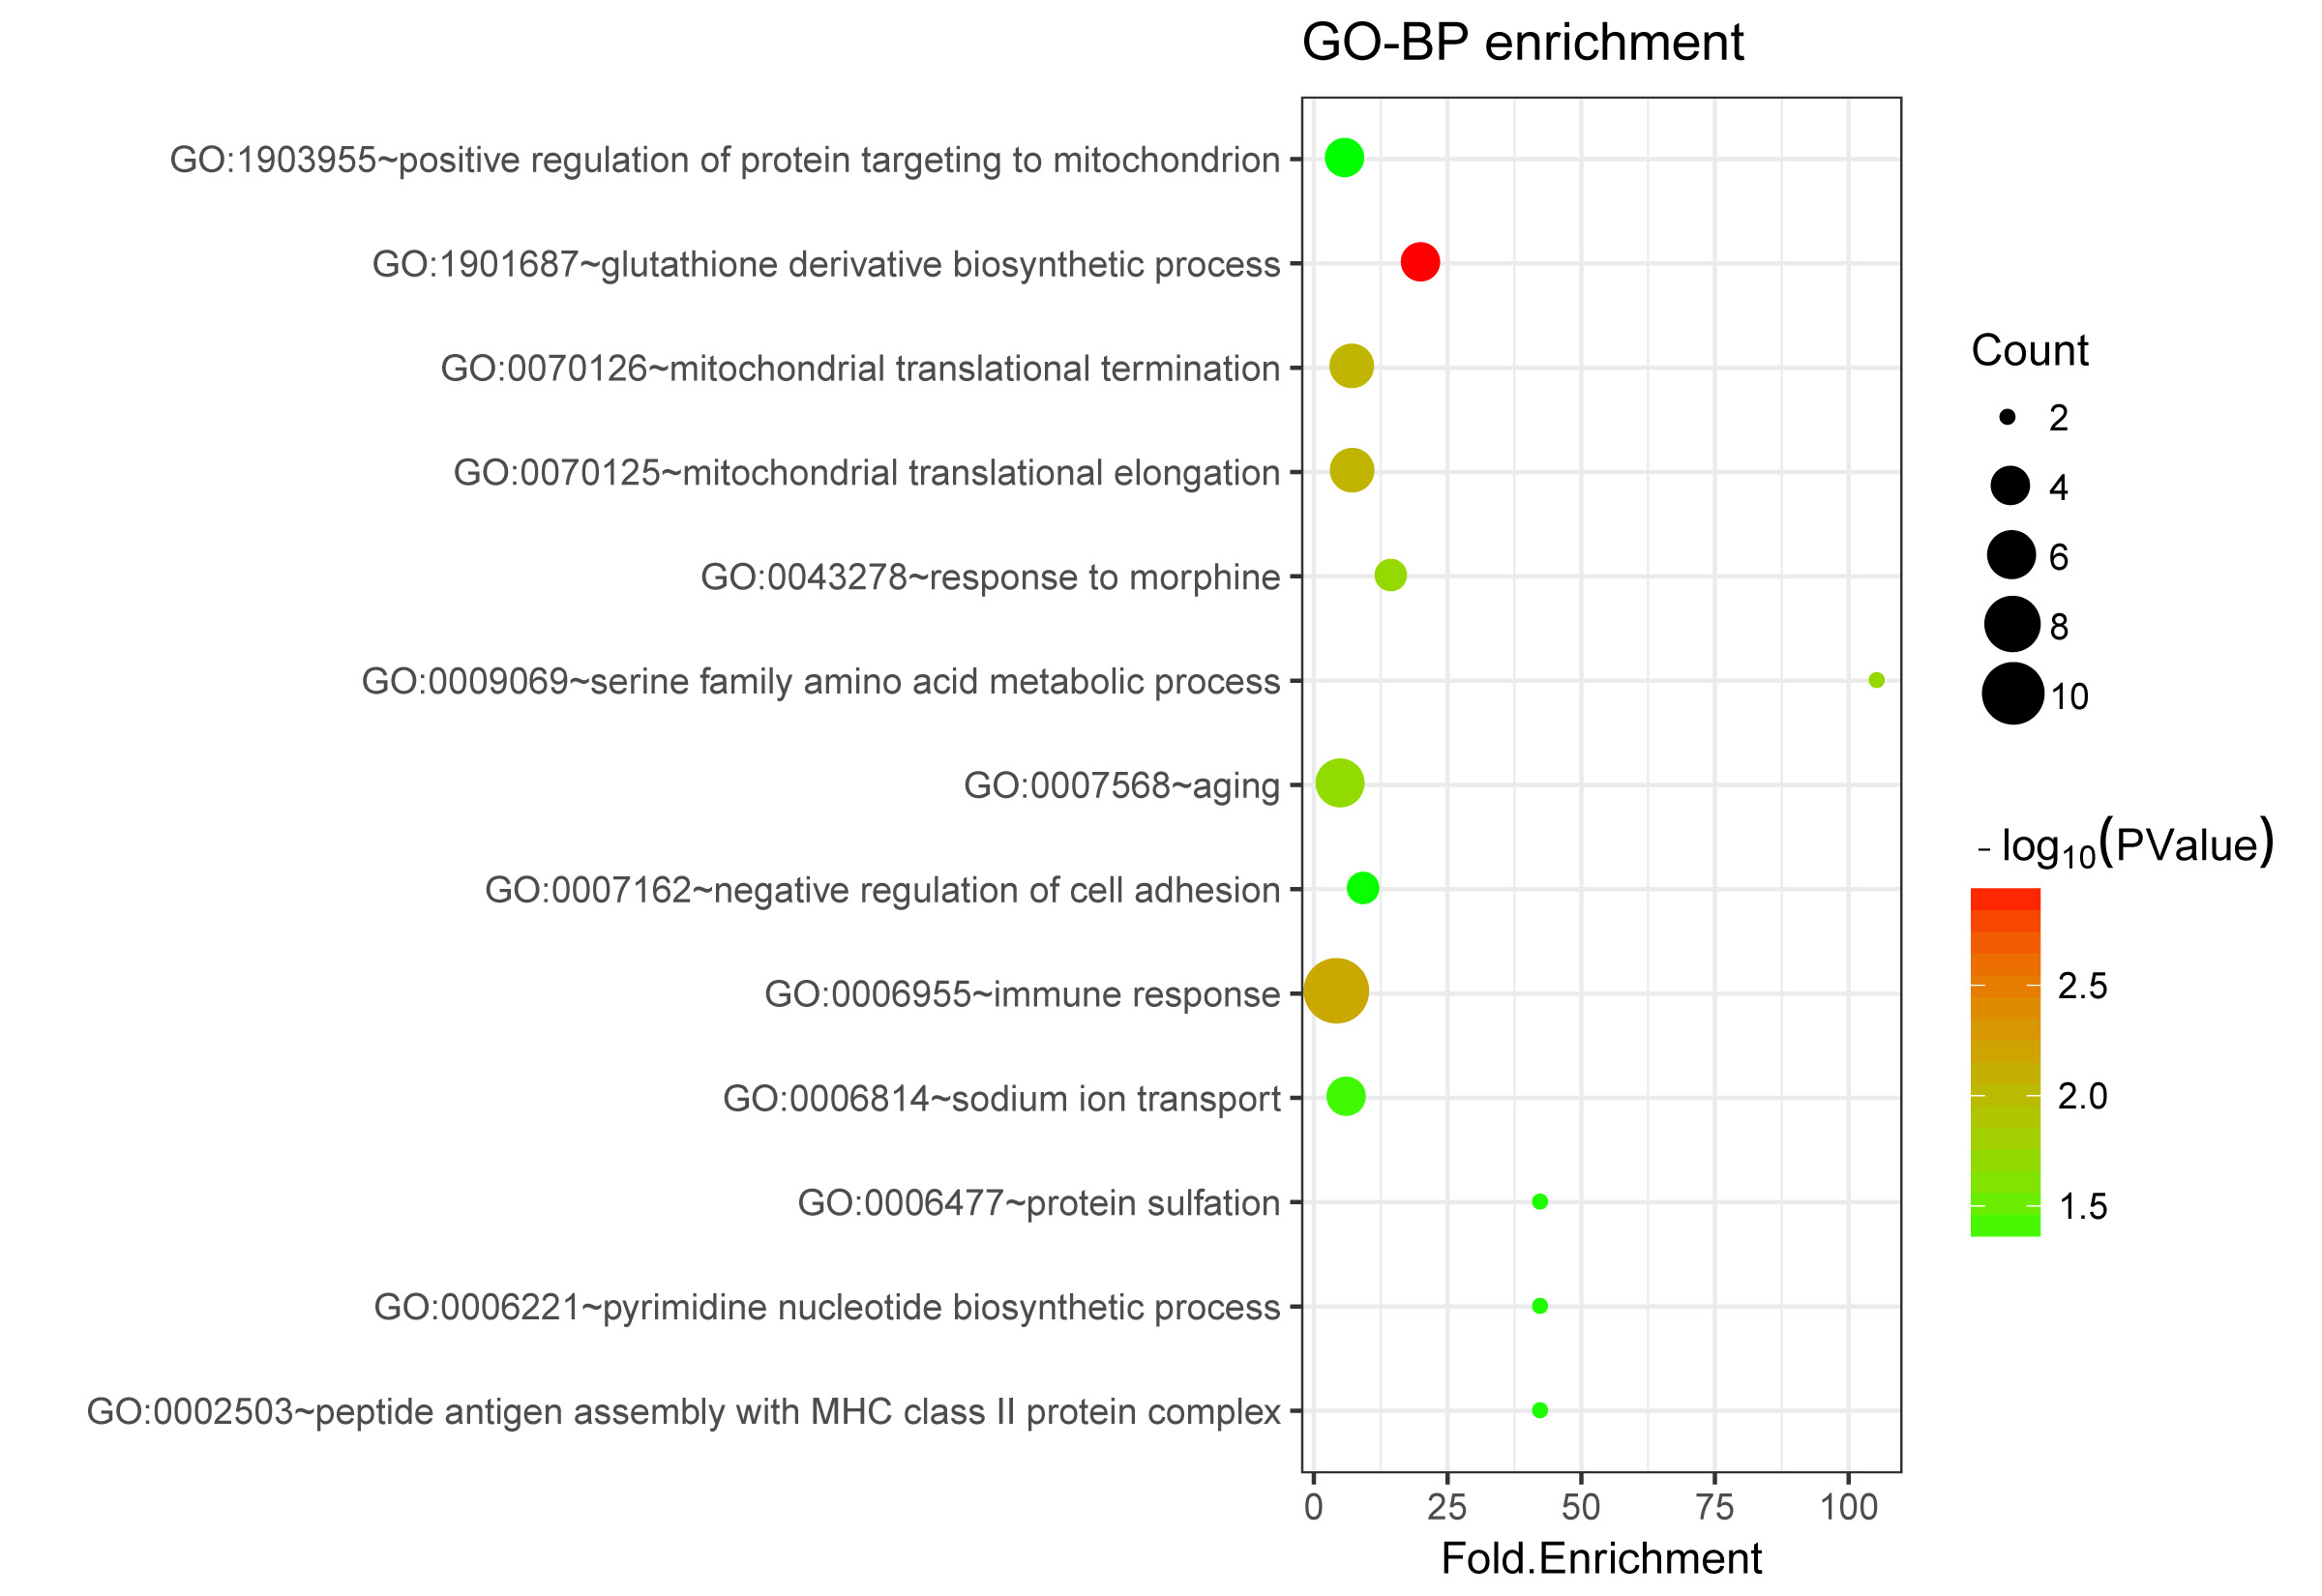 Fig. 3.
The Gene Ontology (GO) terms enriched for upregulated genes.
The size of a circle indicates the number of genes involved in the respective
term. The color change from green to red suggests that the –log
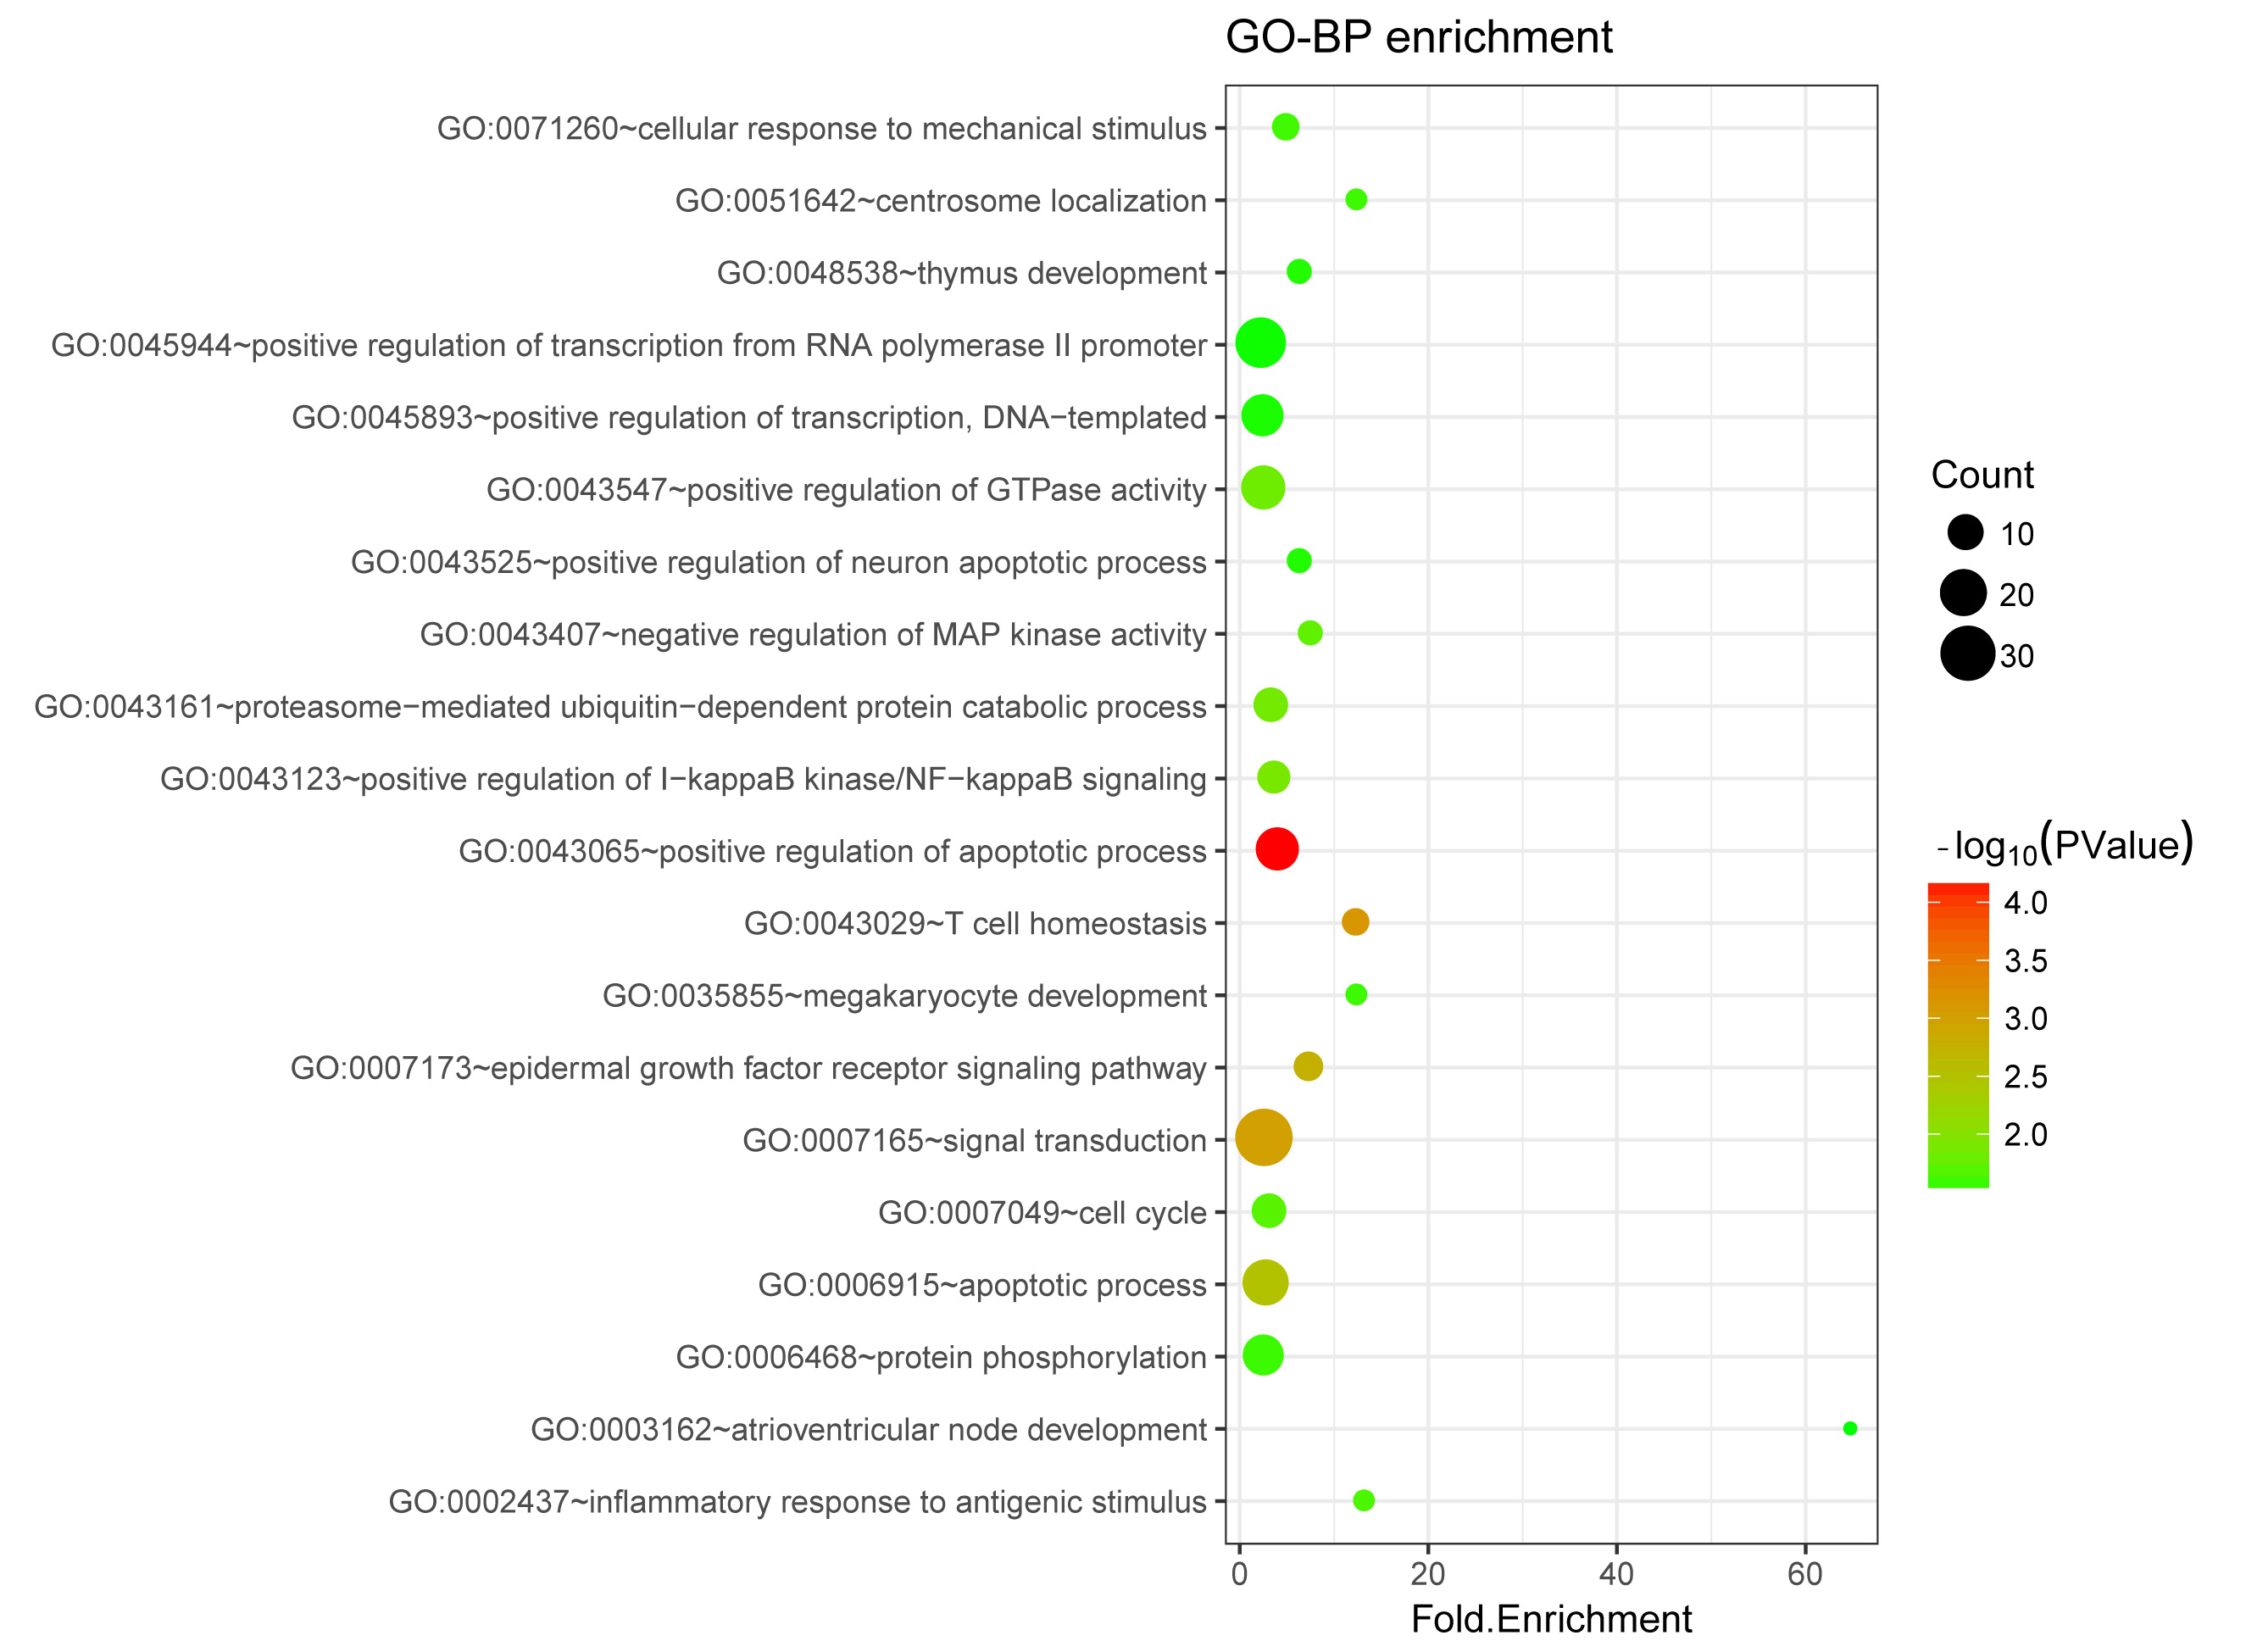 Fig. 4.
The Gene Ontology (GO) terms enriched for downregulated genes.
The size of a circle indicates the number of genes involved in the respective
term. The color change from green to red suggests that the –log
| Category | Pathway ID | Pathway name | Count | P value | Genes |
| UP | hsa04672 | Intestinal immune network for IgA production | 4 | 2.10 |
CD86, IL15, HLA-DMB, HLA-DMA |
| hsa05150 | Staphylococcus aureus infection | 4 | 3.02 |
C3AR1, C3, HLA-DMB, HLA-DMA | |
| hsa00561 | Glycerolipid metabolism | 4 | 3.62 |
AKR1A1, DGKH, AGK, ALDH3A2 | |
| DOWN | hsa04144 | Endocytosis | 14 | 4.61 |
CHMP2A, RAB5B, TGFBR2, CXCR1, CXCR2, VPS37C, EPS15L1, KIT, IGF2R, HSPA6, GIT2, RAB11A, EGF, IQSEC1 |
| hsa05220 | Chronic myeloid leukemia | 7 | 1.42 |
E2F3, GAB2, SOS1, STAT5B, TGFBR2, SOS2, RAF1 | |
| hsa04068 | FoxO signaling pathway | 9 | 2.09 |
EP300, S1PR4, SOS1, PRKAB2, TGFBR2, SOS2, RAF1, EGF, BCL2L11 | |
| hsa05219 | Bladder cancer | 5 | 5.18 |
RPS6KA5, E2F3, RAF1, DAPK2, EGF | |
| hsa04010 | MAPK signaling pathway | 11 | 1.22 |
RPS6KA5, SOS1, TGFBR2, SOS2, MAP2K4, HSPA6, RAF1, CACNB4, RAPGEF2, EGF, DUSP6 | |
| hsa05223 | Non-small cell lung cancer | 5 | 1.54 |
E2F3, SOS1, SOS2, RAF1, EGF | |
| hsa05221 | Acute myeloid leukemia | 5 | 1.54 |
SOS1, STAT5B, SOS2, RAF1, KIT | |
| hsa04012 | ErbB signaling pathway | 6 | 1.68 |
SOS1, STAT5B, SOS2, MAP2K4, RAF1, EGF | |
| hsa05215 | Prostate cancer | 6 | 1.75 |
E2F3, EP300, SOS1, SOS2, RAF1, EGF | |
| hsa05212 | Pancreatic cancer | 5 | 2.53 |
E2F3, RALBP1, TGFBR2, RAF1, EGF | |
| hsa05214 | Glioma | 5 | 2.53 |
E2F3, SOS1, SOS2, RAF1, EGF | |
| hsa04664 | Fc epsilon RI signaling pathway | 5 | 2.93 |
GAB2, SOS1, SOS2, MAP2K4, RAF1 | |
| hsa05200 | Pathways in cancer | 13 | 3.74 |
E2F3, RALBP1, TGFBR2, STAT5B, RAF1, FADD, KIT, DAPK2, EP300, SOS1, SOS2, TPR, EGF | |
| hsa05161 | Hepatitis B | 7 | 3.87 |
E2F3, EP300, DDX3X, STAT5B, MAP2K4, RAF1, FADD | |
| hsa00531 | Glycosaminoglycan degradation | 3 | 4.16 |
HYAL2, IDS, GALNS |
The PPI network is shown in Fig. 5, presenting 212 nodes and 332 edges. In the
PPI network, histone
cluster 1, H2bj (HIST1H2BJ, down, degree = 18),
histone cluster 1, H2ac
(HIST1H2AC, down, degree = 17), EGF (down, degree = 16), and
E1A binding protein p300 (EP300,
down, degree = 15) were nodes with degrees higher than 10 and were thus
considered hub nodes. Moreover, four network modules were screened, including
module A (score = 7; with seven nodes and 21 edges), module B (score = 6; with
six nodes and 15 edges), module C (score = 6; with 6 nodes and 15 edges), and
module D (score = 5.6; with 6 nodes and 14 edges) (Fig. 6). The results of the GO
functional enrichment analysis of module nodes are listed in Table 2. The nodes
in modules A, B, C, and D were mainly enriched in the inflammatory response
(P = 3.70
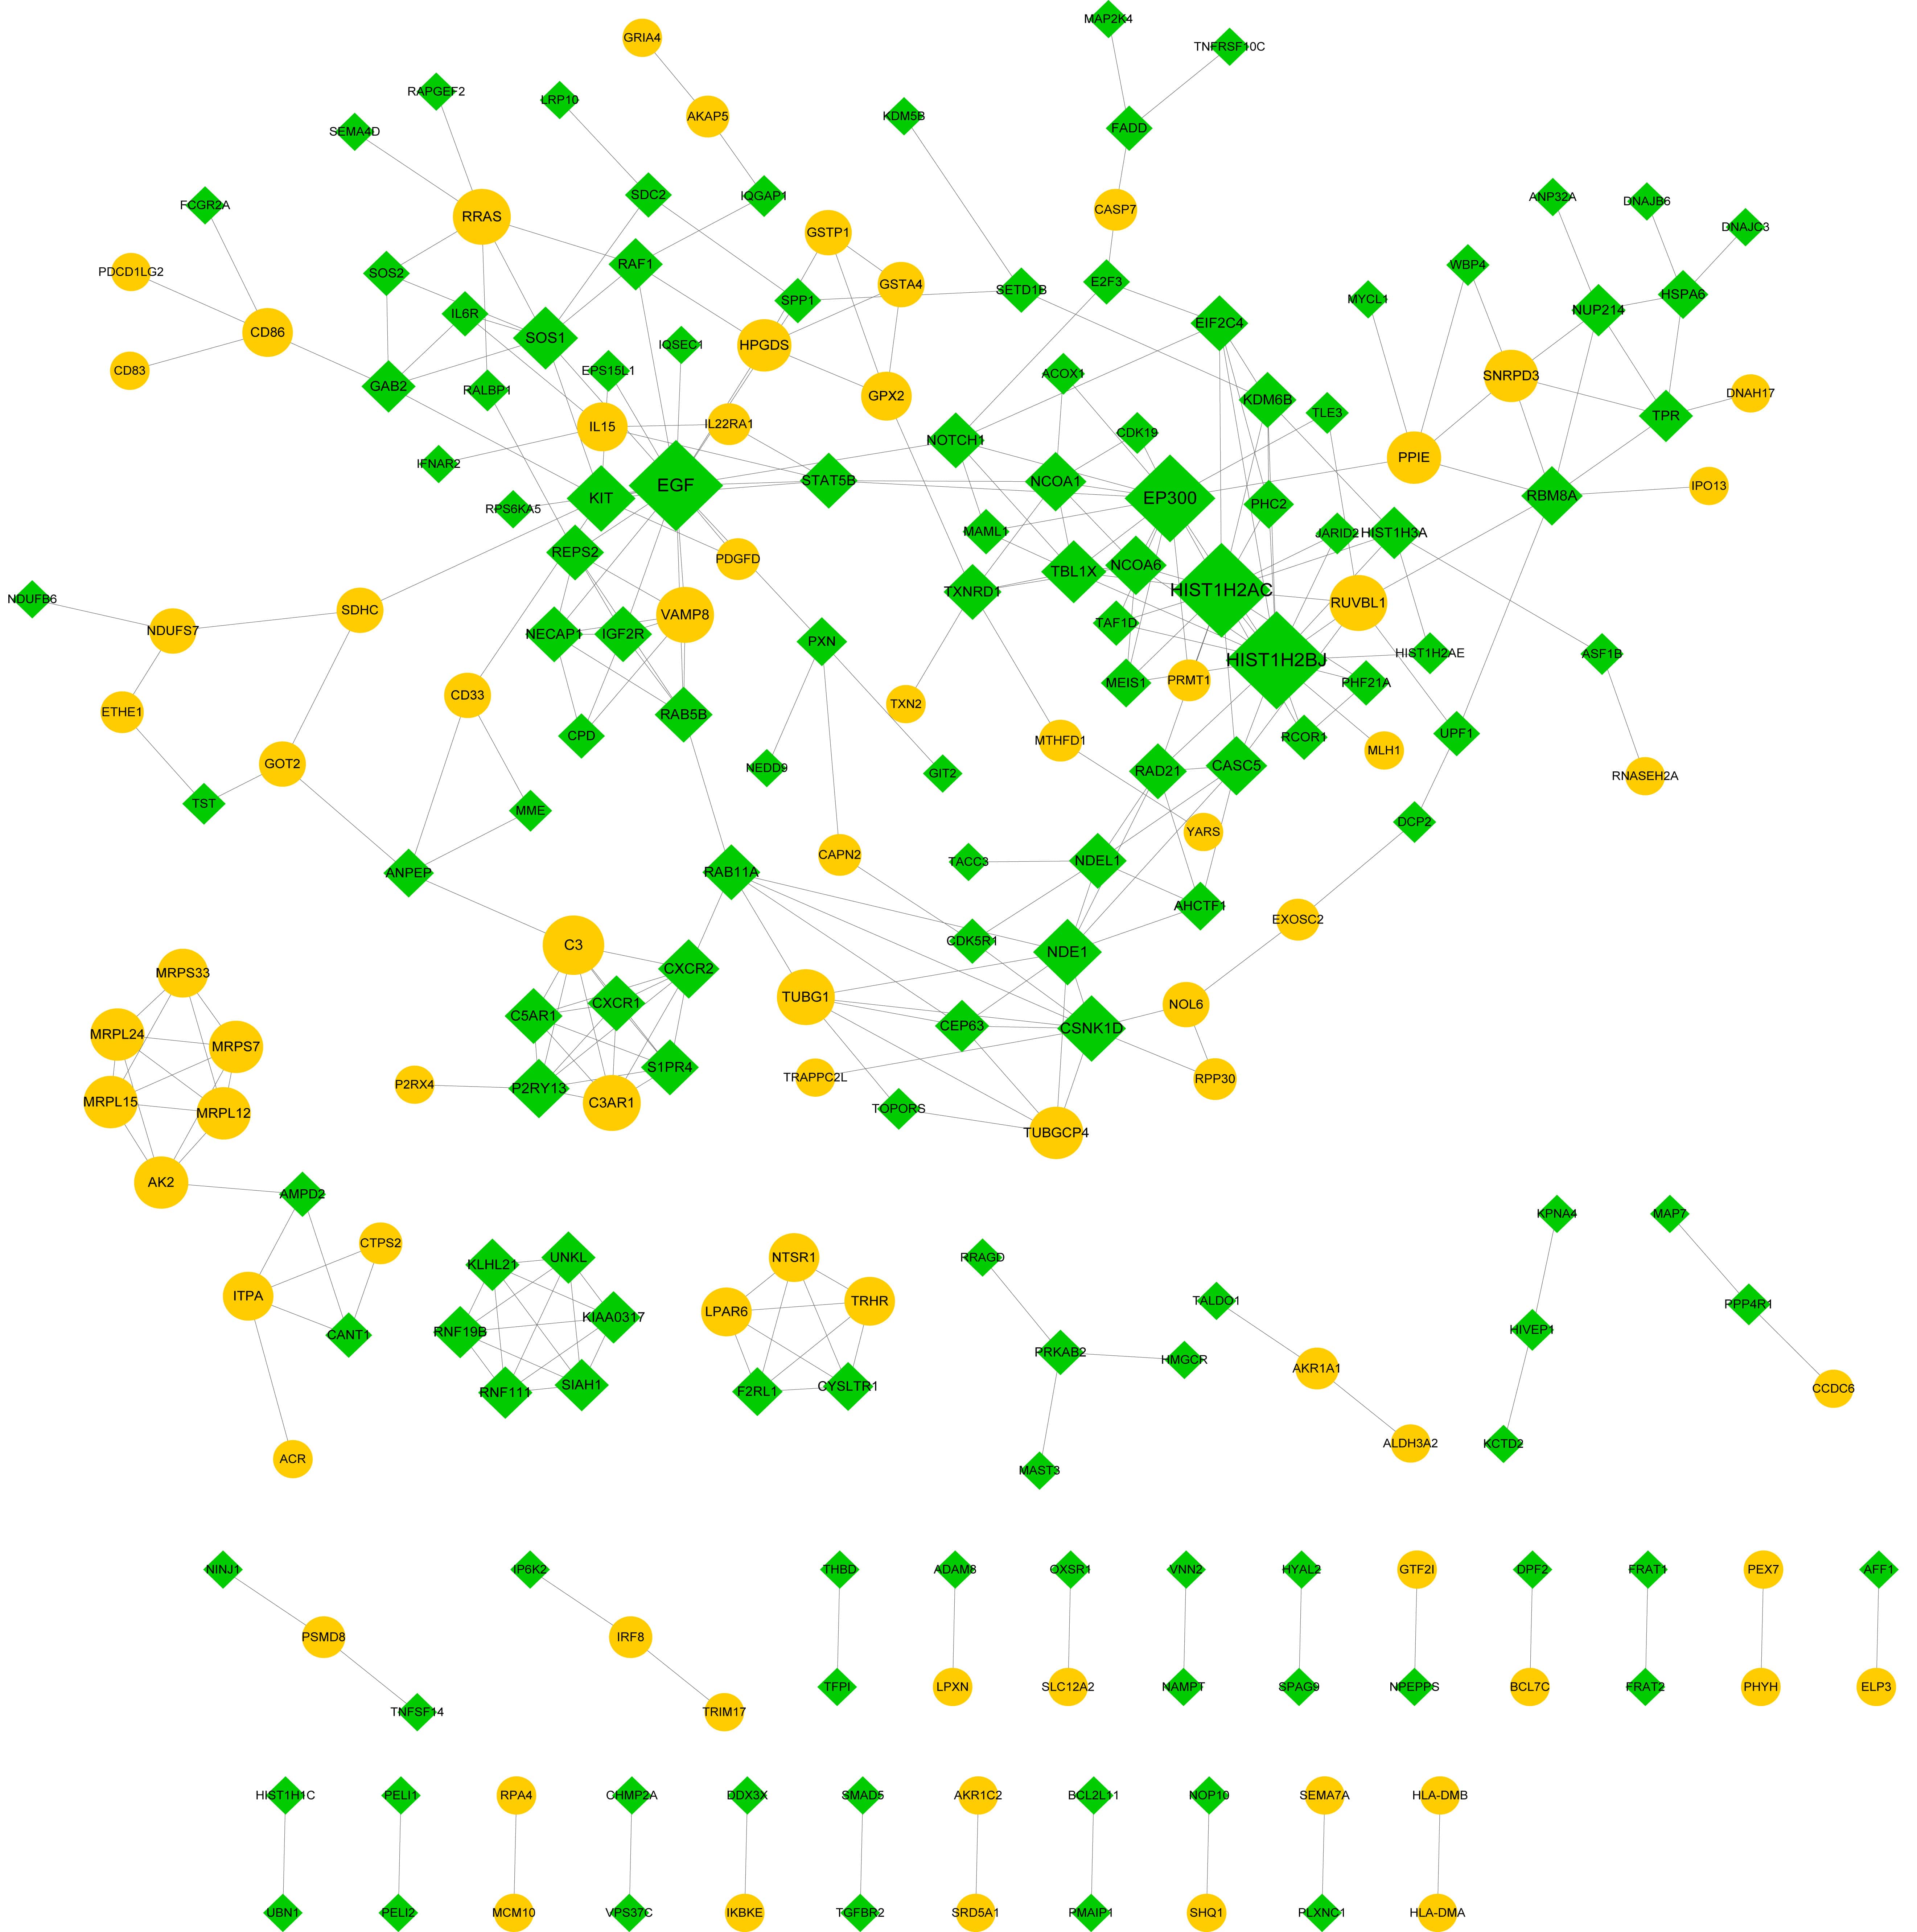 Fig. 5.
The protein-protein interaction (PPI) network. Yellow circles and green prisms indicate upregulated and downregulated genes, respectively. The nodes with higher degrees are large.
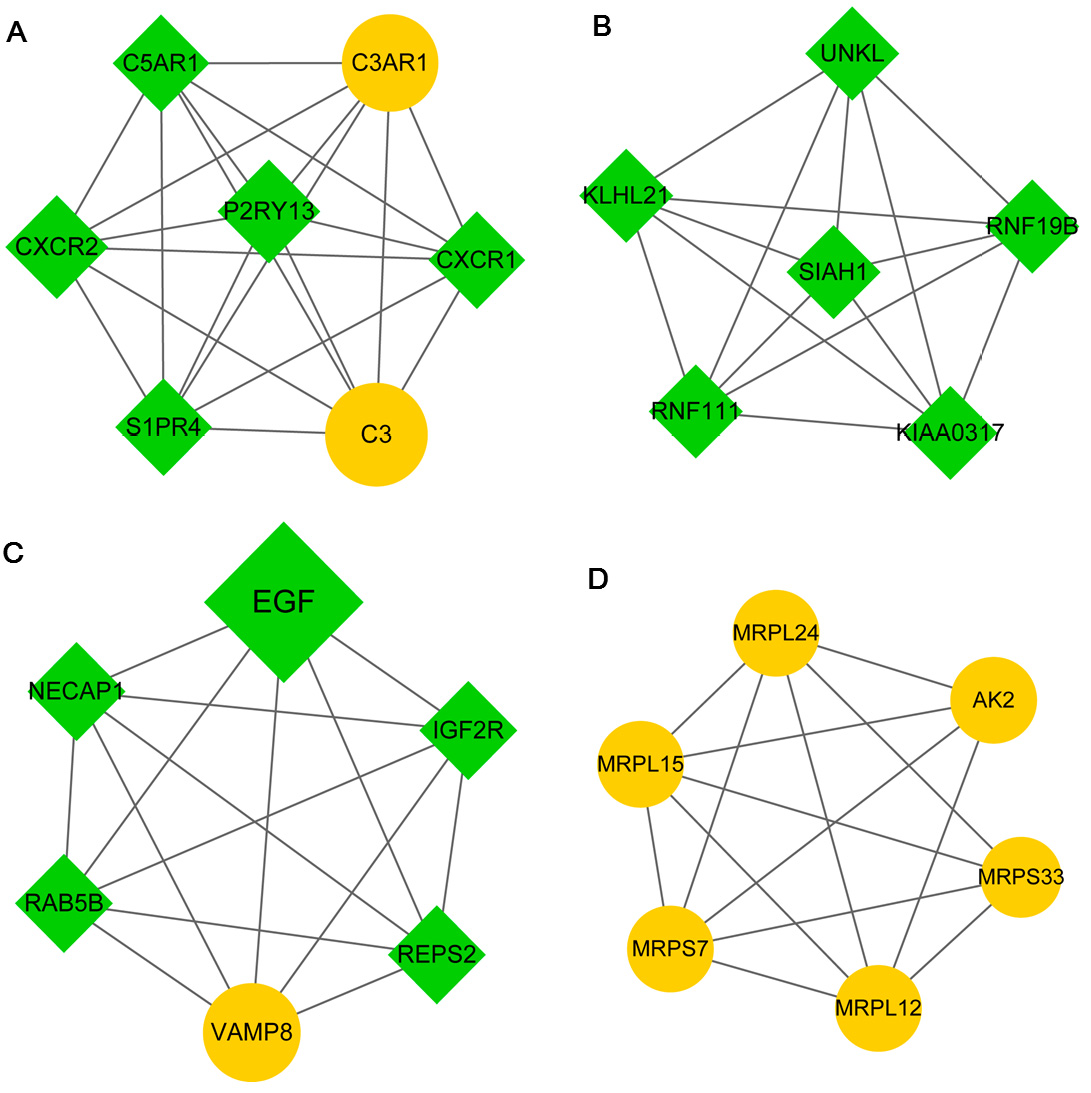 Fig. 6.
Modules A (A), B (B), C (C), and D (D) identified from the protein-protein interaction (PPI) network. Yellow circles and green prisms indicate upregulated and downregulated genes, respectively. The nodes with higher degrees are large.
| Module | Biological process | Count | P value | Genes |
| Module A | GO:0006954 inflammatory response | 5 | 3.70E |
C3AR1, C5AR1, C3, CXCR1, CXCR2 |
| GO:0045766 positive regulation of angiogenesis | 4 | 6.17 |
C3AR1, C5AR1, C3, CXCR2 | |
| GO:0006935 chemotaxis | 4 | 7.37 |
C3AR1, C5AR1, CXCR1, CXCR2 | |
| GO:0007204 positive regulation of cytosolic calcium ion concentration | 4 | 9.77 |
C3AR1, C5AR1, S1PR4, CXCR2 | |
| GO:0090023 positive regulation of neutrophil chemotaxis | 3 | 2.45 |
C3AR1, C5AR1, CXCR2 | |
| GO:0010575 positive regulation of vascular endothelial growth factor production | 3 | 3.72 |
C3AR1, C5AR1, C3 | |
| GO:0030449 regulation of complement activation | 3 | 4.61 |
C3AR1, C5AR1, C3 | |
| GO:0007200 phospholipase C-activating G-protein coupled receptor signaling pathway | 3 | 2.26 |
C3AR1, C5AR1, CXCR2 | |
| GO:0038112 interleukin-8-mediated signaling pathway | 2 | 7.15 |
CXCR1, CXCR2 | |
| GO:0007186 G-protein coupled receptor signaling pathway | 4 | 2.71 |
C3AR1, C3, S1PR4, CXCR1 | |
| GO:0010759 positive regulation of macrophage chemotaxis | 2 | 3.92 |
C3AR1, C5AR1 | |
| GO:0002407 dendritic cell chemotaxis | 2 | 6.06 |
CXCR1, CXCR2 | |
| GO:0006955 immune response | 3 | 8.80 |
C5AR1, C3, S1PR4 | |
| GO:0007202 activation of phospholipase C activity | 2 | 9.26 |
C5AR1, S1PR4 | |
| GO:0031623 receptor internalization | 2 | 1.53 |
CXCR1, CXCR2 | |
| GO:0006968 cellular defense response | 2 | 2.20 |
C5AR1, CXCR2 | |
| GO:0060326 cell chemotaxis | 2 | 2.30 |
C3AR1, C5AR1 | |
| GO:0030593 neutrophil chemotaxis | 2 | 2.34 |
C5AR1, CXCR2 | |
| GO:0070098 chemokine-mediated signaling pathway | 2 | 2.51 |
CXCR1, CXCR2 | |
| GO:0050900 leukocyte migration | 2 | 4.28 |
C3AR1, C5AR1 | |
| Module B | GO:0042787 protein ubiquitination involved in ubiquitin-dependent protein catabolic process | 4 | 2.95 |
KLHL21, SIAH1, RNF19B, RNF111 |
| GO:0000209 protein polyubiquitination | 4 | 5.14 |
SIAH1, RNF19B, UNKL, RNF111 | |
| GO:0043161 proteasome-mediated ubiquitin-dependent protein catabolic process | 2 | 4.75 |
SIAH1, RNF111 | |
| Module C | GO:0015031 protein transport | 3 | 5.27 |
RAB5B, VAMP8, NECAP1 |
| GO:0007173 epidermal growth factor receptor signaling pathway | 2 | 1.66 |
REPS2, EGF | |
| Module D | GO:0070125 mitochondrial translational elongation | 5 | 3.05 |
MRPL24, MRPL12, MRPS33, MRPL15, MRPS7 |
| GO:0070126 mitochondrial translational termination | 5 | 3.19 |
MRPL24, MRPL12, MRPS33, MRPL15, MRPS7 | |
| GO:0006412 translation | 4 | 3.31 |
MRPL24, MRPS33, MRPL15, MRPS7 |
Following the prediction of 2 TFs (E2F1 and FOXK1) and 5 miRNAs (miR-122A, miR-516-5P, miR-507, miR-342, and miR-520F), 172 regulatory pairs were obtained (involving 29 upregulated and 83 downregulated genes). Subsequently, we built a TF-miRNA target regulatory network (Fig. 7). In the regulatory network, miR-122A can target both low-density lipoprotein (LDL) receptor-related protein 10 (LRP10) and IQ motif-containing GTPase-activating protein 1 (IQGAP1).
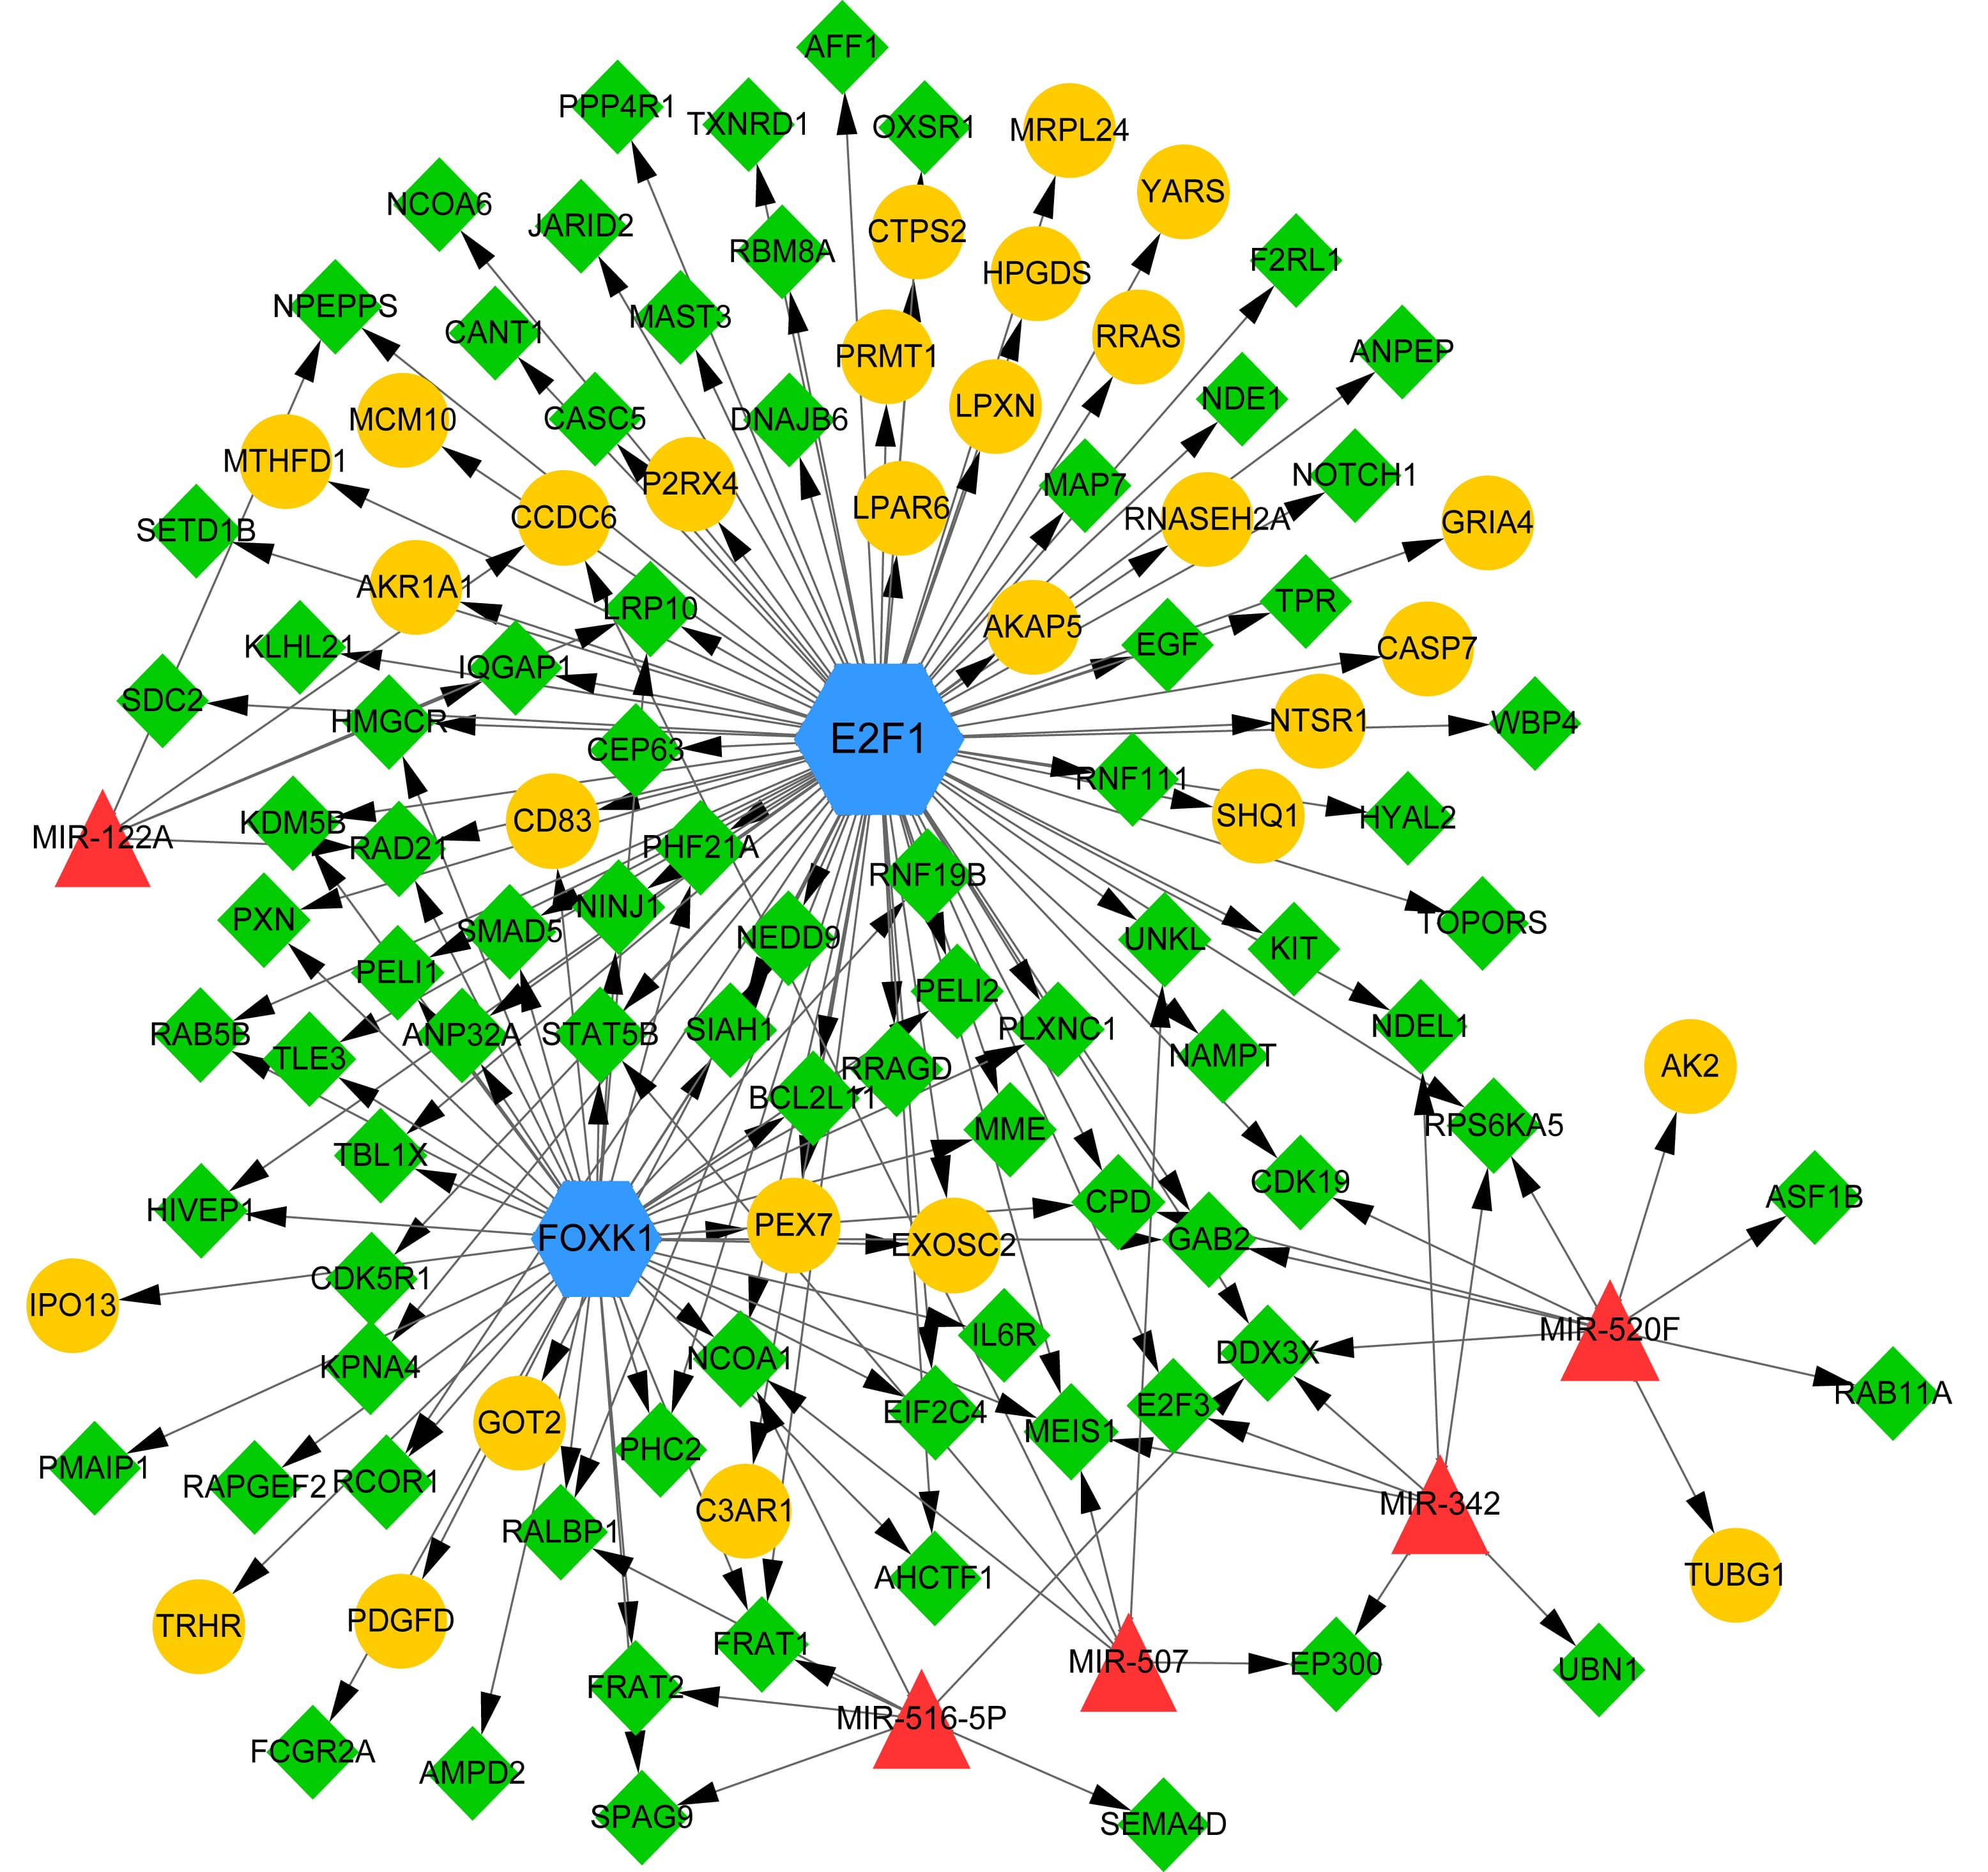 Fig. 7.
The transcription factor (TF)-microRNA (miRNA) target regulatory network. Yellow circles and green prisms indicate upregulated and downregulated genes, respectively. Blue hexagons and red triangles indicate TFs and miRNAs, respectively. Arrows indicate regulatory directions.
In the CTD database, a total of 25,384 genes and 149 pathways were found to be associated with CAD. The Venn analysis identified 429 overlapping genes between CAD-associated genes and 456 DEGs, including TGFBR2, EGF, LRP10, and IQGAP1 (Fig. 8A and Supplemental Table 1). Similarly, we screened 10 overlapping pathways between CAD-associated pathways and 18 significant KEGG pathways, including the MAPK signaling pathway (Fig. 8B and Table 3). These results suggest that identified genes and pathways are important in CAD and could be implicated in CAD pathogenesis.
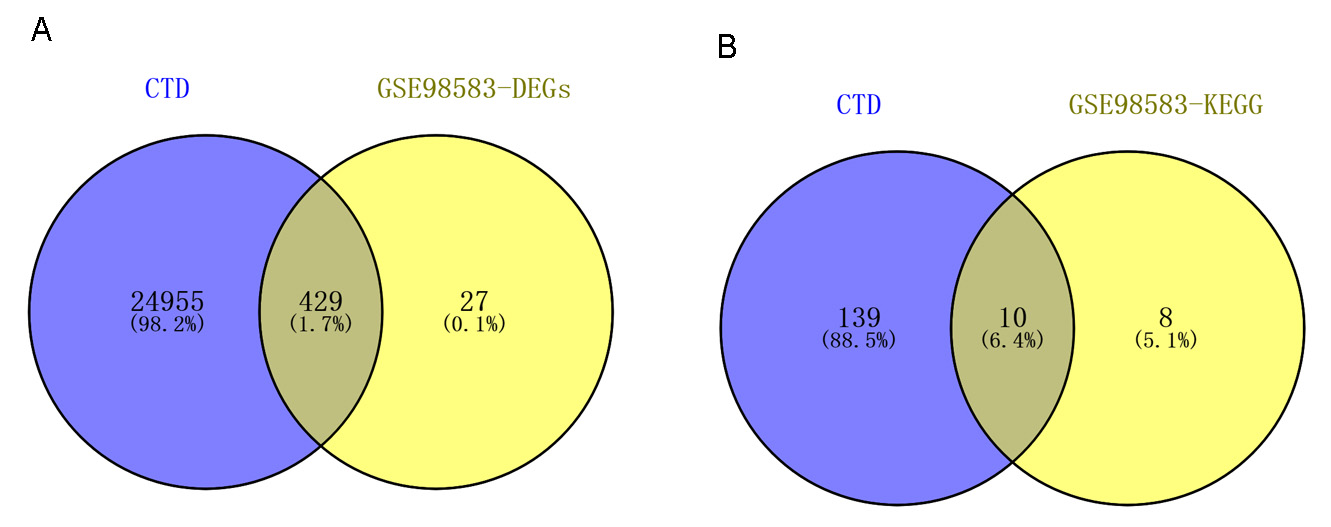 Fig. 8.
The results of Venn analysis using the CTD database. (A) Venn diagram showing 429 overlapping genes between CAD-associated genes and differentially expressed genes. (B) Venn diagram showing 10 overlapping pathways between CAD-associated pathways and 18 significant KEGG pathways. CTD, Comparative Toxicogenomics Database; CAD, Coronary artery disease; KEGG, Kyoto Encyclopedia of Genes and Genomes.
| Disease name | Disease ID | Category | Term | Count | P value | Genes |
| CAD | MESH:D003324 | KEGG_PATHWAY | hsa04672:Intestinal immune network for IgA production | 4 | 2.10 |
CD86, IL15, HLA-DMB, HLA-DMA |
| CAD | MESH:D003324 | KEGG_PATHWAY | hsa00561:Glycerolipid metabolism | 4 | 3.62 |
AKR1A1, DGKH, AGK, ALDH3A2 |
| CAD | MESH:D003325 | KEGG_PATHWAY | hsa04144:Endocytosis | 14 | 4.61 |
CHMP2A, RAB5B, TGFBR2, CXCR1, CXCR2, VPS37C, EPS15L1, KIT, IGF2R, HSPA6, GIT2, RAB11A, EGF, IQSEC1 |
| CAD | MESH:D003326 | KEGG_PATHWAY | hsa04068:FoxO signaling pathway | 9 | 2.09 |
EP300, S1PR4, SOS1, PRKAB2, TGFBR2, SOS2, RAF1, EGF, BCL2L11 |
| CAD | MESH:D003327 | KEGG_PATHWAY | hsa05219:Bladder cancer | 5 | 5.18 |
RPS6KA5, E2F3, RAF1, DAPK2, EGF |
| CAD | MESH:D003328 | KEGG_PATHWAY | hsa04010:MAPK signaling pathway | 11 | 1.22 |
RPS6KA5, SOS1, TGFBR2, SOS2, MAP2K4, HSPA6, RAF1, CACNB4, RAPGEF2, EGF, DUSP6 |
| CAD | MESH:D003329 | KEGG_PATHWAY | hsa05215:Prostate cancer | 6 | 1.75 |
E2F3, EP300, SOS1, SOS2, RAF1, EGF |
| CAD | MESH:D003330 | KEGG_PATHWAY | hsa05212:Pancreatic cancer | 5 | 2.53 |
E2F3, RALBP1, TGFBR2, RAF1, EGF |
| CAD | MESH:D003331 | KEGG_PATHWAY | hsa05200:Pathways in cancer | 13 | 3.74 |
E2F3, RALBP1, TGFBR2, STAT5B, RAF1, FADD, KIT, DAPK2, EP300, SOS1, SOS2, TPR, EGF |
| CAD | MESH:D003332 | KEGG_PATHWAY | hsa05161:Hepatitis B | 7 | 3.87 |
E2F3, EP300, DDX3X, STAT5B, MAP2K4, RAF1, FADD |
| CAD, coronary artery disease. | ||||||
In the present study, we identified 456 DEGs (including 175 upregulated and 281 downregulated genes) between CAD and control samples. In the PPI network, EGF (down, degree = 16) was a hub node. Additionally, we screened four significant network modules (modules A, B, C, and D) and observed that each node was individually implicated in the inflammatory response, protein ubiquitination involved in ubiquitin-dependent protein catabolic process, protein transport, and mitochondrial translational elongation. Furthermore, we built a TF-miRNA target regulatory network.
In patients with CAD, TGFBR2 polymorphism is correlated with the risk of sudden cardiac arrest induced by ventricular arrhythmias, suggesting that genetic variations in the TGF signaling pathway could influence susceptibility to sudden cardiac arrest [37]. TGFBR1 is reportedly overexpressed in patients with left ventricular dysfunction and is thus considered a potential prognostic factor after acute myocardial infarction [38]. The mRNA expression levels of EGFR in atheromatous lesions could be a promising prognostic biomarker for predicting the stimulatory growth factor-induced increase in smooth muscle cell proliferation [39]. Circulating miR-23a could serve as a diagnostic biomarker to indicate the presence and severity of coronary lesions in patients with CAD. Moreover, miR-23a regulates vasculogenesis in CAD by inhibiting EGFR expression [40]. In the present study, both TGFBR2 and EGF were involved in the MAPK signaling pathway, thus indicating their potential roles in CAD development.
Plasma levels of miR-122 and miR-370, which are upregulated in patients with hyperlipidemia, are positively associated with CAD severity; therefore, they may be correlated with the development and progression of CAD in patients with hyperlipidemia [41]. The expression of circulating miR-122-5p is reportedly elevated in patients with acute myocardial infarction, suggesting its application as a promising biomarker [42, 43]. The plasma levels of miR-122, miR-140-3p, miR-720, miR-2861, and miR-3149 are higher in acute coronary syndrome samples than in control samples; thus, they can be employed as potential markers in patients with acute coronary syndrome [44]. These results indicate that miR-122 plays a critical role in CAD pathogenesis.
LRP is known to possess biological functions in multiple vascular biology-associated processes. Moreover, LRP polymorphisms are risk factors, especially in Caucasians with premature CAD [45]. In cardiac fibroblasts, LRP1 contributes to the expression of matrix metallopeptidase 9 (MMP9), which has been associated with ventricular remodeling following myocardial infarction [46]. IQGAP1 reportedly affects neovascularization after ischemia by mediating endothelial cell-regulated angiogenesis, macrophage infiltration, and reactive oxygen species production; therefore, IQGAP1 is a valuable therapeutic target for ischemic cardiovascular diseases [47, 48]. As a scaffold for the extracellular signal-regulated kinase (ERK)1/2 cascade, IQGAP1 mediates the integration of hypertrophy and survival signals in the heart, facilitating left ventricular remodeling following pressure overload [49]. Therefore, both LRP10 and IQGAP1 were targeted by miR-122A in the regulatory network, implying a probable correlation between miR-122A and CAD via the regulation of LRP10 and IQGAP1.
In total, 456 DEGs were screened in CAD samples. Herein, we revealed the probable involvement of TGFBR2, EGF, LRP10, IQGAP1, and miR-122 in CAD pathogenesis. The functions of these genes and miRNAs in CAD pathogenesis need to be comprehensively validated in future experimental research.
Conception and design of the research: WZ and XL; acquisition of data: NW, TL and GZ; analysis and interpretation of data: SF and LL; Statistical analysis: XL and YH; drafting the manuscript: YD; revision of manuscript for important intellectual content: WZ. All authors read and approved the final manuscript.
Not applicable.
Thanks to all the peer reviewers and academic editors for their opinions and suggestions.
This work was supported by the National Natural Science Foundation of China (No. 81600207), Excellent Youth Fund of Jilin Provincial Science and Technology Department (No. 20190103090JH), “13th five year plan” science and technology research project of Jilin Provincial Department of Education (No. JJKH20200898KJ), Science and Technology Department of Jilin Province (No. 20190304054YY), “Xinglin scholar project” of Changchun University of traditional Chinese Medicine (No. 2019RS01) and College Project Grant (No. 2018KJ01).
The authors declare no conflict of interest.
The data used to support the findings of this study are available from the corresponding author upon request.