
† These authors contributed equally.
Academic Editor: Takatoshi Kasai
Early identification of individuals with high risk is crucial to preventing cardiovascular disease (CVD). We aimed to determine the prevalence of high CVD risk in Inner Mongolia and to analyze the treatment of major risk factors among individuals with high CVD risk. We selected 70,380 participants aged 35–75 years in Inner Mongolia between 2015 and 2017 using multistage stratified sampling. All participants completed a questionnaire and their blood pressure, blood glucose and lipid levels, height, weight and waist circumference were measured. Participants without a history of CVD were defined as high CVD risk if the predicted 10-year risk for CVD exceeded 10%. We assessed rates of high CVD risk and the prevalence and treatment of major risk factors among individuals with high CVD risk. After excluding participants with previous CVD, 68,083 participants remained. The overall prevalence of high CVD risk was 24.96%. The age- and sex-standardized rate of high CVD risk was 22.92%. Among high-risk participants, the prevalence of risk factors was hypertension (91.9%), dyslipidemia (54.1%), obesity (34.6%), diabetes (27.6%), and smoking (24.5%); clustering of these risk factors was common. The percentage of high-risk individuals taking antihypertensive drugs was 45.94% in those with hypertension; 27.99% of those with diabetes took hypoglycemic drugs and only 5.01% of those with dyslipidemia took lipid-lowering drugs. Control rates of hypertension, diabetes, and dyslipidemia were 1.20%, 4.43%, and 2.78%, respectively. Therefore, the prevalence of high CVD risk was elevated in Inner Mongolia, and treatment and control rates were low.
Cardiovascular disease (CVD) is the main cause of morbidity and mortality worldwide. In 2015, there were an estimated 422.7 million prevalent cases and 17.9 million deaths caused by CVD [1], and these figures showed no large changes in 2016 [2]. The burden of disease caused by CVD has been gradually increasing in China [3]. There were an estimated 290 million patients with CVD, and the disease accounted for more than 40% of deaths in 2015 [4]. The burden of CVD in Inner Mongolia is at a higher level than in the rest of the country [4, 5, 6]. Inner Mongolia, located in the north of China, has well-developed animal husbandry and agriculture, but its per capita income and educational level are not high, and its medical and health resources are insufficient. Unhealthy lifestyles such as high-salt, high-fat diets, and high rate of drinking alcohol are common in local residents. In 2017, disability-adjusted life-years (DALYs) owing to stroke and ischemic heart disease in Inner Mongolia were much higher than those in China. Therefore, the prevention of CVD in Inner Mongolia is urgent.
Early identification of high-risk individuals is a crucial strategy in primary prevention of CVD, based on the availability of appropriate CVD risk assessment models and guideline recommendations [7]. Several well-known models for CVD risk assessment have been developed, to identify high-risk individuals and decrease the probability of future CVD events in the United States and Europe [7, 8, 9, 10]. The age-adjusted death rate attributable to CVD in the United States decreased from 269.6 per 100,000 population in 2006 to 219.4 per 100,000 in 2016, which reflects the success of this strategy [11]. In 2011, a risk prediction model of CVD was established to identify high-risk individuals in China, issued according to the Chinese Guideline for the Prevention of Cardiovascular Disease [12]. This guideline also suggests intervention for high-risk individuals. However, the prevalence of high CVD risk in Inner Mongolia remains unknown, making it difficult to implement interventions.
To this end, the aim of the present study was to investigate the prevalence and the risk factors of high CVD risk in Inner Mongolia, to analyze the treatment of major risk factors among individuals with high CVD risk in Inner Mongolia. The findings of this study will be crucial for decision-making in the prevention and intervention of CVD. Because the geographical location and lifestyle habits among residents of Inner Mongolia represent northern China to some extent, the findings of this study can also serve as a reference for CVD prevention in northern China.
This study was part of the China Patient-Centered Evaluative Assessment of Cardiac Events (PEACE) Million Persons Project, which has been described previously [13]. Briefly, we used a multistage stratified sampling method to select a representative sample of the general population aged 35–75 years in Inner Mongolia from 2015 to 2017 (Fig. 1). The sampling process was stratified according to socioeconomic status, geographic region, and urbanization. In the first sampling, we selected cities from different geographic regions. The next stage was to select city districts from among the cities and rural townships from among counties. In the final stage, we selected street districts from among city districts and rural villages from among townships for the local population base. In total, 70,380 participants from six sites were eventually included. All enrolled participants provided their written informed consent. The central ethics committee of the China National Center for Cardiovascular Disease approved this project [14].
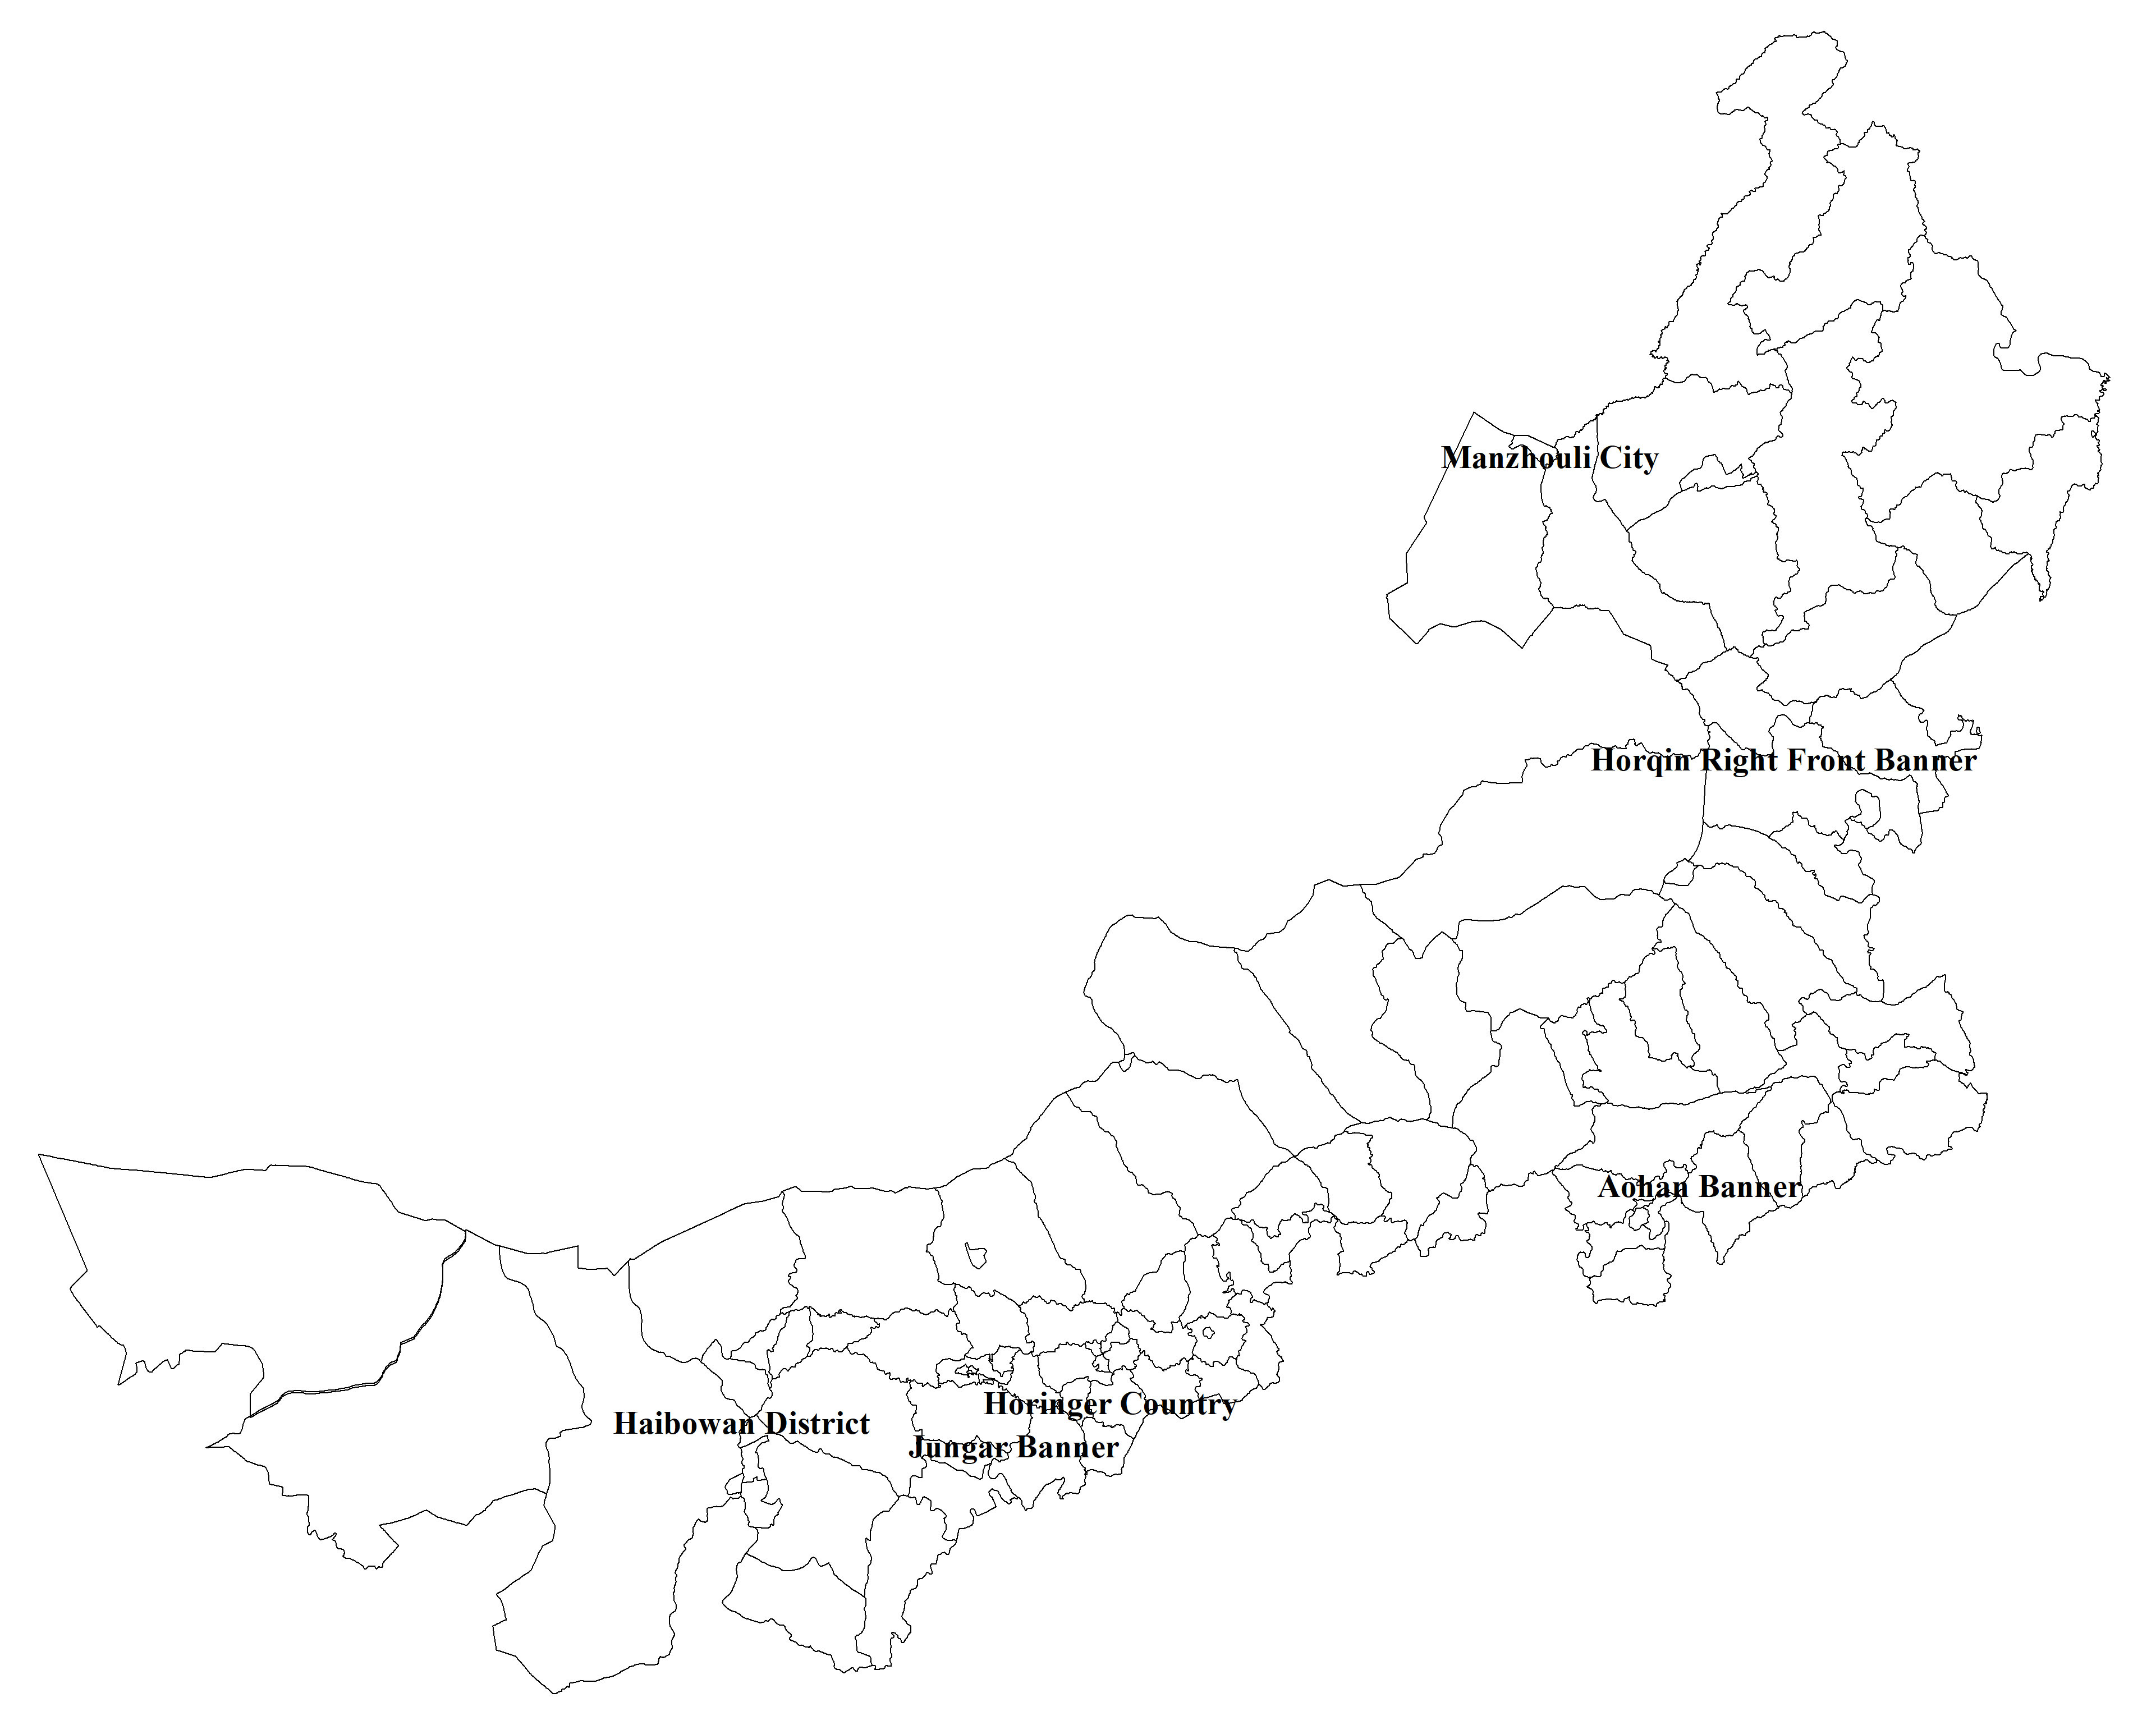 Fig. 1.
Map of Inner Mongolia, with study sites. Legend: The six sites were Hollinger County in Hohhot City, Haibowan District in Wuhai City, Zhungeer Banner in Erdos City, Aohan Banner in Chifeng City, Horqin Right Front Banner in Hinggan League, and Manzhouli district in Hulunbeier City, respectively.
According to the Chinese Guideline for the Prevention of Cardiovascular Disease, we defined high CVD risk as a predicted 10-year risk for CVD exceeding 10%. This criterion was calculated on the basis of age, sex, smoking status, systolic blood pressure, the presence of diabetes, and total cholesterol level using risk prediction charts of the Chinese Guideline for the Prevention of Cardiovascular Disease (Table 1) [12]. Participants were excluded if they had a history of CVD, including myocardial infarction, percutaneous coronary intervention, coronary artery bypass grafting, or stroke.
| Those who accord with any of the following criteria can be directly classified as high-risk or extremely high-risk, without the need for ASCVD risk assessment. | |||||
| Extremely high-risk: ASCVD patients (Including patients with symptomatic PAD) | |||||
| High-risk: | |||||
| (1) Diabetics (ages | |||||
| (2) Very high levels of a single risk factor, including: ①LDL-C | |||||
| Those who do not conform to the criteria, the 10-year risk of ASCVD was estimated according to the following table. | |||||
| Risk factors | piece | Stratification of serum cholesterol levels (mg/dL) | |||
| 120 |
160 |
200 | |||
| Or 70 |
Or 100 |
Or 130 | |||
| Without hypertension | 0–1 | Low risk ( |
Low risk ( |
Low risk ( | |
| 2 | Low risk ( |
Low risk ( |
Medium risk (5%–9%) | ||
| 3 | Low risk ( |
Medium risk (5%–9%) | Medium risk (5%–9%) | ||
| With hypertension | 0 | Low risk ( |
Low risk ( |
Low risk ( | |
| 1 | Low risk ( |
Medium risk (5%–9%) | Medium risk (5%–9%) | ||
| 2 | Medium risk (5%–9%) | High risk ( |
High risk ( | ||
| 3 | High risk ( |
High risk ( |
High risk ( | ||
| Legend: ASCVD, arteriosclerotic cardiovascular disease; TC, total cholesterol; HDL-C, high density lipoprotein cholesterol; LDL-C, low density lipoprotein cholesterol; TG, triglyceride. | |||||
For each participant, blood pressure, blood glucose and lipid levels, height, weight and waist circumference were measured. Blood pressure was measured twice on the right upper arm using an electronic blood pressure monitor (Omron HEM-7430; Omron Corporation, Kyoto, Japan) after 5 minutes of rest, with the participant in a seated position. We took the average blood pressure value of the two readings as the final value. Blood samples were drawn by venipuncture after at least 10 hours of overnight fasting, to measure fasting blood glucose and lipid levels (PD-G001-2 BeneCheck and Cardiochek PA, respectively). Height, weight, and waist circumference were measured with participants light clothes and without shoes.
In addition, we also collected information on sociodemographic characteristics (ethnicity, education, occupation, annual household income, and so on), health behaviors (smoking and alcohol intake), medical history, and medication use during in-person interviews.
The main risk factors of CVD (hypertension, diabetes, dyslipidemia, obesity,
smoking) were defined as follows. Hypertension was defined as an average systolic
blood pressure of 140 mm Hg or higher, or an average diastolic blood pressure of
90 mm Hg or higher, or self-reported use of antihypertensive drugs over the
previous 2 weeks, in accordance with Chinese guidelines for the management of
hypertension [15]. Diabetes was defined as fasting blood glucose of 126 mg/dL or
higher or self-reported diabetes, or self-reported use of hypoglycemic drugs or
insulin injections in the previous 2 weeks [16]. Dyslipidemia was defined as a
total cholesterol of 240 mg/dL or higher, or a low-density lipoprotein
cholesterol of 160 mg/dL or higher, or a high density lipoprotein cholesterol of
40 mg/dL or lower, or triglyceride level of 200 mg/dL or higher, or use of
lipid-lowering drugs in the previous 2 weeks, in accordance with the Chinese
guidelines on prevention and treatment of dyslipidemia in adults [17]. Body mass
index (BMI) was calculated as weight in kilograms divided by height squared in
meters. Obesity was defined as a BMI of at least 28 kg/m
We calculated the treatment and control rate of hypertension, diabetes, and dyslipidemia in the high-risk individuals of CVD. Treatment of hypertension, diabetes and dyslipidemia were defined as current use of antihypertensive medication, hypoglycemic drugs and lipid-lowering drugs, respectively. Control of hypertension was defined as an average SBP of less than 140 mm Hg and an average DBP of less than 90 mm Hg over two readings among participants with hypertension; control of diabetes was defined as a fasting blood glucose of less than 126 mg/dL among participants with diabetes; control of dyslipidemia was defined as a total cholesterol of less than 126 mg/dL, a low-density lipoprotein cholesterol of less than 160 mg/dL, a high density lipoprotein cholesterol of more than 40 mg/dL, and triglyceride level of less than 200 mg/dL among participants with dyslipidemia.
We estimated the prevalence of
high CVD risk among all participants, as well
as the treatment of high CVD risk. For comparisons with the prevalence of high
CVD risk in other regions of China, the prevalence in Inner Mongolia was
standardized using data of the Sixth National Population Census. Continuous data
are presented as mean
Among 70,380 participants, 2297 were excluded because of previous CVD, leaving
68,083 participants included in this study. The mean age of participants was
54.27
| Men | Women | Total | P | |||
| Age, n (%) | ||||||
| 35–44 | 4087 (40.8) | 5932 (59.2) | 10019 | 223.756 | ||
| 45–54 | 8856 (39.0) | 13831 (61.0) | 22687 | |||
| 55–64 | 10767 (42.1) | 14832 (57.9) | 25599 | |||
| 65–75 | 4680 (47.9) | 5098 (52.1) | 9778 | |||
| Ethnic group, n (%) | ||||||
| Han people | 25529 (41.8) | 35548 (58.2) | 61077 | 3.024 | ||
| Mongolian | 2430 (41.0) | 3492 (59.0) | 5922 | |||
| The other |
409 (39.7) | 621 (60.3) | 1030 | |||
| Unknown | 22 (40.7) | 32 (59.3) | 54 | |||
| Living environment (Rural), n (%) | 20002 (42.2) | 27408 (57.8) | 47410 | 15.440 | ||
| Education (High school diploma), n (%) | 9668 (51.4) | 9138 (48.6) | 18806 | 1007.696 | ||
| Occupation (Farmer), n (%) | 12962 (40.1) | 19338 (59.9) | 32300 | 62.237 | ||
| Marital status (Married), n (%) | 26455 (42.6) | 35667 (57.4) | 62122 | 229.338 | ||
| Household income ( |
3720 (48.0) | 4026 (52.0) | 7746 | 143.862 | ||
| Smoking, n (%) | 14173 (83.0) | 2912 (17.0) | 17085 | 15969.336 | ||
| Drinking, n (%) | 15458 (80.9) | 3638 (19.1) | 19096 | 16817.944 | ||
| BMI (kg/m |
25.67 |
25.77 |
25.72 |
3.637 | ||
| SBP (mmHg), mean |
140.90 |
140.55 |
140.54 |
2.130 | 0.033 | |
| DBP (mmHg), mean |
86.85 |
83.46 |
84.77 |
37.957 | ||
| GLU (mg/dL), M (P |
113.40 | 111.60 | 111.60 | –3.939 | ||
| (102.60, 127.80) | (100.80, 126.60) | (100.80, 127.80) | ||||
| TC (mg/dL), M (P |
170.71 | 192.78 | 182.71 | –32.927 | ||
| (144.78, 200.03) | (165.68, 228.39) | (155.61, 216.78) | ||||
| HDL-C (mg/dL), M (P |
46.40 | 56.80 | 52.40 | –38.164 | ||
| (35.60, 58.80) | (47.20, 68.00) | (41.60, 64.40) | ||||
| LDL-C (mg/dL), M (P |
93.65 | 106.13 | 100.28 | –21.860 | ||
| (72.97, 117.45) | (83.11, 136.57) | (78.04, 127.60) | ||||
| TG (mg/dL), M (P |
127.70 | 133.92 | 131.31 | –3.860 | ||
| (89.57, 193.05) | (96.53, 189.57) | (93.92, 191.31) | ||||
| Legend: BMI, Body Mass Index; SBP, Systolic Blood Pressure; DBP, diastolic blood
pressure; GLU, glucose; TC, total cholesterol; HDL-C, high density lipoprotein
cholesterol; LDL-C, low density lipoprotein cholesterol; TG, triglyceride. | ||||||
The overall prevalence of high CVD risk was 24.96% (n = 16991), and
the age- and sex-standardized rate of high CVD risk was 22.92%. As shown in
Table 3, the prevalence of high CVD risk was significantly higher in men than in
women (26.8% vs. 23.6%, P
After multiple logistic regression analysis, the results showed that age over 55 years old, farmer, obesity, hypertension, diabetes and dyslipidemia were independently associated with high CVD risk (Table 4).
| Factors | Groups | n (%) | P | |
| Sex | Men | 7608 (26.8) | 88.209 | |
| Women | 9383 (23.6) | |||
| Age | 35–44 | 1437 (14.3) | 136.891 | |
| 45–54 | 5834 (21.3) | |||
| 55–64 | 7299 (28.5) | |||
| 65–75 | 3421 (35.5) | |||
| Living environment | Urban | 5614 (27.2) | 76.715 | |
| Rural | 11377 (24.0) | |||
| Ethnic group | Han people | 15244 (25.0) | 6.317 | 0.097 |
| Mongolian | 1444 (24.4) | |||
| The other |
287 (27.9) | |||
| Unknown | 16 (29.6) | |||
| Education | High school diploma | 12360 (25.1) | 1.522 | 0.217 |
| High school degree and above | 4631 (24.6) | |||
| Occupation | Farmer | 7864 (24.3) | 12.193 | |
| Not a farmer | 9127 (25.5) | |||
| Marital status | No | 1923 (32.3) | 186.066 | |
| Married | 15068 (24.3) | |||
| Household income(¥/year) | 15021 (24.9) | 1.058 | 0.304 | |
| 1970 (25.4) | ||||
| Smoking | No | 12824 (25.1) | 3.908 | 0.048 |
| Yes | 4167 (24.4) | |||
| Obesity | No | 11118 (21.7) | 1141.488 | |
| Yes | 5873 (34.7) | |||
| Hypertension | No | 1378 (4.5) | 12153.376 | |
| Yes | 15163 (41.3) | |||
| Diabetes | No | 12299 (22.4) | 1009.543 | |
| Yes | 4692 (35.7) | |||
| Dyslipidemia | No | 7791 (18.6) | 2365.128 | |
| Yes | 9200 (35.2) | |||
| Legend: | ||||
| Factor | Groups | High CVD risk | |
| OR (95% CI) | P | ||
| Sex | Men | 1.000 | |
| Women | 0.865 (0.832, 0.900) | ||
| Age | 35–44 | 1.000 | |
| 45–54 | 1.073 (0.997, 1.155) | 0.061 | |
| 55–64 | 1.166 (1.085, 1.252) | ||
| 65–75 | 1.382 (1.276, 1.497) | ||
| Living environment | Urban | 1.000 | |
| Rural | 0.839 (0.795, 0.886) | ||
| Marital status | No | 1.000 | |
| Yes | 0.788 (0.737, 0.843) | ||
| Occupation | Not a farmer | 1.000 | |
| Farmer | 1.057 (1.006, 1.110) | 0.028 | |
| Obesity | No | 1.000 | |
| Yes | 1.288 (1.234, 1.344) | ||
| Hypertension | No | 1.000 | |
| Yes | 12.944 (12.198, 13.735) | ||
| Diabetes | No | 1.000 | |
| Yes | 1.309 (1.250, 1.371) | ||
| Dyslipidemia | No | 1.000 | |
| Yes | 2.088 (2.007, 2.173) | ||
| Legend: OR, odds ratio; CI, confidence interval. | |||
We analyzed the prevalence of five major risk factors among individuals with
high CVD risk and found that the most common risk factor was hypertension
(91.9%), followed by dyslipidemia (54.1%), obesity (34.6%), diabetes (27.6%),
and smoking (24.5%). Except for obesity, the difference between men and women
was significant (all P
We also found that clustering of these risk factors was common among participants with high CVD risk. As shown in Table 6, only 21.4% individuals suffered from a single risk factor, more than 40 percentage individuals suffered from 2 risk factors, and one-quarter of individuals suffered from 3 risk factors.
| Current smoking | Obesity | Hypertension | Diabetes | Dyslipidemia | ||
| Total | 4167 (24.5) | 5873 (34.6) | 15613 (91.9) | 4692 (27.6) | 9200 (54.1) | |
| Sex | ||||||
| Men | 3560 (46.8) | 2684 (35.3) | 6878 (90.4) | 2197 (28.9) | 4211 (24.8) | |
| Women | 607 (6.5) | 3189 (34.0) | 8735 (93.1) | 2495 (26.6) | 4989 (53.2) | |
| 3690.668 | 3.099 | 40.766 | 10.992 | 8.035 | ||
| P | 0.081 | 0.001 | 0.005 | |||
| Living environment | ||||||
| Urban | 1191 (21.2) | 1898 (33.8) | 5036 (89.7) | 1670 (29.7) | 3368 (60.0) | |
| Rural | 2976 (26.2) | 3975 (34.9) | 10577 (93.0) | 3022 (26.6) | 5832 (51.3) | |
| 49.624 | 2.124 | 53.737 | 19.073 | 115.431 | ||
| P | 0.124 | |||||
| Ethnicity | ||||||
| Han | 3744 (22.4) | 5197 (34.1) | 14011 (91.9) | 4192 (27.5) | 8213 (53.9) | |
| Mongolian | 352 (24.4) | 554 (38.4) | 1336 (92.5) | 412 (28.5) | 798 (55.3) | |
| 0.024 | 10.666 | 0.662 | 0.704 | 1.020 | ||
| P | 0.877 | 0.001 | 0.416 | 0.401 | 0.312 | |
| Men | Women | Total | |
| 1 risk factor | 1118 (14.7) | 2526 (26.9) | 3644 (21.4) |
| 2 risk factors | 3493 (45.9) | 3947 (42.1) | 7440 (43.8) |
| 3 risk factors | 2065 (27.1) | 2321 (24.7) | 4386 (25.8) |
| 4 risk factors | 697 (9.2) | 554 (5.9) | 1251 (7.4) |
| 5 risk factors | 234 (3.1) | 32 (0.3) | 266 (1.6) |
On the basis of the Chinese Guideline for the Prevention of Cardiovascular Disease, healthy lifestyle and medication use should be adopted to prevent the occurrence of CVD among individuals with high CVD risk. Among study participants with high CVD risk, we found that the percentage taking antihypertensive drugs was 45.94% in those with hypertension, the percentage taking hypoglycemic drugs was 27.99% in those with diabetes, and the percentage taking lipid-lowering drugs was only 5.01% in those with dyslipidemia. In addition, the control rates of hypertension, diabetes, and dyslipidemia were 1.20%, 4.43%, and 2.78%, respectively (Fig. 2).
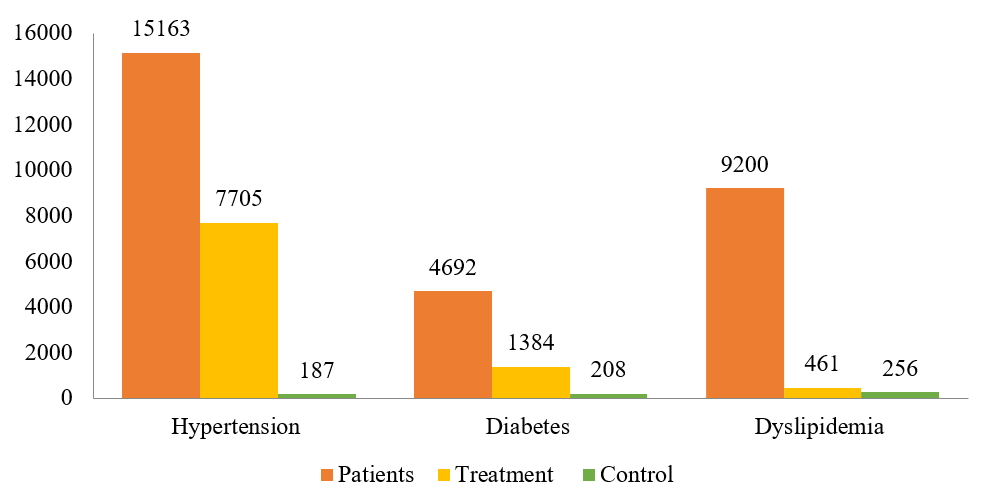 Fig. 2.
Treatment and control among individuals with high cardiovascular disease risk. Legend: Patients of hypertension, diabetes and dyslipidemia refer to the high CVD risk individuals who have been diagnosed with the corresponding disease according to the corresponding diagnostic criteria; Treatment of hypertension, diabetes and dyslipidemia refers to the current use of antihypertensive medication, hypoglycemic drugs and lipid-lowering drugs, respectively; control refers to the patients with hypertension, diabetes and dyslipidemia whose blood pressure, blood sugar and blood lipids are controlled at the normal levels.
This was the first large-scale study to provide a complete overview of the prevalence and treatment of high CVD risk in Inner Mongolia. Our study findings indicated that the prevalence of high CVD risk is elevated in Inner Mongolia, with approximately one-quarter of middle-aged adults at high risk of CVD. Among individuals with high CVD risk, the main risk factors of CVD were common, as was clustering of risk factors. However, treatment and control of risk factors were low.
The prevalence of high CVD risk in Inner Mongolia as reported in this study was much higher than those in other areas in China [18]. The age- and sex-standardized rate of high CVD risk in Inner Mongolia was more than three times higher than that in China. This may be related to the economic, social characteristics and negative health behaviors of local residents. In Inner Mongolia, the level of education and income was low, and negative health behaviors such as high-salt, high-fat diets, and high rate of drinking are common [19]. Under all those factors, the prevalence of CVD risk factors such as hypertension, diabetes, obesity were higher among China [20, 21, 22], therefore, the prevalence of high CVD risk was high. The results of this study were the same, the mean blood pressure level, no matter systolic pressure or diastolic pressure was at a very high level, the systolic pressure has reached the diagnostic criteria for hypertension. The mean blood glucose level, total cholesterol and high-density lipoprotein cholesterol levels were all higher than the national average [23].
Early identification and intervention of high-risk individuals is very important for the prevention of CVD. In the United States, the age-adjusted death rate for coronary heart disease fell from 542.9 to 266.8 cases per 100,000 population among men aged 25 to 84 years and from 263.3 to 134.4 among women between 1980 and 2000; approximately 44% of the decrease was attributed to changes in risk factors among individuals with high risk [24]. We identified the following risk factors on high CVD risk in Inner Mongolia: men sex, older, being unmarried, living in urban areas, farmer, obesity, hypertension, diabetes and dyslipidemia, which was consistent with previous studies [3, 12, 18, 25]. Men had a higher prevalence of high CVD risk than women, the reason is likely that the exposure levels of CVD risk factors for men is higher than women. For example, smoking and drinking rates were much higher than women, the average SBP, DBP and GLU were also higher among men in this study. Prevalence of high CVD risk increased with age increasing, which was because the effects of risk factors are accumulating and degradation of bodily functions [26]. Individuals living in urban areas got relatively little exercise, and unmarried individuals were possibly in a relatively poor state of social support. Prevention and early control measures are warranted in these high-risk individuals.
The most common risk factor was hypertension among participants with high CVD risk; the percentage was as high as 91.9%, this result was similar to the nationwide study, so was the percentage of dyslipidemia [18]. However, we found that the percentage of diabetes was lower than the result of the nationwide study, the percentage of obesity was higher than that, it indicated that we should pay more attention to obesity of high-risk individuals.
This is the first survey to report clustering of CVD risk factors in Inner Mongolia. We found that clustering of CVD risk factors was very common in people aged 35–75 years with high CVD risk. Previous studies conducted in China and in the other regions [27, 28, 29, 30] have demonstrated clustering of primarily one CVD risk factor. In this study, participants with high CVD risk had clustering of two major CVD risk factors; this indicates a greater challenge for the prevention of CVD in individuals with high CVD risk.
Although the prevalence of CVD risk factors was high, treatment and control were very low among our participants. We found that among individuals with high CVD risk, the percentage taking antihypertensive drugs among those with hypertension was 45.94%. The percentage taking hypoglycemic drugs among those with diabetes was 27.99%, and the percentage taking statins among those with dyslipidemia was only 5.01%. The percentage of antihypertensive treatment is actually higher in this study compared to the result of a nationwide study [18], however, the rate of control was much lower than the results of this nationwide study [14]. The reason may be due to hypertension was the most prevalent risk factor (91.9%), and often clustering with other risk factors, such as diabetes and dyslipidemia, but the rates of treatment for them were low, which affected the rate of control for hypertension. Low treatment and control rates for diabetes and dyslipidemia could be the result of low rates of awareness about diabetes (38.0%) and dyslipidemia (5.50%), in comparison with other studies in China or in other countries [14, 31, 32, 33], in addition, the clustering of risk factors also affects the control rate. The lack of management for hypertension, diabetes and dyslipidemia might be due to the insufficient health investment [34], the health service should be improved, including screening and health education for the individuals of high CVD risk.
Our study had several limitations. First, as these findings were derived from a cross-sectional study, and the prevalence of high CVD risk or medication use were based on questionnaires and measurements, the results might be affected by recall bias. Second, high CVD risk was defined according to the Chinese Guideline for the Prevention of Cardiovascular Disease; therefore, comparisons between this study and those from other countries should be made with caution. Finally, we excluded patients with a history of CVD in the definition of high CVD risk because we wished to focus on primary prevention of CVD.
In conclusion, we identified the prevalence of high CVD risk in Inner Mongolia was much higher than that in other areas in China, especially for men sex, older, being unmarried, living in urban areas, farmer, obesity, hypertension, diabetes and dyslipidemia. Among individuals with high CVD risk, the risk factors of CVD were common, as was clustering of risk factors. However, treatment and control rates were low. Our findings suggested that the need for reduce weight and medication use should be adopted to control blood pressure, blood sugar and blood lipid levels targeting individuals with high CVD risk, to reduce the CVD burden in Inner Mongolia. In addition, in view of the high prevalence of high CVD risk, early detection of high-risk individuals is crucial, such as establishing a CVD risk assessment models of Inner Mongolia.
CVD, Cardiovascular disease; DALYs, disability-adjusted life-years; ASCVD, atherosclerotic cardiovascular diseases; BMI, Body Mass Index; SBP, Systolic Blood Pressure; DBP, diastolic blood pressure; GLU, glucose; TC, total cholesterol; HDL-C, high density lipoprotein cholesterol; LDL-C, low density lipoprotein cholesterol; TG, triglyceride; SD, standard deviation; OR, odds ratio; CI, confidence interval.
WRW and XGZ conceived the study; YFX, NC and LYQ designed the study protocol; NC and HZ carried out the analysis and all authors provided an interpretation of these data. NC, LWN and SQJ drafted the manuscript; HB, TY and XQX critically revised the manuscript for intellectual content. All authors read and approved the final manuscript. WRW and XGZ are guarantors of the paper.
This project was approved by the ethics committee of Fuwai Hospital Chinese Academy of Medical Sciences (approval number: 2014-574). Written informed consent was obtained from all individual participants included in the study.
We thank Analisa Avila, ELS, of Liwen Bianji, Edanz Group China (www.liwenbianji.cn/ac), for editing the English text of a draft of this manuscript.
The study was supported by the Ministry of Finance of China and National Health and Family Planning Commission of China; the Inner Mongolia Autonomous Region Health and Family Planning Commission Research Project (grant number 201701041); the Natural Science Foundation Program of Inner Mongolia Autonomous Region (grant number 2020MS08048); the Youth Innovation Fund Project of Inner Mongolia Medical University (grant number YKD2020QNCX035).
The authors declare no conflict of interest.