


 , Hong Cui 1,*
1 Department of Pediatrics, Beijing Friendship Hospital, Capital Medical University, 100050 Beijing, China
Abstract
Background: Hypoxic-ischemic injury of neurons is a pathological
process observed in several neurological conditions, including ischemic stroke
and neonatal hypoxic-ischemic brain injury (HIBI). An optimal treatment strategy
for these conditions remains elusive. The present study delved deeper into the
molecular alterations occurring during the injury process in order to identify
potential therapeutic targets. Methods: Oxygen-glucose deprivation/reperfusion (OGD/R) serves as an established in vitro model for the
simulation of HIBI. This study utilized RNA sequencing to analyze rat primary
hippocampal neurons that were subjected to either 0.5 or 2 h of OGD, followed by
0, 9, or 18 h of reperfusion. Differential expression analysis was conducted to
identify genes dysregulated during OGD/R. Time-series analysis was used to
identify genes exhibiting similar expression patterns over time. Additionally,
functional enrichment analysis was conducted to explore their biological
functions, and protein-protein interaction (PPI) network analyses were performed
to identify hub genes. Quantitative real-time polymerase chain reaction (qRT-PCR)
was used for validation of hub-gene expression. Results: The study
included a total of 24 samples. Analysis revealed distinct transcriptomic
alterations after OGD/R processes, with significant dysregulation of genes such
as Txnip, Btg2, Egr1 and Egr2. In the OGD process, 76 genes, in two
identified clusters, showed a consistent increase in expression; functional
analysis showed involvement of inflammatory responses and signaling pathways like
tumor necrosis factor (TNF), nuclear factor kappa-light-chain-enhancer of
activated B cells (NF-
Keywords
- gene-expression profiling
- hub gene
- hypoxic-ischemic brain injury
- oxygen-glucose deprivation/reperfusion
- time-series analysis
Neuronal oxygen-glucose deprivation/reperfusion (OGD/R) injury serves as a prevalent in vitro experimental model, commonly used to mimic ischemic brain events, particularly ischemic stroke [1] and neonatal hypoxic-ischemic brain injury (HIBI) [2]. Annually, over 13.7 million individuals experience stroke, worldwide, with a mortality of 5.5 million, among adults [3]. Ischemic stroke is usually addressed by the administration of recombinant-tissue-plasminogen activator and mechanical thrombolysis, both of which aim to restore blood flow. Nevertheless, those therapeutic approaches are encumbered by notable constraints and adverse reactions [4, 5, 6]. Neonatal HIBI may lead to a spectrum of neurological impairments, ranging from immediate and lasting damage to, in severe cases, neonatal mortality. Therapeutic hypothermia is the sole currently accessible intervention. Nevertheless, the initiation of hypothermia therapy must occur within a 6-h period after birth and is accompanied by many adverse effects [7, 8]. Consequently, it is important to undertake further research to elucidate, more comprehensively, the molecular mechanisms that drive the damage process.
The pathophysiology of neuronal damage in hypoxic-ischemic conditions is complex [9]. Insufficient supply of oxygen and glucose triggers a series of events leading to neuronal damage and cell death. Although reperfusion is crucial for neuronal survival and recovery, it can paradoxically intensify damage via mechanisms that include oxidative stress, inflammation, and excitotoxicity [10]. In vivo models offer more accurate physiological representations, but their outcomes are affected by the complex interplay among different organs, systems, and cells. Conversely, in vitro models excel in isolating single cell types or specific cellular processes, thereby simplifying the analysis. This simplification is advantageous in elucidating the molecular and cellular mechanisms underlying diseases, as it minimizes interference from the complexities inherent in broader biological systems. In recent years, the deployment of high-throughput techniques and bioinformatics has been recognized as an effective approach for detecting disease progression and identifying biomarkers [11]. However, few studies have focused on transcriptomic changes associated with OGD/R models of primary neurons.
Our study was designed to provide a comprehensive examination of transcriptomic changes during OGD/R. We established distinct times, within both the OGD and reperfusion phases, that allow for a time-series analysis to identify differentially expressed genes (DEGs). Rigorous bioinformatic analyses were conducted to identify pivotal genes. Overall, we aimed to offer a novel perspective in the pursuit of therapeutic strategies for associated neurological diseases.
As described previously [12], primary hippocampal neurons were cultured from
fetal rats with a gestational age of 16–18 days. Pregnant rats were terminated with CO
For simulating hypoxic-ischemia, the OGD/R model was employed. The procedure
involved replacing the neurobasal medium with glucose-free medium and incubating
cells in an anoxic environment (95% N
Total RNA was isolated using TRIzol reagent (15596026, Invitrogen, Carlsbad, CA, USA), according to the manufacturer’s instructions. The purity and integrity of the RNA were evaluated using a NanoDrop 2000 (ND-2000, Thermo Fisher Scientific, Wilmington, DE, USA) and an Agilent Bioanalyzer 2100 (G2939A, Agilent Technologies, CA, USA), respectively. We used 1 µg/sample of total RNA to create sequencing libraries with the Hieff NGS Ultima Dual-mode mRNA Library Prep Kit (12309ES24, Yeasen Biotechnology, Shanghai, China). Library quality was confirmed using the Agilent Bioanalyzer, before sequencing on an Illumina NovaSeq (NovaSeq6000, Illumina, San Diego, CA, USA) to generate 150 bp paired-end reads.
Raw sequencing reads in FASTQ format were preprocessed to eliminate adapter sequences, poly N-containing reads, and low-quality reads for quality control, and gene expression quantification. Metrics such as Q20, Q30, GC content, and duplication levels, were also calculated. Only clean, high-quality reads were retained for downstream analysis. These reads were aligned to the Rnor_6.0 reference genome using Hisat2 (version 2.2.1, GitHub, San Francisco, CA, USA), and uniquely mapped reads were selected for subsequent analysis.
Hierarchical clustering was performed using the average linkage method to categorize the samples according to their gene expression patterns. This analysis was executed using the ‘hclust’ function available in the R statistical software package (version 2.13.2, R Foundation for Statistical Computing, Vienna, Austria).
Uniform manifold approximation and projection is a non-linear dimensionality-reduction technique that effectively identifies batch effects, uncovers underlying biological features, and reveals distinct biological groups [13]. We used Uniform Manifold Approximation and Projection (UMAP) clustering to visualize the heterogeneity within the samples in two dimensions. This algorithm was executed on log-transformed Transcripts Per Million (TPM) data using the UMAP R package (version 0.2.8.0, Comprehensive R Archive Network, Vienna, Austria).
DEGs between OGD/R and control samples were determined using the DESeq2 R
package (version 1.36.0, Bioconductor, Seattle, WA, USA) [14]. Genes exhibiting
The Mfuzz R package (version 2.26.0, Bioconductor, Seattle, WA, USA) was used for time-series analysis, in order to identify genes exhibiting similar expression patterns across distinct time points [15]. The analysis began with the selection of DEGs. For the OGD process, DEGs were chosen based on their expression differences between the OGD samples and the control samples at 0.5 or 2 h. For the reperfusion process, DEGs were selected by comparing the reperfusion samples at 9 h or 18 h with the 0 h samples, independent of the duration of OGD.
Then, the DEGs were partitioned into six clusters using a membership threshold of 0.20. Gene clusters demonstrating a consistent upregulation trend throughout the various OGD durations were consolidated and classified as OGD-related genes. Gene clusters that showed upregulation followed by downregulation were categorized as reperfusion-related genes, based on the hypothesis that the cells would progressively recover over extended periods of reperfusion.
Functional-enrichment analysis was performed using the ClusterProfiler R package
(version 4.4.4, Bioconductor, Seattle, WA, USA) [16]. This analysis aimed to
identify significantly enriched Gene Ontology (GO) and Kyoto Encyclopedia of
Genes and Genomes (KEGG) terms, thereby elucidating the potential functions of
gene clusters identified via the Mfuzz algorithm. The p-values were
adjusted using the Benjamini-Hochberg method, with a threshold of
Protein-Protein Interactions (PPI) network analysis was conducted using the STRING database (https://string-db.org/) to explore potential associations and significant genes within the identified gene set. The network generated from this analysis was visually depicted using the ‘ggraph’ R package (version 2.1.0, Comprehensive R Archive Network, Vienna, Austria). Key nodes (nodes with a high centrality degree) and communities within the network were identified using the “centrality degree” and “group_infomap” functions from the ‘tidygraph’ R package (version 1.2.3, Comprehensive R Archive Network, Vienna, Austria). The centrality degree, which measures the number of edges connected to a node, indicates the node’s potential influence or importance within the network. Communities, defined as groups of nodes more densely interconnected than with the rest of the network, likely represent functional modules or protein complexes engaged in specific biological processes or functions. To streamline the network representation, only nodes with a high degree of centrality were retained.
Total RNA was extracted from primary hippocampal neurons using TRIzol reagent (15596026, Invitrogen, Carlsbad, CA, USA). Then, 1 µg of extracted RNA was reverse-transcribed into cDNA using the Reverse Transcription System Kit (AG11706, Accurate Biology, Hunan, China), by following the manufacturer’s instructions. The quantitative real-time polymerase chain reaction (qRT-PCR) reaction was conducted in a 10 µL reaction system comprising cDNA, specific primers (Table 1), and SYBR Green Master Mix (A25742, Applied Biosystems, Waltham, MA, USA), according to the manufacturer’s instructions.
| Gene | Sequence |
| Esr1 | F: TCCTCCTCATCCTTTCCCATATCCG |
| R: GCATCTCCAGCAGCAGGTCATAG | |
| Igf-1 | F: ACGGGCATTGTGGATGAGTGTTG |
| R: GGATGGAACGAGCTGACTTTGTAGG | |
| Edn1 | F: CTTCTGCCACCTGGACATCATCTG |
| R: CTGTTCCCTTGGTCTGTGGTCTTTG | |
| Hmox1 | F: GGGTCAGGTGTCCAGGGAAGG |
| R: TGGGTTCTGCTTGTTTCGCTCTATC | |
| Serpine1 | F: GCGTCTTCCTCCACAGCCATTC |
| R: TGTCTCTGTTGGATTGTGCCGAAC | |
| Spp1 | F: GACGATGATGACGACGACGATGAC |
| R: GTGTGCTGGCAGTGAAGGACTC | |
| Txnip | F: GCCAGACCAAAGTGCTCACTCAG |
| R: GAGACTCTTGCCACGCCATGATG | |
| Btg2 | F: AGATCGCCGCCGCCGTAG |
| R: ATCGGTCAGTGCGTCCTGGAG | |
| Egr1 | F: GCCAGGAGTGATGAACGCAAGAG |
| R: GGGATGGGTAGGAAGAGAGGGAAG | |
| Egr2 | F: TCACGCCACTCTCCACCATCC |
| R: ACCCTCACCGCCTCCACTTG |
The data were analyzed using GraphPad Prism 9.0 (Dotmatics, Boston, MA, USA) and
are presented as the mean
The study included 24 samples, including 3 control samples for OGD 0.5 h (Control 1) and 3 control samples for OGD 2 h (Control 2). Transcriptome profiling of the samples was performed using a heatmap and UMAP plot (Fig. 1A,B). The heatmap revealed that the samples formed clusters with an overlaid dendrogram. Samples with similar transcriptome profiles were grouped, whereas those with distinct expression patterns were separated. This observation was consistent with the experimental conditions. Notably, the control and OGD samples (the reperfusion time was 0 h) clustered to the left, whereas the reperfusion samples clustered to the right, suggesting that the reperfusion procedure induced more pronounced transcriptome alterations. Additionally, genes exhibiting relatively high expression levels may have undergone a decline after an 18 h reperfusion period, hinting at cellular recovery processes; genes active in the acute phase may have reverted to a state closer to normal.
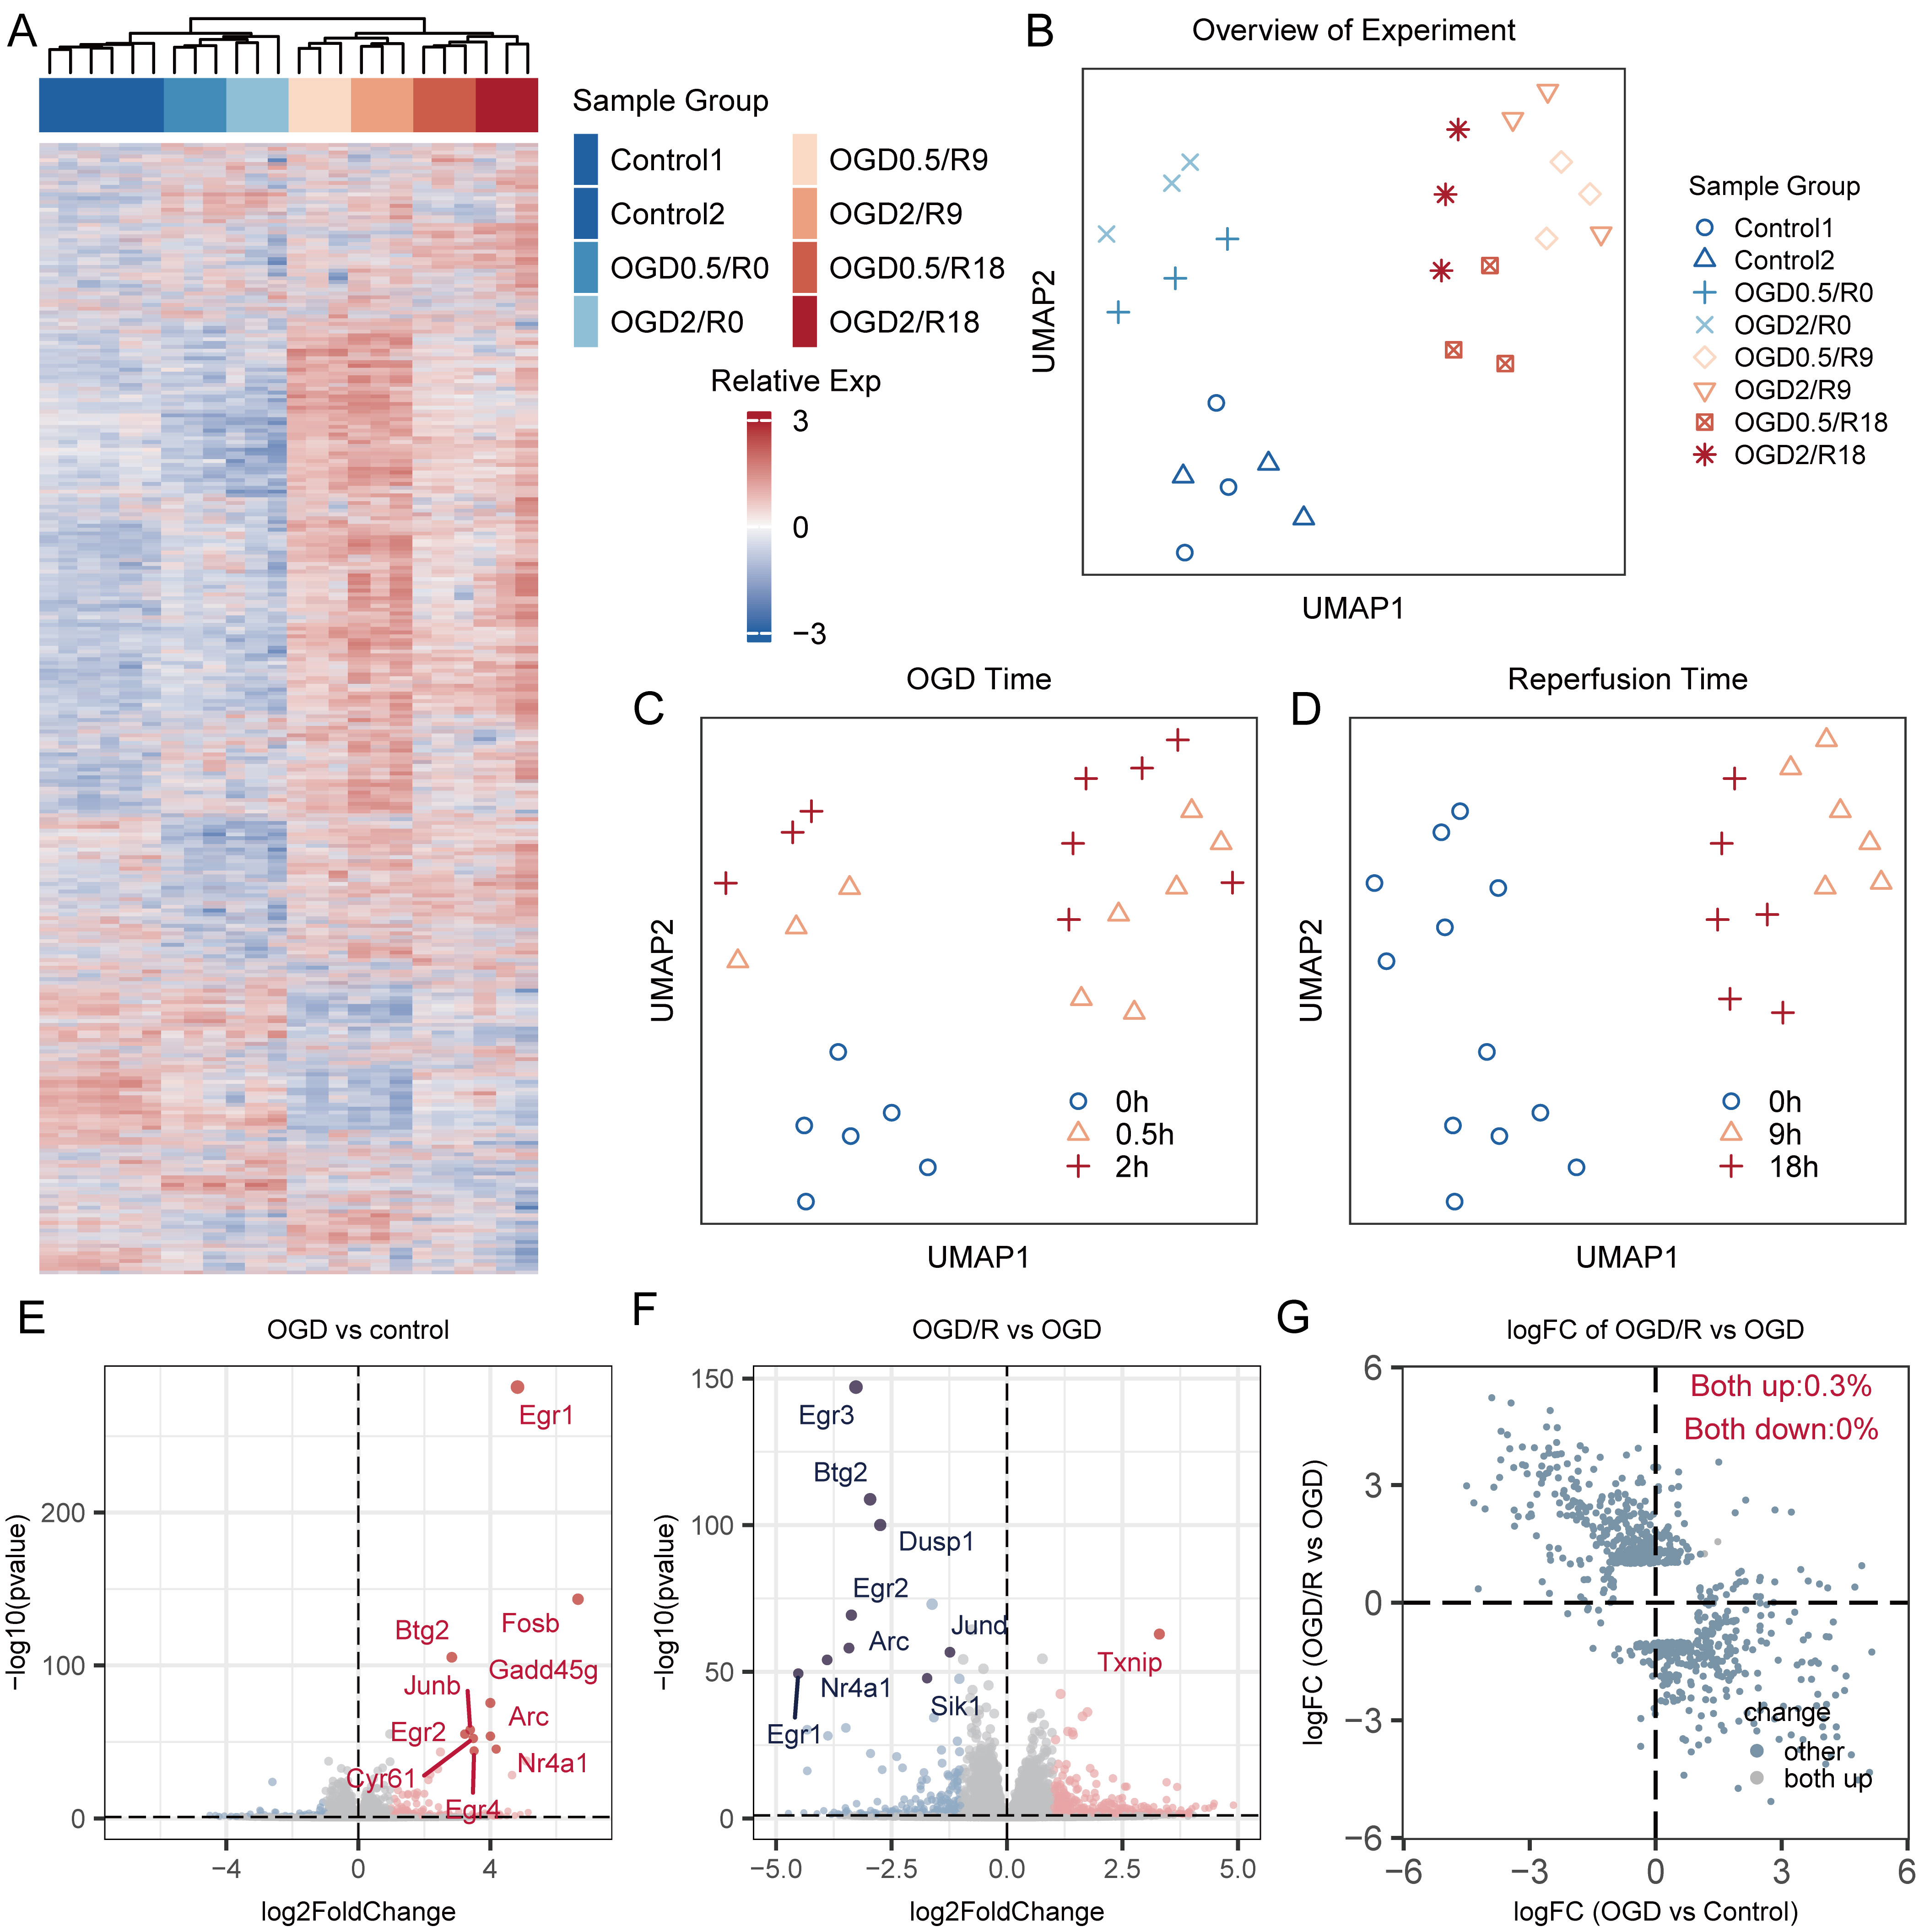 Fig. 1.
Visualization of transcriptome profiling of samples with heatmap and UMAP algorithm. (A) Heatmap of gene-expression profiling across samples with various experimental settings. (B) UMAP plot of the 24 samples. The samples were grouped by different conditions. Samples within the same condition had the same color and shape. (C) Visualization of samples with different durations of OGD. The blue circles = control groups that did not undergo OGD. The pink triangles = samples that underwent 0.5 h of OGD, with or without the reperfusion process. The red crosses = samples that underwent 2 h of OGD, with or without the reperfusion process. (D) Visualization of samples with different durations of reperfusion. The blue circles = samples without the reperfusion process, including samples in the control group or OGD samples. The pink triangles and red crosses = samples that received 9 h and 18 h of reperfusion, respectively. (E) Volcano plot of DEGs between samples with OGD and control samples, and top 10 dysregulated genes were marked with blue color or red color, respecting down-regulated and up-regulated genes respectively. (F) Volcano plot of DEGs between samples with OGD/R and OGD samples, and top 10 dysregulated genes were marked with blue color or red color, respecting down-regulated and up-regulated genes respectively. (G) Scatter plot of logFC of DEGs in OGD/R and OGD samples. UMAP, Uniform Manifold Approximation and Projection; OGD, Oxygen-glucose deprivation; DEGs, differentially expressed genes; OGD/R, Oxygen-glucose deprivation/reperfusion; logFC, logarithmic fold change.
Similarly, in the UMAP plot, samples under identical conditions clustered together, whereas those under different conditions were separated (Fig. 1B). Initially, the 24 samples were categorized into three groups: the control group (lower left), the OGD group (upper left), and reperfusion group (upper right). The distinct positions of the OGD and reperfusion groups indicated unique biological alterations induced by the OGD and reperfusion procedures. Notably, the transcriptome trends of OGD 0.5 h and OGD 2 h samples were consistent; samples with OGD 0.5 h were closer to the control group at different reperfusion time points (9 h, and 18 h) (Fig. 1C). In addition, the distance between the reperfusion and the control groups was greatest at the acute reperfusion stage (9 h), and gradually approached that of the control group with prolonged reperfusion time (Fig. 1D).
We further evaluate the different transcriptome induced with OGD and reperfusion process with volcano plot, as shown in Fig. 1E,F. The result showed that top up-regulated genes in OGD process like Egr1, Egr2, Btg2, Arc, Nr4a1, were downregulated in reperfusion process, moreover, we aggregated the DEGs observed in both OGD and reperfusion phases and calculated their logFC values. Fig. 1G presents these findings, revealing a distinct pattern where most genes upregulated during OGD were found to be downregulated in the reperfusion phase and vice versa. This result highlights the unique transcriptomic alterations induced by OGD and reperfusion.
To further analyze the transcriptome changes induced by different OGD and reperfusion durations, we compared DEGs induced by 0.5 or 2 h of OGD followed by 0, 9, and 18 h of reperfusion, to assess the impact of varying OGD durations. A significant overlap among the top 10 dysregulated genes was observed in the OGD group (OGD 2/R 0 h and OGD 0.5/R 0 h), indicating similar expression changes during 0.5 and 2 h of OGD (Fig. 2A,D). A similar pattern emerged in samples subjected to 9 or 18 h of reperfusion (Fig. 2B,C,E,F). Additionally, the logFC values of DEGs in the OGD 0.5 h and OGD 2 h groups, when plotted in two dimensions, showed primary distribution in the upper-right or lower-left quarters (Supplementary Fig. 2A–C), which means most of DEGs upregulated in OGD 0.5 h were also upregulated in OGD 2 h and vice versa. This pattern suggests that the cells experienced comparable biological processes as OGD duration increased. Despite these observed similarities, distinct differences were also evident (Supplementary Fig. 2D–F). These results suggest that although 0.5 or 2 h of OGD induced certain transcriptomic changes, the extent of these alterations appeared to be limited. Additionally, to substantiate our findings, key dysregulated genes in the OGD and reperfusion processes, such as Txnip, Btg2, Egr1, and Egr2, were further validated using qRT-PCR, with results presented in Supplementary Fig. 3.
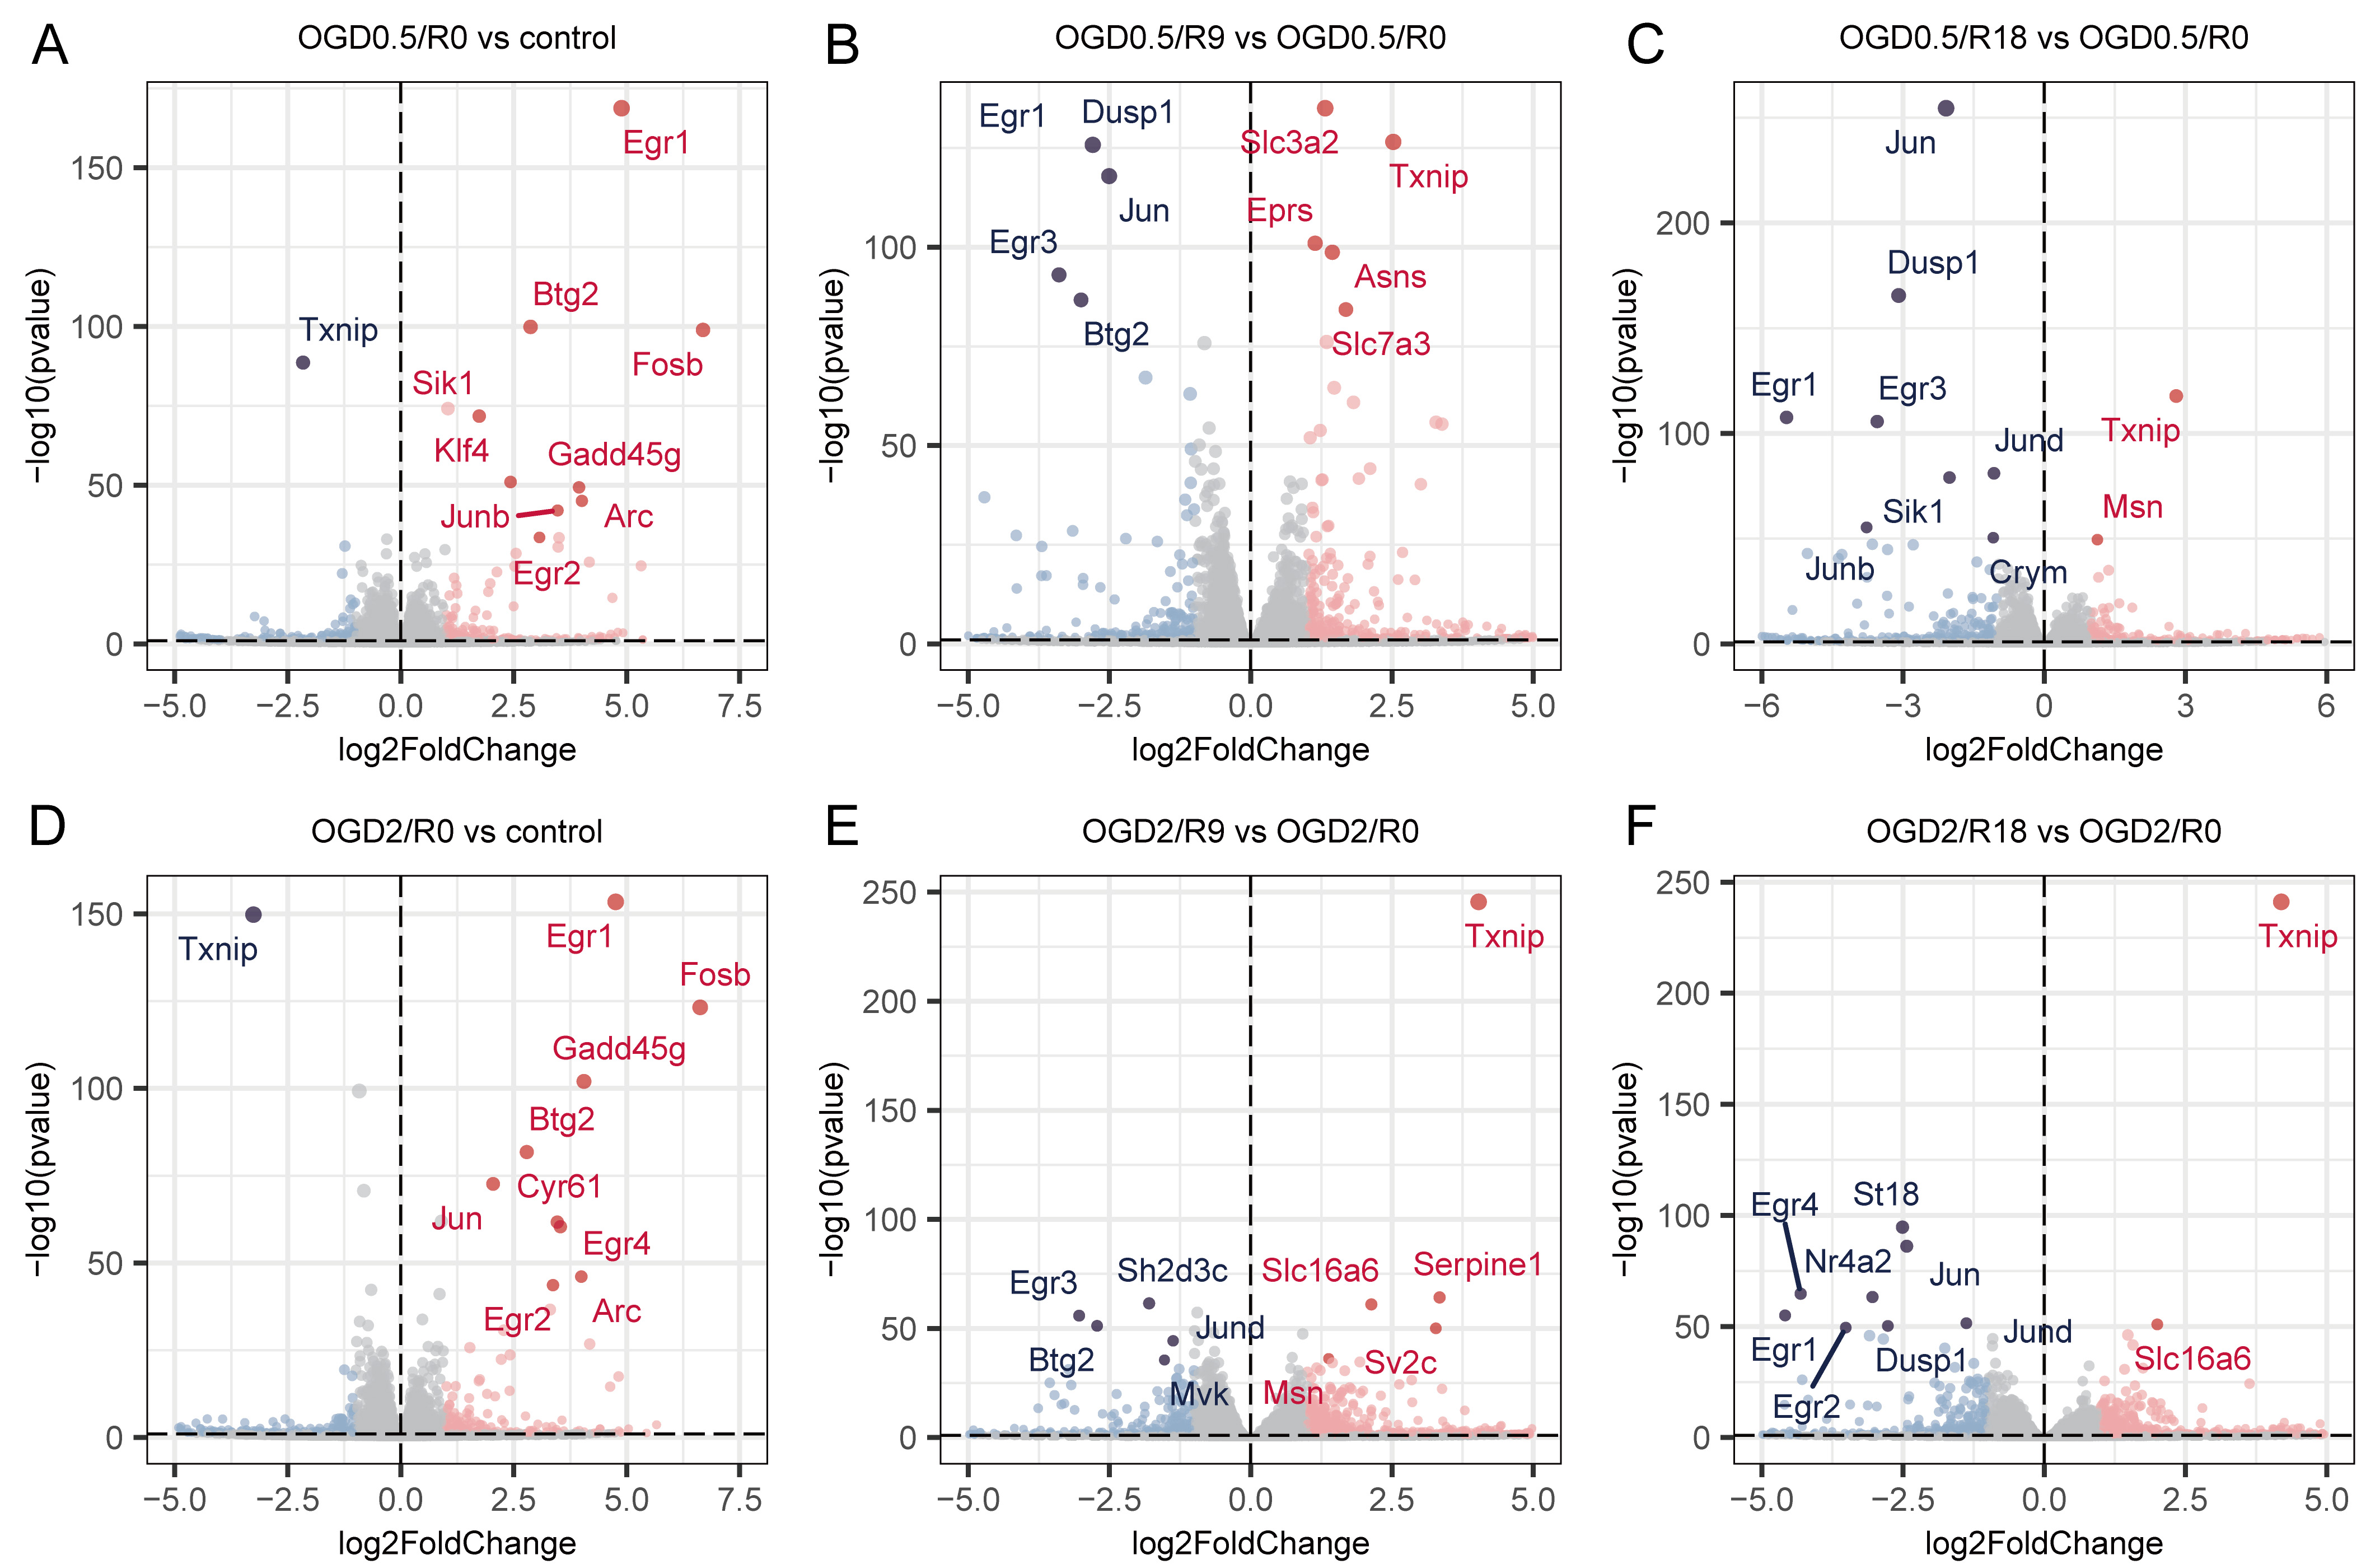 Fig. 2.
Volcano plots of differential gene expression of samples in different groups. (A–C) For OGD 0.5 h, volcano plot of DEGs in R0 vs control, R9 vs R0, and R18 vs R0. (D–F) For OGD 2 h, volcano plot of DEGs in R0 vs control, R9 vs R0 and R18 vs R0. OGD, Oxygen-Glucose Deprivation.
Differential expression analyses were performed for the OGD procedure. The union of 287 DEGs identified in the OGD 0.5 h samples and corresponding control samples, and the 316 DEGs detected in the OGD 2 h samples and their respective controls, were included in the following analysis (Supplementary Table 1). A total of 519 unique genes, extracted from the union of these DEGs, were included in the time-series analysis.
With the Mfuzz clustering methods (Supplementary Table 2), we obtained 6 clusters of genes with similar expression profiles, and classified them into three groups: upregulated (cluster 2 and 4), downregulated (cluster 6), and discontinuously changing (clusters 1, 3, and 5) (Fig. 3A). Among them, 76 DEGs (union of genes in clusters 2 and 4) in the upregulated group showed a continuous increase in expression throughout the OGD process, suggesting that they may be closely related to the biological changes induced by OGD. Additionally, 76 DEGs, visualized using a heatmap, showed a continuously increasing trend in gene expression (Fig. 3B).
 Fig. 3.
Dynamics of transcriptome alterations during the OGD process
revealed through Mfuzz clustering. (A) Clustering analysis by Mfuzz. Red = the
genes with high membership values; yellow = the genes with relative low
membership values. Genes in cluster 2 and 4 showed a consistently increasing
trend with OGD progression, genes in cluster 6 showed a consistently decreasing
trend with OGD progression, genes in cluster 1, 3, and 5 showed a discontinuously
changed trend. (B) Heatmap showing the relative expression level of consistently
increasing genes obtained in different stages of OGD. The top bar indicates
different OGD durations. Besides, genes with relative high expression levels
(log2(TPM)
We performed functional enrichment analysis, using the clusterProfiler R
package, to investigate the biological roles of genes that were consistently
upregulated (Supplementary Table 3). GO enrichment analysis showed that
these genes primarily participate in cell killing, chemokine-mediated signaling
pathways, and chemotaxis of diverse inflammatory cells (Fig. 4A). KEGG pathway
analysis showed several inflammatory-response pathways, such as tumor necrosis
factor (TNF), nuclear factor kappa-light-chain-enhancer of activated B cells
(NF-
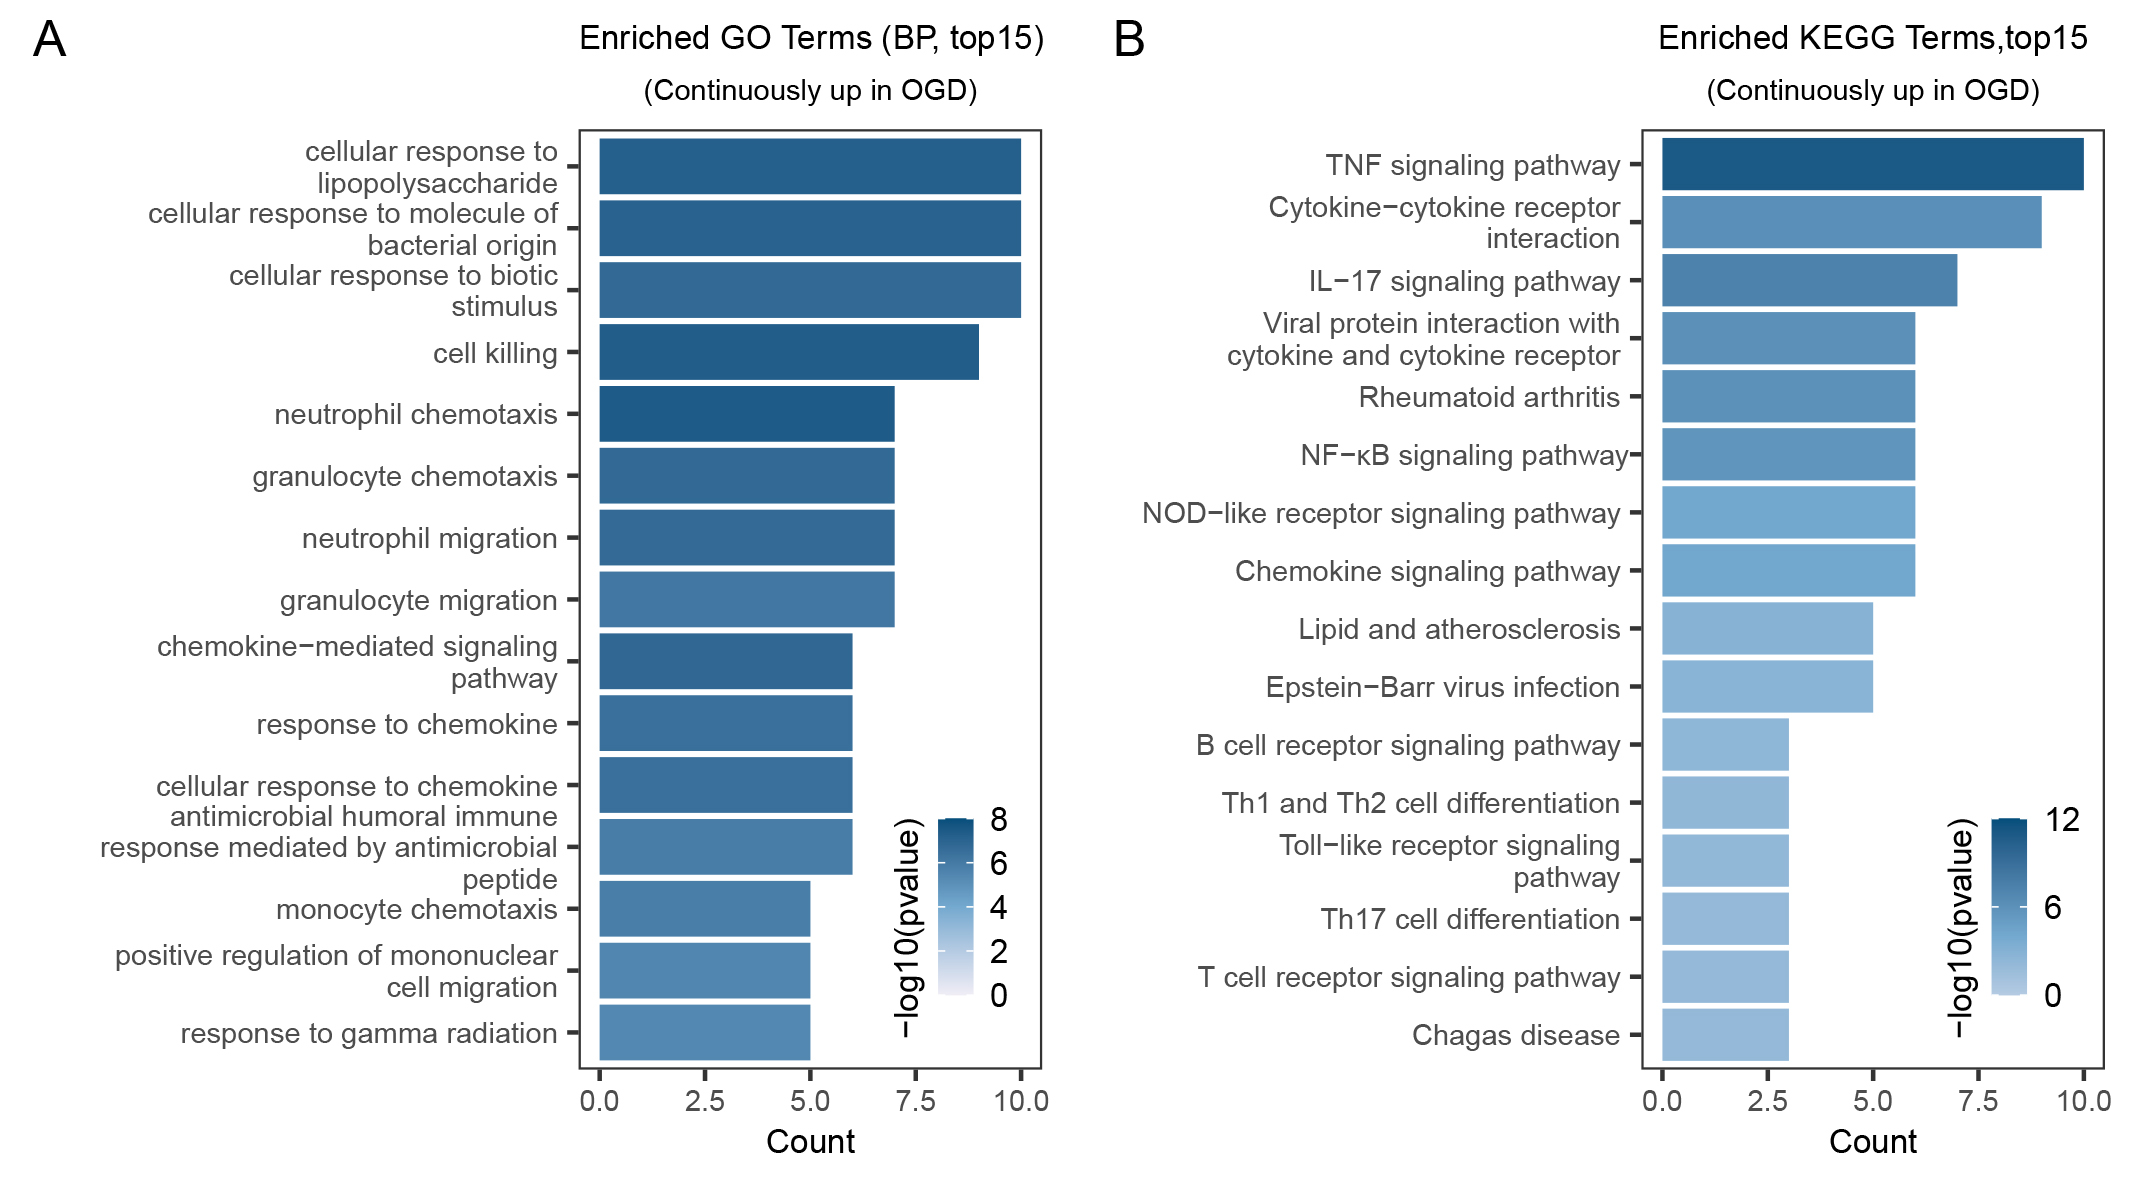 Fig. 4.
GO and KEGG pathway enrichment analyses. (A) Top 15 enriched GO
terms of genes with a continuous increase in OGD process. (B) Top 15 enriched
KEGG pathways of genes with a continuous increase in OGD process. OGD,
Oxygen-Glucose Deprivation; KEGG, Kyoto Encyclopedia of Genes and Genomes; GO,
Gene Ontology; BP, Biological Process; TNF, tumor necrosis factor;
NF-
The ‘ggraph’ and ‘tidygraph’ R packages were used to visualize the potential
links and pivotal genes among the genes that continuously increased during OGD.
We only retained the nodes with degrees
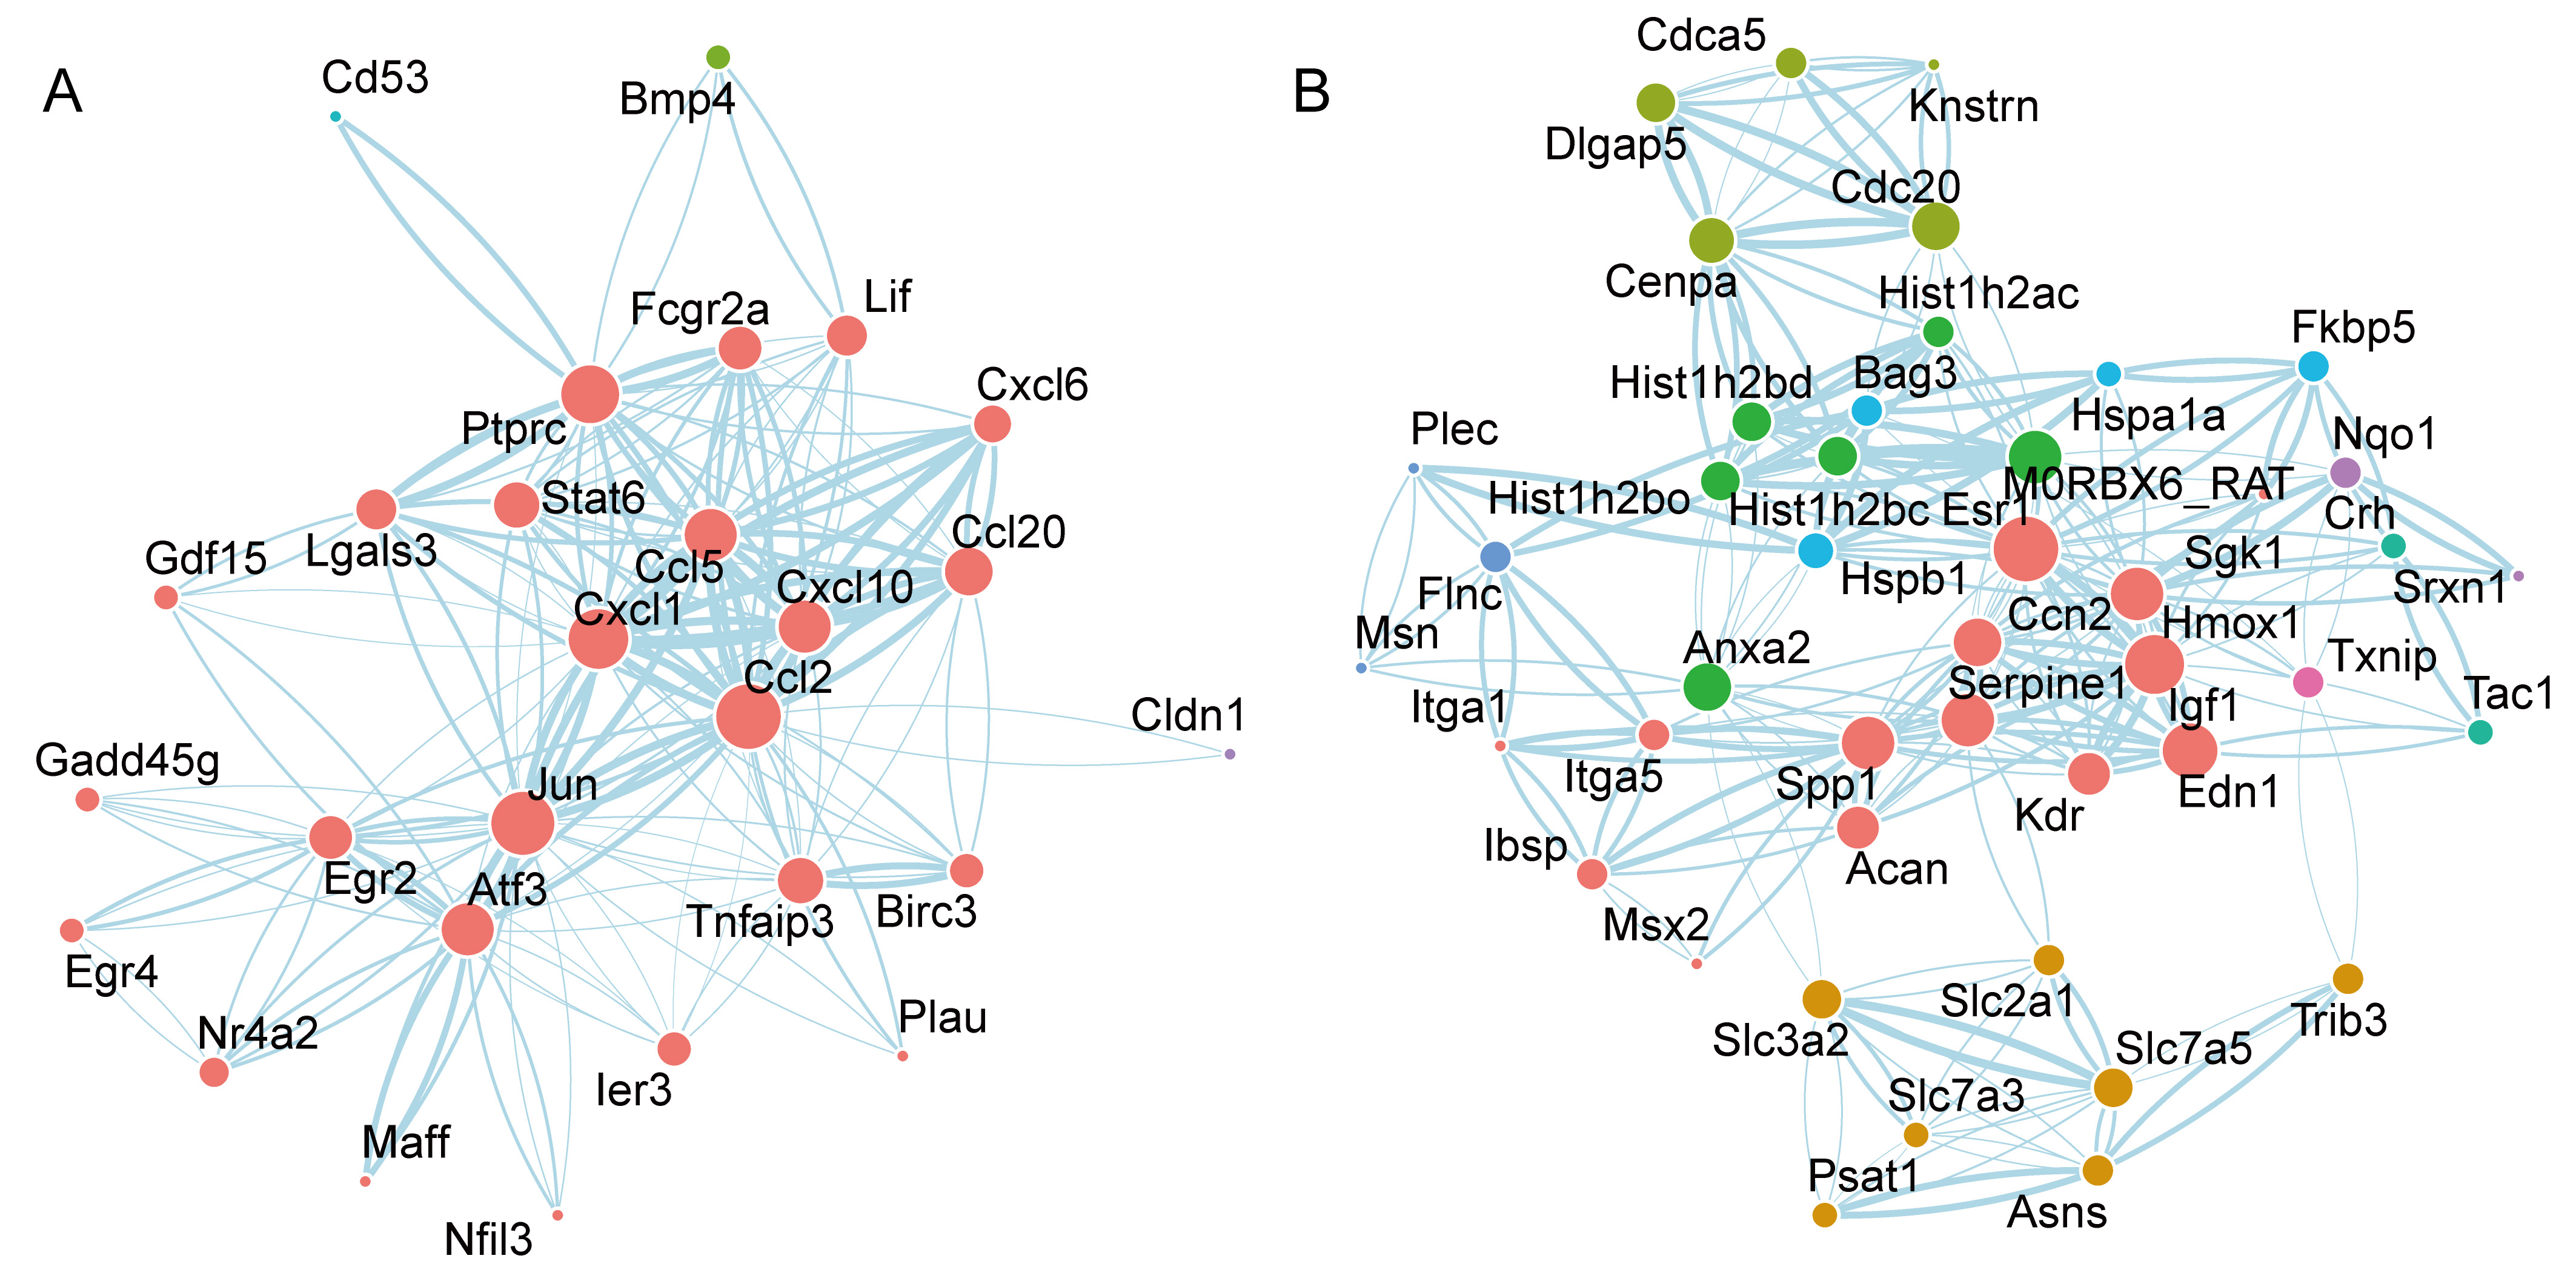 Fig. 5.
PPI network analysis of genes associated with OGD and reperfusion, using the STRING database. The node size indicates the degree of centrality, the node color indicates the community membership, and the edge width indicates the combined score. (A) The PPI network of genes associated with the OGD process. (B) The PPI network of genes associated with the reperfusion process. OGD, Oxygen-Glucose Deprivation; PPI, Protein-Protein Interaction.
As previously described, we selected samples that underwent the OGD process (regardless of their duration) when we focused on the dynamic changes of transcriptome profiling in the reperfusion process. We reasoned that the differences induced by different durations of OGD might not be significant from the perspective of reperfusion (Fig. 1B). In total, 691 DEGs were identified after 9 h of reperfusion, and 542 DEGs were detected after 18 h of reperfusion; these were included in the next analysis (Supplementary Table 4).
We conducted a time-series analysis of the 954 DEGs using Mfuzz clustering, in order to investigate the principal dynamics of gene expression linked to reperfusion. We identified 6 distinct gene clusters that exhibited analogous expression profiles within each cluster (Fig. 6A). It is plausible that cells might gradually return to a normative state over time; samples subjected to 18 h of reperfusion demonstrated an even closer similarity to control samples than did those subjected to 9 h of reperfusion. This observation led us to hypothesize that genes associated with reperfusion might undergo initial upregulation, followed by subsequent downregulation. Guided by these insights, we focused on clusters 1, 4, and 5 in the subsequent analysis, clusters that may be associated with reperfusion procedures. In total, 274 reperfusion-associated genes were visualized using a heatmap (Fig. 6B). As expected, the heatmap indicated a trend of increasing and then decreasing gene expression.
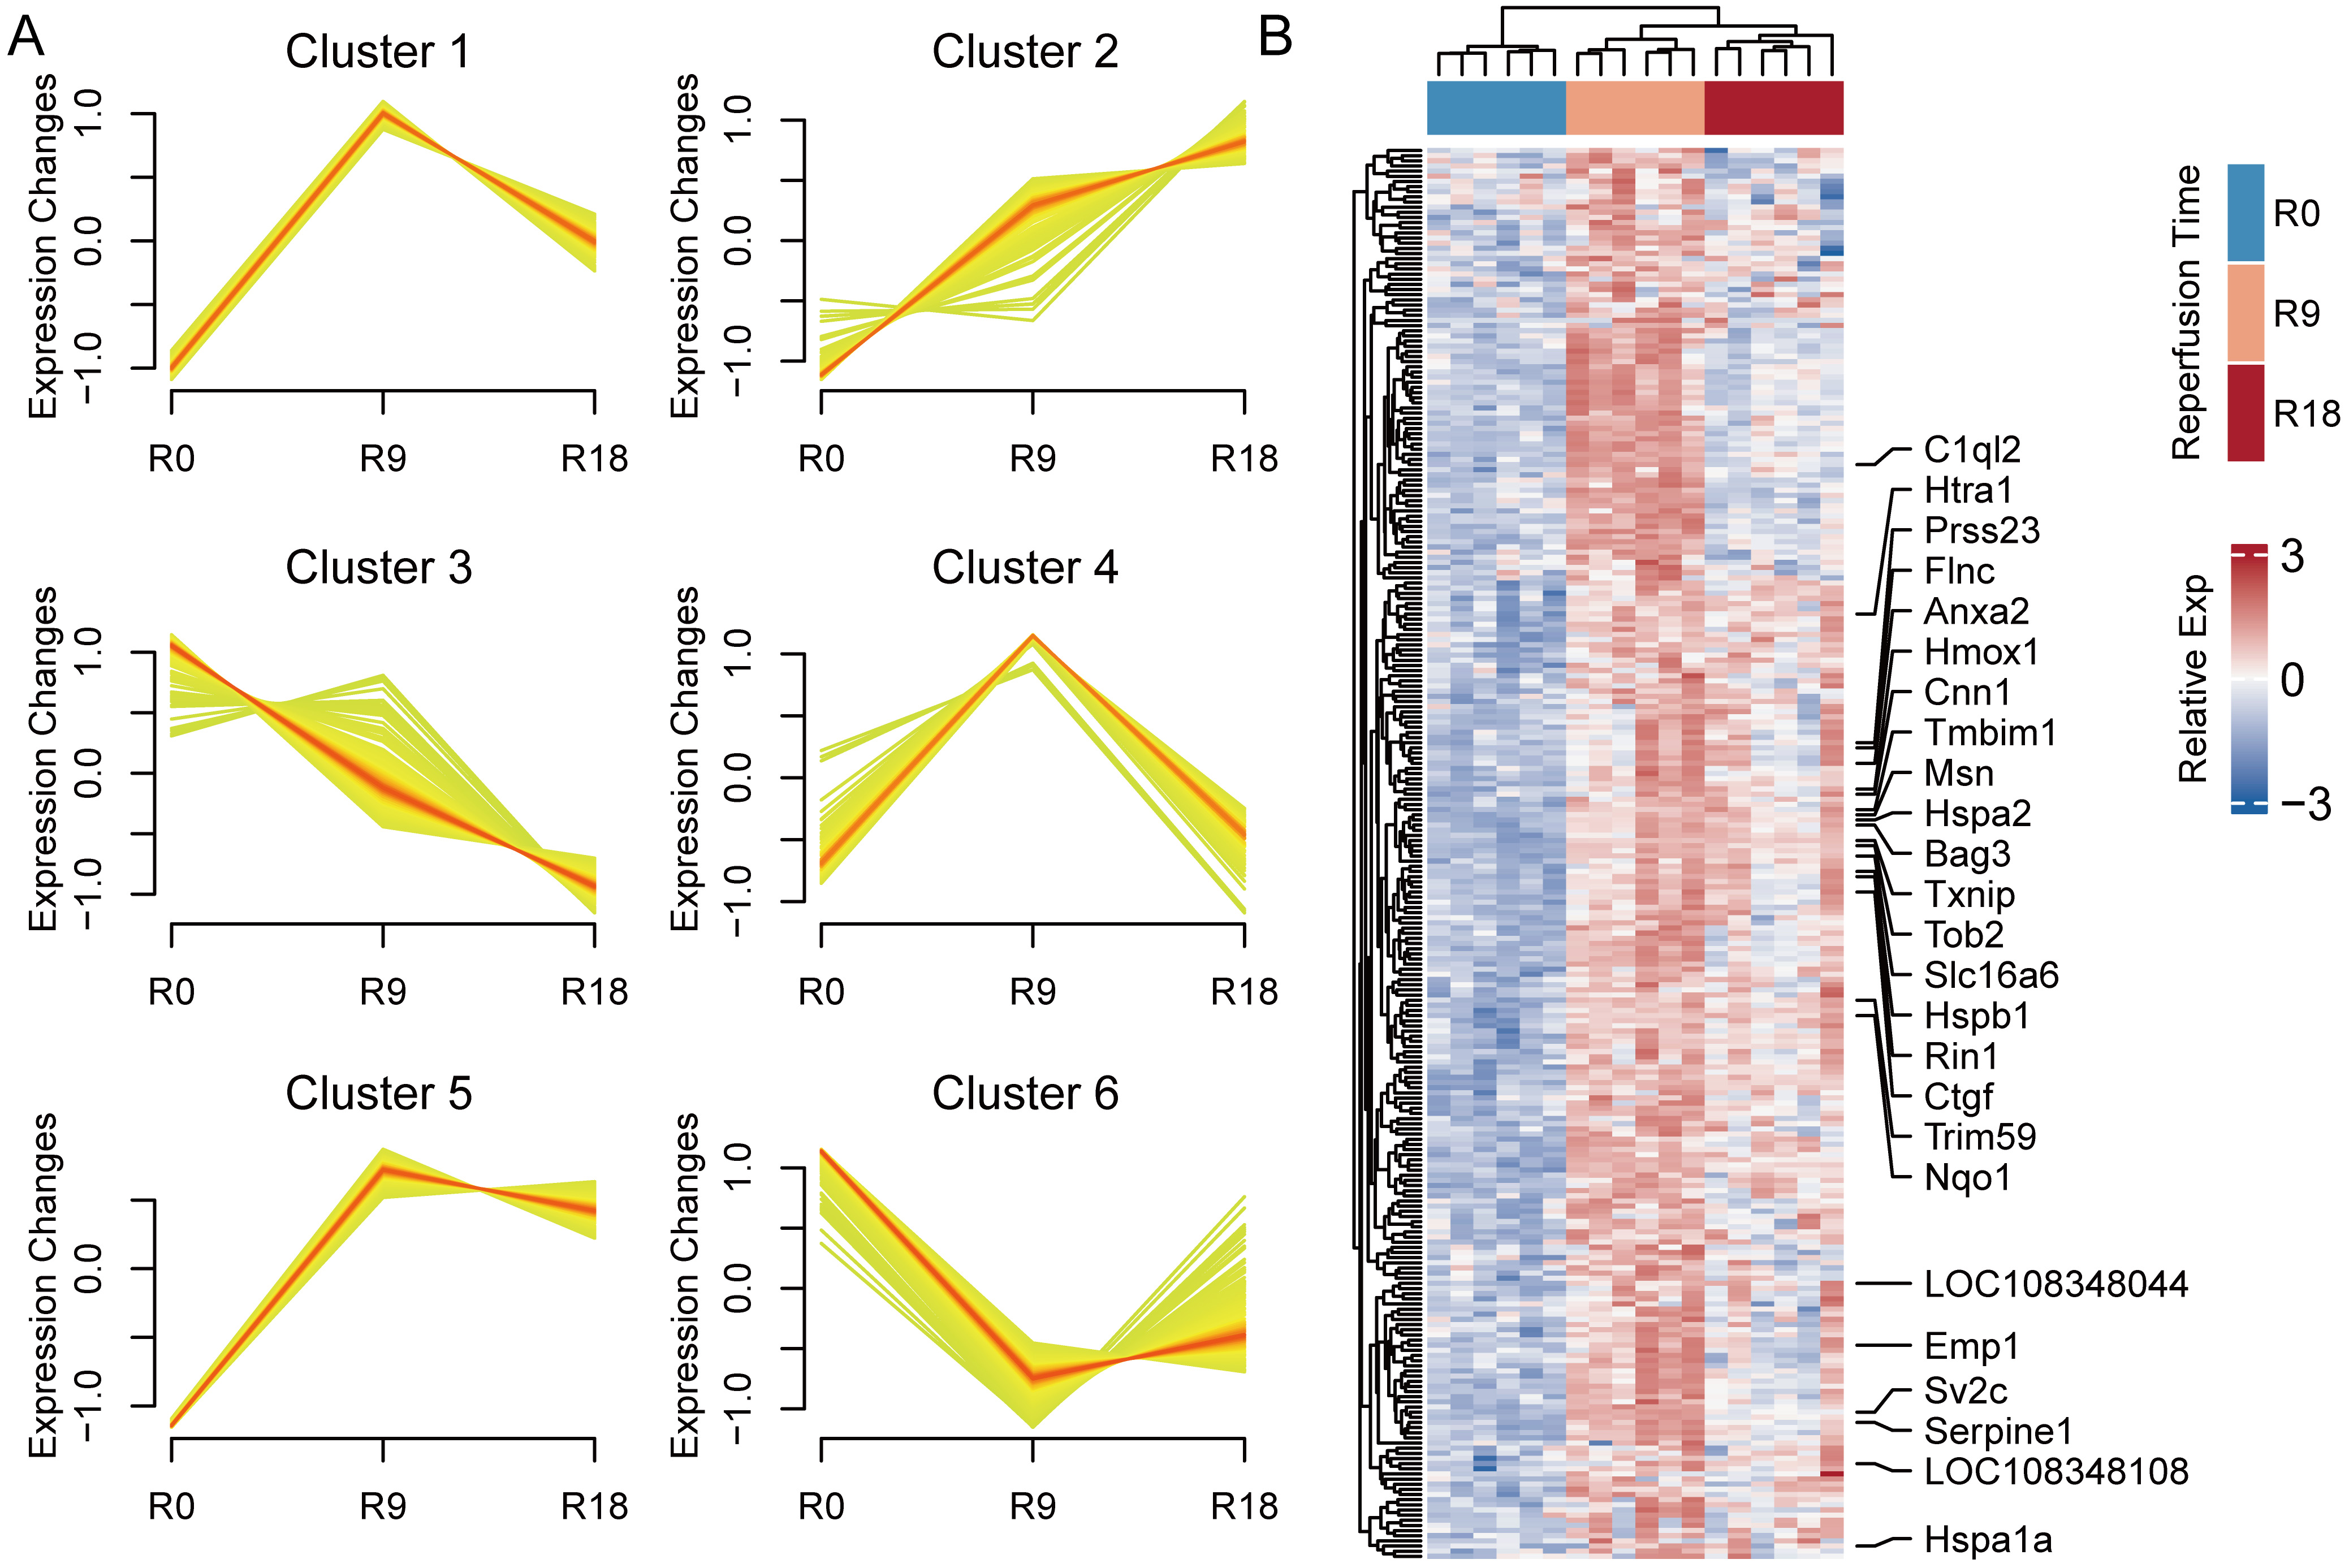 Fig. 6.
Dynamics of transcriptome alterations during reperfusion
revealed through Mfuzz clustering. (A) Clustering analysis by Mfuzz. Red and
yellow = genes with high and low membership values, respectively. Genes in
cluster 2 showed a consistently increasing trend with reperfusion progression,
genes in cluster 3 showed a consistently decreasing trend with reperfusion
progression, and genes in clusters 1, 4, and 5 showed an initial upregulation,
followed by subsequent downregulation. (B) Heatmap showing the relative
expression level of undergo initial upregulation, followed by subsequent
downregulation obtained in different stages of reperfusion. The top bar indicates
different reperfusion durations. Genes with relatively high expression levels
(log2(TPM)
We conducted functional enrichment analysis in order to examine the biological functions of reperfusion-related genes (Supplementary Table 5). The GO-enrichment results showed that these genes were mainly involved in apoptosis and in regulation of neuronal death (Fig. 7A). The KEGG pathway analysis demonstrated the involvement of these genes in various pathways, including neuroactive ligand-receptor interaction, phosphoinositide 3-kinase-protein kinase B (PI3K-Akt) signaling, hypoxia-inducible factor 1 (HIF-1) signaling, and mechanistic target of rapamycin (mTOR) signaling (Fig. 7B).
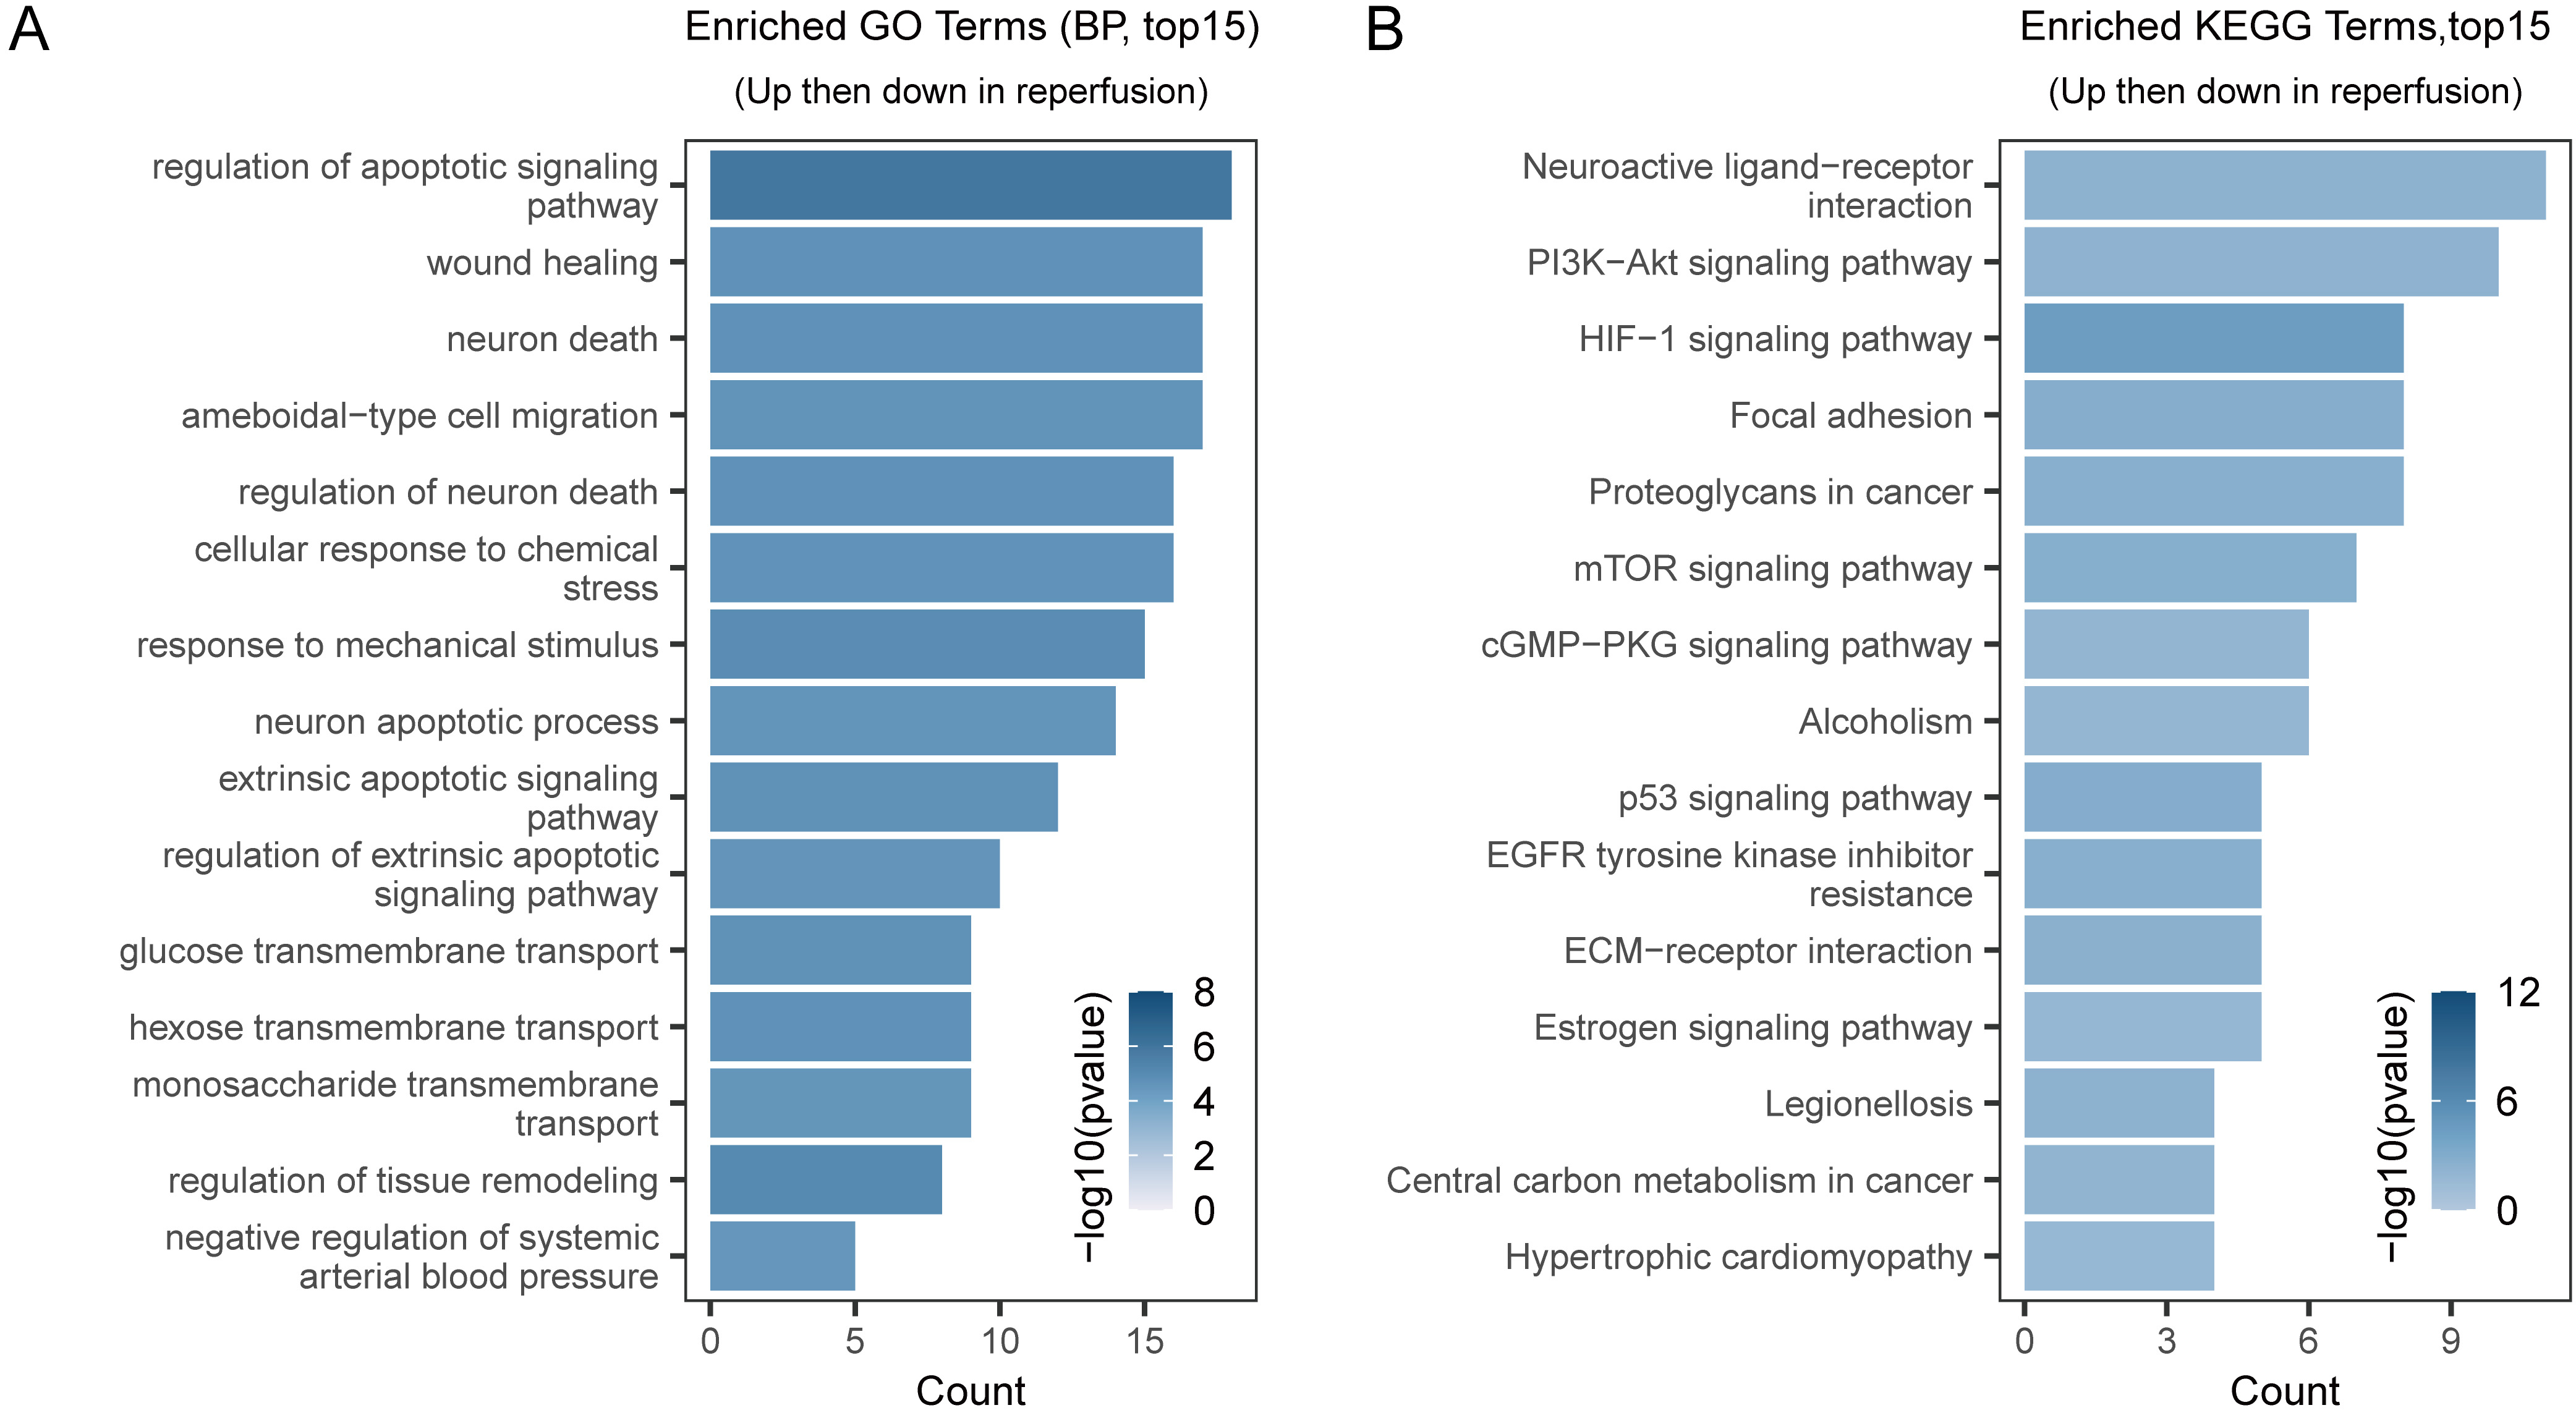 Fig. 7.
GO, and KEGG-pathway enrichment analyses. (A) Top 15 enriched GO terms of genes closely associated with the reperfusion process. (B) Top 15 enriched KEGG pathways of genes closely associated with the reperfusion process. KEGG, Kyoto Encyclopedia of Genes and Genomes; GO, Gene Ontology; BP, Biological Process; HIF-1, hypoxia-inducible factor 1; PI3K-Akt, phosphoinositide 3-kinase-protein kinase B; cGMP-PKG, cyclic Guanosine Monophosphate-Protein Kinase G; EGFR, Epidermal Growth Factor Receptor; ECM, Extracellular Matrix; mTOR, mechanistic target of rapamycin.
In our analysis, the ‘ggraph’ and ‘tidygraph’ R packages were used to visualize
potential associations and key genes involved in the reperfusion process. To
simplify the network, only nodes with a degree
In primary hippocampal neurons, the mRNA levels of 6 of the DEGs (Esr1, Igf-1, Edn1, Hmox1, Serpine1, and Spp1) were quantified using qRT-PCR, in order to provide additional validation of the hub genes. The mRNA levels of the hub genes exhibited a consistent pattern of an initial increase followed by a subsequent decrease, across various time points; they were consistent with the anticipated trends derived from the time series analysis (Fig. 8).
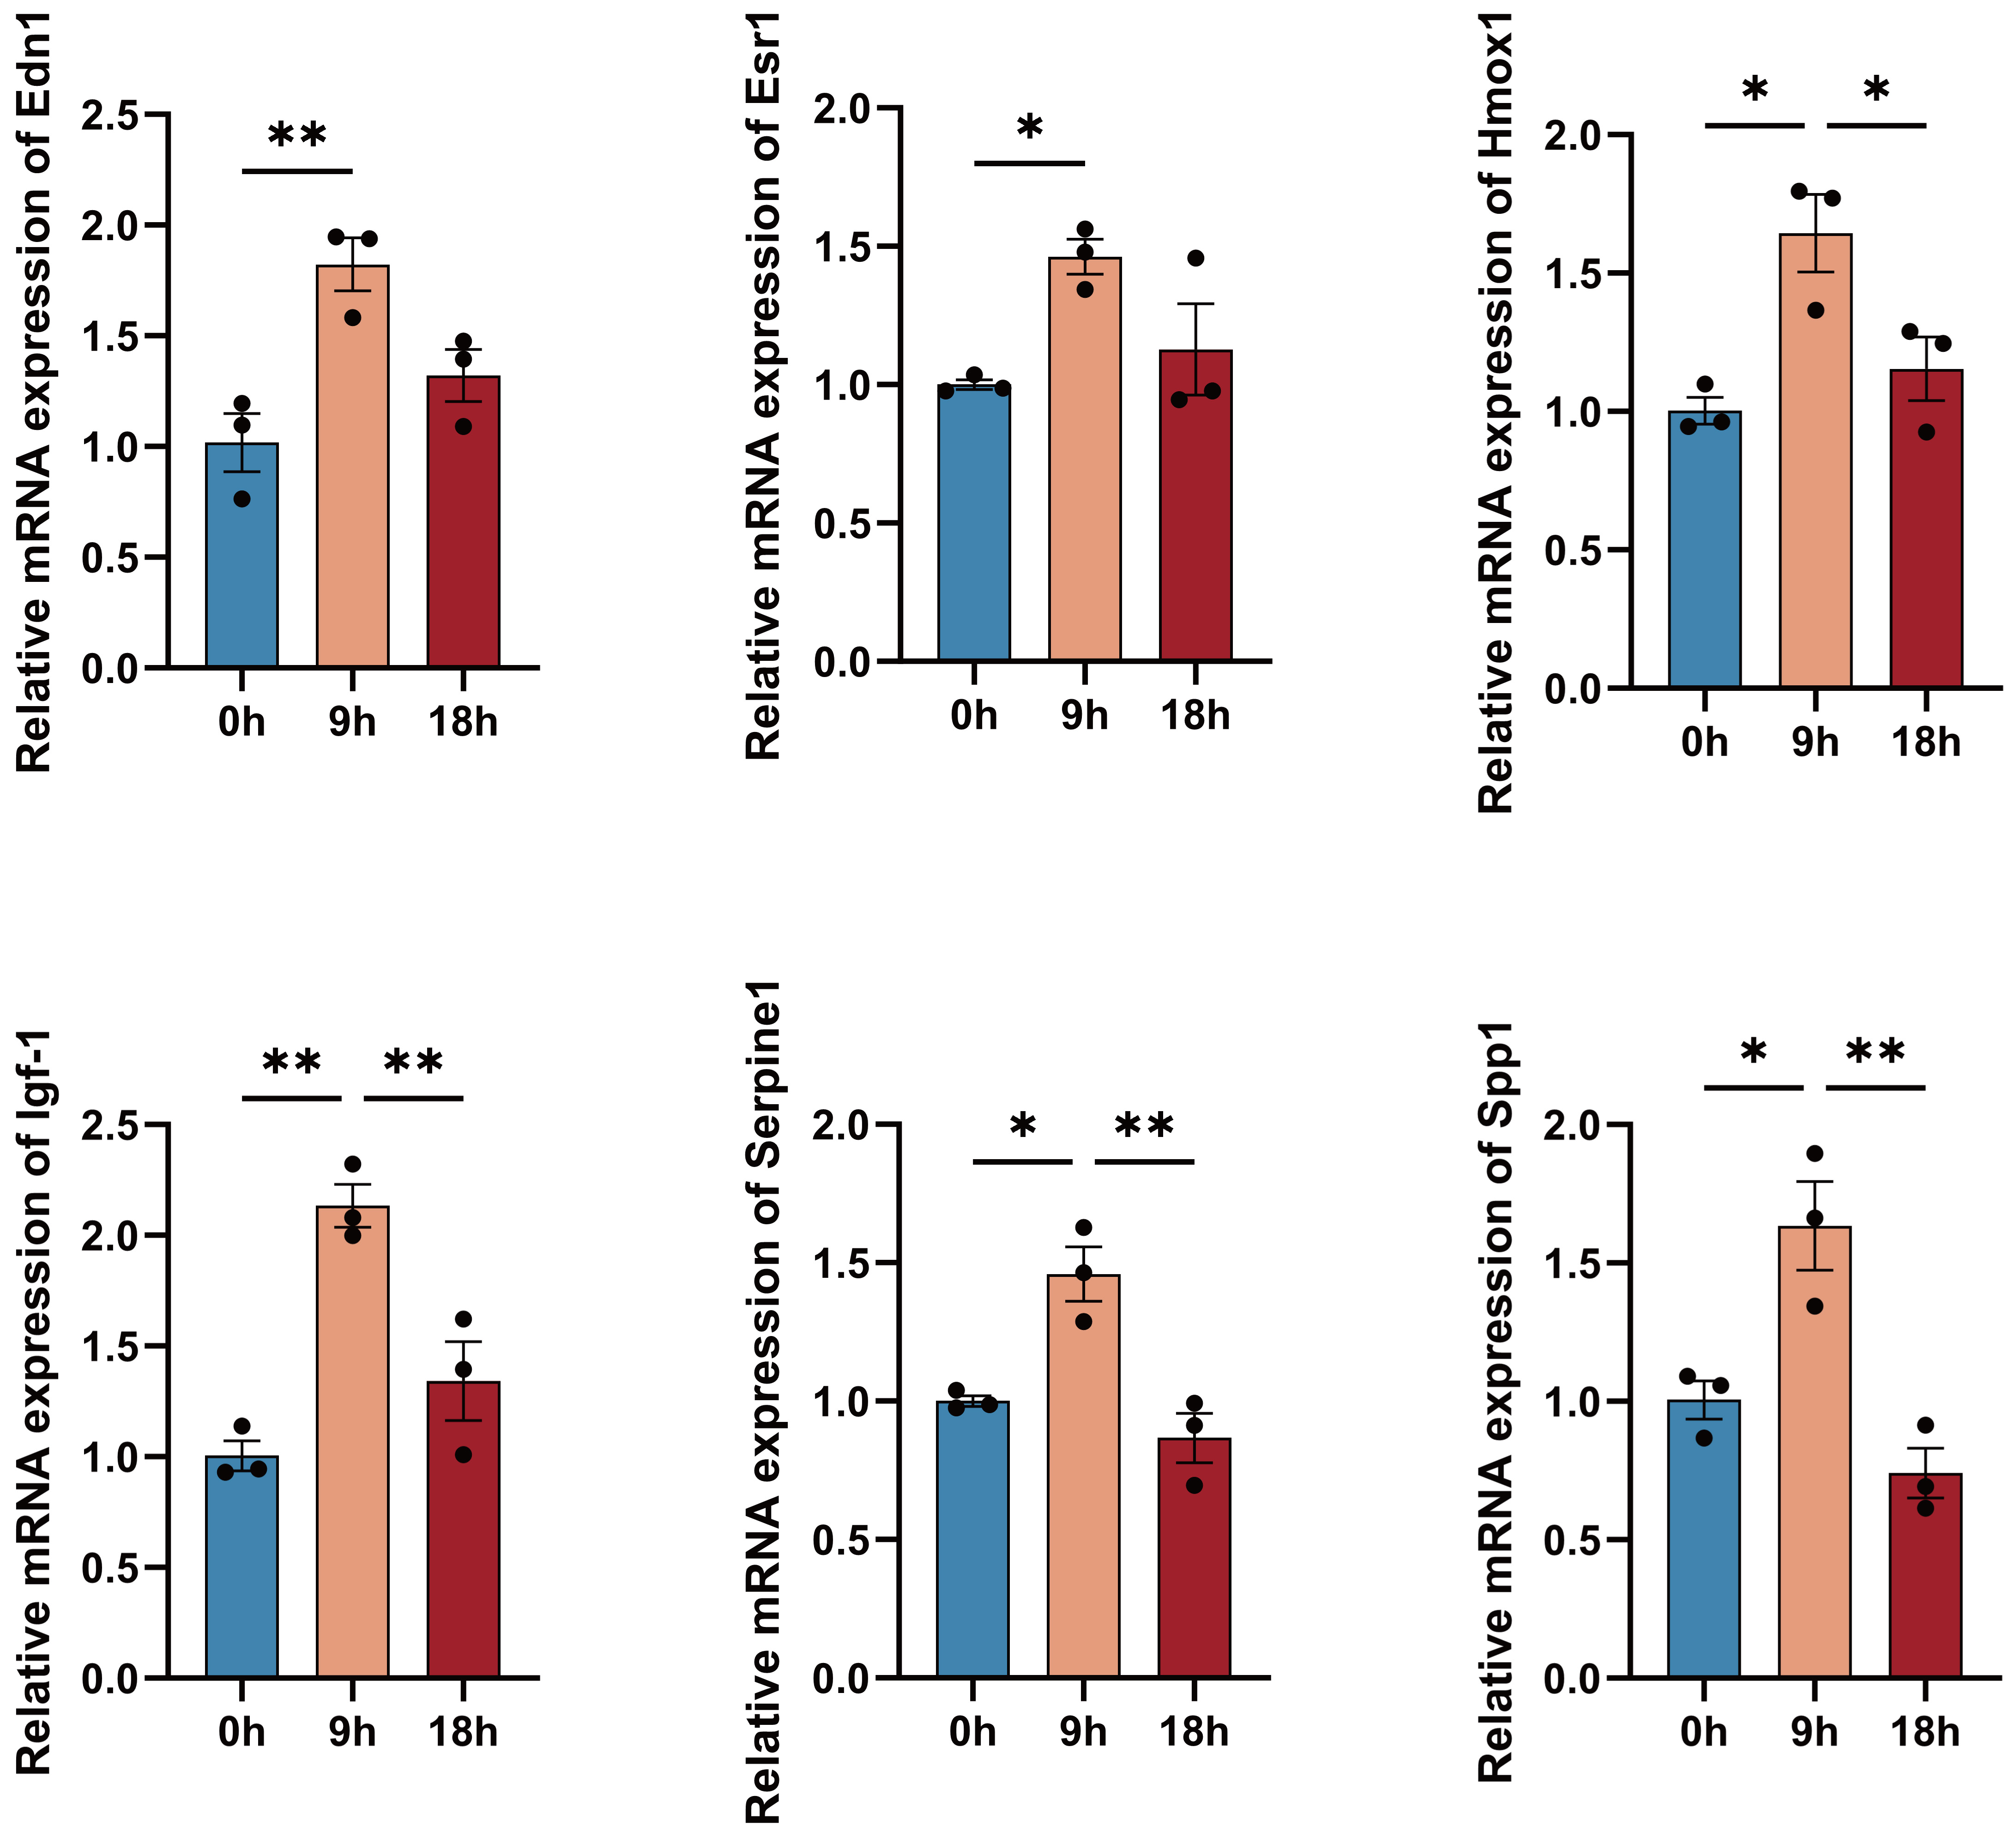 Fig. 8.
Validation of the mRNA-expression-level changes in the
reperfusion process for the 6 hub genes. 6 hub genes were identified after 2 h
of OGD that was followed by 0, 9, and 18 h of reperfusion. (Data are represented
as means
The neuronal OGD/R model effectively replicates the physiological characteristics of HIBI, serving as a robust tool for investigating the pathogenesis of nervous system pathologies and for exploring neuroprotective strategies. The severity of the initial injury can be modulated by varying the duration of OGD, and the recovery of the cells can be influenced by the length of reperfusion. In the present study, we used two OGD durations (0.5 and 2 h) to induce different degrees of injury, and three different reperfusion periods (0, 9 and 18 h). Molecular alterations observed during reperfusion exhibited consistent trends, regardless of the duration of OGD. However, substantial disparities in gene expression were evident when we compared samples exposed solely to OGD with those undergoing OGD and reperfusion. This observation underscores the notion that the reperfusion phase produces noteworthy gene-expression changes, particularly during the early stages of reperfusion. Consequently, targeting the molecular mechanisms that underlie the acute phase of reperfusion may hold promise as an effective therapeutic strategy.
We investigated the molecular changes induced by OGD/R by first focusing on the
OGD process alone. We analyzed the DEG profiles after 0.5 and 2 h of OGD, and
identified the top ten DEGs that were most highly upregulated, compared to the
control group. These DEGs included Egr1, Fosb,
Gadd45g, Jun, and Txnip. In addition, we compared the
OGD 0.5 h and OGD 2 h samples in order to explore the differences in damage
caused by different OGD durations. Since OGD 2 h was a continuation of OGD 0.5 h,
we hypothesized that the genes that were consistently elevated in both groups
might be closely related to the OGD process. Therefore, we performed a
time-series analysis and focused on two sub-gene clusters, containing 76 DEGs,
that showed a sustained increase over time. The GO and KEGG functional analyses
revealed that these DEGs were mainly enriched in those biological processes and
pathways that are related to inflammation regulation, such as the TNF-signaling
pathway, cytokine-cytokine receptor interaction, chemokine-signaling pathway,
NF-
Furthermore, we constructed a PPI network to examine the functional associations of DEGs. Among the hub genes, key members of the chemokine family, including Ccl2, Ccl5, Ccl20, Cxcl1, and Cxcl10, were identified at the core of the network. These chemokines are primarily involved in regulating the migration and activity of immune cells. Under OGD conditions, we observed an upregulation in the expression of these chemokines. This phenomenon likely reflects an enhanced recruitment of immune cells by neurons. These cells could play a dual role: facilitating the clearance and repair of damaged tissue, while simultaneously exacerbating inflammation and secondary injury. These findings underscore the pivotal role of inflammatory imbalance in the OGD process. Moreover, our results aligned with those of Shi et al. [17], who previously reported similar observations.
Due to the critical involvement of chemokines in the inflammatory response, the relationship between chemokines and HIBI has received increasing research interest [18, 19, 20]. Chemokines are a class of small, secreted proteins that are involved in a diverse range of biological functions, including chemotaxis, leukocyte migration, and inflammation [21]. Chemokines and their corresponding receptors are expressed in both neurons and glial cells within the central nervous system. Their expression has been observed to increase during a number of pathological processes, such as cerebral ischemia. Moreover, chemokines play a crucial role in the inflammatory-signal-transduction pathway that operates between neurons and glial cells, thereby constituting a significant pathological mechanism [22, 23]. Among the chemokines identified above, Ccl2 is a monocyte-chemoattractant protein (MCP), a group of Cysteine-Cysteine (CC) chemokines that can attract monocytes to damaged tissue after trauma, infection, toxin exposure, or ischemia [24]. Ccl2 and its receptor are the most studied chemokine signals in the pathological process of cerebral ischemia. It is plausible that the increase in expression observed during the acute stage could be attributed to the incidence and progression of neuroinflammation; the subsequent presence of late Ccl2 may play a role in the restoration of neural functionality. This suggests that the pathological mechanism of the Ccl2-signaling pathway is complex. However, inhibiting the activation of the Ccl2-signaling pathway, at an appropriate time, may be a therapeutic target for preventing ischemia-reperfusion injury [25, 26].
The other core genes, Jun, Atf3, and Egr2, function as early stress-response genes and are pivotal in responding to a variety of cellular stressors, including hypoxia and disruptions in energy metabolism. Typically, these genes are rapidly upregulated in response to cellular stress or damage. Specifically, Jun, a component of the Activator Protein 1 (AP-1) transcription factor, plays a crucial role in regulating cell proliferation, differentiation, and apoptosis [27]. Activating Transcription Factor 3 (Atf3) and Early Growth Response 2 (Egr2) are primarily associated with the response to stress and with neuroprotection, particularly after nerve injury [28, 29, 30]. The observed upregulation of these genes suggests that nerve cells are actively responding to the stress induced by OGD and are attempting to adapt to, or protect against, injury, through the regulation of multiple biological processes.
We then examined the reperfusion process. In the relatively acute stage (9 h), the expression patterns of 10 DEGs in the OGD 0.5 h and 2 h groups were similar, and the up-regulated DEGs mainly involved solute-carrier (SLC) family genes such as Slc3a2, Slc7a3, and Sla16a6. SLCs are a large class of membrane-transport proteins that are present in various organisms; they mediate the exchange of ions, nutrients, signaling molecules, and drugs, across biofilms [31]. The interactions between SLCs and neurons are essential for the transport of various substances, including neurotransmitters and amino acids, across neuronal membranes, thereby influencing neuronal function and neurotransmission [32, 33].
Txnip expression, in contrast to its expression trend during the OGD
process, significantly increased under the influence of the post-reperfusion
stress-response, inflammatory-response, and apoptosis-regulation pathways. This
finding aligns with existing reports in the literature [34]. Similarly, genes in
the early growth response (EGR) family exhibited opposite trends during the OGD
and reperfusion phases. The EGR family is a group of transcription factors
involved in gene regulation and cell signaling that belong to the zinc-finger
protein family. These transcription factors play key roles in a variety of
biological processes such as cell growth, differentiation, apoptosis, and stress
response. Transcription factors of the EGR family are thought to play a key role
in neuronal apoptosis, and c-Jun activation has been identified as an
important downstream target of the EGR family in this process [35]. Likewise,
there was a similar trend in the expression of the Btg2 gene. The Btg2
is thought to be a possible regulator of cell survival and differentiation, and
can help prevent cell death by inhibiting necrosis and apoptosis-signaling
pathways [36]. Furthermore, Btg2 has emerged as a crucial gene in
research focusing on renal ischemia/reperfusion injury, and has been demonstrated
to have a significant association with NF-
OGD duration was observed to have limited impact, so we opted not to differentiate between various durations of OGD when investigating alterations in the reperfusion process. Similarly, we conducted a time-series analysis of DEGs at 0, 9, and 18 h after OGD. It is well known that with the extension of reperfusion time, cells undergo a gradual self-recovery, which is also consistent with the UMAP results (Fig. 1) that indicate that the position of the samples that received 18 h of reperfusion is closer to the control group than that of the samples that received 9 h of reperfusion. Therefore, we focused on the DEGs that were initially upregulated and subsequently downregulated. In addition, we found that most of the meaningful DEGs were concentrated in gene clusters that tended to be higher and then lower, which further supported our hypothesis.
To gain insight into the biological significance of the chosen DEGs, we conducted functional annotation and pathway enrichment analyses using GO and KEGG. The analysis revealed that the DEGs primarily participate in the apoptotic process and the regulation of neuronal death. The implicated signaling pathways predominantly encompass the PI3K-Akt, HIF-1, and mTOR pathways. Additionally, other factors such as neuroactive ligand-receptor interaction and focal adhesion, are also associated with the reperfusion process. To elucidate the functional associations of DEGs, a PPI network was constructed. Among the hub genes, we found Esr1, Igf-1, Edn1, Hmox1, Serpine1 and Spp1 possibly with a higher degree of centrality.
Estrogen Receptor 1 (ESR1) also referred to as estrogen receptor alpha (ER
Edn1 is the gene that encodes the Endothelin 1 peptide (ET-1), which is a peptide that is expressed in the brain and is involved in various physiological processes, including the regulation of cerebral blood flow. It exhibits neurotransmitter characteristics in the brain [46] and its expression is affected under hypoxic conditions. In a study examining the expression of ET-1 in rats exposed to permanent hypobaric hypoxia, researchers found that the level of ET-1 decreased in the brain, which might help protect neurons by limiting the constriction of cerebral microvessels during hypoxia [47]. In addition, in a rat model of HIBI, the mRNA levels of Edn1 were highly upregulated in the ipsilateral hemisphere at 24 h post-injury [25].
Hmox1 is responsible for encoding heme oxygenase 1 (HO-1), an enzyme that plays a significant role in the catabolism of heme. HO-1 is considered an inducible enzyme, which means its expression can be increased in response to various pro-oxidant and inflammatory stimuli [48]. Moreover, HO-1 plays a protective role by being involved in antioxidant processes, reduction of inflammation, and promotion of angiogenesis. Studies have shown that modulating HO-1 activity or expression through multiple pathways can be used as a strategy to reduce brain injury and promote repair [49, 50, 51].
Serpine1 encodes the protein known as plasminogen activator inhibitor-1 (PAI-1), serves as a principal inhibitor of tissue-type plasminogen activator (PLAT). It plays a crucial role in the regulation of fibrinolysis, and is thereby responsible for the controlled degradation of blood clots [52, 53]. Studies have shown that in neonatal HIBI, there is evidence of abnormal platelet activation, accompanied by a significant increase in serum PAI-1 expression levels [54].
Spp1 encodes osteopontin (OPN), a multifunctional protein abundant in acidic phosphate, which is actively secreted and participates in various biological and pathological mechanisms. These processes include inflammation, immune responses, vascular remodeling, and bone metabolism [55]. Studies have shown that there is OPN induction in rodent brains and plasma after neonatal HIBI [56]. However, given the diverse functions and subtypes of OPN within the nervous system, additional research is needed to elucidate its multifaceted role in this complex biological system [57, 58, 59].
We examined the mRNA expression levels of the hub genes by primary hippocampal neuron culture. Overall, the results obtained through qRT-PCR were in concordance with the trends observed in the transcription data, suggesting the reliability of the transcriptome dataset.
The present study has some limitations. We only studied DEGs over reperfusion time in the relatively acute and subacute phase after OGD. The persistence of the effects of these differentially expressed molecules is yet to be demonstrated. In addition, we only focused on the neuronal part of the brain; the role of glial cells and the blood-brain barrier in brain injury remains to be investigated. Further in vivo and in vitro experiments are necessary in order to clarify the expression pattern and functionality of these crucial molecules that were demonstrated in the in vitro disease model.
In the present study, the OGD/R model, using primary hippocampal neurons, was used for RNA-seq analysis, in order to detect molecular changes during OGD and reperfusion. In addition, this study examined the different durations of OGD and reperfusion in order to identify DEGs, and performed functional analysis to identify hub genes. It is worth noting that Esr1, Igf-1, Edn1, Hmox1, Serpine1, and Spp1 genes may be key genes in the OGD/R process. Our study provides a theoretical basis for the treatment of neonatal HIBI, ischemic stroke, and other neurological disorders.
The data related to this study are available in the China National Center for Bioinformation (CNCB) database (https://www.cncb.ac.cn/) under accession number PRJCA021544.
JW, HC and LY conceptualized and designed the research study. JW and QJ conducted experiments. JW and HC analyzed the data. JW and QJ wrote the manuscript. JW and HC designed the figures. LY and HC revised the manuscript. All authors contributed to editorial changes in the manuscript. All authors read and approved the final manuscript. All authors have participated sufficiently in the work and agreed to be accountable for all aspects of the work.
The animal experiment was approved by the Experimental Animal Ethics Committee of Beijing Friendship Hospital Affiliated to Capital Medical University (approval code: 18-1010).
Not applicable.
This research was funded by National Natural Science Foundation of China, grant number 82171693 and 81771622, as well as the China Medicine Education Association, grant number 2022KTZ008.
The authors declare no conflict of interest.
References
Publisher’s Note: IMR Press stays neutral with regard to jurisdictional claims in published maps and institutional affiliations.