
†These authors contributed equally.
Academic Editor: Hongmin Wang
Background: The left primary motor area (M1) stimulation has recently
been revealed to promote post-stroke aphasia (PSA) recovery, of which a plausible
mechanism might be the semantic and/or the mirror neuron system reorganization,
but the direct evidence is still scarce. The aim of this study was to explore the
functional connectivity (FC) alterations induced by the left M1 intermittent
theta burst stimulation (iTBS), a new transcranial magnetic stimulation paradigm,
in the semantic and mirror neuron systems of PSA patients. Methods:
Sixteen PSA patients accepted the left M1 iTBS and underwent a resting-state
functional magnetic resonance image (fMRI) scanning before and immediately after
the first session of iTBS, of which six underwent another fMRI scanning after
twenty sessions of iTBS. Three brain networks covering the semantic and the
mirror neuron systems were constructed using the fMRI data, and the FC
alterations following one-session iTBS were investigated in the networks.
Additional seed-based FC analyses were conducted to explore the longitudinal FC
patterns changes during the course of multi-session iTBS. The Aphasia quotient of
the Chinese version of the western aphasia battery (WAB-AQ) was used to assess
the severity of the language impairments of the participants. The relationship
between the longitudinal WAB-AQ and network FC changes was analyzed by Spearman’s
correlation coefficients in the multi-session iTBS sub-group. Results:
Decreased FCs were noted in the bilateral semantic rather than in the mirror
neuron networks following one-session of iTBS (p
A growing number of patients are now suffering from post-stroke language impairments (i.e., post-stroke aphasia, PSA) [1, 2]. New ancillary therapeutic strategies, such as non-invasive brain stimulation (NIBS) techniques, have been suggested to promote improvement of language function in these patients and have thus attracted much attention [3, 4]. Intermittent theta burst stimulation (iTBS) is a popular new NIBS technique [3, 5, 6], which could induce excitatory effects in the stimulated brain area [7, 8]. A typical iTBS session usually takes about three minutes to apply [8], which is shorter than the classical excitatory high frequency repetitive transcranial magnetic stimulation (TMS) paradigm, and thus is easier for the patients to cooperate. In recent years, iTBS has been increasingly used for treating patients with various neurological disorders, including PSA [3, 9, 10, 11, 12, 13].
The selection of stimulation site is critical when applying NIBS, including iTBS. The classical “language areas” have been the most common stimulation sites for treating PSA, such as the Broca’s area or its right homologous area (i.e., right inferior frontal gyrus, IFG) [14, 15, 16, 17, 18, 19, 20, 21, 22, 23, 24, 25, 26]. However, the precise localization of these “language areas” often involved complex procedures, such as neuronavigation based on the individual brain magnetic resonance images (MRI) [15, 17, 18, 19, 22, 23, 24, 27, 28, 29, 30], which may be a barrier for the application of these techniques in some clinical settings. Several recent studies have reported that exciting the left primary motor area (i.e., M1) could also improve the language performance of PSA patients [31, 32], which provided a promising alternative NIBS target for treating PSA. The M1 could be easily located by neurophysiological methods [33]; furthermore, as the PSA patients often suffered from comorbid motor impairments, stimulating the M1 might also promote improvement of their motor function [13, 34, 35, 36, 37, 38, 39, 40].
It is unknown how the motor area stimulation might induce a “trans-modal” effect in the language modality. One plausible explanation is that the M1 was linked to the language system by structural and/or functional connections, and stimulating it could modulate the functional states of the language system, as has been demonstrated in healthy participants [41, 42]. This relationship between the M1 and the language system has been proposed by two popular theories: the embodied or the “hub and spoke” semantic system, which suggests the necessity of connectivity between the sensory-motor cortices and semantic “hubs” [43, 44, 45, 46] for representing concepts; and the mirror-neuron system, which is activated during passive observation of actions and has been proposed to play a key role in the comprehension of actions [47, 48, 49, 50]. These two systems are not necessarily exclusive in space and may have overlapped regions, such as the IFG or the supplementary motor area (SMA). Previous studies have reported that the ipsilesional M1 NIBS could induce functional connectivity (FC) changes among the primary and secondary motor cortices, which were parts of these two systems, in motor stroke patients [34, 51, 52, 53]. For the patients with PSA but without hemiparesis, Darkow and colleagues have demonstrated that the excitatory left M1 transcranial direct current stimulation (tDCS) could induce increased activities in the naming task related language networks of the PSA brains [54]. We have also shown in our previous study that the left M1 iTBS could induce regional functional activity and degree centrality changes in the prefrontal and posterior parietal regions in PSA patients [55]. However, to the best of our knowledge, it has not been demonstrated if, and how the overall FCs in the major semantic system [56, 57, 58, 59], as well as the mirror-neuron system, would be modulated by the left M1 iTBS.
In this study, we sought to provide preliminary evidence about potential modulatory effects of the left M1 iTBS on the semantic and mirror neuron system of PSA brains. Based on resting-state functional magnetic resonance images (rs-fMRI) [60], we constructed the classical brain semantic network, the bilateral semantic network and the action-observation network (representing the mirror neuron system) [56, 61] of sixteen PSA patients. By comparing the FC strength changes before and after the left M1 iTBS, we attempted to identify the FC change patterns in these brain networks and to explore the potential relationship between the FC changes and the participants’ longitudinal language performance improvements.
Thirty-seven consecutive PSA inpatients were screened from October 2020 to May 2021, in the rehabilitation department of the Jing’an Branch of Huashan Hospital of Fudan University, a tertiary care teaching hospital in Shanghai. Nineteen patients were enrolled according to the following inclusion criteria: (1) age more than 18 years old; (2) native Chinese speakers; (3) clinically diagnosed as ischemic or hemorrhagic stroke confirmed with brain images; (4) be able to follow instructions in order to cooperate with the assessments and study treatments; (5) diagnosed as aphasia according to clinical assessments and the Chinese version of the western aphasia battery (WAB) (aphasia quotient below 93.8). The exclusion criteria were: (1) a previous stroke history; (2) severe and uncontrolled psychiatric disorders; (3) uncontrolled epilepsy, (4) other neurological disorders that might interfere with the post-stroke functional impairments; (5) brain tumor(s) or brain injury history; (6) unstable vital signs, or severe organ failure; (7) any metal implant or device in the body, or any other condition that would restrict the application of iTBS or MRI scanning. The age and time from onset of stroke were comparable between the recruited participants and those patients who did not meet the above inclusion and exclusion criteria, while the mean aphasia quotient (AQ) of WAB and educational level were higher in the included patients compared with those that were not included. Three participants’ brain MRI data were excluded from the analyses because of excess head motion; thus, sixteen participants were included in the final analyses. All the recruited participants were right-handed native Chinese speakers.
The flowchart of the participants and the analyses is shown in Fig. 1. This study adopted a within group longitudinal design, without a control group. After the recruitment, each participant underwent baseline behavioral assessments, as well as the single TMS tests for identifying the resting motor threshold (RMT) and the hot spot of the hand area in the left M1. Then, the fMRI scanning was applied for each participant, before and immediately after the first session of iTBS, respectively. Each participant also underwent structural MRI scanning before the first iTBS session. Then the participants continued to undergo daily iTBS until being discharged from the hospital, or until twenty iTBS sessions were completed. Ten of the nineteen participants completed twenty sessions of iTBS treatments during their hospital stay and underwent another structural MRI and fMRI scanning and behavioral assessments after the twentieth session of iTBS. After excluding the brain images not eligible for analyses (due to artifacts or excessive head motion), the MRI data of sixteen participants were included for one-session iTBS effect analyses (step 1), and the data from six participants were included for multiple-session iTBS effect analyses (step 2). During the study, all the participants also underwent the conventional rehabilitation treatments in addition to the iTBS. Our previous study has reported other analyses based on the one-session data of the same group of participants [55].
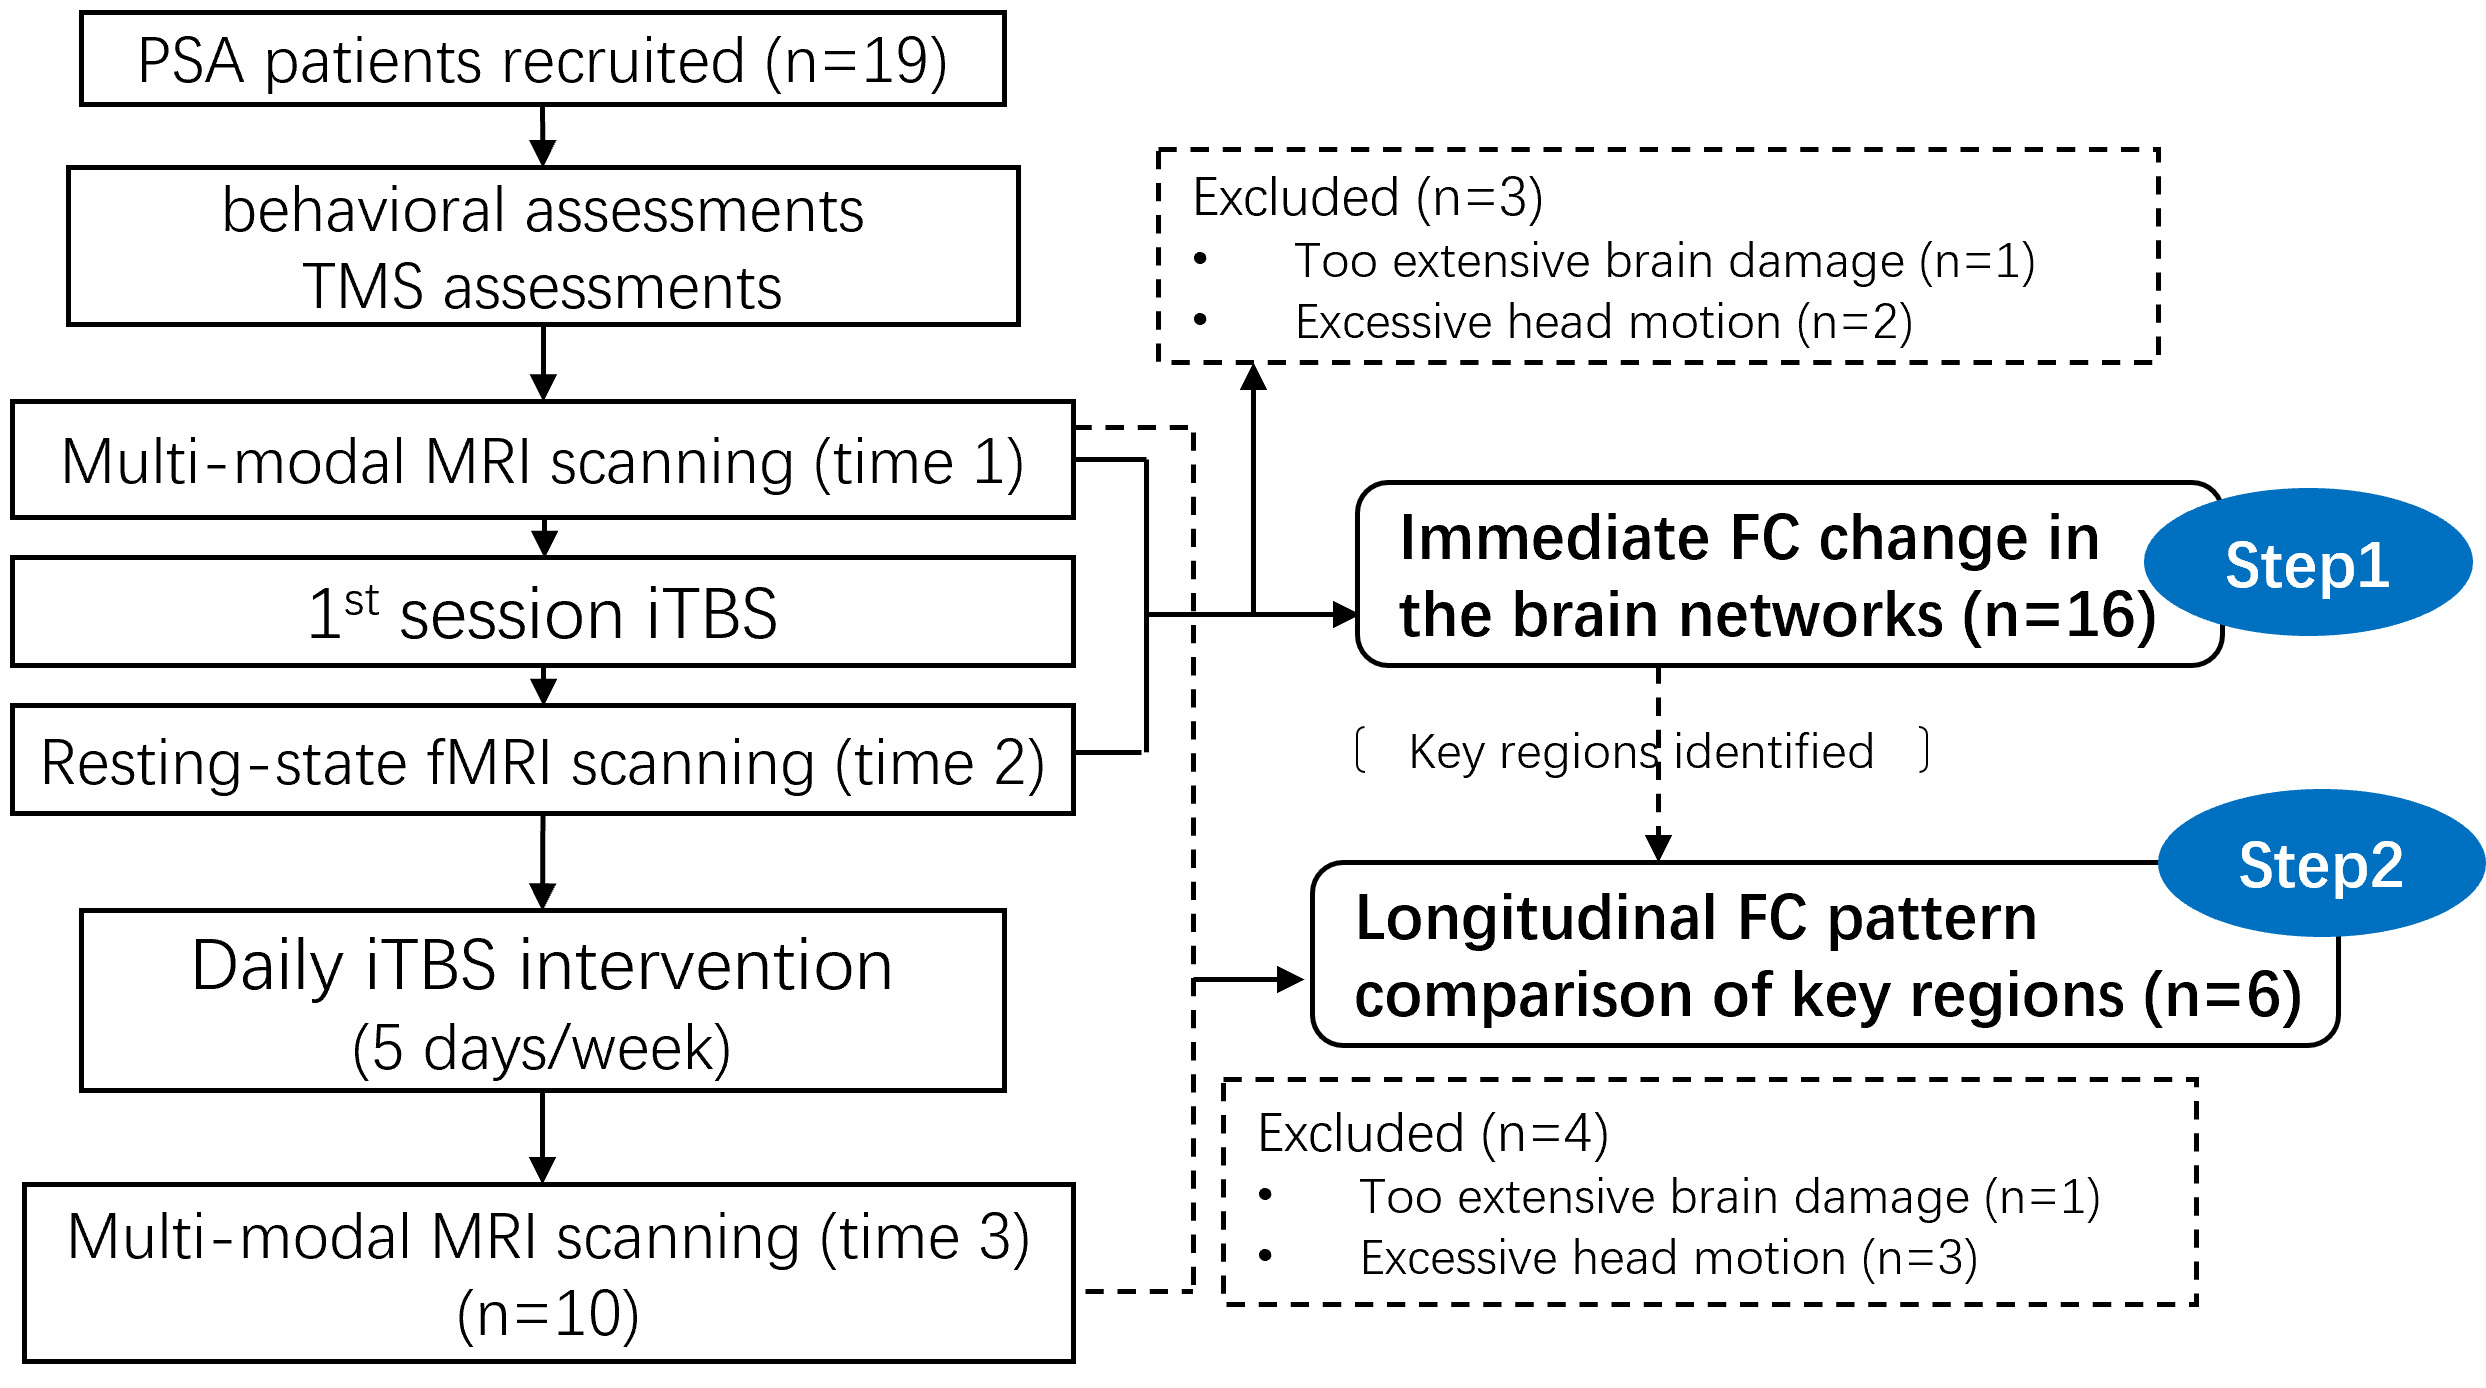 Fig. 1.
Participants and analyses flowchart. Abbreviations: PSA, post-stroke aphasia; TMS, transcranial magnetic stimulation; (f) MRI, (functional) magnetic resonance imaging; iTBS, intermittent theta burst stimulation; FC, functional connectivity.
This study was approved by the ethical committee of Huashan Hospital, Fudan University. Written informed consents were acquired from all the participants or their legal representative(s). The trial was registered on the Chinese Clinical Trial Registry website (http://www.chictr.org.cn/index.aspx), and the registration number is ChiCTR2100041936.
Standardized scales were used to assess the language, cognitive and motor performances, as well as activities of daily living of each participant. The Chinese version of WAB was used for language performance assessment, and an aphasia quotient (AQ) was calculated to measure the severity of aphasia for each participant. The non-language-based cognitive assessment (NLCA) was used to measure the potential cognitive impairments of the participants, and the Fugl–Meyer motor assessment–upper extremity (FMA-UE) was used to assess the severity of the motor deficits of the participants. The Barthel Index (BI) was used to measure the participant’s activities of daily living. The details of these assessments are described in our previous study [55].
We used the MagPro X100 magnetic stimulator (Medtronic Co, Copenhagen, Denmark)
with a figure-eight coil (MC-B70) to apply the iTBS intervention. Before the
first session of iTBS, the RMT was measured for each participant as follows:
first, surface electrodes were attached to the abductor pollicis brevis muscle of
the participant’s right hand (i.e., the hemiplegic hand) [33, 55]; then the
location of the hot spot of the hand area was identified by recording the
magnitudes of motor evoked potentials (MEP) when stimulating the left M1 by
single pulse TMS. Next, the RMT of the left M1 was identified by stimulating the
hot spot with stepwise increasing intensities of single pulse TMS, until the
minimum intensity that could induce at least five MEPs of no less than 50
All the participants underwent a multimodal MR scanning prior to the first iTBS session, including the T1-weighted, T2-weighted, rs-fMRI and diffusion tensor image scans. The rs-fMRI scanning was again applied immediately after the first iTBS session for each participant. The participants who completed twenty sessions of iTBS underwent another multimodal MRI scanning after the twentieth iTBS session. A 3.0T GE MR750 scanner was used for MRI scanning at the Jingan Branch of Huashan Hospital, Fudan University. These analyses were based on the rs-fMRI data, and the T1-weighted images were used for lesion identification and rs-fMRI normalization.
The T1-weighted images were acquired using 3D FSPGR sequence with the following
parameters: matrix size = 260
The rs-fMRI images were acquired in the horizontal plane by EPI echo-planar
imaging with the following parameters: TR = 2000 ms, TE = 30 ms, inclination =
90°, matrix size = 96
Each participant’s lesion was manually segmented using ITK-SNAP tools [62] on the individual T1-weighted structural images, and then registered to the Montreal Neurological Institution (MNI) space using spm12 (https://www.fil.ion.ucl.ac.uk/spm/). The group-level voxel-wise map of the lesions were created by summing up all the individual lesions, which are shown in Fig. 2.
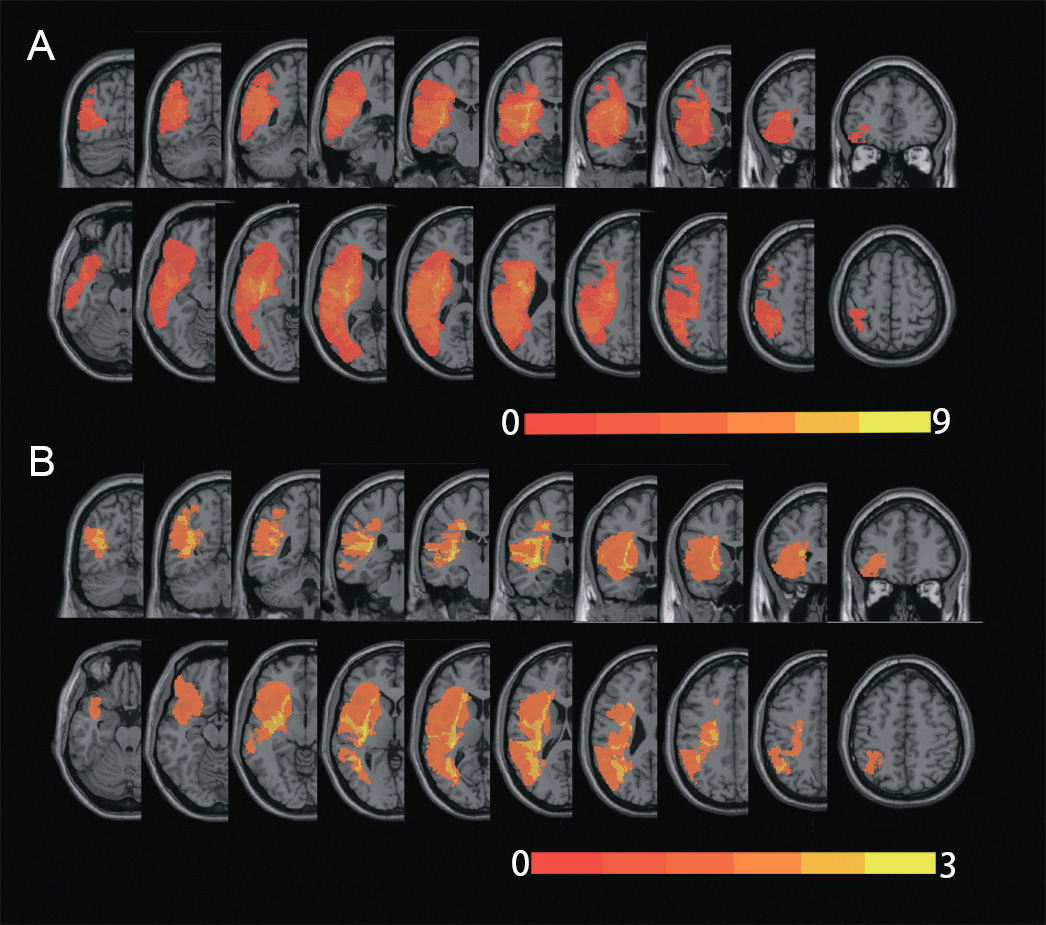 Fig. 2.
Lesions’ location of the participants. The overlapped lesion map of the sixteen participants (A) with post-stroke aphasia (PSA) who underwent at least one session of intermittent theta burst stimulation (iTBS), and of the six participants (B) who underwent twenty sessions of iTBS treatment. The color scales represented the number of individual lesions overlapped.
The preprocessing of the rs-fMRI data followed conventional procedures: (1)
discarding the first 10 volumes of the 240 volumes; (2) slice timing for
systematic time shift; (3) head motion correction using Friston 24 parameters
[63, 64]; (4) image reorientation for better normalization; (5) normalizing to
the MNI space using unified segmentation on T1-weighted images, and being
resliced into 3 mm
We performed two-step FC analyses (Fig. 1). In the first step, we attempted to reveal the functional connections (i.e., edges) that exhibited significant FC strength alteration following one session of iTBS, in the brain networks of the semantic and mirror-neuron systems, respectively. The nodes connected with the most altered connections were thus identified in each of the networks, which were then defined as seeds in the second step analyses. The second step analyses were applied in the sub-group of six participants who underwent twenty sessions of iTBS. The voxel-wise seed-based FC map in the whole brain gray matter was then calculated by correlational manner, before (time 1), immediately after (time 2) the first session of iTBS, and after the twenty iTBS sessions (time 3), respectively. Then the trends in longitudinal FC patterns’ were observed for these seeds. The details of the analyses are described below.
To investigate the immediate FC modulation effects of the left M1 iTBS in the semantic and mirror neuron system, we constructed three functional networks in the PSA brain, based on the previously reported locations of these two systems [56, 67]. A brain network comprises two types of elements, which are the key regions (i.e., node) in the system, and the functional relationship between each pair of nodes (i.e., edges) [68]. The locations of the nodes in each network (shown in Figs. 3,4) were defined as follows:
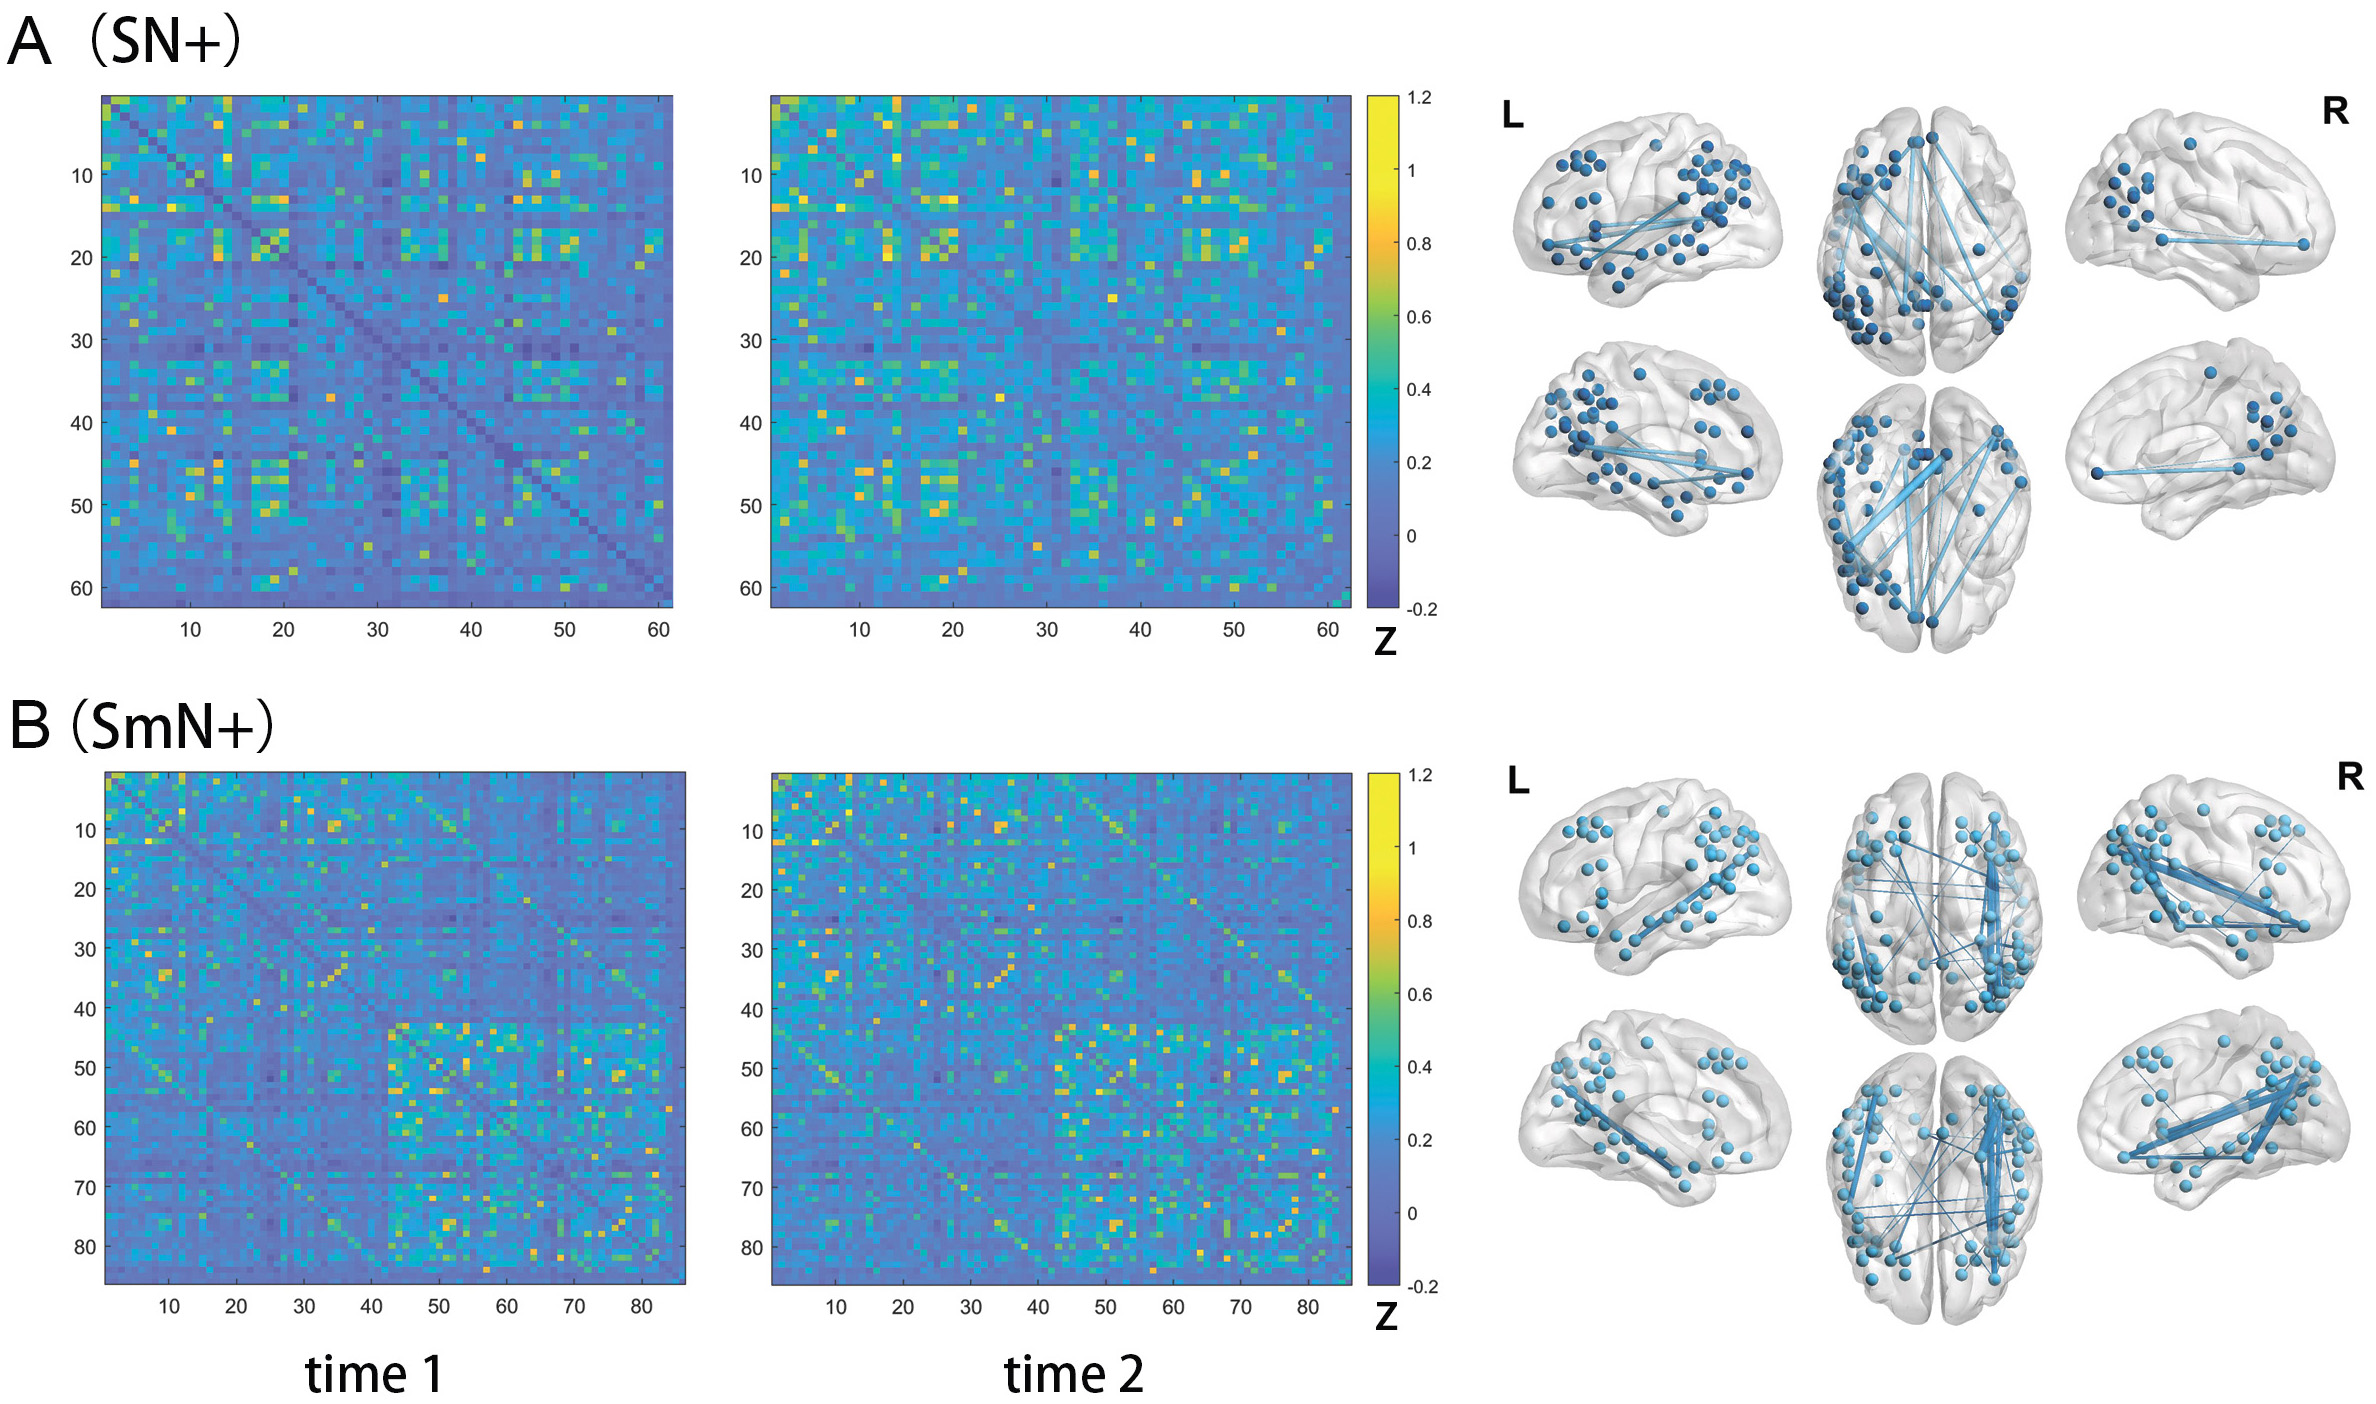 Fig. 3.
Edges showing functional connectivity (FC) strength changes following one-session left M1 iTBS in the SN+ (A) and SmN+ (B). The matrices in the left two columns illustrated the mean FC strengths of the edges in the SN+ (A) and SmN+ (B), before (time 1) and immediately after (time 2) the first session of left M1 iTBS, in the sixteen PSA participants. The two figures in the right column illustrated the locations of the nodes (spheres) in the SN+ (A) and SmN+ (B), and the edges (sticks) exhibiting significant FC strength changes after the iTBS in these two networks, respectively. The color bars indicated the mean FC strength of each edge. The color bars indicated the mean Fisher’s z scores of each edge in the PSA participants. Abbreviations: SN+, semantic network (plus the two M1 nodes); SmN+, semantic and mirrored network (plus he two M1 nodes); L, left; R, right.
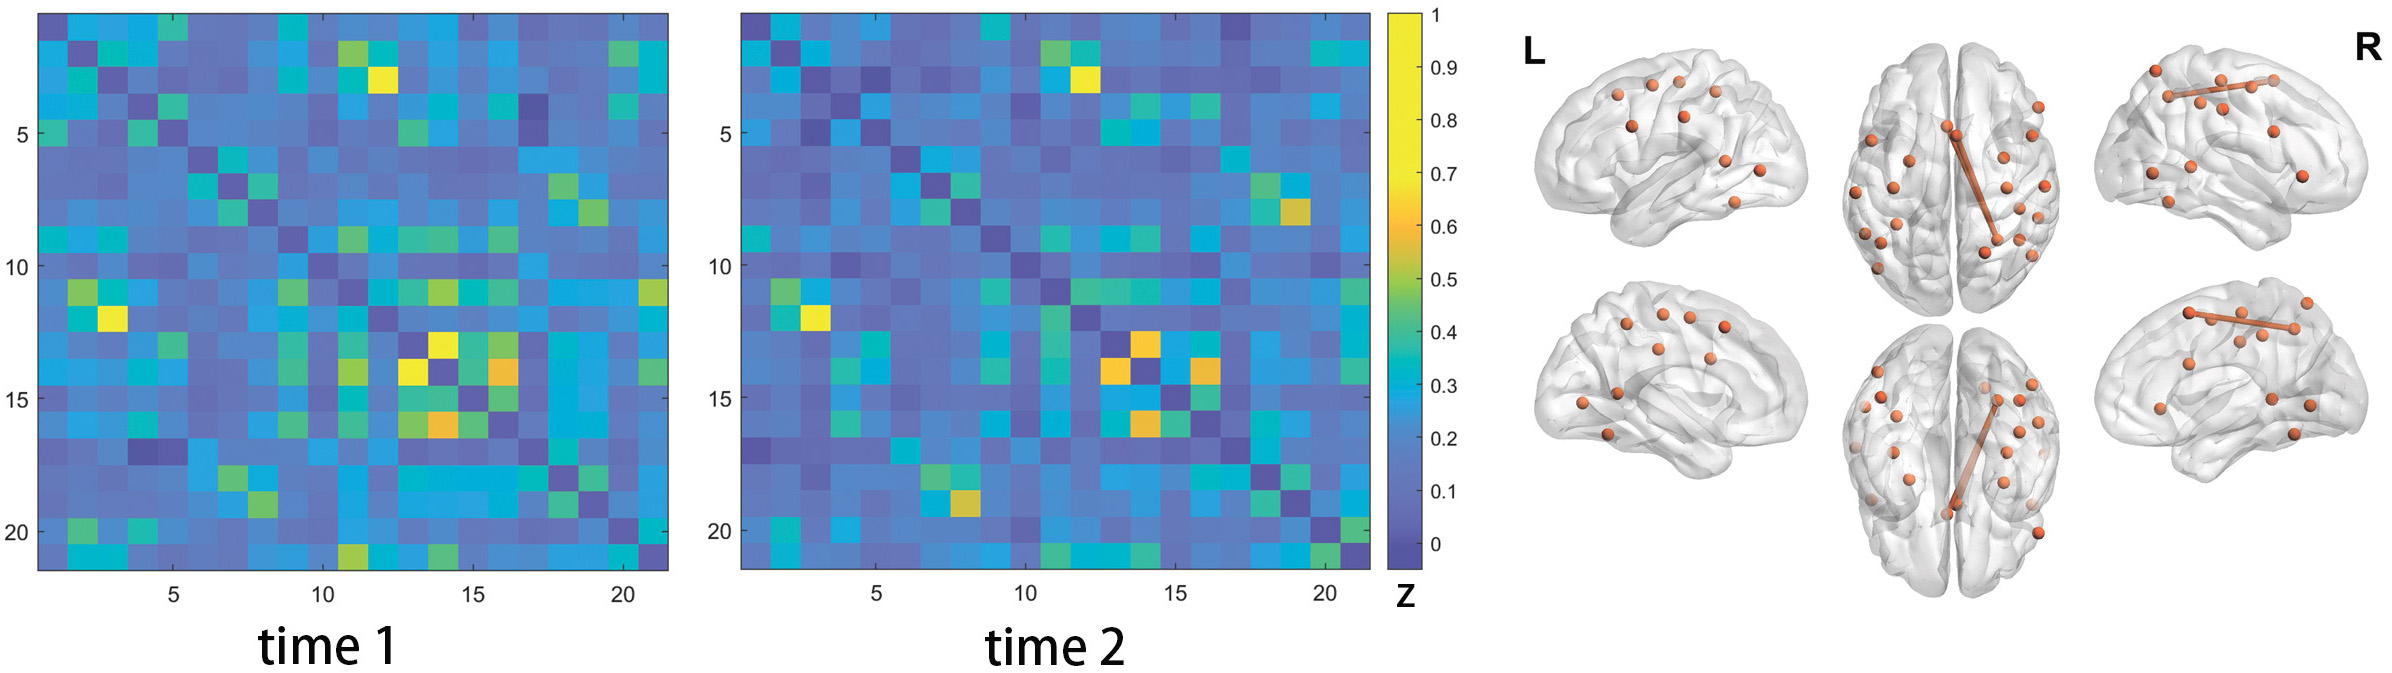 Fig. 4.
Edges showing functional connectivity (FC) strength changes following one-session left M1 iTBS in the AoN+. The left two matrices illustrated the mean FC strength of the edges in the AoN+ before (time 1) and immediately after (time 2) the first session of left M1 iTBS, in the sixteen PSA participants. The figure on the right illustrated the locations of the nodes (spheres) in the AoN+, together with the edges (sticks) exhibiting marginally significant FC strength changes after the iTBS treatment. The color bar indicated the mean FC strength of each edge. The color bar indicated the mean Fisher’s z scores of each edge in the PSA participants. Abbreviations: AoN+, action observation network (plus the two M1 nodes); L, left; R, right.
• Semantic network (SN+)
Sixty nodes comprised in this network were defined according to the template reported by Xu and colleagues [69], which was based on the peaks of the activation likelihood estimate (ALE) map reported in a meta-analysis by Binder and colleagues [56]. These nodes represented the brain regions activated in the general semantic tasks [56]. Each node was built as a 6mm-radius sphere around the peak voxels according to the MNI coordinates reported by Xu and colleagues [69]. The 61st and 62nd nodes were built to represent the hand areas of the left and right M1, respectively, representing the iTBS stimulation site and its right homologous region. The MNI coordinates of these two nodes were identified according to the study by Alkadhi and colleagues [30].
• Semantic and mirrored network (SmN+)
While the semantic network identified in the healthy adults exhibited prominent left lateralization, previous studies have revealed a right hemispheric reorganization of the language network in the patients with PSA [70, 71, 72, 73]. Considering this potential right hemispheric reorganization of the language system, we included the contralateral mirrored nodes of the above semantic network into the original SN+, and after excluding eighteen nodes in the SN+ next to the midline, which involved overlapping voxels between the original and mirror nodes, a semantic and mirrored network (SmN+) comprising 86 nodes were constructed. The two nodes representing the left and right M1 areas were included in this SmN+.
• Action observation network (AoN+)
The AoN+ was constructed to represent the location of the mirror neuron system in the PSA brains. The spheric nodes were built in the same way as described above, around the MNI coordinates reported in the ALE meta-analyses conducted by Caspers and colleagues [67], as the peaks activation of the “action observation” tasks.
• Edges
After locating the above nodes, the edges were defined by a correlation manner in each of the networks, respectively. Specifically, the Pearson’s correlation coefficient was calculated between the rs-fMRI signal courses of each pair of nodes, which lasted for 460s after removing the first ten volumes in the preprocessing procedures. Then each correlation coefficient was Fisher-z transformed to get approximately normally distributed data [74], which was defined as the strength of the edge.
After constructing each individual network, we then compared the FC strength of
each edge before and after the first iTBS session by paired sample t
test at group level, in each of the networks, respectively. The statistical
significance level was defined as individual edge p
Based on the results of the first step, we identified the nodes connected with
the most altered edges in each network, which was considered as the potential
reorganizational centers in the semantic and/or mirror neuron systems following
iTBS in the PSA brains. Then, in the sub-group of six participants who completed
the twenty sessions of iTBS, we sought to observe the longitudinal FC pattens’
changes of these nodes, along the iTBS treatment course. These nodes were
identified as seeds, then the Fisher-z transformed Pearson’s correlation
coefficients were calculated between the mean rs-fMRI signal course of each seed
and that of each voxel in the whole brain gray matter mask [77], resulting in
each individual whole-brain voxel-wise seed-based FC map, at before (time 1)
after (time 2) the first iTBS session, as well as after the twenty iTBS sessions
(time 3), respectively. A group-level one sample t test was then used to
identify the FC pattern of each seed at each time point, respectively, with the
multiple comparisons corrected by the threshold-free cluster enhancement (TFCE)
technique (p
In the subgroup of participants who underwent twenty sessions of iTBS, we assessed the potential relationship between their aphasia severities and the FC strength changes of each of the three networks, respectively. One FC metric was calculated for each network at time 1 and time 3, respectively, by averaging the FC strength of all the edges which exhibited significant FC changes following one session iTBS (as revealed in step 1), respectively. Then the spearman’s correlation analyses were used to assess the relationships between the WAB-AQ change (from time 1 to time 3) and each of the network FC metric changes (from time 1 to time 3), respectively.
The demographic and clinical information of the sixteen participants (mean
| Demographic variables | One-session group | Multi-session group |
|---|---|---|
| (n = 16) | (n = 6) | |
| Gender, male: female ration | 12:4 | 5:1 |
| Age, mean (range, SD) | 55.56 (40–70, 11.00) | 53.00 (41–68, 12.26) |
| Education year, mean (range, SD) | 12.56 (9–16, 2.42) | 13.00 (12–15, 1.55) |
| Type of Stroke (ischemic: hemorrhagic) | 12:4 | 4:2 |
| Time-post stroke onset: mean months (range, SD) | 5.13 (2–9, 2.01) | 5.50 (3–8, 1.64) |
| Lesion volume, mm |
28596 (122–106822, 34597) | 29701 (5923–77730, 26568) |
| WAB-AQ (time 1) | 69.99 (3–95.8, 28.09) | 82.3 (65.7–95, 10.37) |
| WAB-AQ (time 2) | N/A | 87.88 (71.8–96.8, 8.64) |
| Aphasia type (type: number) | anomic: 8, Broca: 4, transcortical motor: 2, Wernicke: 1, Global: 1 | |
| NLCA (time 1) | 57.06 (5–79, 21.67) | 61.67 (45–79, 13.74) |
| NLCA (time 2) | N/A | 68.5 (48–80, 11.06) |
| FMA-UE (time 1) | 27.81 (7–66, 17.26) | 31.67 (8–66, 22.06) |
| FMA-UE (time 2) | N/A | 39.83 (23–66, 16.79) |
| BI (time 1) | 61.56 (10–100, 24.88) | 66.67 (45–100,21.37) |
| BI (time 2) | N/A | 75 (50–100,17.89) |
| WAB-AQ, Chinese version of western aphasia battery – aphasia quotient; NLCA, non-language cognitive assessment; FMA-UE, Fugl-Meyer motor assessment – upper extremity; BI, Bathel Index; SD, standard deviation. | ||
• SN+
Twelve edges in the SN+ were found to exhibit significantly decreased FC
strength immediately following one session of left M1 iTBS, tested by paired
sample t test (p
| Edge No. | Center of node 1 | Center of node 2 | t value | ||||||
| MNI coordinate | Anatomical label | MNI coordinate | Anatomical label | ||||||
| x | y | z | x | y | z | ||||
| 1 | –45 | 30 | –9 | l- inferior frontal gyrus, orbital part | 48 | –72 | 21 | r- middle temporal gyrus | –3.78 |
| 2 | –57 | –51 | 30 | l- supramarginal gyrus | –54 | –39 | 24 | l- superior temporal gyrus | –3.52 |
| 3 | –39 | 24 | –18 | l- inferior frontal gyrus, orbital part | –54 | –39 | 24 | l-superior temporal gyrus | –3.79 |
| 4 | –39 | 24 | –18 | l- inferior frontal gyrus, orbital part | –39 | 24 | –18 | l- inferior frontal gyrus, orbital part | –3.34 |
| 5 | –57 | –12 | –12 | l- middle temporal gyrus | –6 | 48 | –6 | l-middle frontal gyrus, orbital part | –3.78 |
| 6 | –6 | 48 | –6 | l- middle frontal gyrus, orbital part | –12 | –60 | 12 | l- calcarine cortex | –3.93 |
| 7 | –6 | 48 | –6 | l- middle frontal gyrus, orbital part | –39 | 24 | –18 | l- inferior frontal gyrus, orbital part | –3.36 |
| 8 | –6 | 48 | –6 | l- middle frontal gyrus, orbital part | 48 | –72 | 21 | r- middle temporal gyrus | –3.78 |
| 9 | –48 | 18 | 6 | l- inferior frontal gyrus, triangular part | –12 | –60 | 12 | l- calcarine cortex | –3.79 |
| 10 | 63 | –39 | –3 | r- middle temporal gyrus | 6 | 51 | –6 | r-middle frontal gyrus, orbital part | –3.85 |
| 11 | 6 | 51 | –6 | r- middle frontal gyrus orbital part | –39 | 24 | –18 | l- inferior frontal gyrus, orbital part | –3.37 |
| 12 | –39 | 24 | –18 | l- inferior frontal gyrus, orbital part | –48 | 3 | –33 | l- inferior temporal gyrus | –4.56 |
| l, left; r, right. | |||||||||
| Node No. | MNI coordinate | Anatomical label | Brodmann Area | Total changed edges | ||
| x | y | z | ||||
| 6 | –45 | 30 | –9 | l inferior frontal gyrus, orbital part | l- BA47 | 1 |
| 22 | –57 | –51 | 30 | l- supramarginal gyrus | l- BA40 | 1 |
| 23 | –39 | 24 | –18 | l- inferior frontal gyrus, orbital part | l- BA38 | 2 |
| 24 | –57 | –12 | –12 | l- middle temporal gyrus | l- BA21 | 1 |
| 25 | –6 | 48 | –6 | l- middle frontal gyrus, orbital part | l- BA10 | 4 |
| 27 | –48 | 18 | 6 | l- inferior frontal gyrus, triangular part | l- BA45 | 1 |
| 28 | –12 | –60 | 12 | l- Calcarine cortex | l- BA17 | 2 |
| 31 | –54 | –39 | 24 | l- superior temporal gyrus | l- BA48 | 2 |
| 34 | 63 | –39 | –3 | r- middle temporal gyrus | r- BA21 | 1 |
| 37 | 6 | 51 | –6 | r- middle frontal gyrus, orbital part | r- BA10 | 2 |
| 43 | –39 | 24 | –18 | l- inferior frontal gyrus, orbital part | r- BA17 | 4 |
| 57 | –48 | 3 | –33 | l- inferior temporal gyrus | l- BA20 | 1 |
| 60 | 48 | –72 | 21 | r- middle temporal gyrus | r- BA39 | 2 |
| l, left; r, right. | ||||||
• SmN+
In the SmN+, the FC strengths of 24 edges were found to decrease significantly
after one session of left M1 iTBS, tested by paired sample t test
(p
| Edge No. | Center of node 1 | Center of node 1 | t value | ||||||
| MNI coordinate | Anatomical label | MNI coordinate | Anatomical label | ||||||
| x | y | z | x | y | z | ||||
| 1 | –45 | 30 | –9 | l- inferior frontal gyrus, orbital part | 45 | –69 | 27 | r-angular gyrus | –3.40 |
| 2 | –45 | 30 | –9 | l- inferior frontal gyrus, orbital part | 36 | –78 | 33 | r-middle occipital gyrus | –3.32 |
| 3 | –36 | –78 | 33 | l- middle occipital gyrus | –54 | –3 | –24 | l-middle temporal gyrus | –4.44 |
| 4 | –27 | 30 | 45 | l-middle frontal gyrus | 6 | –51 | 33 | r- posterior cingulate gyrus | –3.67 |
| 5 | –27 | 30 | 45 | l- middle frontal gyrus | 54 | –3 | –24 | r-middle temporal gyrus | –3.65 |
| 6 | –42 | –69 | 39 | l- angular gyrus | 39 | 42 | –15 | r- inferior frontal gyrus, orbital part | –3.37 |
| 7 | –6 | –51 | 33 | l- posterior cingulate gyrus | 30 | –36 | –15 | r- fusiform gyrus | –3.51 |
| 8 | –6 | –51 | 33 | l- posterior cingulate gyrus | 54 | –45 | 39 | r- inferior parietal lobule | –3.29 |
| 9 | –54 | –3 | –24 | l- middle temporal gyrus | 57 | –12 | –12 | r- middle temporal gyrus | –3.45 |
| 10 | –48 | 3 | –33 | l- inferior temporal gyrus | 54 | –3 | –24 | r- middle temporal gyrus | –3.48 |
| 11 | 45 | –69 | 27 | r- angular gyrus | 60 | –42 | –3 | r- middle temporal gyrus | –3.61 |
| 12 | 45 | –69 | 27 | r- angular gyrus | 36 | 18 | 0 | r- insula | –3.47 |
| 13 | 45 | –69 | 27 | r- angular gyrus | 39 | 42 | –15 | r- inferior frontal gyrus, orbital part | –3.39 |
| 14 | 48 | –57 | 30 | r- angular gyrus | 30 | –36 | –15 | r- fusiform gyrus | –3.96 |
| 15 | 60 | –42 | –3 | r- middle temporal gyrus | 30 | –36 | –15 | r- fusiform gyrus | –3.75 |
| 16 | 36 | –78 | 33 | r- middle occipital gyrus | 42 | –69 | 39 | r- angular gyrus | –3.58 |
| 17 | 36 | –78 | 33 | r- middle occipital gyrus | 39 | 42 | –15 | r- inferior frontal gyrus, orbital part | –4.26 |
| 18 | 36 | –78 | 33 | r- middle occipital gyrus | 54 | –3 | –24 | r- middle temporal gyrus | –4.40 |
| 19 | 36 | –78 | 33 | r- middle occipital gyrus | 36 | –60 | 45 | r- inferior parietal lobule | –3.38 |
| 20 | 18 | 39 | 45 | r- superior frontal gyrus | 57 | –12 | –12 | r- middle temporal gyrus | –3.33 |
| 21 | 42 | –69 | 39 | r- angular gyrus | 30 | –36 | –15 | r- fusiform gyrus | –5.25 |
| 22 | 42 | –69 | 39 | r- angular gyrus | 39 | 42 | –15 | r- inferior frontal gyrus, orbital part | –4.02 |
| 23 | 30 | –36 | –15 | r- fusiform gyrus | 39 | 42 | –15 | r- inferior frontal gyrus, orbital part | –3.84 |
| 24 | 57 | –12 | –12 | r-middle temporal gyrus | 39 | 42 | –15 | r- inferior frontal gyrus, orbital part | –3.36 |
| l, left; r, right. | |||||||||
| No. | MNI coordinate | Anatomical label | Brodmann area | Total changed edges | ||
| x | y | z | ||||
| 5 | –45 | 30 | –9 | l- inferior frontal gyrus, orbital part | l- BA47 | 2 |
| 8 | –36 | –78 | 33 | l- middle occipital gyrus | l- BA19 | 1 |
| 9 | –27 | 30 | 45 | l- middle frontal gyrus | l- BA9 | 2 |
| 12 | –42 | –69 | 39 | l- angular gyrus | l- BA19 | 1 |
| 15 | –6 | –51 | 33 | l-posterior cingulate gyrus | l- BA23 | 2 |
| 30 | –54 | –3 | –24 | l- middle temporal gyrus | l- BA21 | 2 |
| 41 | –48 | 3 | –33 | l- inferior temporal gyrus | l- BA20 | 1 |
| 43 | 45 | –69 | 27 | r- angular gyrus | r- BA39 | 4 |
| 44 | 48 | –57 | 30 | r- angular gyrus | r- BA39 | 1 |
| 46 | 60 | –42 | –3 | r-middle temporal gyrus | r- BA21 | 2 |
| 50 | 36 | –78 | 33 | r- middle occipital gyrus | r- BA19 | 5 |
| 52 | 18 | 39 | 45 | r- superior frontal gyrus | r- BA9_ | 1 |
| 54 | 42 | –69 | 39 | r- angular gyrus | r- BA19 | 3 |
| 55 | 30 | –36 | –15 | r- fusiform gyrus | r- BA37 | 5 |
| 57 | 6 | –51 | 33 | r- posterior cingulate gyrus | r- BA23 | 1 |
| 61 | 57 | –12 | –12 | r- middle temporal gyrus | r- BA21 | 3 |
| 70 | 36 | 18 | 0 | r- insula | r- BA48 | 2 |
| 71 | 39 | 42 | –15 | r- inferior frontal gyrus, orbital part | r- BA47 | 6 |
| 72 | 54 | –3 | –24 | r- middle temporal gyrus | r- BA21 | 3 |
| 75 | 54 | –45 | 39 | r- inferior parietal lobule | r- BA40 | 1 |
| l, left; r, right. | ||||||
• AoN+
In the AoN+, no edge showed significant FC change after one session of left M1
iTBS. Two edges were revealed to exhibit marginally significant decreased FC
strength after the iTBS session, tested by paired two sample t test
(individual edge p
| Edge No. | Center of node 1 | Center of node 2 | t value | ||||||
| MNI coordinate | Anatomical label | MNI coordinate | Anatomical label | ||||||
| x | y | z | x | y | z | ||||
| 1 | 30 | –54 | 48 | r-inferior parietal lobule | –2 | 18 | 50 | l-supplementary motor area | –3.35 |
| 2 | 30 | –54 | 48 | r- inferior parietal lobule | 4 | 12 | 58 | r- supplementary motor area | –3.69 |
| l, left; r, right. | |||||||||
Based on the above results, we identified the nodes connected with the most
edges showing significant FC strength changes following one session of iTBS, in
each of the brain networks. Specifically, the nodes connected with at least four
altered edges in the SN+ and SmN+ (seeds 1–6), or the nodes connected with
either of the two edges reaching marginal significant change level in the AoN+
(seeds 7–9), were defined as seeds for the whole brain FC patten analyses. The
anatomical locations of the seeds were as follows: seed 1, left medial orbital
frontal gyrus (MNI coordinates: –6, –48, –6); seed 2, left inferior orbital
frontal gyrus (MNI coordinates: –39, 24, –18); seed 3, right angular gyrus (MNI
coordinates: 45, –69, 27); seed 4, right middle occipital gyrus (MNI
coordinates: 45, –69, 27); seed 5, right fusiform gyrus (MNI coordinates: 30,
–36, –15); seed 6, right inferior orbital frontal gyrus (MNI coordinates: 39,
42, –15); seed 7, right inferior parietal lobule (MNI coordinates: 30, –54,
48); seed 8, left supplementary motor area (MNI coordinates: –2, 18, 50); seed
9, right supplementary motor area (MNI coordinates: 4, 12, 58). The whole brain
voxel-wise FC patterns of each seed identified by one sample t test
(p
 Fig. 5.
Seed-based functional connectivity (FC) analyses in the multi-session left M1 iTBS sub-group (seeds from the SN+ and SmN+). The left column illustrated the location of each seed (left column). The right three columns showed the whole-brain voxel-wise FC maps of each seed at before (time 1), and immediately after (time 2) the first session of iTBS, and after twenty sessions of iTBS treatment (time 3), from left to right. The color bar represented the t value of the one-sample t test used for identifying the FC maps. R, right; L, left.
 Fig. 6.
Seed-based functional connectivity (FC) analyses in the multi-session left M1 iTBS sub-group (seeds from the AoN+). The left column illustrated the location of each seed (left column). The right three columns showed the whole-brain voxel-wise FC maps of each seed at before (time 1), and immediately after (time 2) the first session of iTBS, and after twenty sessions of iTBS treatment (time 3), from left to right. The color bar represented the t value of the one-sample t test used for identifying the FC maps. R, right; L, left.
No significant correlation was revealed between the WAB-AQ changes (from time 1
to time 3) and the FC metric changes of the three networks, respectively, as
tested by Spearman’s correlation analyses (p
This study investigated how the left M1 iTBS could modulate the functional connectivity state of the brain semantic and mirror neuron systems in patients with PSA and concurrent hemiparesis. Three preliminary findings were documented. First, the network FC analyses demonstrated large-scale FC changes following the one-session left M1 iTBS in the semantic network but not in the mirror neuron network. Second, the characteristic patterns of the semantic network FC change following one-session iTBS were revealed, as the changing direction of the significant FC strength was decreasing rather than increasing; and the changed edges were distributed more widely in the right than in the left hemisphere. And third, the whole brain seed-based FC analyses illustrated that, although the one-session left M1 iTBS seemed to induce immediate FC strength reduction in the semantic system, the relevant seeds’ FC pattens seemed to be varying along the multi-session iTBS course, extending beyond the semantic system.
The finding that the one-session left M1 iTBS could trigger large-scale FC strength changes in the semantic system was consistent with the “hub and spoke” semantic models, which proposed “hubs” as “convergence zone” in the system to integrate information from motor-sensory cortices into meaningful concepts [43, 44, 46]. Specifically, this model suggests that the motor cortices should be involved in the processing of action-related concepts [80, 81, 82, 83]. A line of studies applying tDCS in PSA patients have illustrated that stimulating the left M1 could facilitate semantic processing [31, 54], especially for action concepts [32] in these patients. By independent component analysis (ICA) of the naming task related brain network, Darkow and colleagues have revealed that the left M1 tDCS could induce increased activities in the language network component, while no significant changes were observed in the motor and visual network [54]. However, the present study was the first to illustrate using iTBS to stimulate the left M1 could also induce FC reorganization in the semantic network. This language network specificity revealed in the tDCS study of Darkow and colleagues was consistent with our findings about iTBS, in that the FC changes mainly involved the semantic but not the action observation network. This was in contrast with the reports about the M1 stimulation effects caused either by iTBS [34, 51] or tDCS [84, 85] in the motor stroke patients, which revealed FC alterations among the motor cortices, including the bilateral M1, premotor cortex and the SMA. We interpreted this difference as mainly be due to the lesion location and functional impairment distinctions of the recruited participants. While Darkow and colleagues recruited patients with pure PSA without significant motor impairment, our participants suffered from concurrent PSA and hemiparesis, and the motor stroke studied did not recruit patients with aphasia.
However, despite the similar language network selectivity, the exact distribution patterns and alteration directions were different between our observations and the findings of Darkow and colleagues. While they observed the increased activities distributed mainly in the dorsal language stream of the left hemisphere, we observed decreased FCs more widely distributed in the ventral language stream [86], especially in the right hemispheric homologous regions of the classical left lateralized semantic network. Several explanations should be considered when interpreting this distinction, in addition to the different NIBS and fMRI paradigms adopted. First, as mentioned above, our participants suffered from more severe functional impairments, whose brains might adopt different functional reorganization strategies than the brains with less wide-spread disturbances. Second, while the PSA patients recruited in the study by Darkow and colleagues were all in the chronic stages, our participants were mostly in the post-acute stages after a stroke, which may involve more active spontaneous functional reorganization in the brain functional network [70, 71, 87, 88]. We suggest further studies recruiting groups of participants in different stages might help to clarify the influence of post-stroke stages on the brain FC responses to NIBS. Although the immediate effects following one-session iTBS were unlikely to be due to the spontaneous reorganization, the imbalanced post-acute brain functional reorganization process would possibly influence the FC alteration pattern caused by the left M1 stimulation. Besides, it should be noted that our participants were all native Chinese speakers. While the brain activation patterns during general semantic tasks have been reported to be mostly alike among Chinese and non-Chinses speakers [89, 90], additional language areas might be involved during morphological processing of Chinses characters in the native speakers [91]. In this study, we have constructed the SN+ and SemN+ based on the “general semantic” areas reported in the meta-analysis by Binder and colleagues, which have withdrawn data from studies involving various languages. Further studies using carefully designed reading tasks might shed light on how the language specific factors would influence the language system reorganization, as well as its responsiveness to NIBS treatment, in PSA patients with different native languages [56].
In contrast with the immediate FC strength reduction following one-session iTBS in the semantic network, our seed-based FC analyses revealed that the FC range of the seeds, which connected with the most decreased FCs in the semantic network following one-session iTBS, varied along the course of the multi-session iTBS treatments, extending beyond the classical semantic network. Interestingly, the FC maps of the left inferior frontal gyrus, right angular gyrus and middle occipital gyrus, and bilateral SMA seemed to show an extending trend into the dorsal language pathway, which may suggest that the left M1 iTBS could also facilitate language processing in the dorsal stream, such as phonological processing or motor-speech [41, 86]. Future studies recruiting a larger sample size and adopting more detailed language assessments may provide further evidence for clarifying this observation.
Our study has several limitations which need to be taken into account when evaluating our data. First, no sham iTBS were used, so that the FC alterations might be also caused by other confounders in addition to the iTBS effects, although the semantic network specific FC alterations were unlikely to be caused only by confounders. Second, our multi-session iTBS sample size was small after excluding the participants with low quality brain images, which weakened the statistical power of the long-term FC effects and behavioral-FC correlation analyses. In addition, the recruited PSA sample represented heterogeneity in both the stroke (i.e., ischemic and hemorrhagic) and aphasia types, and the lesion location showed voxel-level variations among our participants. Although previous NIBS studies [31, 54] applying left M1 tDCS have proved effective in similar heterogeneous PSA participants, studies adopting other “motor intervention” (for example, hand action observation [92]) suggested that the aphasia type might influence the responsiveness of the treatment in PSA patients. The inclusion of additional selected PSA samples, both with regard to the stroke and aphasia type, may help to provide more detailed analyses.
The present study provides preliminary evidence that the left M1 iTBS may induce large-scale functional network reorganization in the left lateralized semantic network and its homologous brain regions in the right hemisphere of PSA patients. Further multi-session iTBS studies including a control group should be conducted to further investigate this “trans-modal” effect of M1 iTBS.
QY and JJ designed the research study. QY, SX, and PD performed the research. MC, RZ, ZS, CL, ZY and YZ provided help and advice on data collection, research coordination and data analyses. QY and SX analyzed the data. QY wrote the manuscript. All authors contributed to editorial changes in the manuscript. All authors read and approved the final manuscript.
This study was approved by the ethical committee of Huashan Hospital (2019-336), Fudan University. Written informed consents were acquired from all the participants or their legal representative(s).
We are grateful to Liang, Guan, Gao, and Wei of the Department of Medical Imaging for their equipment support. We are also grateful to JH Ding, who have given us precious advice for the data analyses. Furthermore, we are grateful to all participants and their families for their cooperation in the study.
The research was funded by the National Key Research and Development Program of the Ministry of Science and Technology of the People’s Republic of China (Grant Numbers 2018YFC2002300 and 2018YFC2002301); the National Natural Science Foundation of China (Grant Number 91948302); the Innovative Research Group Project of National Natural Science Foundation of China (Grant Number 82021002), and the Shanghai Sailing Program (No. 19YF1405200).
The authors declare no conflict of interest.
Publisher’s Note: IMR Press stays neutral with regard to jurisdictional claims in published maps and institutional affiliations.