
Academic Editor: Jesús Pastor
Objective: This study aims to explore the value of
retinal vessel density (VD) in diagnosing optic nerve injuries in patients with
pituitary adenomas using optical coherence tomography angiography
(OCTA). Methods: In this cross-sectional retrospective
study, 100 patients with pituitary adenomas and 71 participants for normal
controls, who visited the Beijing Tiantan Hospital from January 2019 to May 2021,
were enrolled. The OCTA was used to measure retinal thickness and VD, and the
correlation of these parameters with visual field (VF) factors was analyzed.
Receiver operating characteristic curves were used to compare the value of the
above parameters in diagnosing VF abnormalities in the patients with pituitary
adenomas; the differences in retinal VD between 41 patients with pituitary
adenomas who had normal retinal thicknesses and 41 patients in the normal control
group with no statistical differences in gender and age were compared.
Results: The radial peripapillary capillary (RPC) density, superficial
retinal capillary plexus (SRCP) density, retinal nerve fiber layer thickness, and
ganglion cell layer complex thickness correlated with VF parameters (p
Pituitary adenomas are common tumors that represent 15% of intracranial tumors, with clinical manifestations that include abnormal pituitary hormone secretion and symptoms caused by compression from tumor growth on surrounding tissues. The latter presentation mainly causes optic chiasm compression, resulting in vision loss, visual field (VF) damage, and optic disc changes in patients. Normal pituitary tissue is anterior and inferior to the bilateral optic nerves and optic chiasm. Pituitary adenomas can gradually grow backward and upward, eventually compressing the optic chiasm, resulting in retinal ganglion cell axonal retrograde degeneration and VF defects in one or both eyes; the incidence of VF defects caused by pituitary adenomas ranges from 9% to 32% [1]. However, VF examinations cannot distinguish between dead or dysfunctional ganglion cells [2], which may affect doctors’ determinations of whether pituitary adenomas have damaged the optic nerves.
With the clinical application of the optical coherence tomography (OCT) technique, ganglion cell complex (GCC) thickness in patients with pituitary adenomas is recognized as an effective and sensitive means of diagnosing visual function. Previous studies using OCT have found that thinning of the GCC before VF changes can be a sensitive indicator in assessing optic nerve injuries, but GCC thickness may remain normal in the case of an acute optic nerve injury [3]. However, OCT and GCC parameters are reliable only for diagnosing slow-growing lesions; in the case of an acute injury, OCT parameters can still be within a normal range, even with a definitive clinical diagnosis [4].
Optical coherence tomography angiography (OCTA) is a non-invasive examination to quantitatively measure vessel density (VD) in the retinal macular and peripapillary areas and is extensively used for retinal and other optic nerve diseases, with high repeatability and stability [5, 6, 7, 8, 9, 10, 11, 12, 13, 14, 15, 16, 17, 18, 19]. Recent studies [2, 20, 21, 22, 23, 24, 25, 26] found that radial peripapillary capillary (RPC) and superficial retinal capillary plexus (SRCP) densities were reduced in patients with pituitary adenomas compared with normal control groups, and retinal VD did not only correlate with VF changes but also retinal thickness. Some scholars have proposed [27] that blood flow density changes occur earlier than fundus optic nerve changes and visual function.
This study aimed to explore the value of retinal VD in diagnosing optic nerve injuries in patients with pituitary adenomas through OCTA. Then, the retinal VD of the patients with pituitary adenomas with a normal retinal thickness and the control group who were gender- and age-matched were compared to determine whether the retinal VD were the sensitivity and specificity indicators similar to retinal nerve fiber layer (RNFL) and GCC thicknesses.
This study was a cross-sectional study approved by the institutional review board of Beijing Tiantan Hospital, Capital Medical University (KYSQ 2018-128-01), with data collection following the principles of the Declaration of Helsinki. Written consent was obtained from all participants before the study. Some of these participants were also included in another study [28] in the same department, but the data were not duplicated.
Patients with pituitary adenomas with complete clinical data visited the
Department of Neurosurgery and Department of Ophthalmology at Beijing Tiantan
Hospital, Capital Medical University, from January 2019 to May 2021. Following
the criteria, 100 patients and 71 participants for the normal control group were
enrolled in this study. All patients received head magnetic resonance imaging
(MRI), visual acuity, intraocular pressure, slit lamp, fundus, VF, and OCTA
examinations. Inclusion criteria: patients initially diagnosed with intracranial
space-occupying tumors confirmed by head MRIs, which were further confirmed as
pituitary adenomas through postoperative pathological diagnosis; patients who had
clear consciousness and could cooperate in the VF and OCTA examinations; patients
with an intraocular pressure of
The inclusion criteria of the normal control group included normal visual
acuity, an intraocular pressure
(1) An automatic VF examination was conducted using the Humphrey fully automatic
perimeter and central 24-2 threshold detection program (version 1.4.1.5) (Carl Zeiss Meditec, Inc,
Dublin, CA, USA). The results of the automatic VF examinations
with clinical significance ensured that the false negative and false positive
rates were
(2) The OCT and OCTA examinations were conducted using the Optovue system
(version A2017, 1, 0, 155) (Optovue, Inc., Fremont, CA, USA) to analyze the
thickness and VD in the macular and optic nerve papilla areas. The optic nerve
head scan was centered on the optic papilla (diameter 3.45 mm) to assess RNFL
thickness, and the GCC scan was centered on the macular fovea (diameter 3 mm,
inner limiting membrane/inner plexiform layer [ILM/IPL]) to assess GCC thickness.
They were divided into four subsectors: superior, inferior, nasal, and temporal
sectors automatically. The RPC scan was centered on the optic disc, with a
diameter of 4.5 mm and a scanning depth of ILM/NFL; the
SRCP was centered on the macular fovea, with a diameter of 3 mm
and a depth of 10
The visual acuity, intraocular pressure, VF, fundus, and OCTA of all patients and the normal control group were examined on the same day. All VFs and OCTAs were examined by a fixed examiner.
(3) Tumor morphology: Head MRI was performed one week before surgery. Based on the form of the pituitary adenoma compressing the optic chiasm at the T1 sagittal position of the head, patients were divided into those with undeformed (n = 43) or deformed (n = 57) optic chiasms. In the undeformed group, the upper edge of the tumor touched the optic chiasm, but it was not deformed. In the deformed group, the superior margin of the tumor compressed and deformed the optic chiasm.
Normally distributed data were expressed as mean
(1) Patient characteristics: Among the selected patients with pituitary
adenomas, 100 eyes/patients met the inclusion criteria, which included 50
eyes/males and 50 eyes/females; 47 eyes (47.00%) had a normal VF, 66 eyes
(66.00%) had a normal RNFL, and 43 eyes (43.00%) had a normal GCC. The patients
were between 12 and 76 years old, with an average age of 48.33
(2) The retinal VD among the undeformed and deformed optic chiasms and normal control groups: We found that only the nasal segment of the RPC was different between the normal control and undeformed optic chiasm groups. The VD of the RPC, SRCP, and the nasal segment of the DRCP was different between the normal control and deformed optic chiasm groups. There were differences between the undeformed and deformed optic chiasm groups in the VD of RPC and SRCP. The results are presented in Table 1.
| Normal control (group 1) | Optic chiasm undeformed (group 2) | Optic chiasm deformed (group 3) | p-value | p-value | p-value | |
| (1 versus 2) | (1 versus 3) | (2 versus 3) | ||||
| RPC, % | ||||||
| Whole image | 57.23 |
56.61 |
52.34 |
0.216 | 0.000 | 0.000 |
| Superior | 53.14 |
53.40 |
48.65 |
0.718 | 0.001 | 0.000 |
| Inferior | 55.22 |
54.75 |
49.94 |
0.545 | 0.000 | 0.000 |
| Nasal | 49.54 |
47.96 |
41.61 |
0.041 | 0.000 | 0.000 |
| Temporal | 55.38 |
54.38 |
48.07 |
0.122 | 0.000 | 0.000 |
| SRCP, % | ||||||
| Whole image | 51.64 |
51.29 |
48.28 |
0.615 | 0.000 | 0.001 |
| Superior | 54.07 |
54.74 |
51.47 |
0.528 | 0.014 | 0.009 |
| Inferior | 54.31 |
54.06 |
51.23 |
0.792 | 0.001 | 0.016 |
| Nasal | 52.84 |
52.86 |
49.07 |
0.990 | 0.000 | 0.003 |
| Temporal | 53.44 |
54.10 |
51.07 |
0.459 | 0.006 | 0.006 |
| DRCP, % | ||||||
| Whole image | 54.18 |
54.04 |
51.89 |
0.910 | 0.063 | 0.129 |
| Superior | 57.38 |
56.33 |
56.76 |
0.345 | 0.513 | 0.700 |
| Inferior | 54.18 |
54.04 |
51.89 |
0.199 | 0.200 | 0.949 |
| Nasal | 54.18 |
54.04 |
51.89 |
0.447 | 0.038 | 0.268 |
| Temporal | 54.18 |
54.04 |
51.89 |
0.534 | 0.175 | 0.537 |
(3) The correlation between VD parameters, VF parameters, RNFL and GCC thickness in patients with pituitary adenomas was analyzed. The VD of the RPC and SRCP was positively correlated with MD and VFI and negatively correlated with PSD. The VD of DRCP had no correlation with VF parameters. The results are shown in Table 2.
| MD | p value | PSD | p value | VFI | p value | |
| RNFL | 0.469 | 0.000 | –0.467 | 0.000 | 0.483 | 0.000 |
| GCC | 0.508 | 0.000 | –0.455 | 0.000 | 0.474 | 0.000 |
| RPC | 0.474 | 0.000 | –0.484 | 0.000 | 0.468 | 0.000 |
| SRCP | 0.314 | 0.001 | –0.243 | 0.015 | 0.273 | 0.006 |
| DRCP | 0.132 | 0.190 | –0.064 | 0.524 | 0.125 | 0.214 |
(4) Each parameter’s ROC curve was used to diagnose whether the VFs were
abnormal. According to the AUC of the abnormal VF diagnosed with each parameter,
the highest diagnostic ability was RPC temporal quadrant vessels with an AUC =
0.821 and a p-value
| AUC | p value | 95% confidence interval | Cut off | Sensitivity | Specificity | |
| RNFL thickness ( | ||||||
| Average | 0.77 | 0.000 | (0.68, 0.87) | 100.5 | 74.5% | 73.6% |
| Superior | 0.78 | 0.000 | (0.69, 0.88) | 128.5 | 74.5% | 81.1% |
| Inferior | 0.72 | 0.000 | (0.62, 0.82) | 117.5 | 85.1% | 52.8% |
| Nasal | 0.68 | 0.002 | (0.57, 0.79) | 61.65 | 95.7% | 37.7% |
| Temporal | 0.73 | 0.000 | (0.64, 0.83) | 68.6 | 91.5% | 49.1% |
| GCC thickness ( | ||||||
| Average | 0.799 | 0.000 | (0.71, 0.89) | 94.5 | 89.4% | 60.4% |
| Superior | 0.795 | 0.000 | (0.71, 0.88) | 103.45 | 80.9% | 67.3% |
| Inferior | 0.804 | 0.000 | (0.72, 0.89) | 103.75 | 83.0% | 67.2% |
| Nasal | 0.808 | 0.000 | (0.72, 0.89) | 97.55 | 91.5% | 71.2% |
| Temporal | 0.775 | 0.000 | (0.69, 0.87) | 94.60 | 85.1% | 63.5% |
| VD of RPC (%) | ||||||
| whole image | 0.805 | 0.000 | (0.72, 0.89) | 49.75 | 83.0% | 71.2% |
| Superior | 0.747 | 0.000 | (0.65, 0.84) | 51.48 | 85.1% | 55.8% |
| Inferior | 0.752 | 0.000 | (0.66, 0.85) | 54.78 | 68.1% | 71.2% |
| Nasal | 0.753 | 0.000 | (0.66, 0.85) | 43.83 | 95.7% | 48.1% |
| Temporal | 0.821 | 0.000 | (0.74, 0.90) | 54.84 | 72.3% | 82.7% |
| VD of SRCP (%) | ||||||
| whole image | 0.668 | 0.004 | (0.56, 0.78) | 50.95 | 66.0% | 69.2% |
| Superior | 0.658 | 0.007 | (0.54, 0.77) | 57.05 | 46.8% | 90.4% |
| Inferior | 0.617 | 0.045 | (0.51, 0.73) | 55.80 | 38.3% | 84.6% |
| Nasal | 0.687 | 0.001 | (0.58, 0.80) | 53.35 | 63.8% | 76.9% |
| Temporal | 0.655 | 0.008 | (0.54, 0.77) | 53.85 | 63.8% | 71.2% |
| VD of DRCP (%) | ||||||
| whole image | 0.556 | 0.337 | (0.44, 0.67) | - | - | - |
| Superior | 0.514 | 0.814 | (0.40, 0.63) | - | - | - |
| Inferior | 0.519 | 0.739 | (0.40, 0.64) | - | - | - |
| Nasal | 0.591 | 0.117 | (0.48, 0.70) | - | - | - |
| Temporal | 0.563 | 0.281 | (0.45, 0.68) | - | - | - |
 Fig. 1.
ROC curves for each quadrant of the VD of RPC.
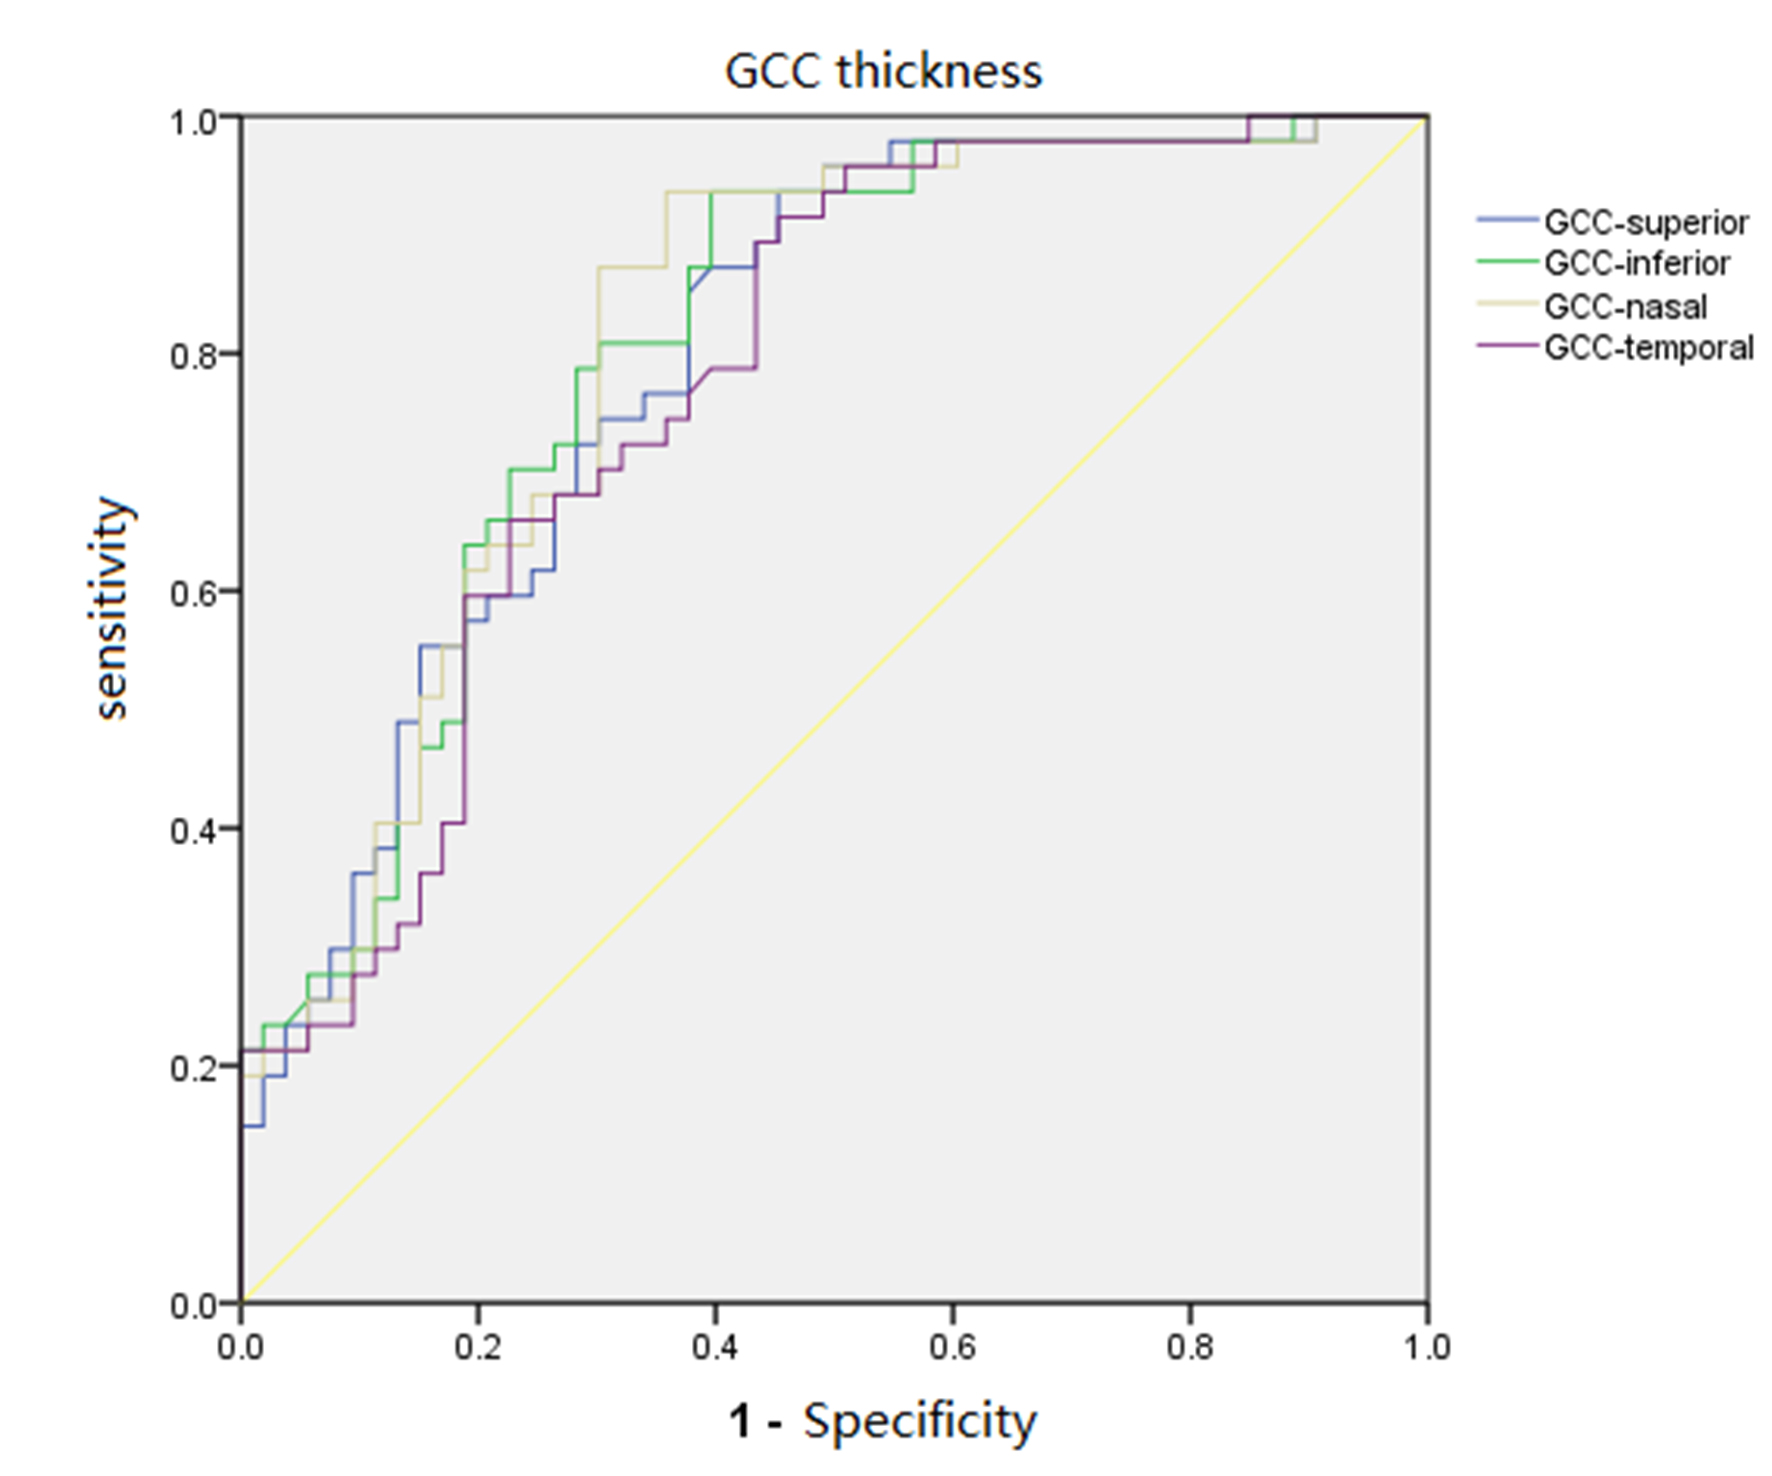 Fig. 2.
ROC curves for each quadrant of GCC thickness.
(5) After comparing the differences of various parameters between 41 eyes/patients with pituitary adenomas who had a normal retinal thickness and 41 eyes/patients in the normal control group with no statistical differences in age and gender, the RNFL and GCC thicknesses and VD of the SRCP and DRCP had no statistical differences. In the RPC VD in the pituitary adenoma group, the mean RPC VD (whole image capillary) and the RPC VD in the nasal and temporal quadrants were statistically significantly lower than the normal control group, as shown in Table 4.
| Case Group | Control Group | p value | |
| Age (year) | 48.98 |
48.29 |
0.79 |
| Gender (M/F) | 21/20 | 21/20 | 1.00 |
| RNFL (average) ( |
104.79 |
105.39 |
0.729 |
| GCC (average) ( |
98.69 |
98.29 |
0.753 |
| VD of RPC (%) | |||
| Whole image | 49.95 |
51.30 |
0.002 |
| Superior | 53.00 |
53.92 |
0.188 |
| Inferior | 55.09 |
56.11 |
0.199 |
| Nasal | 49.09 |
50.41 |
0.034 |
| Temporal | 54.33 |
55.89 |
0.020 |
| VD of SRCP (%) | |||
| Whole image | 51.48 |
52.09 |
0.299 |
| Superior | 55.20 |
54.89 |
0.704 |
| Inferior | 54.57 |
54.48 |
0.898 |
| Nasal | 53.01 |
53.40 |
0.900 |
| Temporal | 54.47 |
53.59 |
0.203 |
| VD of DRCP (%) | |||
| Whole image | 53.16 |
55.18 |
0.131 |
| Superior | 56.01 |
58.13 |
0.131 |
| Inferior | 55.39 |
57.40 |
0.128 |
| Nasal | 57.31 |
59.32 |
0.156 |
| Temporal | 57.64 |
58.78 |
0.156 |
This study compared the diagnostic value of OCTA and OCT parameters to determine whether retinal VD was sensitivity and specificity indicators identified VF defects in patients with pituitary adenoma. We found that the retinal VD parameters of patients with optic chiasmatic compression caused by intracranial tumors were lower than those of healthy people, and there was a correlation between VF, retinal VD, and retinal thickness parameters. Retinal VD parameters with the same as GCC and RNFL thickness were sensitivity and specificity indicators that could be used to identify visual impairments.
Previous research has suggested that the growth of pituitary tumors results in optic chiasm compression, leading to reduced axoplasmic transportation and blood supply [29, 30]. The resulting nerve fiber atrophy and apoptosis of ganglion cells may lead to reduced oxygen demand in the retina, thus leading to blood vessel atrophy. Our study found that the patients’ retinal VD decreased with increased compression on the optic chiasm by the pituitary adenoma. First, the nasal segment of the RPC showed a significant statistical decrease in the undeformed optic chiasm group compared with the healthy control group. Then, the VD of the RPC and SRCP, and the nasal segment of the DRCP decreased in the deformed optic chiasm group compared with the healthy control group. We also found that the VD of the RPC and SRCP were different between the undeformed and deformed optic chiasm groups.
After studying 36 patients with brain tumors and optic chiasm compression, Lee et al. [21] found that the density of capillaries in the optic disc and around the macular fovea was significantly lower than in healthy people, and retinal blood VD was correlated with VF and retinal thickness. Wang et al. [24] found that the RPC vascular density in the nasal and temporal quadrants was correlated to the RNFL thickness in the corresponding quadrants in 31 patients with brain tumors with optic chiasm compression. After studying 12 patients with brain tumors with optic chiasm compression, Ghezala et al. [29] found that their RPC was significantly lower than healthy people. Our results support these previous results. We also found that similar to the band atrophy of the nerve fibers in the pituitary patients, in patients with normal RNFL and GCC thickness, their nasal and temporal segments of RPC VD were decreased compared with the healthy group.
Our study used the ROC curve of the retinal thickness and VD parameters to diagnose VF impairments in patients with pituitary adenomas. The temporal segment of RPC vessel density’s AUC was slightly higher than the GCC and RNFL thickness. Its cut off point was 54.84%, with 72.3% sensitivity and 82.7% specificity, while the nasal segment of the GCC thickness had 91.5% sensitivity and 71.2% specificity, proving that RPC vascular density may also be a specific and sensitive indicator used for diagnosing VF impairments caused by pituitary adenomas. To date, we have not seen a report similar to our study method.
In our further comparison of retinal VD in patients with pituitary adenomas who had a normal retinal thickness and the normal control group, we found that even though the ganglion cell and nerve fiber layers were within the normal range, the VD in the nasal and temporal quadrants of the patients’ optic discs were significantly lower than in the normal control group, which has never been reported in previous studies. The nasal and temporal segments of RPC VD may decrease in the early stage of pituitary adenoma, even before the layers of nerve fibers change. Further longitudinal studies are needed to confirm this.
Our study had the following limitations: First, this was a single-center study, including only Chinese people, so our results may not apply to other ethnic groups. Second, this was a retrospective study, which only quantitatively measured the changes in retinal blood flow parameters in patients with pituitary adenomas. The causal relationship between the retinal blood flow differences in patients with different degrees of optic nerve injuries and the prognosis of visual function recovery was not explored, so further research is required. Third, we could not rule out the possibility of undetected micro-swelling in the optic disc affecting the VD assessment, which may cause some measurement errors.
In patients with pituitary adenomas, retinal VD decreased with increased compression on the optic chiasm by the pituitary adenoma. The capillary density in the optic disc is lower than in a normal eye; the retinal VD change correlates with the VF change. Therefore, similar to the GCC and RNFL thicknesses, the RPC VD can be used as a sensitive and specific indicator for assessing optic nerve injuries. Based on the VF and OCT parameters, measuring retinal VD combined with OCTA can help clinicians detect visual impairments in patients earlier. In addition, abnormal retinal vascular density may indicate visual function impairment in patients who cannot cooperate with a VF examination.
Conception and design of the research: YT, WJ. Acquisition of data: XL, JX, KW. Analysis and interpretation of the data: YT. Statistical analysis: YT. Obtaining financing: WJ. Writing of the manuscript: YT. Critical revision of the manuscript for intellectual content: YT, XL, JX, KW. All authors read and approved the final draft.
This study was conducted with approval from the Ethics Committee of Beijing Tiantan Hospital (KYSQ 2018-128-01). This study was conducted in accordance with the declaration of Helsinki. Written informed consent was obtained from all participants.
We would like to acknowledge the hard and dedicated work of all the staff that implemented the intervention and evaluation components of the study.
National Natural Science Foundation of China (no. 82071996).
The authors declare no conflict of interest.
Publisher’s Note: IMR Press stays neutral with regard to jurisdictional claims in published maps and institutional affiliations.