
Stress has become a dangerous health problem in our life, especially in student education journey. Accordingly, previous methods have been conducted to detect mental stress based on biological and biochemical effects. Moreover, hormones, physiological effects, and skin temperature have been extensively used for stress detection. However, based on the recent literature, biological, biochemical, and physiological-based methods have shown inconsistent findings, which are initiated due to hormones’ instability. Therefore, it is crucial to study stress using different mechanisms such as Electroencephalogram (EEG) signals. In this research study, the frontal lobes EEG spectrum analysis is applied to detect mental stress. Initially, we apply a Fast Fourier Transform (FFT) as a feature extraction stage to measure all bands’ power density for the frontal lobe. After that, we used two type of classifications such as subject wise and mix (mental stress vs. control) using Support Vector Machine (SVM) and Naive Bayes (NB) machine learning classifiers. Our obtained results of the average subject wise classification showed that the proposed technique has better accuracy (98.21%). Moreover, this technique has low complexity, high accuracy, simple and easy to use, no over fitting, and it could be used as a real-time and continuous monitoring technique for medical applications.
Stress is an essential concept that is gradually being active in research attention in neuroscience, medicine, psychology, and associated fields such as sentimental computing [1, 2]. The term may be used in external or internal affairs that may trigger negative sentiments and associated physiological variations [3]. A cognitive-evaluative constituent was recently introduced into the stress mechanism to describe both inter and intra individual changeability in the connotation between induced stress levels and environmental events [4, 5]. Underneath this notion, the mapping between stress response and induced stress levels is neither universal nor constant, as it is delimited through cognitive procedures of assessment. Recent studies specify gender changes in stress adaptation and the life of specific personality types and characters, e.g., empathy, social presence, independence, work orientation, and intellectual efficiency, which are well-thought-out more susceptible to stress [6].
For example, universities can be stressful place where many scholars reveal a multiplicity of psychological health problems. A previous study revealed that one of four university scholars suffers from psychological health sicknesses, including depression and anxiety. Traumatic measures and practices may have harmful effects on life and academic activity [7]. On the internet of medical things (IoMT) [8] and the big data era, mental disorders diagnosis, detection, and management play crucial roles [9, 10]. However, 45% of high school students suffer from stress, indicating dangerous academic life impacts [11, 12]. However, the impact of stress has various ways of manifestation [13]. It could be physical such as pain, headache, and high blood pressure; emotional such as anger, anxiety, and depression, behavioral such as lacking or increasing of eating and sleeping [14, 15]; or cognitive such as learning and memory problems [16]. Consequently, hormones such as cortisol and adrenalin could be increased during stress as biological feedback of the stress [17, 18]. Thus, daily social performance could also be influenced hazardously because of the impact of stress on the human body (Fig. 1, Ref. [19]) and the brain, including reshaping the hippocampus region and cognitive areas such as the frontal cortex [20, 21].

Various techniques have been proposed to evaluate stress based on biological and biochemical effects [22]. For example, hormones such as cortisol and adrenalin have been used to assess the level of stress [23]. Furthermore, physiological effects are also used, e.g., heart rate, blood pressure, and skin temperature. Based on the recent literature, biological, biochemical, and physiological-based methods have shown inconsistent findings [24]. These inconsistent results are initiated due to hormones’ instability and several related factors such as time, gender, age, mood, health status, drugs, and smoking [25]. Thus, it is crucial to study the stress using different Electroencephalogram (EEG) signals and bioelectrical transmission information generated from the human brain [26, 27]. However, EEG waveforms recorded from the scalp are used to measure the brain’s electrical activities [28, 29]. Therefore, the decomposition of signals in different frequency bands at several spatially distributed electrodes on the whole EEG scalp is obtained in this study. Different signals have been captured from several lobe locations corresponding to specific brain functions [30]. Each lobe is dedicated to specific tasks that can be resumed in Table 1 (Ref. [31]).
| Region | Functionality |
| Frontal | Cognitive function, decision making, and control |
| Temporal | Memory and auditory processing |
| Central | Motor processing |
| Parietal | Language and coordination processing |
| Occipital | Vision processing |
Recently, using psychological signals to investigate Alzheimer, mental and sleep disorders becomes very common [32, 33, 34, 35, 36, 37, 38, 39]. Moreover, the EEG has become a crucial non-invasive measure of brain activities, and it has a vital potentiality to diagnose mental disorders, abnormalities, and the state of the brain [40, 41, 42]. Thus, the desired features are extracted from the signals recorded from the brain’s scalp. EEG has been used extensively to detect and study human stress [43, 44], especially in the frontal lobe [45]. The current study uses machine learning techniques such as Support Vector Machine (SVM) and Naive Bayes (NB) to detect and classify mental stress disorder using EEG signals. We used two types of classifications such as subject wise and mix (mental stress vs. control). Moreover, EEG spectrum analysis at the frontal lobe is applied.
The emerging topic of automated stress detection based on a frontal lobe EEG signal is significant in the stress research community. Lately, many studies have focused on detecting and diagnosing mental stress using EEG signals and the relationship between emotional states and frontal lobe EEG alpha-band [46, 47]. In another study, researchers studied the spectrum power, complexity, and connectivity of EEG alpha, beta, and theta bands on the frontal lobe for two groups. The first group was a moderate stressed subjects group. The second one was a high stressed subjects group. Their experiments have revealed higher left prefrontal power for the high stressed group than the moderate stressed one. Additionally, mental stress detection technique based on clustering technique using EEG signals has already been presented. The perceived stress was measured, and the level of stress was estimated using the k-means clustering method and statistical analysis. In a similar study [48], authors used brain signals EEG to investigate mental stress using classification techniques. However, several classifiers are employed, where SVM has obtained the maximum accuracy. The stress classification technique using EEG signals was proposed in [49]. For the feature extraction stage, five main features are extracted from the recorded EEG signals: absolute power, relative power, phase lag, amplitude asymmetry, and coherence. In the classification stage, minimal sequential optimization, decent stochastic gradient, logistic regression, and multilayer perceptron are applied, where logistic regression shows the highest classification accuracy compared to other techniques. According to Ranjith et al. [50], a stress detection technique based on Improved Elman Neural Network (IENN) has been introduced. Power Spectral Entropy (PSE) and Gray Level Different Statistics (GLDS) methods were applied in the feature extraction stage, while IENN was applied in the classification stage. A stress detection technique based on time and frequency domain analysis was proposed. Empirical mode decomposition (EMD) and Short-Term Fourier Transform (STFT) were applied to extract features from a recorded EEG signal then SVM was applied in the classification stage. The authors have argued that the empirical results prove the proposed method’s superiority over the existing techniques. Bairagi et al. [51] presented a hardware system to detect mental stress based on a preamplifier and filter using EEG signals. The authors have concluded that the theta band (frequency ranges from 4 Hz to 7 Hz) is associated with the frontal lobe. The obtained accuracy of the proposed approach was approximately 88%. A mental stress detection technique based on a multi-domain hybrid feature pool was proposed in a recent study [52]. Statistical analysis and wavelet-based analysis were both applied to extract features from recorded EEG signals. Following that, K-Nearest Neighbors (KNN) algorithm was used in the classification stage. The accuracy of the proposed method was 73.38%. Additionally, mental stress detection based on the Genetic Algorithm (GA) technique was proposed, where GA was applied as feature extraction and selection techniques [53]. In contrast, the KNN classifier was applied as a classification technique. The obtained accuracy of the proposed method was 72%. Priya et al. [54] proposed a stress detection technique based on power ratio for the frontal lobe using EEG. Power Spectral Density (PSD) for alpha, beta, delta, theta, and gamma bands were analyzed and computed in that study [55, 56]. At the same time, Kernel-based SVM and KNN (with several neighbors) classifiers were applied.
In this research study, we extracted the five features of the frontal lobe EEG data; the smaller number of features is better for the system due to computational load. Selection of the classifier is compulsory in oredr to have the most acceptable possible outcomes. We had two goals for the evaluation of classifiers. First, clarifying the condition in which they provide high performance. Second, indicating the excellent classifier for the same input. We evaluated different classifiers such as SVM RBF Kernel, SVM linear, SVM polynomial, SVM sigmoid, and NB.
This research work, which was conducted in October 2020, proposes a methodology for mental stress detection using SVM and NB classifiers. The proposed methodology is divided into five stages: experimental design, data collection, preprocessing of the recorded EEG signal, data analysis, feature extraction, and classification (Fig. 2). The EEG data were collected from fourteen participants with 182 samples. We used an EGI’s Geodesic EEG System (Giodesic Inc., USA) with 128 channels to acquire brain activities from participants’ frontal lobe. This study was approved by the Institutional Review Board (IRB) of Najran University in Saudi Arabia. A written informed consent was obtained from all subjects before the study. The information of the participants obtained by a questionnaire. All the participants were non-smokers, undergraduate university male students aged between 18 and 23 years. According to their personal history, they were healthy and had no history of chronic disorders, acute disorders, or medication/drugs. As it is normal, the cortisol level is high in the morning and low at night. Therefore, we experimented in the afternoon daytime, where the cortisol is stable. The subjects were assigned into two groups, the control group, and the stressed group. In the control group, Eyes Open (EO) as a control state is provided. Importantly, Cold Pressor Stress (CPS) is applied to the stressed group [57]. CPS is considered to be an experimental stress test. CPS is being applied as a painful stimulation. However, all subjects in the stressed group put the dominant hand into an ice water for 60 seconds. We used two times (pre and post) Depression, Anxiety and Stress Scale (DASS) [58] questionnaire to find out the stress in the students.
 Fig. 2.
Experimental setup of the proposed study.
We used two classifiers in this study: SVM and NB. Support Vector Machine (SVM) is one of the supervised machine-learning algorithms with kernel based model. Recently, SVM is highly used for pattern recognition, classification, and regression. The core fundamental of the SVM is to develop a hyper plane in infinite-dimensional space for data prediction. The hyper plane’s highest accuracy is achieved, which has the most considerable distance to the classes’ nearest training point [59].
Naive Bayes (NB) classifier is based on Bayes hypothesis with the independence
assumptions between predictors. It is easy to be constructed without any
problematic iterative parameter valuation that makes it individually useful for
big datasets. Bayes hypothesis provides the calculation of posterior probability
(P
After normalized feature extraction, we used two types of classifications such
as subject wise and mix (mental stress vs. control) classifications using SVM and
NB machine learning classifiers in the parameters of Sensitivity (S
where TP is the true positive, TN is the true negative, FP is the false positive, and FN is the false negative.
| Actual class | Predicted class | |
| Mental stress | Control | |
| Stress | True positive (TP) | False positive (FP) |
| Control | False negative (FN) | True negative (TN) |
As a preprocessing stage, alternating current (AC) power noise is removed and data is filtered using a notch filter, i.e., band stop filter, which is used to attenuate the specific band frequency range of the signal as given in Eqn. 7. Following that, to obtain frequencies within a specific range, EEG data is passed through a band pass filter with a cut-off frequency of 0.1–30 Hz. Finally, to decompose a multivariate EEG signal into independent signals, Independent Component Analysis (ICA) method is applied to remove several sources artifacts, such as Electrooculography (EOG) and Electromyography (EMG) signals. ICA is given in Eqn. 8. At data analysis and feature extraction stages, FFT, which is described in Eqn. 9, is applied in the frequency domain to extract the mean power spectrum for EEG main bands, delta (0.1–3.9 Hz), theta (4–7.9 Hz), alpha (8–13.9 Hz), beta (14–29.9 Hz), and gamma (30–80 Hz) for 16 channels covering the frontal lobe [62, 63, 64].
where, s is the vector form signal, wc is the range of attenuated band frequency, x is the signal with vector s, and N is the domain’s size.
To process our EEG data for frontal lobe channels, we used the EEG LAB, an
interactive Matlab toolbox for processing continuous and event-related EEG. Table 3 shows the minimum and maximum values of the mean power spectrum of all EEG
bands in the frontal lobe for stress and control groups, respectively. The
differences between stress and control power spectrum value, expressed in
| Group | Mental stress | Control | Differences of the mental stress and control | |||
| Max. | Min. | Max. | Min. | Max. | Min. | |
| Delta activity | 1.788 | 1.788 | 1.723 | 1.400 | 0.065 | 0.388 |
| Theta activity | –0.444 | –0.444 | 0.650 | –0.018 | –1.094 | –0.426 |
| Alpha activity | –0.447 | –0.447 | –0.417 | –0.433 | –0.030 | –0.014 |
| Beta activity | –0.448 | –0.448 | –0.549 | –0.683 | 0.101 | 0.235 |
| Gamma activity | –0.448 | –0.448 | –0.073 | –0.966 | –0.375 | 0.518 |
 Fig. 3.
Differences between mental stress and control group for the mean power spectrum.
We used two type of classifications: (1) subject wise and (2) mix (mental stress
vs. control) using SVM and NB classifiers. In subject wise classification our
system average performance in terms of S
| Subject | Classifier | S |
S |
A |
F |
P |
AUC |
| 1 | SVM | 1 | 1 | 1 | 1 | 1 | 1 |
| NB | 1 | 1 | 1 | 1 | 1 | 1 | |
| 2 | SVM | 1 | 1 | 1 | 1 | 1 | 1 |
| NB | 1 | 1 | 1 | 1 | 1 | 1 | |
| 3 | SVM | 0.900 | 0.910 | 0.900 | 0.899 | 0.917 | 1 |
| NB | 0.875 | 0.887 | 0.875 | 0.874 | 0.901 | 0.965 | |
| 4 | SVM | 0.950 | 0.925 | 0.950 | 0.949 | 0.954 | 1.00 |
| NB | 0.875 | 0.812 | 0.875 | 0.869 | 0.897 | 0.977 | |
| 5 | SVM | 1 | 1 | 1 | 1 | 1 | 1 |
| NB | 1 | 1 | 1 | 1 | 1 | 1 | |
| 6 | SVM | 1 | 1 | 1 | 1 | 1 | 1 |
| NB | 0.925 | 0.861 | 0.925 | 0.923 | 0.933 | 1 | |
| 7 | SVM | 1 | 1 | 1 | 1 | 1 | 1 |
| NB | 1 | 1 | 1 | 1 | 1 | 1 | |
| 8 | SVM | 1 | 1 | 1 | 1 | 1 | 1 |
| NB | 1 | 1 | 1 | 1 | 1 | 1 | |
| 9 | SVM | 1 | 1 | 1 | 1 | 1 | 0.812 |
| NB | 0.975 | 0.983 | 0.975 | 0.975 | 0.976 | 1 | |
| 10 | SVM | 1 | 1 | 1 | 1 | 1 | 1 |
| NB | 1 | 1 | 1 | 1 | 1 | 1 | |
| 11 | SVM | 1 | 1 | 1 | 1 | 1 | 1 |
| NB | 1 | 1 | 1 | 1 | 1 | 1 | |
| 12 | SVM | 1 | 1 | 1 | 1 | 1 | 0.842 |
| NB | 1 | 1 | 1 | 1 | 1 | 1 | |
| 13 | SVM | 1 | 1 | 1 | 1 | 1 | 1 |
| NB | 1 | 1 | 1 | 1 | 1 | 1 | |
| 14 | SVM | 1 | 1 | 1 | 1 | 1 | 1 |
| NB | 1 | 1 | 1 | 1 | 1 | 1 | |
| Average | 0.9821 | 0.9777 | 0.9821 | 0.9817 | 0.9849 | 0.9855 | |
| Data in bold represent the model with the highest performance. | |||||||
 Fig. 4.
Average of the subject wise classification using SVM and NB machne learning classifiers.
In the mix (mental stress vs. control) classification, Table 5 represents the
performances of the SVM Radial Basis Function (RBF) Kernel classifier. The random
sampling model gave the highest performance as compared to the others. The values
of S
| Models | S |
S |
A |
F |
P |
AUC |
| Random sampling | 0.814 | 0.815 | 0.814 | 0.814 | 0.815 | 0.861 |
| Leave one out | 0.805 | 0.805 | 0.805 | 0.805 | 0.805 | 0.821 |
| 20 | 0.805 | 0.805 | 0.805 | 0.805 | 0.805 | 0.859 |
| 10 | 0.805 | 0.805 | 0.805 | 0.805 | 0.805 | 0.864 |
| 5 | 0.805 | 0.805 | 0.805 | 0.805 | 0.805 | 0.888 |
| 3 | 0.805 | 0.805 | 0.805 | 0.805 | 0.805 | 0.894 |
| 2 | 0.805 | 0.805 | 0.805 | 0.805 | 0.805 | 0.884 |
| Average | 0.8063 | 0.8064 | 0.8063 | 0.8063 | 0.8064 | 0.8673 |
| 0.0032 | 0.0035 | 0.0032 | 0.0032 | 0.0035 | 0.0229 | |
| Data in bold represent the model with the highest performance. | ||||||
| Models | S |
S |
A |
F |
P |
AUC |
| Random sampling | 0.898 | 0.901 | 0.898 | 0.897 | 0.897 | 0.883 |
| Leave one out | 0.902 | 0.902 | 0.902 | 0.902 | 0.007 | 0.937 |
| 20 | 0.902 | 0.902 | 0.902 | 0.902 | 0.007 | 0.903 |
| 10 | 0.902 | 0.902 | 0.902 | 0.902 | 0.897 | 0.905 |
| 5 | 0.897 | 0.897 | 0.897 | 0.896 | 0.007 | 0.890 |
| 3 | 0.897 | 0.897 | 0.897 | 0.896 | 0.897 | 0.908 |
| 2 | 0.879 | 0.879 | 0.879 | 0.879 | 0.007 | 0.891 |
| Average | 0.8967 | 0.8971 | 0.8967 | 0.8963 | 0.3884 | 0.9024 |
| 0.0076 | 0.0077 | 0.0076 | 0.0075 | 0.4404 | 0.0165 | |
| Data in bold represent the model with the highest performance. | ||||||
| Models | S |
S |
A |
F |
P |
AUC |
| Random sampling | 0.810 | 0.810 | 0.810 | 0.810 | 0.810 | 0.819 |
| Leave one out | 0.799 | 0.799 | 0.799 | 0.799 | 0.799 | 0.810 |
| 20 | 0.799 | 0.799 | 0.799 | 0.799 | 0.799 | 0.828 |
| 10 | 0.799 | 0.799 | 0.799 | 0.799 | 0.799 | 0.832 |
| 5 | 0.799 | 0.799 | 0.799 | 0.799 | 0.799 | 0.832 |
| 3 | 0.799 | 0.799 | 0.799 | 0.799 | 0.799 | 0.846 |
| 2 | 0.799 | 0.799 | 0.799 | 0.799 | 0.799 | 0.836 |
| Average | 0.8006 | 0.8006 | 0.8006 | 0.8006 | 0.8006 | 0.8290 |
| 0.0038 | 0.0038 | 0.0038 | 0.0038 | 0.0038 | 0.0108 | |
| Data in bold represent the model with the highest performance. | ||||||
| Models | S |
S |
A |
F |
P |
AUC |
| Random sampling | 0.814 | 0.815 | 0.814 | 0.814 | 0.815 | 0.774 |
| Leave one out | 0.805 | 0.805 | 0.805 | 0.805 | 0.805 | 0.787 |
| 20 | 0.805 | 0.805 | 0.805 | 0.805 | 0.805 | 0.744 |
| 10 | 0.805 | 0.805 | 0.805 | 0.805 | 0.805 | 0.746 |
| 5 | 0.805 | 0.805 | 0.805 | 0.805 | 0.805 | 0.784 |
| 3 | 0.805 | 0.805 | 0.805 | 0.805 | 0.805 | 0.774 |
| 2 | 0.805 | 0.805 | 0.805 | 0.805 | 0.805 | 0.787 |
| Average | 0.8063 | 0.8064 | 0.8063 | 0.8063 | 0.8064 | 0.7709 |
| 0.0031 | 0.0035 | 0.0031 | 0.0031 | 0.0035 | 0.0171 | |
| Data in bold represent the model with the highest performance. | ||||||
| Models | S |
S |
A |
F |
P |
AUC |
| Random sampling | 0.817 | 0.817 | 0.817 | 0.817 | 0.817 | 0.897 |
| Leave one out | 0.810 | 0.810 | 0.810 | 0.810 | 0.810 | 0.882 |
| 20 | 0.810 | 0.810 | 0.810 | 0.810 | 0.810 | 0.896 |
| 10 | 0.810 | 0.810 | 0.810 | 0.810 | 0.810 | 0.902 |
| 5 | 0.810 | 0.810 | 0.810 | 0.810 | 0.810 | 0.906 |
| 3 | 0.805 | 0.805 | 0.805 | 0.805 | 0.805 | 0.913 |
| 2 | 0.805 | 0.805 | 0.805 | 0.805 | 0.805 | 0.906 |
| Average | 0.8096 | 0.8096 | 0.8096 | 0.8096 | 0.8096 | 0.9003 |
| 0.0037 | 0.0037 | 0.0037 | 0.0037 | 0.0037 | 0.0092 | |
| Data in bold represent the model with the highest performance. | ||||||
The highest and average results obtained by the proposed classifiers. As shown in Fig. 5, the SVM linear classifier achieved the highest accuracy in both individual and average cases. Additionally, the differences between the mean of the highest and average performance of the classification shown in Fig. 6. The proposed SVM linear classification results for the leave one out model regarding sensitivity, specificity, and accuracy were found to be 0.902 for all of them. In addition, SVM linear classifier achieved the highest accuracy in the models’ average in terms of sensitivity, specificity, and accuracy were found to be 0.8967, 0.8971, and 0.8967, respectively.
 Fig. 5.
Comparison of the (a) highest performance and (b) average classifiers for the mix (mental stress vs. control) classification.
 Fig. 6.
Comparative analysis between the mean of the highest and average performance classifications.
Asif et al. [49] designed a stress classification technique using EEG signals regarding previous related work. As a feature extraction stage, five main features are extracted from the recorded EEG signals: absolute power, relative power, coherence, phase lag, and amplitude asymmetry. Minimal sequential optimization, decent stochastic gradient, logistic regression, and multilayer perceptron are applied in the classification stage. Importantly, logistic regression shows the highest classification accuracy. Ranjith et al. [50] introduced a stress detection technique based on Improved Elman Neural Network (IENN). Power Spectral Entropy (PSE) and Gray Level Different Statistics (GLDS) methods were applied in the feature extraction stage, where IENN was applied in the classification stage. Bairagi et al. [51], a hardware system to detect mental stress based on a preamplifier and filter using EEG signals was presented. The authors have found that the Theta band is associated with the frontal lobe. The accuracy of the proposed approach was approximately 88%. In a similar study by Hasan et al. [65], a mental stress detection technique based on a multi-domain hybrid feature pool has been proposed. Moreover, statistical analysis and wavelet-based analysis are both applied to extract features from recorded EEG signals. Following that, the KNN algorithm is used in the classification stage. The accuracy of the proposed method was 73.38%. Many wearable smart devices such as CGX-Quick 30, dry EEG head set, EMOTIV-EPOC X, MUSE-2, mBrainTrain-SMARTING mobi, OpenBCI-Cyton, and sensing-DSI 24 based on flexible electronics are used in the recording of the EEG signal in modern world.
In Shon et al. [53], mental stress detection based on the Genetic Algorithm (GA) technique is proposed, where GA is applied as a feature extraction and selection technique. KNN classifier is applied as a classification technique. The accuracy of the proposed method was 72%. In Priya et al. [54], a stress detection technique based on power ratio for the frontal lobe using EEG is proposed. PSD for delta, alpha, beta, theta, and gamma bands are analyzed and computed. Kernel-based SVM and KNN classifiers are applied. As a result, KNN shows better accuracy results than SVM. Wijsman et al. [66] used the Piezoelectric Film Sensor (PFS) to record the participants’ stress. They applied the KNN classifier, and they were able to achieve 80% accuracy. Sun et al.[67] used thirty subjects using an ECG signal to record the cardiac signal. Additionally, they classified the signal using a Decision Tree (DT) classifier, which achieved 80% accuracy, where DT is easy to understand efficiently [68]. Previously, many smart devices, including accelerometer, Galvanic Skin Response (GSR), smart watch, and electrodes for the recording of the physiological signal such as ECG, EEG, and EMG, are used to detect stress [69, 70] . They used DT, KNN, and SVM classifiers to classify the subjects mentioned in Table 10 (Ref. [53, 65, 66, 67, 69, 70, 71]). However, our proposed method achieved better results (subject wise classification: 98% and mix (mental stress vs. control) classifications: 90%) than previously selected methods, as shown in Fig. 7.
| Reference | Year | Particip. | Data recording tool | Signal | Classifier | Acc. (%) |
| Wijsman et al. [66] | 2011 | 30 | PFS | ECG, EMG | KNN | 80 |
| Sun et al. [67] | 2012 | 20 | Accelerometer | ECG | DT | 80 |
| Kurniawan et al. [70] | 2013 | - | GSR sensor | GSR | DT | 77 |
| Ciabattoni et al. [69] | 2017 | 10 | Smart watch | HR | KNN | 84 |
| Son et al. [53] | 2018 | 32 | 32 Active AgCl electrodes system | EEG, EOG, EMG | KNN | 72 |
| Castaldo et al. [71] | 2019 | 42 | Kendall - 530 series foam electrodes | ECG | SVM | 88 |
| Hasan et al. [65] | 2019 | 32 | 32 Active AgCl electrodes system | EEG | KNN | 73 |
| Proposed | 14 | 128 EEG channels system | EEG | SVM, NB (Subject wise classification) | 98 | |
| SVM Linear (Mix classification) | 90 | |||||
| PFS, Piezoelectric Film Sensor; ECG, Electrocardiogram; EMG, Electromyogram; EEG, Electroencephalogram; KNN, K-Nearest Neighbor; GMM, Gaussian Mixture Model; GSR, Galvanic Skin Response; HR, Heart Rate; DEAP, database for emotion analysis using physiological signals. Data in bold represent the results of our proposed method compared to previously selected methods. | ||||||
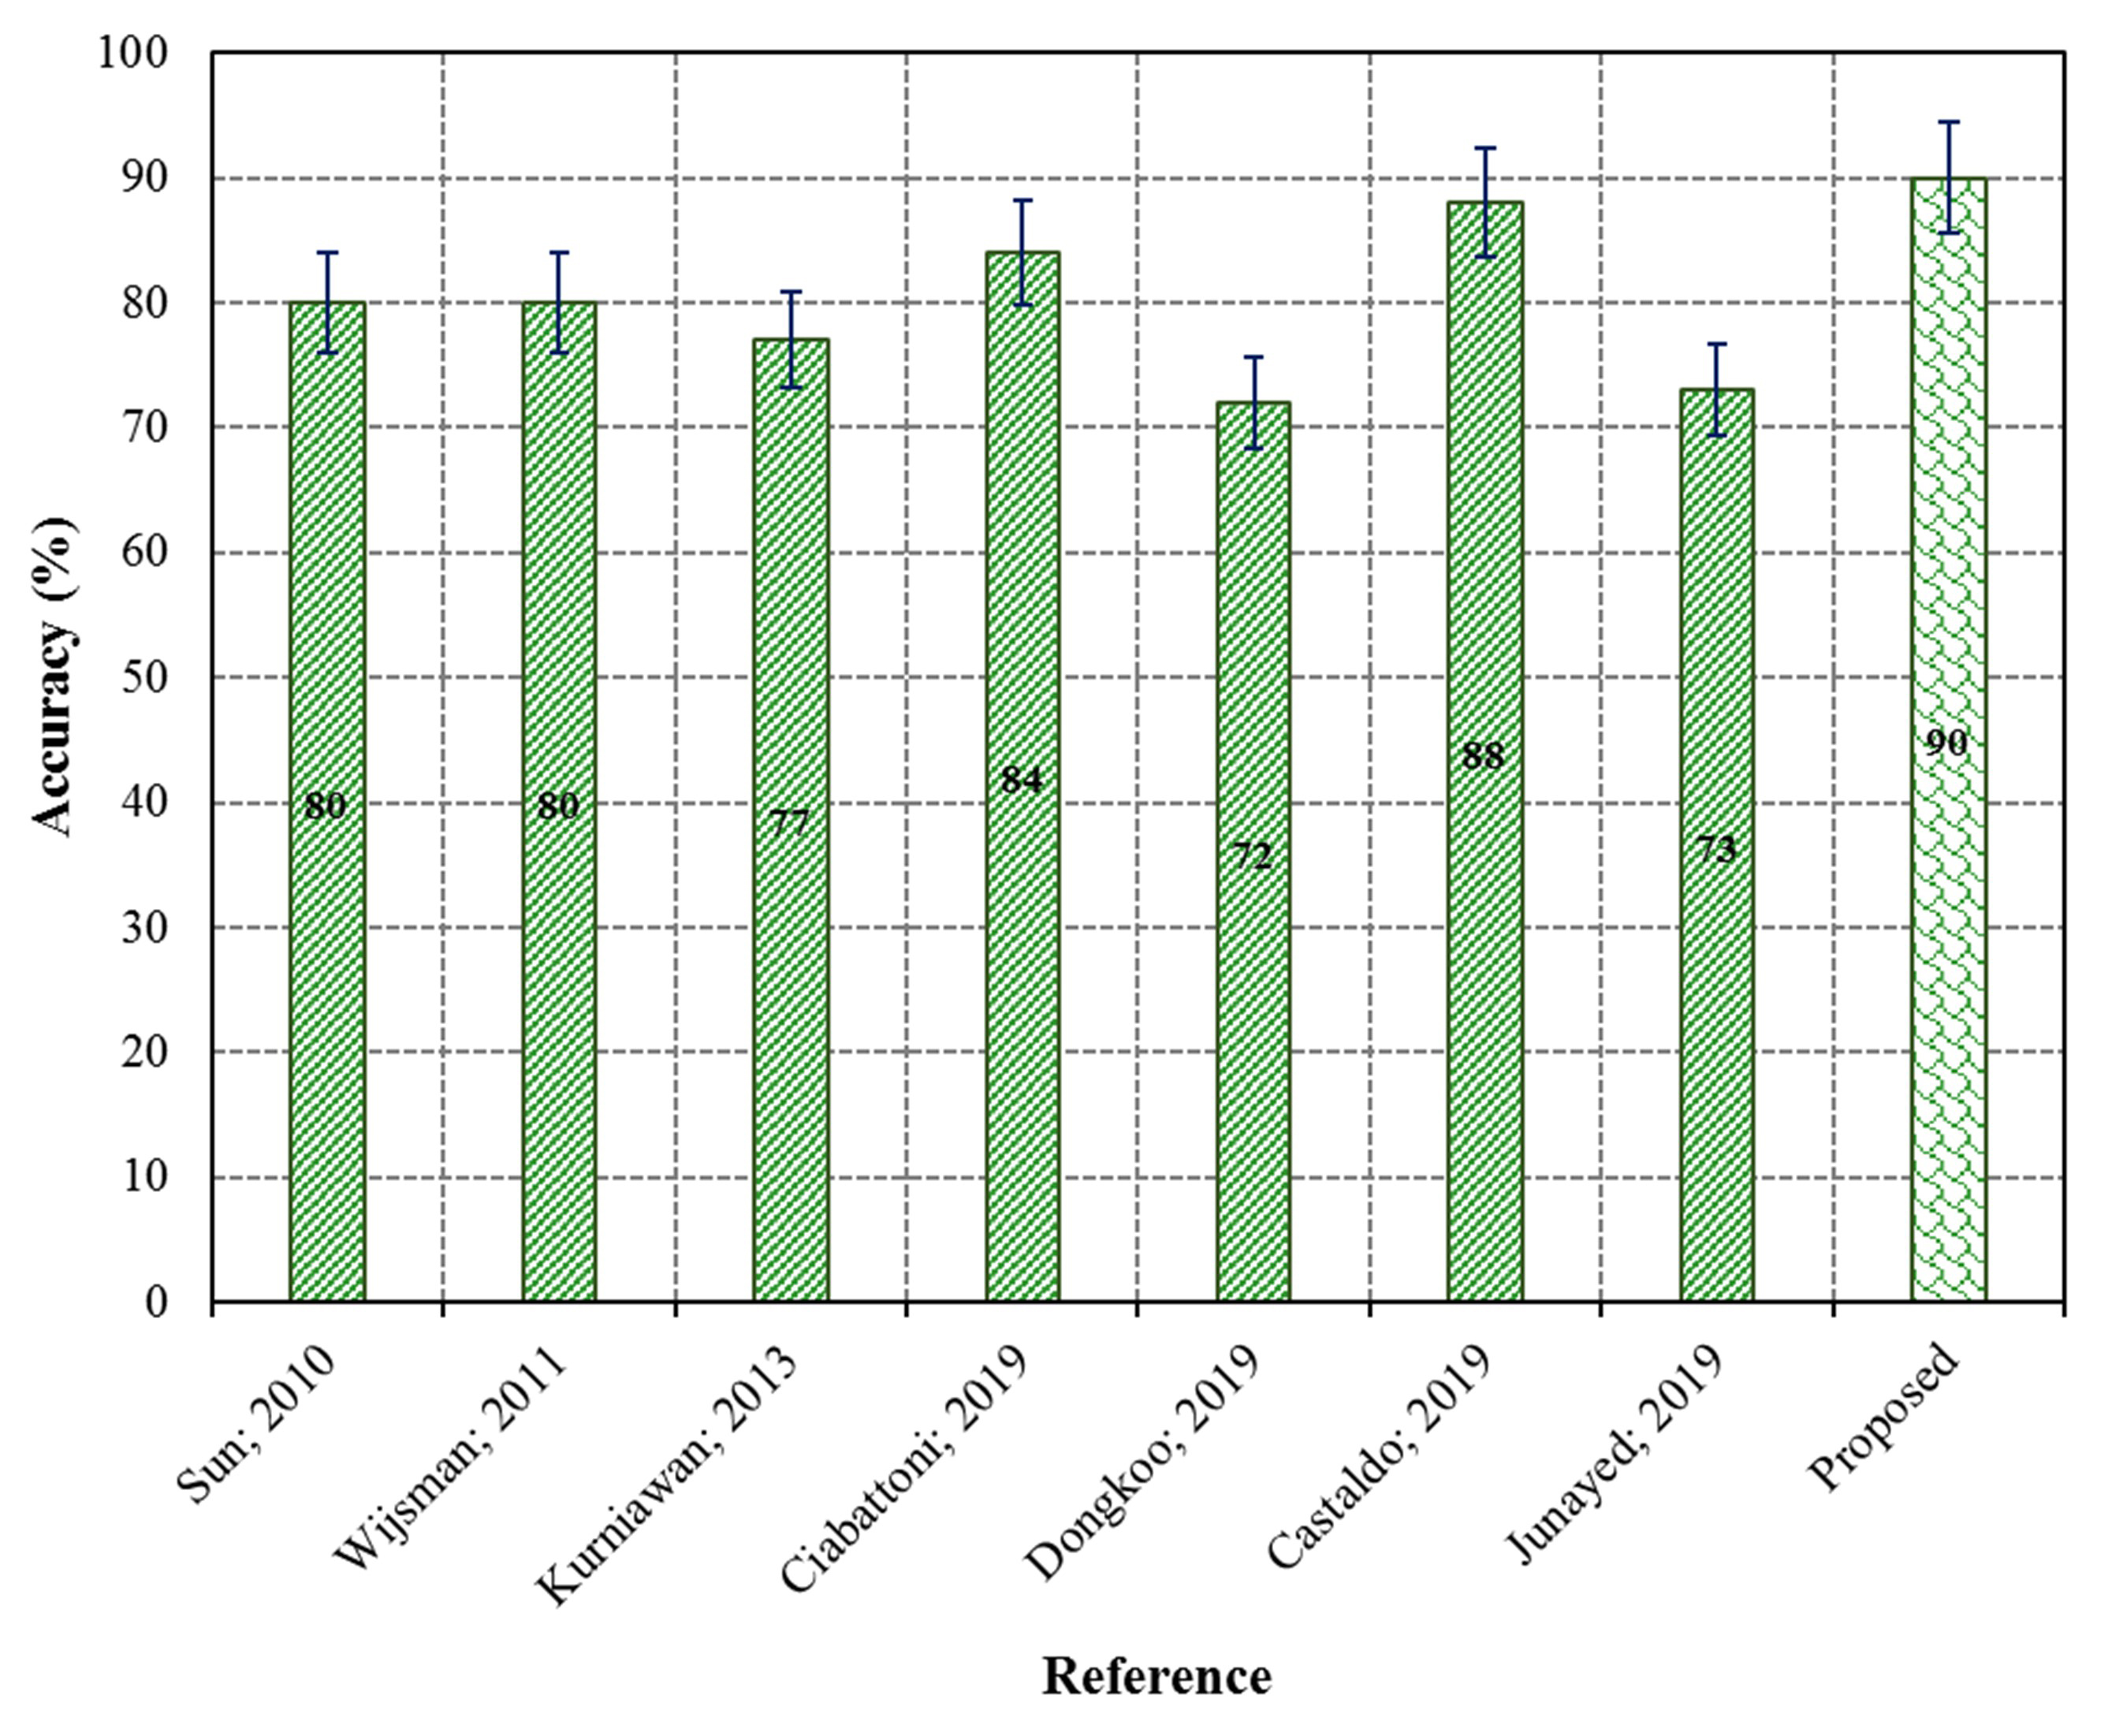 Fig. 7.
Comparison between accuracy of the previously selected and proposed system.
The main advantages of the proposed method are free over fitting, fast, low complexity, high accuracy, simplicity and ease to use. Finally, it could be used as a real-time and continuous monitoring technique [72, 73]. However, one gender research, one modality, and one lobe are the limitation of this study. Moreover, this study is applied only for 14 subjects that might increase the classification accuracy of the study.
Mental stress detection is a key issue for human beings’ health. Importantly, diagnosing and detecting mental stress is vital to prevent its dangerous consequences. In this study, an automatic real-time mental stress detection using frontal lobe EEG signal was proposed. SVM and NB machine learning classifiers are applied on frontal lobe scalp EEG. Importantly, parameters including sensitivity, specificity, accuracy, precision, and area under the curve for the classification of different groups (control and stress) were calculated. Our results showed that the proposed SVM linear classifier has easily identified the stress and control participants with 90% accuracy, which is higher than the related work accuracy. As a future work in this area, we propose to examine the stress through other physiological signals with more extensive experimental data.
AC, alternating current; CPS, Cold Pressor Stress; DASS, Depression, Anxiety and Stress Scale; EEG, Electroencephalogram; EMD, Empirical mode decomposition; EO, Eyes Open; EOG, Electrooculography; FFT, Fast Fourier Transform; GA, Genetic Algorithm; GLDS, Gray Level Different Statistics; IENN, Improved Elman Neural Network; IoMT, internet of medical things; KNN, K-Nearest Neighbors; NB, Naive Bayes; PSE, Power Spectral Entropy; PSD, Power Spectral Density; STFT, Short-Term Fourier Transform; SVM, Support Vector Machine.
OA—conceptualization, validation, and methodology; MM—methodology, review and editing; MBBH—write-up, and simulation; FA—conceptualization, and simulation; HA—data curation and writing; GMA—supervision and funding; AA—investigation, supervision and funding.
This study was approved by the Institutional Review Board (IRB) of Najran University in Saudi Arabia (442-43-37729). A written informed consent was obtained from all subjects before the study.
We thank the Deanship of Scientific Research funded this work (DSR), King Abdulaziz University, Jeddah, Saudi Arabia for their financial support. Also, we thank three anonymous reviewers for excellent criticism of the article.
This project was funded by the Deanship of Scientific Research (DSR), King Abdulaziz University, Jeddah, Saudi Arabia under grant no. KEP-1-141-41. The authors, therefore, acknowledge with thanks DSR technical and financial support.
The authors declare no conflict of interest.