IMR Press / JIN / Volume 20 / Issue 3 / DOI: 10.31083/j.jin2003072
Open Access Brief Report
Relationships among language ability, the arcuate fasciculus and lesion volume in patients with putaminal hemorrhage: a diffusion tensor imaging study
Show Less
1 Department of Physical Medicine and Rehabilitation, College of Medicine, Yeungnam University, 705-717 Namku, Taegu, Republic of Korea
*Correspondence: strokerehab@ynu.ac.kr (Sung Ho Jang)
J. Integr. Neurosci. 2021, 20(3), 677–685; https://doi.org/10.31083/j.jin2003072
Submitted: 29 April 2021 | Revised: 14 May 2021 | Accepted: 22 July 2021 | Published: 30 September 2021
Copyright: © 2021 The Author(s). Published by IMR Press.
This is an open access article under the CC BY 4.0 license (https://creativecommons.org/licenses/by/4.0/).
Abstract

Relationships among language ability, arcuate fasciculus and lesion volume were investigated by use of diffusion tensor tractography in patients with putaminal hemorrhage. Thirty-three right-handed patients within six weeks of hemorrhage onset were recruited. Correlation of the aphasia quotient with subset (fluency, comprehension, repetition, naming) scores, diffusion tensor tractography parameters and lesion volume of patients, aphasia quotient (r = 0.446) with subset (naming: r = 0.489) score had moderate positive correlations with fractional anisotropy of the left arcuate fasciculus. The aphasia quotient subset (repetition) score had a strong positive correlation with fractional anisotropy of the left arcuate fasciculus (r = 0.520), whereas, aphasia quotient subset (fluency and comprehension) scores had no significant correlations with fractional anisotropy of the left arcuate fasciculus after Benjamini–Hochberg correction. Aphasia quotient (r = 0.668) with subset (fluency: r = 0.736, comprehension: r = 0.739, repetition: r = 0.649, naming: r = 0.766) scores had strong positive correlations with the tract volume of the left arcuate fasciculus and strong negative correlations with lesion volume (r = –0.521, fluency: r = –0.520, comprehension: r = –0.513, repetition: r = –0.518, naming: r = –0.562). Fractional anisotropy of the left arcuate fasciculus had a moderate negative correlation with lesion volume (r = –0.462), whereas the tract volume of the left arcuate fasciculus had a strong negative correlation with lesion volume (r = –0.700). According to the result of mediation analysis, tract volume of the left arcuate fasciculus fully mediated the effect of lesion volume on the aphasia quotient. Regarding the receiver operating characteristic curve, the lesion volume cut-off value was 29.17 cm3 and the area under the curve (0.74), sensitivity (0.77) and specificity (0.80) were higher than those of fractional anisotropy, tract volume and aphasia quotient cut-off values. It was found that level of language disability was related to lesion volume as well as to injury severity of arcuate fasciculus in the dominant hemisphere of patients with putaminal hemorrhage. In particular, the tract volume of the arcuate fasciculus in the dominant hemisphere fully mediated the effect of lesion volume on language ability. Additionally, a lesion volume of approximately 30 cm3 was helpful in discriminating arcuate fasciculus discontinuation in the dominant hemisphere.

Keywords
Arcuate fasciculus
Lesion volume
Language ability
Diffusion tensor tractography
Diffusion tensor imaging
1. Introduction

The arcuate fasciculus (AF), an important neural tract for language, connects the posterior superior temporal cortex and posterior part of the inferior frontal gyrus, often referred to as Wernicke’s and Broca’s areas [1]. Injury of the AF such as discontinuation causes various language deficits, including conduction aphasia [2, 3, 4, 5, 6]. Approximately 24–38% of acute stroke patients and 10–18% of chronic stroke patients have been reported to exhibit aphasia [7, 8, 9, 10, 11, 12]. Therefore, precise estimation of the AF state (preserved, discontinued, or non-reconstructed) during the early stage of a stroke is clinically important as it would help clinicians design rehabilitative strategies and predict aphasia outcome. Additionally, such estimates provide useful data for determining the necessity of surgical intervention during the acute stage of intracerebral hemorrhage. Putaminal hemorrhage is the most common type of intracerebral hemorrhage as the putamen is the site most involved with that type of hemorrhage as a hematoma can expand to the internal capsule, corona radiata, centrum semiovale, or temporal lobe [13]. Conservative treatment is considered when a hematoma is smaller than 10 cm3, whereas surgery such as craniotomy and ventriculoperitoneal shunt is considered with moderate neurologic deficits or a hematoma larger than 30 cm3[14]. Putaminal hemorrhage with large lesion volume (LV) in the dominant hemisphere may cause both language deficits including conduction aphasia and effect change in the microstructure of the AF [15, 16]. However, precise estimation of the AF affected by the LV of putaminal hemorrhage had been limited because conventional brain imaging techniques, such as computed tomography or magnetic resonance imaging, do not clearly discriminate the AF from adjacent white matter [1, 17].

The development of diffusion tensor imaging, which produces images based on measurements of the diffusion of water molecules in structures, has allowed investigation of the overall microstructural characteristics of brain white matter. In particular, diffusion tensor tractography in human brain tissue, derived from diffusion tensor imaging, enables three-dimensional reconstruction and visualization of structures, including the AF [18, 19]. Several diffusion tensor tractography based studies have demonstrated relationships between language ability and the severity of AF injury in the dominant hemisphere in stroke patients [20, 21, 22, 23, 24]. However, currently those relationships have not been fully elucidated. In particular, the relationships between LV, language ability and the state of the AF in the dominant hemisphere require characterization.

In this study, by using diffusion tensor tractography, the relationships among language ability, the AF state in the dominant hemisphere and LV were investigated in patients with putaminal hemorrhage.

2. Methods
2.1 Subjects

Thirty-three right-handed consecutive subjects with putaminal hemorrhage (23 men, 10 women; mean age 50.49 ± 9.68 years; range, 28~67 years) were recruited according to the following inclusion criteria: (1) first-ever stroke; (2) age: 20–69 years; (3) spontaneous putaminal hemorrhage confirmed by a neuroradiologist; (4) diffusion tenor imaging scanning and language evaluation performed within six weeks of hemorrhage onset; and (5) no previous history of psychiatric or neurological disease [25]. The left hemisphere is assumed to be the language dominant hemisphere in right-handed subjects [26]. Table 1 summarizes the demographic and clinical characteristics of the subjects. This study was performed retrospectively and the study protocol was approved by the institutional review board of the Yeungnam University Hospital (YUMC 2021-03-014).

Table 1.Demographic and clinical characteristics of subjects.
Subjects
Age (years) 50.49 ± 9.68
Number (n) 33
Male:Female 23:10
Mean duration to AQ (days) 18.36 ± 9.03
Mean duration to DTI (days) 18.36 ± 9.03
AQ value 47.38 ± 36.78
FA 0.42 ± 0.04
TV 832.12 ± 488.06
LV (cm3) 29.1 ± 20.38
AQ, aphasia quotient; DTI, diffusion tensor imaging; FA, fractional anisotropy; TV, tract volume; LV, lesion volume; Values presented are mean ± standard deviation.
2.2 Language evaluation

The aphasia quotient (AQ) of the Western Aphasia Battery was used to assess the language ability of subjects (range, 0–100 percentiles). The AQ value comprises four subset scores (fluency, comprehension, repetition and naming) and higher scores indicate better function [27]. The reliability and validity of the Western Aphasia Battery has been well established [27, 28]. Subject AQ scores were obtained at an average of 18.4 ± 9 days after putaminal hemorrhage onset.

2.3 Lesion volume measurement

Brain LV was determined by examination of a T2-weighted turbo single echo (TSE) sequence in brain magnetic resonance images (18.4 ± 9 days after onset) and each subject LV was calculated by applying the following formula: [A (cm) × B (cm) × C (cm)]/2 (A: lesion length; B: width at the largest cross-sectional area; C: total height from the bottom to top slices showing the hematoma) [29]. Representative LV measurement images are presented in Fig. 1.

Fig. 1.

Result of lesion volume measurement by applying the following formula: [A (cm) × B (cm) × C (cm)]/2 (A: lesion length; B: width at the largest cross-sectional area; C: total height from the bottom to top slices showing the hematoma). (A) Representative lesion volume measurement larger than 29.17 cm3 (patient 1: 49-year-old male). (B) Representative lesion volume measurement smaller than 29.17 cm3 (patient 2: 44-year-old female).

2.4 Diffusion tensor imaging and tractography

Diffusion tensor imaging data were acquired on the same day as the language (AQ) evaluation (18.4 ± 9 days after PH onset). Diffusion tensor imaging was performed using a sensitivity-encoding head coil on a 1.5 T Philips Gyroscan Intera (Hoffman-LaRoche Ltd, Best, Netherlands) scanner with single-shot echo-planar imaging and navigator echo. Sixty contiguous slices (acquisition matrix = 96× 96; reconstruction matrix = 192× 192; field of view = 240 mm ×240 mm; TR = 10.726 ms; TE = 76 ms, b = 1000 s/mm2, NEX = 1 and thickness = 2.5mm) were acquired for each of the 32 noncollinear diffusion-sensitizing gradients. Eddy current image distortion, head motion effects and B0 inhomogeneity distortion were corrected using affine multi-scale two-dimensional registration with the Oxford Centre for Functional Magnetic Resonance Imaging of Brain (FMRIB) Software Library (FSL: www.fmrib.ox.ac.uk/fsl) [30]. Evaluation of the AF was obtained with DTI Studio software (CMRM, Johns Hopkins Medical Institute, Baltimore, Maryland) based on the fiber assignment continuous tracking (FACT) algorithm. For tracking of the AF, the seed region of interest was assigned manually to the posterior parietal area of the superior longitudinal fascicle where the longitudinal aspect of the AF is expected, while the target region of interest was located in the posterior temporal lobe [1, 17, 31, 32]. The color map of the seed region of interest was green (rostral–caudal) and the target region of interest was blue (superior–inferior). Termination criteria used for fiber tracking were fractional anisotropy (FA) <0.2 and angle <60[31, 32].

2.5 Statistical analysis

Statistical analysis was performed using SPSS 21.0 for Windows (SPSS, Chicago, IL, USA). Multiple comparisons were corrected by the Benjamini–Hochberg (BH) procedure to control the false discovery rate [33]. Pearson correlation analysis was used to estimate the significance of the correlations among AQ values with subset (fluency, comprehension, repetition, and naming) scores, diffusion tensor tractography parameters (FA: fractional anisotropy; TV: tract volume) and LV; p < 0.05 and false discovery rate cut off <0.05 were considered statistically significant. The correlation coefficient indicates the strength (0.1–0.29: weak correlation; 0.3–0.49: moderate correlation; more than 0.50: strong correlation) and direction (positive or negative) of the relationship between two variables [34]. Mediation analyses were used to determine whether the TV value of the left AF mediates the relationship between the AQ value and LV. According to the Baron and Kenny [35] mediational model, the mediating role of a variable exists when the following conditions met: (1) the first step, the independent variable (LV) significantly affects the mediator variable (TV); (2) the second step, the independent variable (LV) significantly affects the dependent variable (AQ) ; (3) the third step, the independent variable (LV) and mediator variable (TV) simultaneously and significantly affect the dependent variable (AQ) and the standardized β is greater in the second step than in the third step, and R2 indicates the coefficient of determination increases sequentially. In the third step, perfect mediation occurs when the independent variable does not significantly affect the dependent variable, on the other hand, partial mediation occurs when the standardized β of the independent variable in the third step is less than that in the second step [35]. The Sobel test was used to assess the significance of the mediation effect [35, 36]. The sensitivity, specificity and area under the curve of the AQ with subset (fluency, comprehension, repetition and naming) scores, diffusion tensor tractography parameters and LV values were used to assess discontinuations of the left AF between Wernicke’s and Broca’s areas and were determined by examining the receiver operating characteristic curves. This curve reveals the diagnostic ability of a binary classifier system based on an identification threshold generated by displaying the true-positive rate for the false-positive rate at the threshold setting [37]. The sensitivity, known as the true-positive rate, represents the ability of a test to correctly identify patients with a disease, while the specificity, known as the 1–false-positive rate, indicates the ability of a test to correctly identify people without the disease [37, 38]. The area under the curve was used to indicate test accuracy (1.0: perfect test; 0.99–0.90: excellent test; 0.89–0.80: good test; 0.79–0.70: fair test; 0.69–0.51: poor test; 0.50 or lower: fail) [39].

3. Results

In diffusion tensor tractography findings, 13 subjects showed a discontinuation of the left AF, while 20 subjects exhibited an intact left AF. Correlations among the AQ values with subset scores, diffusion tensor tractography parameters and the LV of subjects are summarized in Table 2. Moderate positive correlations were detected between the AQ value (r = 0.446) with subset (naming: r = 0.489) score and the FA value of the left AF (p
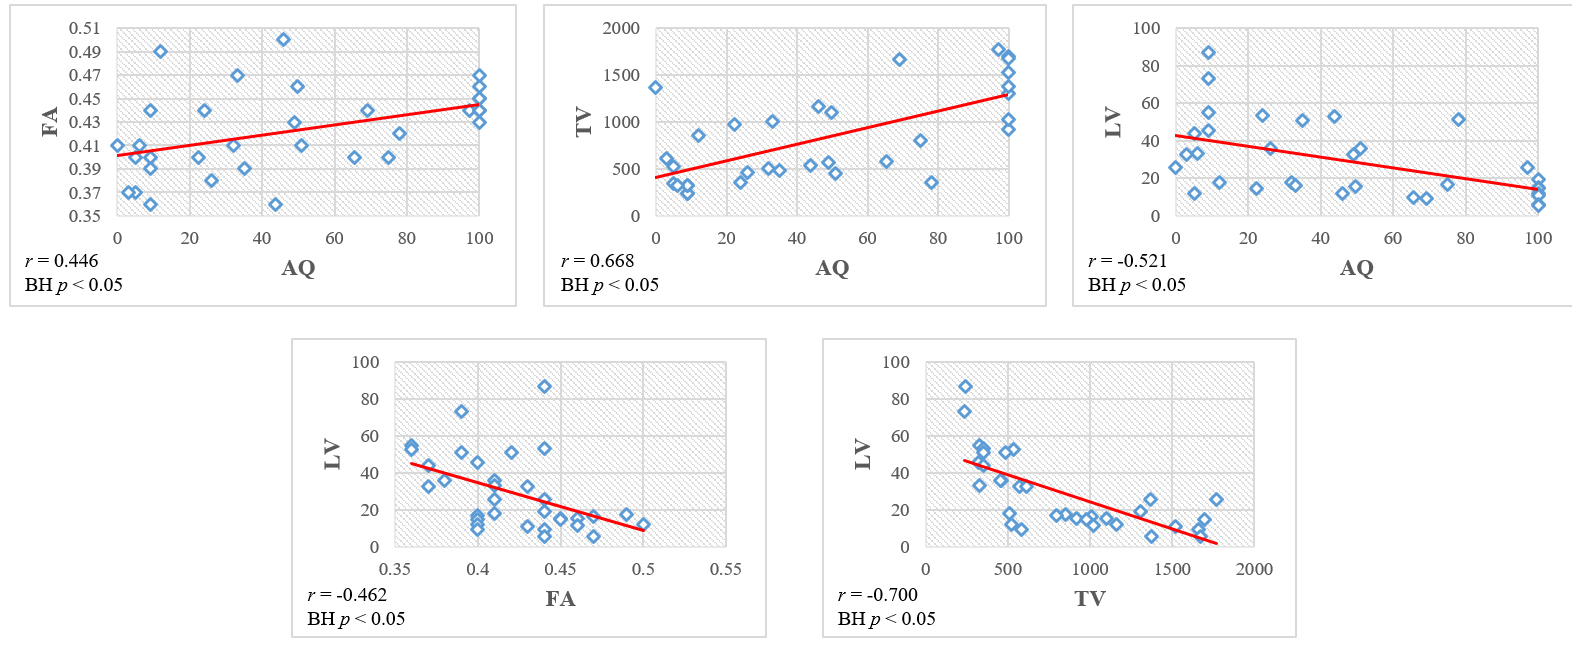
 < 0.05, BH p < 0.05). The AQ subset (repetition) score showed a strong positive correlation with the FA value of the left AF (r = 0.520, p < 0.05, BH p < 0.05). After BH correction, the AQ subset (fluency and comprehension) scores showed no significant correlations with the FA value of the left AF (fluency: r = 0.388, comprehension: r = 0.370, p < 0.05, BH). On the other hand, the AQ value (r = 0.668) with subset (fluency: r = 0.736, comprehension: r = 0.739, repetition: r = 0.649, naming: r = 0.766) scores showed strong positive correlations with the TV of the left AF and strong negative correlations with LV (r = –0.521, fluency: r = –0.520, comprehension: r = –0.513, repetition: r = –0.518, naming: r = –0.562, p < 0.05, BH p < 0.05). A moderate negative correlation was detected between the FA value of the left AF and the LV (r = –0.462, p < 0.05, BH p < 0.05). By contrast, the TV of the left AF showed a strong negative correlation with the LV (r = –0.700, p < 0.05, BH p < 0.05). The scatter plots of the correlation among the AQ values, diffusion tensor tractography parameters and LV of the subjects are presented in Fig. 2. The results of analysis of the role of the TV as a mediator of the relationship between the AQ and LV are summarized in Table 3. In the first step, the LV showed a significant association with TV (t = –5.455, p < 0.05). In the second step, LV showed a significant association with the AQ (t = –3.401, p < 0.05). In the third step, the LV showed no significant association with the AQ (t = –0.559), while the TV showed a significant association with the AQ (t = 3.135, p < 0.05). In summary, the TV fully mediated the relationship between the AQ and LV (Fig. 3). Moreover, the Sobel test for this mediation analysis showed the TV to have a significant mediation effect between the AQ and LV (z = –2.796, p < 0.05). The results of the receiver operating characteristic analyses of the AQ value with subset scores, diffusion tensor tractography parameters and the LV of the patients are summarized in Table 4. The cut-off value (area under the curve) was 34.05 (0.14) for AQ, 36.00 (0.09) for AQ subset (naming) score, 41.75 (0.13) for AQ subset (comprehension) score, 50.15 (0.05) for AQ subset (repetition) score, 29.30 (0.06) for AQ subset (naming) score, 0.42 (0.10) for FA, 575.50 (0.14) for TV and 29.17 cm3 (0.74) for LV. The sensitivity of the LV cut-off value (0.77) was higher than for AQ (0.23), AQ subset scores (fluency: 0.23, comprehension: 0.15, repetition: 0.15, naming: 0.23), FA (0.15) and TV (0.23). The specificity of the LV cut-off value (0.80) was higher than for AQ (0.25) and AQ subset scores (fluency: 0.25, comprehension: 0.20, repetition: 0.20, naming: 0.25), FA (0.25) and TV (0.25). Representative regions of interest and diffusion tensor tractography images showing AF status in patients with different LV are presented in Fig. 4.

Fig. 2.

Scatter plots of the correlation among the aphasia quotient (AQ) values, diffusion tensor tractography parameters (FA: fractional anisotropy; TV: tract volume) and lesion volume (LV) of subjects.
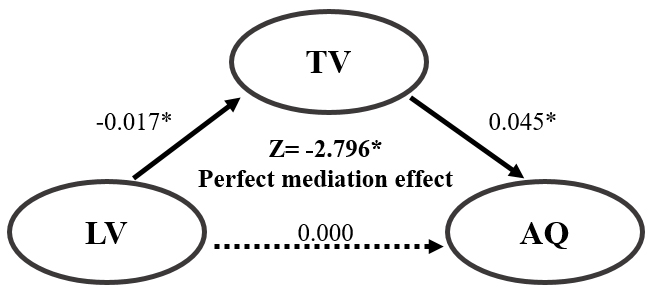
Fig. 3.

Mediation analysis of the role of the tract volume (TV) as a mediator of the relationship between the aphasia quotient (AQ) and lesion volume (LV). * p < 0.05.

Fig. 4.

Regions of interest and diffusion tensor tractography for the arcuate fasciculus (AF). (A) The seed and target regions of interest are applied to the posterior parietal area of the superior longitudinal fascicle where the longitudinal aspect of the AF and the posterior temporal lobe are expected. (B) (1) T2-weighted brain magnetic resonance images at the time of diffusion tensor imaging scanning in representative patients with a lesion volume (LV) larger than 29.17 cm3 (patient 1: 43-year-old male, patient 2: 46-year-old male, patient 3: 59-year-old male) and with an LV smaller than 29.17 cm3 (patient 4: 56-year-old male, patient 5: 33-year-old male, patient 6: 63-year-old male). (2) Results of diffusion tensor tractography for the left AF. The left AF in patients with an LV larger than 29.17 cm3 shows discontinuation (green arrow) between Wernicke’s and Broca’s areas in the dominant hemisphere, whereas the left AF in patients with an LV smaller than 29.17cm3shows preservation of AF integrity.

Table 2.Correlations between the aphasia quotient value with subset scores and diffusion tensor tractography parameters and lesion volume of the patients.
AQ (total) FA TV LV
AQ (total) r-value - 0.446 0.668 –0.521
p-value 0.009* 0.000* 0.002*
BH p-value 0.017** 0.003** 0.008**
AQ (fluency) r-value - 0.388 0.736 –0.520
p-value 0.026* 0.000* 0.002*
BH p-value 0.019 0.003** 0.008**
AQ (comprehension) r-value - 0.370 0.739 –0.513
p-value 0.034* 0.000* 0.002*
BH p-value 0.022 0.003** 0.008**
AQ (repetition) r-value - 0.520 0.649 –0.518
p-value 0.002* 0.000* 0.002*
BH p-value 0.008** 0.003** 0.008**
AQ (naming) r-value - 0.489 0.766 –0.562
p-value 0.004* 0.000* 0.001*
BH p-value 0.011** 0.003** 0.006**
LV r-value –0.521 –0.462 –0.700 -
p-value 0.002* 0.007* 0.000*
BH p-value 0.008** 0.014** 0.003**
AQ, aphasia quotient; FA, fractional anisotropy; TV, tract volume; LV, lesion volume; *: correlation is significant at p < 0.05, **: correlation is significant using a Benjamini–Hochberg (BH) correction.
Table 3.Mediation analysis of the role of the tract volume as a mediator of the relationship between the aphasia quotient and lesion volume.
Step Dependent variable Independent variable B SE β t p R2
1 TV LV –0.017 0.003 –0.700 –5.455 0.000* 0.490
2 AQ LV –0.001 0 –0.521 –3.401 0.002* 0.272
3 AQ LV 0.000 0.000 –0.106 –0.559 0.580 0.451
TV 0.045 0.014 0.593 3.135 0.004*
Sobel test –2.796 < –1.96*
TV, tract volume; LV, lesion volume; AQ, aphasia quotient, *: p < 0.05.
Table 4.Receiver operating characteristic curve results of the aphasia quotient value with subset scores, diffusion tensor tractography parameters and lesion volume for discriminating discontinuation of the left arcuate fasciculus.
Cut-off value AUC Sensitivity Specificity
AQ (total) 34.05 0.14 0.23 0.25
AQ (fluency) 36.00 0.09 0.23 0.25
AQ (comprehension) 41.75 0.13 0.15 0.20
AQ (repetition) 50.15 0.05 0.15 0.20
AQ (naming) 29.30 0.06 0.23 0.25
FA 0.42 0.10 0.15 0.25
TV 575.50 0.14 0.23 0.25
LV 29.17 0.74 0.77 0.80
AUC, area under the curve; AQ, aphasia quotient; FA, fractional anisotropy; TV, tract volume; LV, lesion volume.
4. Discussion

This study investigated the relationships among language ability, the AF state in the dominant hemisphere, and LV in patients with putaminal hemorrhage. Results can be summarized as follows. First, the AQ value with subset (naming) score had moderate positive correlations with the FA value of the left AF. The AQ subset (repetition) score had a strong positive correlation with the FA value of the left AF, the AQ subset (fluency and comprehension) score had no significant correlations with the FA value of the left AF. By contrast, the AQ value with subset (fluency, comprehension, repetition, and naming) scores had a strong positive correlation with the TV value of the left AF, and a strong negative correlation with the LV. The FA value of the left AF had a moderate negative correlation with the LV, whereas the TV value of the left AF had a strong negative correlation with the LV. Second, the TV value of the left AF fully mediated the effect of the LV on the AQ value. Third, the LV cut-off value was 29.17 cm3 and its area under the curve, sensitivity and specificity were higher than those of the FA, TV, and AQ cut-off values.

Regarding the assessed diffusion tensor tractography parameters, the FA value is indicative of the integrity of white matter microstructures, such as axons, myelin and microtubules and represents the degree of directionality of water diffusion [18]. Therefore, the FA value reflects the fiber density, axonal diameter and white matter myelination [40]. The TV value indicates the average volume of a neural tract including the total number and thickness of neural fiber and white matter microstructures such as myelin, oligodendrocytes and dendrites obtained by probabilistic tractography segmentation [40, 41]. Therefore, low FA and TV values for a neural structure represent low structure density, diameter, axonal myelination and low fiber numbers and thickness of the neural tract, respectively [18, 40]. Consequently, the result showing a moderate positive correlation between the AQ value with subset (naming) score and the FA value of the left AF indicates that language ability (especially, the naming ability) is closely related to the fiber density, axonal diameter and myelination of the left AF. By contrast, the strong positive correlations between the AQ subset (repetition) score and the FA value of the left AF and between the AQ value with subset (fluency, comprehension, repetition, and naming) scores and the TV value of the left AF suggest that repetition ability is more closely associated with fiber density, axonal diameter and myelination of the left AF than the other language (fluency, comprehension, and naming) abilities, and comprehensive language ability is more closely associated with the remaining number and thickness of neural fibers within the left AF than with the fiber density, axonal diameter and myelination of the left AF. Consequently, this suggests that the level of language disability is closely related to injury severity of the left AF. On the other hand, the correlations of the LV with the AQ value with subset (fluency, comprehension, repetition, and naming) scores (strong negative), FA value (moderate negative) of the left AF and TV value of the left AF (strong negative) suggest that the size of the lesion negatively affects comprehensive language ability and the density, diameter, axonal myelination, number and thickness of the remaining neural fibers of the left AF. Considering the significance of these correlations, language ability and the remaining neural fibers and thickness of the left AF are more affected by LV than by AF density, diameter and myelination. Thus, LV is closely related to language disability and severity of AF injury.

Mediation analysis showed that the TV value of the left AF fully mediated the relationship between the AQ value and LV. This indicates that the effect of the LV on the language ability operates through the TV value of the left AF. It suggests that surgical intervention to remove a relevant hematoma considering the TV value of the left AF is necessary to maximize the recovery of language ability in the early stage of putaminal hemorrhage.

The receiver operator analysis suggest that an LV cut-off value of 29.17 cm3 with a sensitivity of 77% and specificity of 80% can be used to identify AF discontinuation between Wernicke’s and Broca’s areas in the dominant hemisphere with good predictive accuracy. By contrast, the AQ with subset (fluency, comprehension, repetition, and naming) scores, FA and TV cut-off values have no discriminatory ability to predict discontinuation of the left AF. Further, it seems that the LV has a direct effect on AF discontinuation in the dominant hemisphere when compared to the comprehensive language ability, integrity, and fiber numbers of the AF.

Previous studies using brain mapping techniques, have reported that a patient’s language ability, such as speech rate, informativeness, efficiency, fluency and naming ability, could be predicted at the chronic stage by the lesion load (a variable combining LV and lesion site) of the AF in the dominant hemisphere [42, 43, 44, 45]. Moreover, several diffusion tensor tractography-based studies have demonstrated that language ability is related to the injury severity of the AF in the dominant hemisphere in stroke patients [20, 21, 22, 23, 24]. Breier et al. [20] have reported that speech-repetition ability was associated with the FA value of the AF in the dominant hemisphere in stroke (hemorrhage and ischemia) patients at the chronic stage. Kim et al. [21] observed that AQ values were higher in stroke (hemorrhage and ischemia) patients with preserved integrity of the AF in the dominant hemisphere than in those patients with a non-reconstructed or disrupted AF at the early stage after onset. Tak et al. [22] demonstrated that the AQ value was positively correlated with the TV value of the AF in the dominant hemisphere in chronic stroke patients and was higher if the integrity of the AF in the dominant hemisphere was preserved. Wang et al. [23] reported that speech-repetition disability within six months of onset was related to a low FA value for the AF in the dominant hemisphere in stroke (hemorrhage and ischemia) patients. Subsequently, Noh et al. [2021] reported that the AQ value and an AQ subset score (naming) were positively correlated with the FA value of the AF in the dominant hemisphere and the AQ subset scores for fluency, repetition and naming were negatively correlated with LV in stroke (hemorrhage and ischemia) patients at the early stage (within two months of onset) [24]. However, to the best of the author’s knowledge, the present study is the first to demonstrate a relationship between language ability and LV and report a quantitative LV value helpful in discriminating discontinuation of the left AF. A relationship is also described between language ability and diffusion tensor tractography parameters of the AF in the dominant hemisphere in the early stage of putaminal hemorrhage.

4.1 Limitation and further research directions

Some limitations of this study should be considered. First, diffusion tensor tractography analysis is operator-dependent and thus can elicit false-positive and false-negative results, mainly due to areas of crossing fibers or the partial volume effect [46]. Second, although the language dominant hemisphere is assumed to be the left hemisphere, the functional localization of individual language dominance was not confirmed. Third, only a small number of subjects were enrolled in this study. Fourth, diffusion tensor imaging scanning was performed during the early stage of putaminal hemorrhage. If diffusion tensor imaging scanning was performed during the acute or subacute stages, those results might be useful when deciding on the necessity of surgical intervention to preserve the AF in the dominant hemisphere. Fifth, because the AF might consist of anterior, posterior and long segments, the location of regions of interest of the AF may be controversial [47]. Sixth, although the AF is related to language ability, there are other neural tracts such as the superior longitudinal fasciculus, uncinate fasciculus and extreme capsule related to language function that are affected by putaminal hemorrhage. Hence, further prospective studies that include assessment of the functional localization of the language dominance, large numbers of subjects, acute or subacute stage diffusion tensor imaging scanning, precise placement of region of interests of the AF, and additional neural tracts related to language ability are encouraged.

5. Conclusions

The use of diffusion tensor tractography allowed the conclusion that language disability was closely related to LV and to the severity of the AF injury in the dominant hemisphere in subjects with putaminal hemorrhage. In particular, the TV value of the AF in the dominant hemisphere fully mediated the effect of the LV on language ability. Additionally, following putaminal hemorrhage, an LV of approximately 30 cm3 can differentiate a discontinuation of the AF in the dominant hemisphere. Results suggest that an LV cut-off value of 29.17 cm3 may be clinically helpful in predicting AF discontinuation in the dominant hemisphere and when considering surgical intervention to remove a relevant hematoma. This suggestion is consistent with management guidelines for putaminal hemorrhage considering surgical intervention when the LV of putaminal hemorrhage is larger than 30 cm3. Specifically, when the LV of putaminal hemorrhage is larger than 29.17 cm3, the prognosis is for language disability.

Abbreviations

AF, arcuate fasciculus; LV, lesion volume; AQ, aphasia quotient; FA, fractional anisotropy; TV, tract volume; BH, Benjamini–Hochberg.

Author contributions

MJC and SHJ designed the research study. MJC performed the research. SHJ provided help and advice on the study. MJC analyzed the data. MJC and SHJ wrote the manuscript. All authors contributed to editorial changes in the manuscript. All authors read and approved the final manuscript.

Ethics approval and consent to participate

All participants signed a written informed consent beforehand, which abided by the Helsinki Declaration.

Acknowledgment

Not applicable.

Funding

This work was supported by the National Research Foundation of Korea (NRF) grant funded by the Korean Government (MSIP) (No. 2021R1A2B5B01001386).

Conflict of interest

The authors declare no conflict of interest.

References
[1]
Dick AS, Tremblay P. Beyond the arcuate fasciculus: consensus and controversy in the connectional anatomy of language. Brain. 2012; 135: 3529–3550.
[2]
Benson DF, Sheremata WA, Bouchard R, Segarra JM, Price D, Geschwind N. Conduction aphasia. a clinicopathological study. Archives of Neurology. 1973; 28: 339–346.
[3]
Anderson JM, Gilmore R, Roper S, Crosson B, Bauer RM, Nadeau S, et al. Conduction Aphasia and the Arcuate Fasciculus: a Reexamination of the Wernicke–Geschwind Model. Brain and Language. 1999; 70: 1–12.
[4]
Bartha L, Benke T. Acute conduction aphasia: an analysis of 20 cases. Brain and Language. 2003; 85: 93–108.
[5]
Catani M, Mesulam M. The arcuate fasciculus and the disconnection theme in language and aphasia: History and current state. Cortex. 2008; 44: 953–961.
[6]
Bernal B, Ardila A. The role of the arcuate fasciculus in conduction aphasia. Brain. 2009; 132: 2309–2316.
[7]
Wade DT, Hewer RL, David RM, Enderby PM. Aphasia after stroke: natural history and associated deficits. Journal of Neurology, Neurosurgery, and Psychiatry. 1986; 49: 11–16.
[8]
Pedersen PM, Stig Jørgensen H, Nakayama H, Raaschou HO, Olsen TS. Aphasia in acute stroke: Incidence, determinants, and recovery. Annals of Neurology. 1995; 38: 659–666.
[9]
Robey RR. A metanalysis of clinical outcomes in the treatment of aphasia. Journal of Speech, Language, and Hearing Research. 1998; 41: 172–187.
[10]
Laska AC, Hellblom A, Murray V, Kahan T, Von Arbin M. Aphasia in acute stroke and relation to outcome. Journal of Internal Medicine. 2001; 249: 413–422.
[11]
Berthier ML. Poststroke Aphasia: epidemiology, pathophysiology and treatment. Drugs & Aging. 2005; 22: 163–182.
[12]
Engelter ST, Gostynski M, Papa S, Frei M, Born C, Ajdacic-Gross V, et al. Epidemiology of Aphasia Attributable to first Ischemic Stroke: Incidence, Severity, Fluency, Etiology, and Thrombolysis. Stroke. 2006; 37: 1379–1384.
[13]
Goetz CG. Textbook of clinical neurology. 3rd edn. Saunders Elsevier: Philadelphia. 2007.
[14]
Kim JE, Ko SB, Kang HS, Seo DH, Park SQ, Sheen SH, et al. Clinical practice guidelines for the medical and surgical management of primary intracerebral hemorrhage in Korea. Journal of Korean Neurosurgical Society. 2014; 56: 175–187.
[15]
Grotta JC, Albers GW, Broderick JP, Day AL, Kasner SE, Lo EH, et al. Stroke: pathophysiology, diagnosis, and management. 6th edn. Elsevier: Amsterdam. 2015.
[16]
Ryu H, Park CH. Structural characteristic of the arcuate fasciculus in patients with fluent aphasia following intracranial hemorrhage: a diffusion tensor tractography study. Brain Science. 2020; 10: 280.
[17]
Makris N, Kennedy DN, McInerney S, Sorensen AG, Wang R, Caviness VS, et al. Segmentation of Subcomponents within the Superior Longitudinal Fascicle in Humans: a Quantitative, in Vivo, DT-MRI Study. Cerebral Cortex. 2005; 15: 854–869.
[18]
Mori S, Crain BJ, Chacko VP, Van Zijl PCM. Three-dimensional tracking of axonal projections in the brain by magnetic resonance imaging. Annals of Neurology. 1999; 45: 265–269.
[19]
Behrens TEJ, Berg HJ, Jbabdi S, Rushworth MFS, Woolrich MW. Probabilistic diffusion tractography with multiple fibre orientations: what can we gain? NeuroImage. 2007; 34: 144–155.
[20]
Breier JI, Hasan KM, Zhang W, Men D, Papanicolaou AC. Language dysfunction after stroke and damage to white matter tracts evaluated using diffusion tensor imaging. American Journal of Neuroradiology. 2008; 29: 483–487.
[21]
Kim SH, Jang SH. Prediction of aphasia outcome using diffusion tensor tractography for arcuate fasciculus in stroke. American Journal of Neuroradiology. 2013; 34: 785–790.
[22]
Tak HJ, Jang SH. Relation between aphasia and arcuate fasciculus in chronic stroke patients. BMC Neurology. 2014; 14: 46.
[23]
Wang H, Li SQ, Dai YH, Yu QW. Correlation between speech repetition function and the arcuate fasciculus in the dominant hemisphere detected by diffusion tensor imaging tractography in stroke patients with aphasia. Medical Science Monitor. 2020; 26: e928702.
[24]
Noh JS, Lee S, Na Y, Cho M, Hwang YM, Tae W, et al. Integrity of arcuate fasciculus is a good predictor of language impairment after subcortical stroke. Journal of Neurolinguistics. 2021; 58: 100968.
[25]
Oldfield RC. The assessment and analysis of handedness: the Edinburgh inventory. Neuropsychologia. 1971; 9: 97–113.
[26]
Knecht S, Dräger B, Deppe M, Bobe L, Lohmann H, Flöel A, et al. Handedness and hemispheric language dominance in healthy humans. Brain. 2000; 123: 2512–2518.
[27]
Kim H, Na DL. Normative data on the Korean version of the Western Aphasia Battery. Journal of Clinical and Experimental Neuropsychology. 2004; 26: 1011–1020.
[28]
Shewan CM, Kertesz A. Reliability and validity characteristics of the Western Aphasia Battery (WAB). Journal of Speech and Hearing Disorders. 1980; 45: 308–324.
[29]
Kothari RU, Brott T, Broderick JP, Barsan WG, Sauerbeck LR, Zuccarello M, et al. The ABCs of measuring intracerebral hemorrhage volumes. Stroke. 1996; 27: 1304–1305.
[30]
Smith SM, Jenkinson M, Woolrich MW, Beckmann CF, Behrens TEJ, Johansen-Berg H, et al. Advances in functional and structural MR image analysis and implementation as FSL. NeuroImage. 2004; 23: S208–S219.
[31]
Nucifora PGP, Verma R, Melhem ER, Gur RE, Gur RC. Leftward asymmetry in relative fiber density of the arcuate fasciculus. NeuroReport. 2005; 16: 791–794.
[32]
Vernooij MW, Smits M, Wielopolski PA, Houston GC, Krestin GP, van der Lugt A. Fiber density asymmetry of the arcuate fasciculus in relation to functional hemispheric language lateralization in both right- and left-handed healthy subjects: a combined fMRI and DTI study. NeuroImage. 2007; 35: 1064–1076.
[33]
Benjamini Y, Drai D, Elmer G, Kafkafi N, Golani I. Controlling the false discovery rate in behavior genetics research. Behavioural Brain Research. 2001; 125: 279–284.
[34]
Cohen J. Statistical power analysis for the behavioral sciences. 2nd edn. L. Erlbaum Associates: Hillsdale. 1988.
[35]
Baron RM, Kenny DA. The moderator-mediator variable distinction in social psychological research: conceptual, strategic, and statistical considerations. Journal of Personality and Social Psychology. 1986; 51: 1173–1182.
[36]
MacKinnon DP, Lockwood CM, Hoffman JM, West SG, Sheets V. A comparison of methods to test mediation and other intervening variable effects. Psychological Methods. 2002; 7: 83–104.
[37]
Fawcett T. An introduction to ROC analysis. Pattern Recognition Letters. 2006; 27: 861–874.
[38]
Parikh R, Mathai A, Parikh S, Chandra Sekhar G, Thomas R. Understanding and using sensitivity, specificity and predictive values. Indian Journal of Ophthalmology. 2008; 56: 45–50.
[39]
Hanley JA, McNeil BJ. The meaning and use of the area under a receiver operating characteristic (ROC) curve. Radiology. 1982; 143: 29–36.
[40]
Assaf Y, Pasternak O. Diffusion tensor imaging (DTI) -based white matter mapping in brain research: a review. Journal of Molecular Neuroscience. 2008; 34: 51–61.
[41]
de Groot M, Ikram MA, Akoudad S, Krestin GP, Hofman A, van der Lugt A, et al. Tract-specific white matter degeneration in aging: the Rotterdam Study. Alzheimer’S & Dementia. 2015; 11: 321–330.
[42]
Marchina S, Zhu LL, Norton A, Zipse L, Wan CY, Schlaug G. Impairment of speech production predicted by lesion load of the left arcuate fasciculus. Stroke. 2011; 42: 2251–2256.
[43]
Wang J, Marchina S, Norton AC, Wan CY, Schlaug G. Predicting speech fluency and naming abilities in aphasic patients. Frontiers in Human Neuroscience. 2013; 7: 831.
[44]
Hope TMH, Seghier ML, Prejawa S, Leff AP, Price CJ. Distinguishing the effect of lesion load from tract disconnection in the arcuate and uncinate fasciculi. NeuroImage. 2016; 125: 1169–1173.
[45]
Hillis AE, Beh YY, Sebastian R, Breining B, Tippett DC, Wright A, et al. Predicting recovery in acute poststroke aphasia. Annals of Neurology. 2018; 83: 612–622.
[46]
Yamada K, Sakai K, Akazawa K, Yuen S, Nishimura T. MR tractography: a review of its clinical applications. Magnetic Resonance in Medical Sciences. 2009; 8: 165–174.
[47]
Catani M, Jones DK, Ffytche DH. Perisylvian language networks of the human brain. Annals of Neurology. 2005; 57: 8–16.
Share
Back to top