
† These authors contributed equally.
A reduction in sucrose preference is a key characteristic of depressive-like behaviors after spinal cord injury as judged by the sucrose preference test, the hypothalamic-pituitary-adrenal axis and adult hippocampal neurogenesis. Male rats were divided into three groups: control, sham and spinal cord injury groups. The spinal cord injury rats received a severe mid-thoracic contusion. The Basso, Beattie and Bresnahan score was used to assess motor function. The sucrose preference test and forced swim test were used to evaluate depressive-like behaviors. Serum corticosterone levels were examined by enzyme-linked immunosorbent assay and hippocampal glucocorticoid receptor levels were examined by Western blot to evaluate the function of the hypothalamic-pituitary-adrenal axis. Adult hippocampal neurogenesis was assessed by testing hippocampal brain-derived neurotrophic factor and tropomyosin receptor kinase B levels by Western blot and doublecortin levels by immunohistochemistry. Data showed that spinal cord injury impaired motor function. The spinal cord injury rats exhibited decreased sucrose preference on day six, which continued to decrease until day twelve, followed by a plateau phase. Additionally, the immobility time of the spinal cord injury rats was increased on day thirty-four. Moreover, serum corticosterone levels in the spinal cord injury group peaked on day seven, was decreased by day twenty-one and was increased again on day thirty-five. Serum corticosterone levels were significantly negatively correlated with sucrose preference and positively correlated with immobility time. Finally, hippocampal doublecortin levels on days twenty-one and thirty-five were lower in the spinal cord injury group than in the other groups. These results suggest that hyperactivation of the hypothalamic-pituitary-adrenal axis and the inhibition of adult hippocampal neurogenesis may be part of the underlying mechanism responsible for depressive-like behaviors after spinal cord injury.
Spinal cord injury (SCI) causes severe central nervous system lesions that can affect motor and sensory functions below the site of injury. Additionally, SCI significantly impacts mental health. According to epidemiological data, the incidence of depression after SCI is as high as 63.9%, at least four to five times the rate of depression in the general population [1]. A series of studies conducted in humans and animals found that depression or depressive-like behaviors after SCI not only hinder the rehabilitation of physical function [2, 3] but also cause secondary complications such as pressure ulcers and urinary tract infection [4], increase disability and mortality and greatly reduce quality of life. Given the high incidence of depression among SCI patients and its serious adverse effects on rehabilitation and quality of life, the prevention and treatment of depression should be an important part of SCI rehabilitation. Therefore, we propose to investigate the changes in depressive-like behaviors and molecular changes after SCI to identify an ideal therapeutic target for SCI.
The causes of major depressive disorder (MDD) or other mood disorders are unknown. Evidence suggests that stressful life events are one of the main risk factors for MDD. Acute stress initially raises glucocorticoid (GC) levels and when stress becomes chronic or uncontrolled, it can result in alterations to the normal function of the hypothalamic-pituitary-adrenal (HPA) axis. This may lead to elevated glucocorticoid (cortisol in humans, corticosterone in rodents) levels and decreased glucocorticoid receptor (GR) levels (as a result of glucocorticoid resistance), which has been observed in postmortem studies and preclinical animal models [5, 6, 7, 8]. Recent studies have detected changes in corticosterone and GR levels after SCI. Gezici et al. [9] and Lucin et al. [10] revealed that the HPA axis was activated by SCI and that corticosterone levels began to increase within 24 hours and were still elevated 35 days after SCI. Meanwhile, depressive-like behaviors were observed in SCI rats [11]. These studies have provided insight into the changes in corticosterone levels and depressive-like behaviors that occur at specific time points after SCI, but dynamic monitoring of the effect of corticosterone on depressive-like behaviors in SCI rats has not been reported. Additionally, Yan et al. [12] showed that spinal cord GR expression level was slightly increased at fifteen minutes, peaked at eight hours, sharply declined at day one and returned to baseline on days three and seven after SCI. Nevertheless, how GR levels change after the seventh day following SCI and whether this change affects the occurrence and development of depressive-like behaviors remains unclear. Therefore, here the associations between changes in the levels of corticosterone and GR and depressive-like behaviors after SCI were explored.
High corticosterone levels have been shown to inhibit adult hippocampal neurogenesis (AHN) in the dentate gyrus (DG), which manifests as decreased cell proliferation and doublecortin (DCX) density, thus promoting depressive-like behaviors in rodents [7, 13]. Brain-derived neurotrophic factor (BDNF) and the high-affinity receptor tropomyosin receptor kinase B (TrkB) are mainly distributed in the hippocampus and involved in neuron generation, differentiation and survival [14]. The downregulation of AHN resulting from decreased hippocampal BDNF and TrkB was found to be associated with elevated glucocorticoid levels in depression [15, 16, 17]. Based on such evidence, hippocampal DCX, BDNF and TrkB can be used to monitor evidence of changes in depressive-like behaviors in SCI rats. Li et al. [11] observed depressive-like behaviors and the decreased expression of hippocampal BDNF on day 35 after SCI. Wu et al. [18] has additionally suggested that a reduction in the number of DCX-positive cells is associated with depressive-like behaviors at 16 weeks after SCI. These findings suggest that an insight into the mechanism of depressive-like behaviors after SCI can be obtained by monitoring BDNF and DCX levels. However, there have been no reports on how changes in hippocampal BDNF/TrkB and DCX at different time points after SCI affect depressive-like behaviors.
Seventy-two male SpragueDawley rats were obtained from the Experimental Animal
Center of Dalian Medical University (Dalian, China). The rats were approximately
90–110 days old (weight: 260–280 g). All rats were housed individually in cages
(37.5 cm [length]
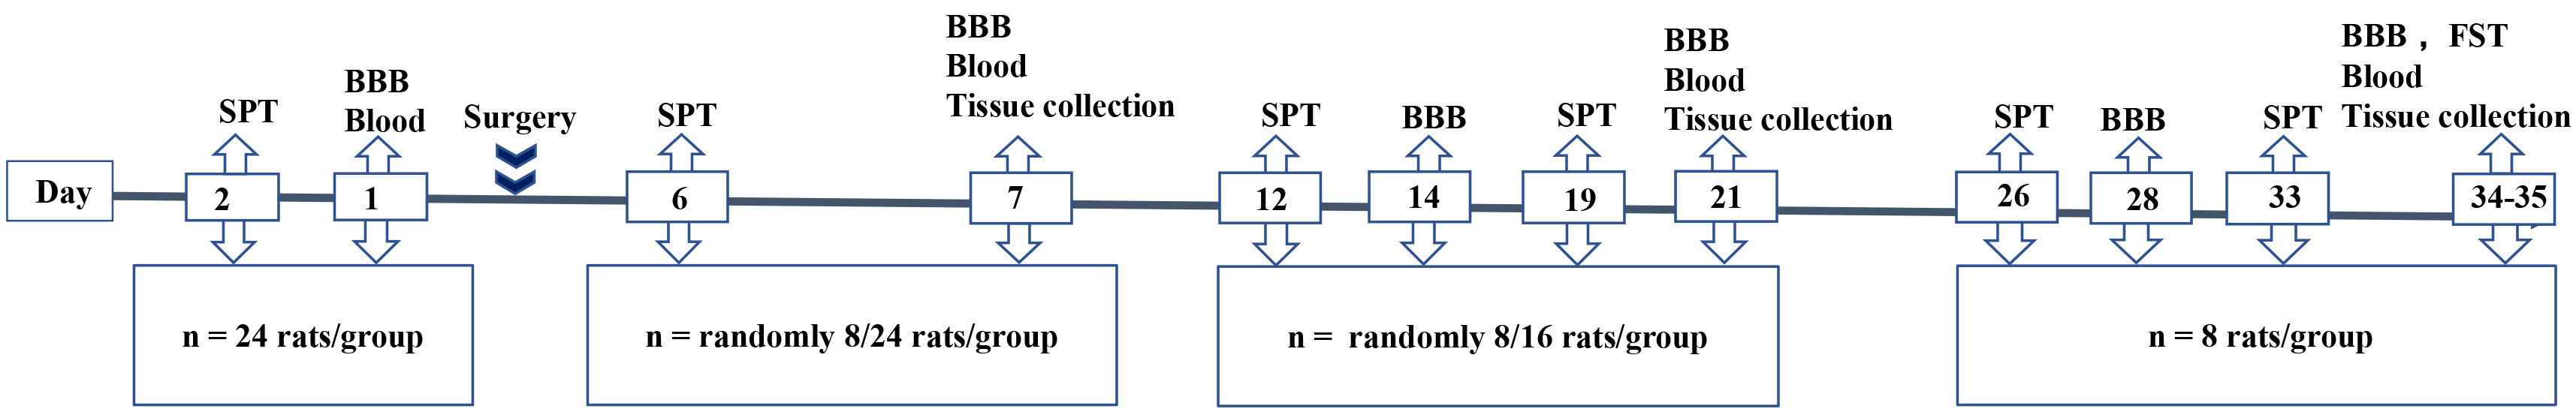 Fig. 1.
Flowchart and time points in the experiment. Rats were divided into three groups: control, sham and SCI. SPT, sucrose preference test; BBB score, Basso, Beattie and Bresnahan score; FST, forced swim test. Tissue (n = 8) was collected, prepared and stored for Western blot analysis (n = 4) and immunohistochemistry (n = 4).
Following anesthesia, a laminectomy was performed at T10 to expose a circle of the dura. Twenty-four rats received severe mid-thoracic contusion of the spinal cord and 24 rats were allocated to the sham group and received only laminectomy without SCI.Procedural details are given by Zhao et al. [19]. Twenty-four rats were assigned to a control group. Penicillin (160 mg/kg) was administered intraperitoneally for three consecutive days following surgery to prevent infection. The bladders of the rats were manually emptied twice daily until automatic micturition returned.
Hind limb motor function was assessed in all rats by calculating the BBB score
[20]. This score ranges from 0 (flaccid paralysis) to 21 points (normal gait),
with higher scores indicating greater motor function. Rats were placed in an open
field chamber (100 cm
Two pre-weighed bottles filled with 150 mL of
water and 150 mL of a sucrose solution (2%) were placed on either side of a
rat’s cage for two hours. To avoid position bias, as in previous
studies [2], the water and sucrose bottles were switched one hour later. At the
end of the test, sucrose preference was evaluated using the following formula:
sucrose preference = weight of sucrose solution ingested (g)/(weight of sucrose
solution ingested (g) + weight of water ingested (g))
The FST was performed on day 34 post injury, a time point at which all SCI rats
had regained sufficient motor function to perform this task. Without previous
adaptation to water, twenty-four rats (n = 8 rats/group) were placed in
a cylinder (15 cm (diameter)
Peripheral blood samples (n = 8 rats/group) were immediately collected
from rats after sacrifice by decapitation on day 7, 21 and 35 post injury and
centrifuged at 12,000 rpm at 4
Four rats in each group were sacrificed and hippocampal tissues were removed on
days 7, 21 and 35 post injury. Western blot was employed to analyze hippocampal
protein expression using standard methods. Total proteins were extracted from the
hippocampus using RIPA buffer (Beyotime, Shanghai, China) and quantified using a
BCA kit (Beyotime, Shanghai, China). Homogenized hippocampal lysates were
separated by 10% sodium dodecyl sulfate-polyacrylamide gel electrophoresis and
transferred to polyvinylidene difluoride (PVDF) membranes (0.45
Four rats in each group were anesthetized and transcardially perfused with cold
saline and 4% paraformaldehyde until their tail and limbs were rigid on days 7,
21 and 35 post injury. The brains were removed from the skulls, fixed in 4%
paraformaldehyde for seven days and embedded in paraffin. Tissues were then cut
into coronal sections (4
Data were statistically analyzed using SPSS 24.0 (SPSS, Inc., Chicago, IL, USA)
and are presented as the mean and standard deviation (SD). For analysis of
variance (ANOVA), the homogeneity of variance was first tested by Levene’s test
and transformed if necessary. The BBB score, sucrose preference data (%) and
serum corticosterone levels were analyzed by two-way repeated measures ANOVA.
When Mauchly’s test of sphericity showed p
Before injury, all rats obtained a BBB score of 21 points. As Fig. 2 shows,
SCI caused motor function impairment that was not observed in the sham group or
control group at any time point (F
 Fig. 2.
Temporal profile of BBB score for each experimental group from 7 to 35 days post injury.
Data are expressed as the mean
Results showed that sucrose preference changed significantly with time
(F
 Fig. 3.
Temporal profile of sucrose preference and comparative analysis
of sucrose preference and forced swim test between groups. Data are expressed as
the mean
As illusrated in Fig. 4, serum corticosterone levels in the sham and SCI
groups were higher than baseline on day 7 post injury, after which serum
corticosterone levels in the sham group decreased to baseline. Although serum
corticosterone levels in the SCI group also began to decrease, they were still
significantly higher than those at baseline. The serum corticosterone levels of
the control rats remained stable. In addition, a significant interaction effect
between time and group was observed (F
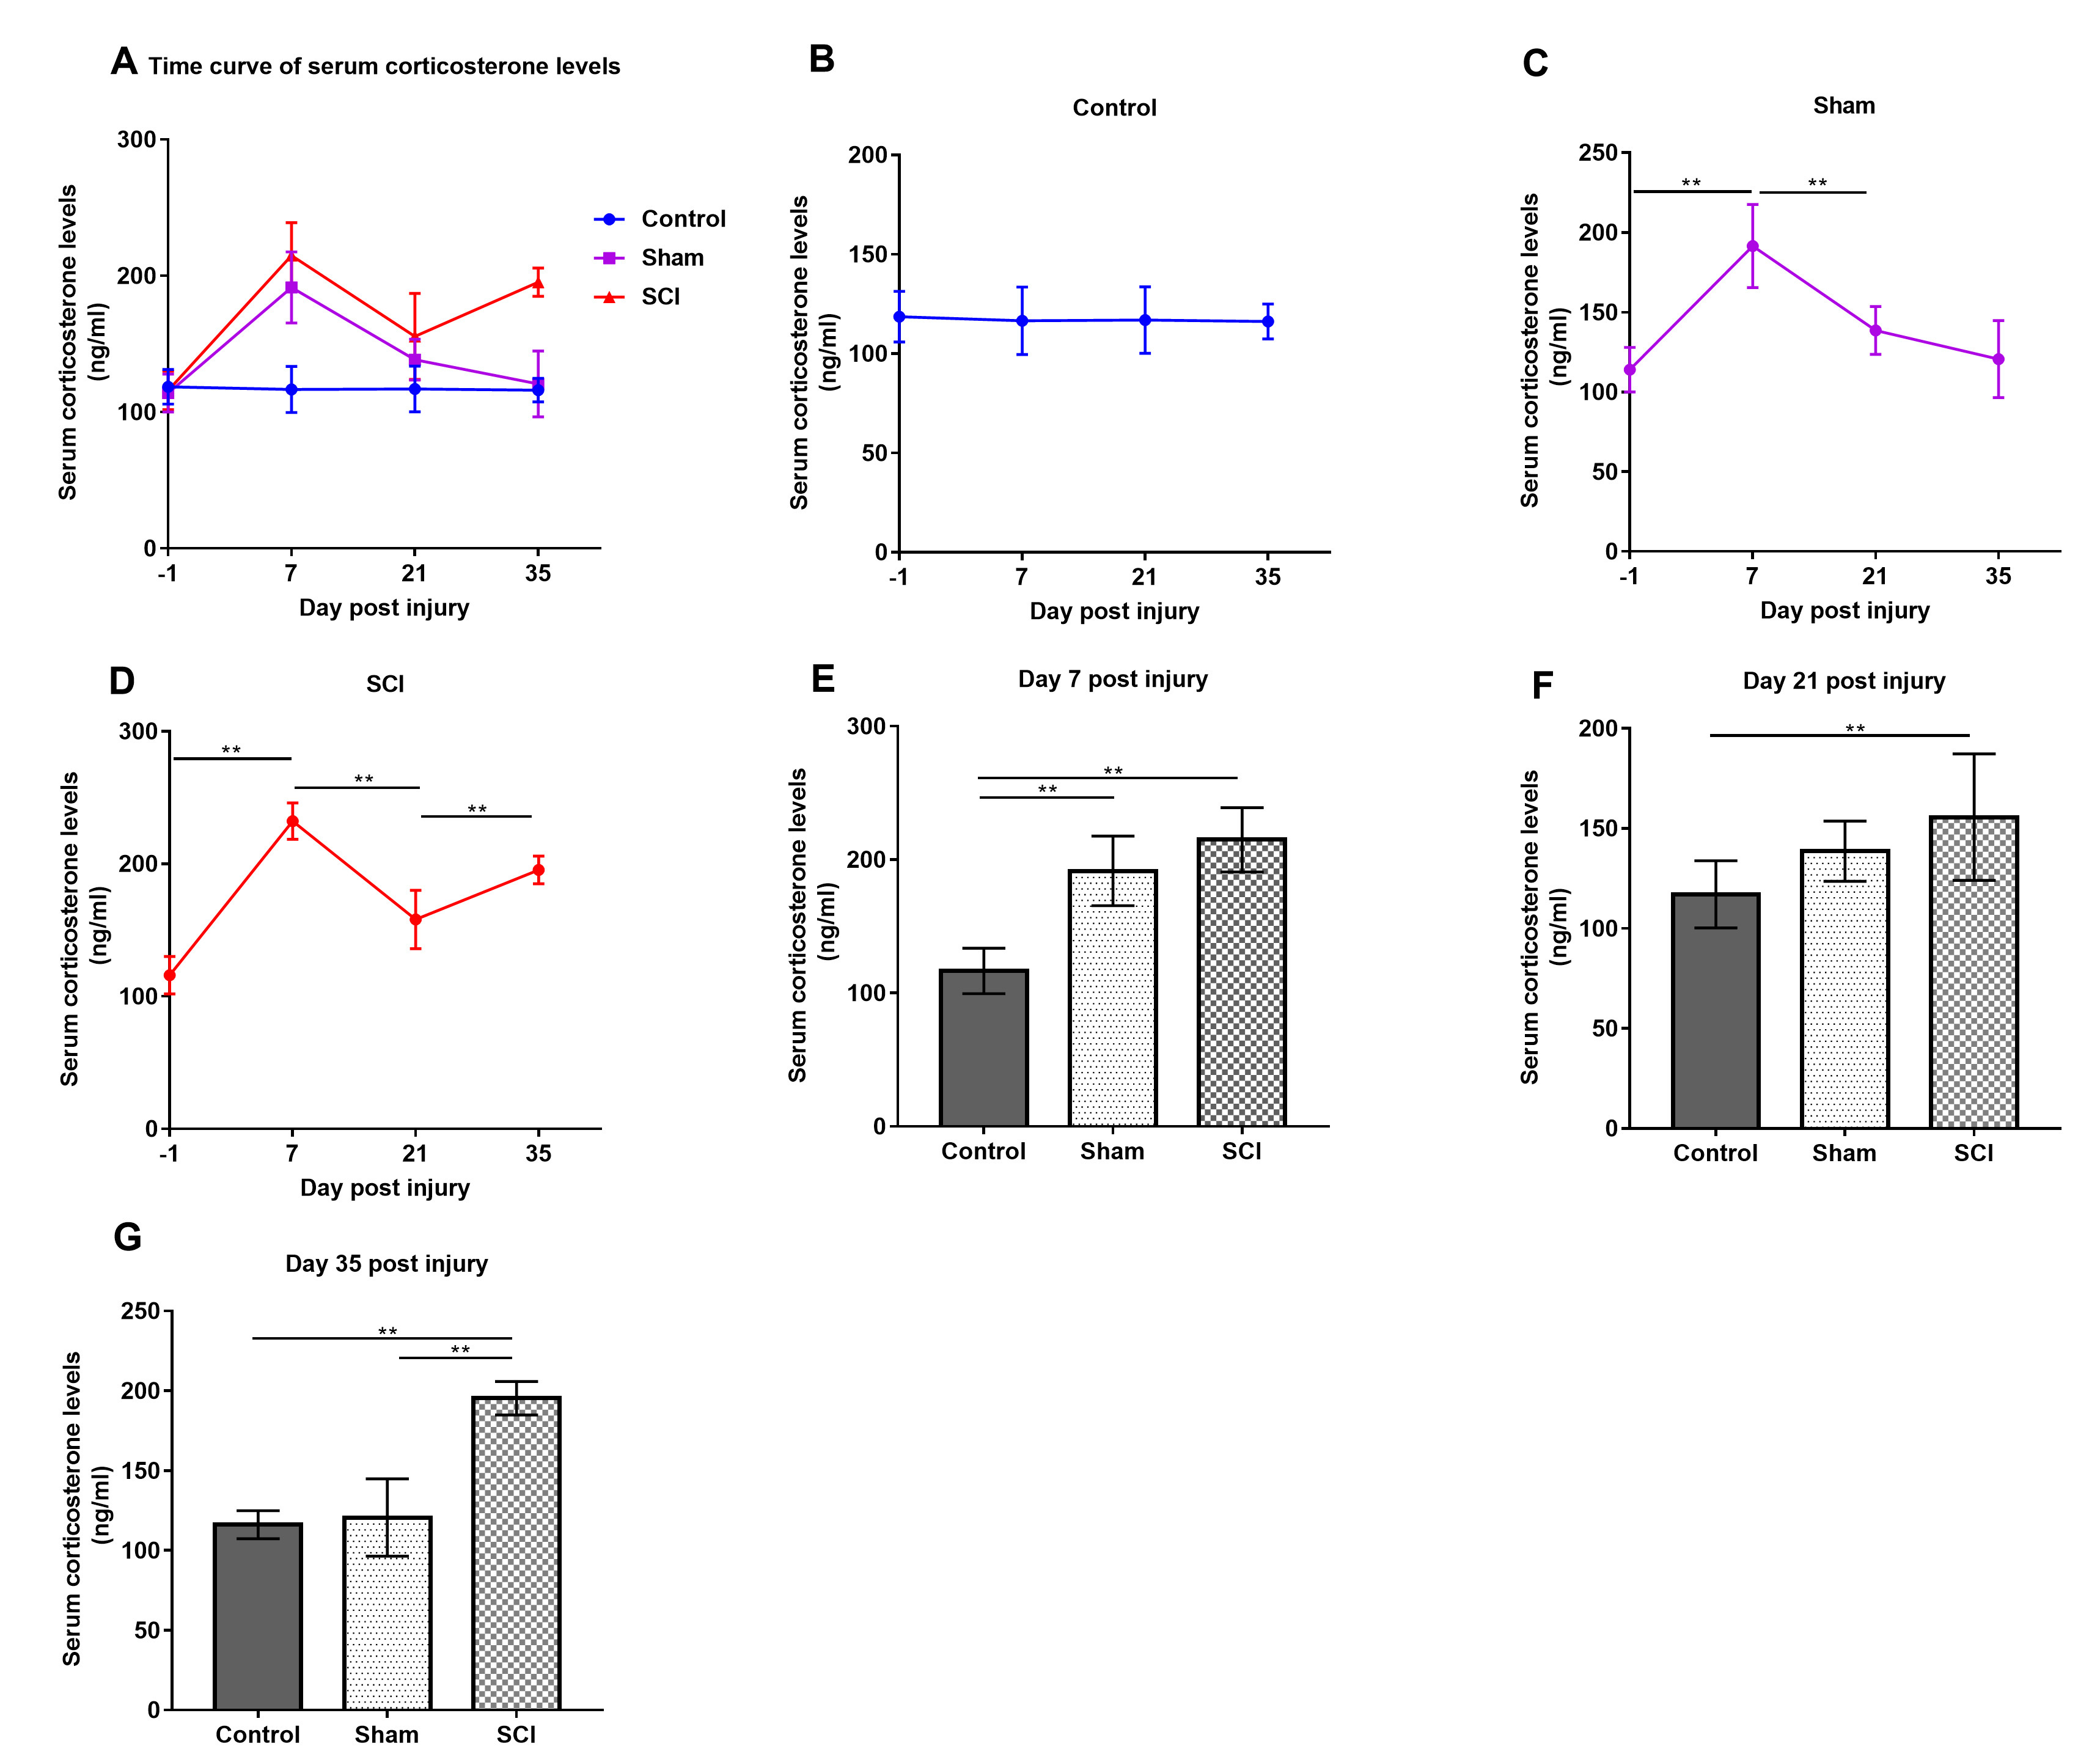 Fig. 4.
Temporal profile of serum corticosterone levels and comparative
analysis of serum corticosterone levels between groups. Data are expressed as
the mean
Correlation analysis indicated that serum corticosterone levels were strongly negatively correlated with sucrose preference in the SCI group on days 7, 21 and 35 post injury and in the sham group on day 7 post injury (Fig. 5). Moreover, serum corticosterone levels were strongly positively correlated with immobility time in the FST in the SCI group on day 35 post injury.
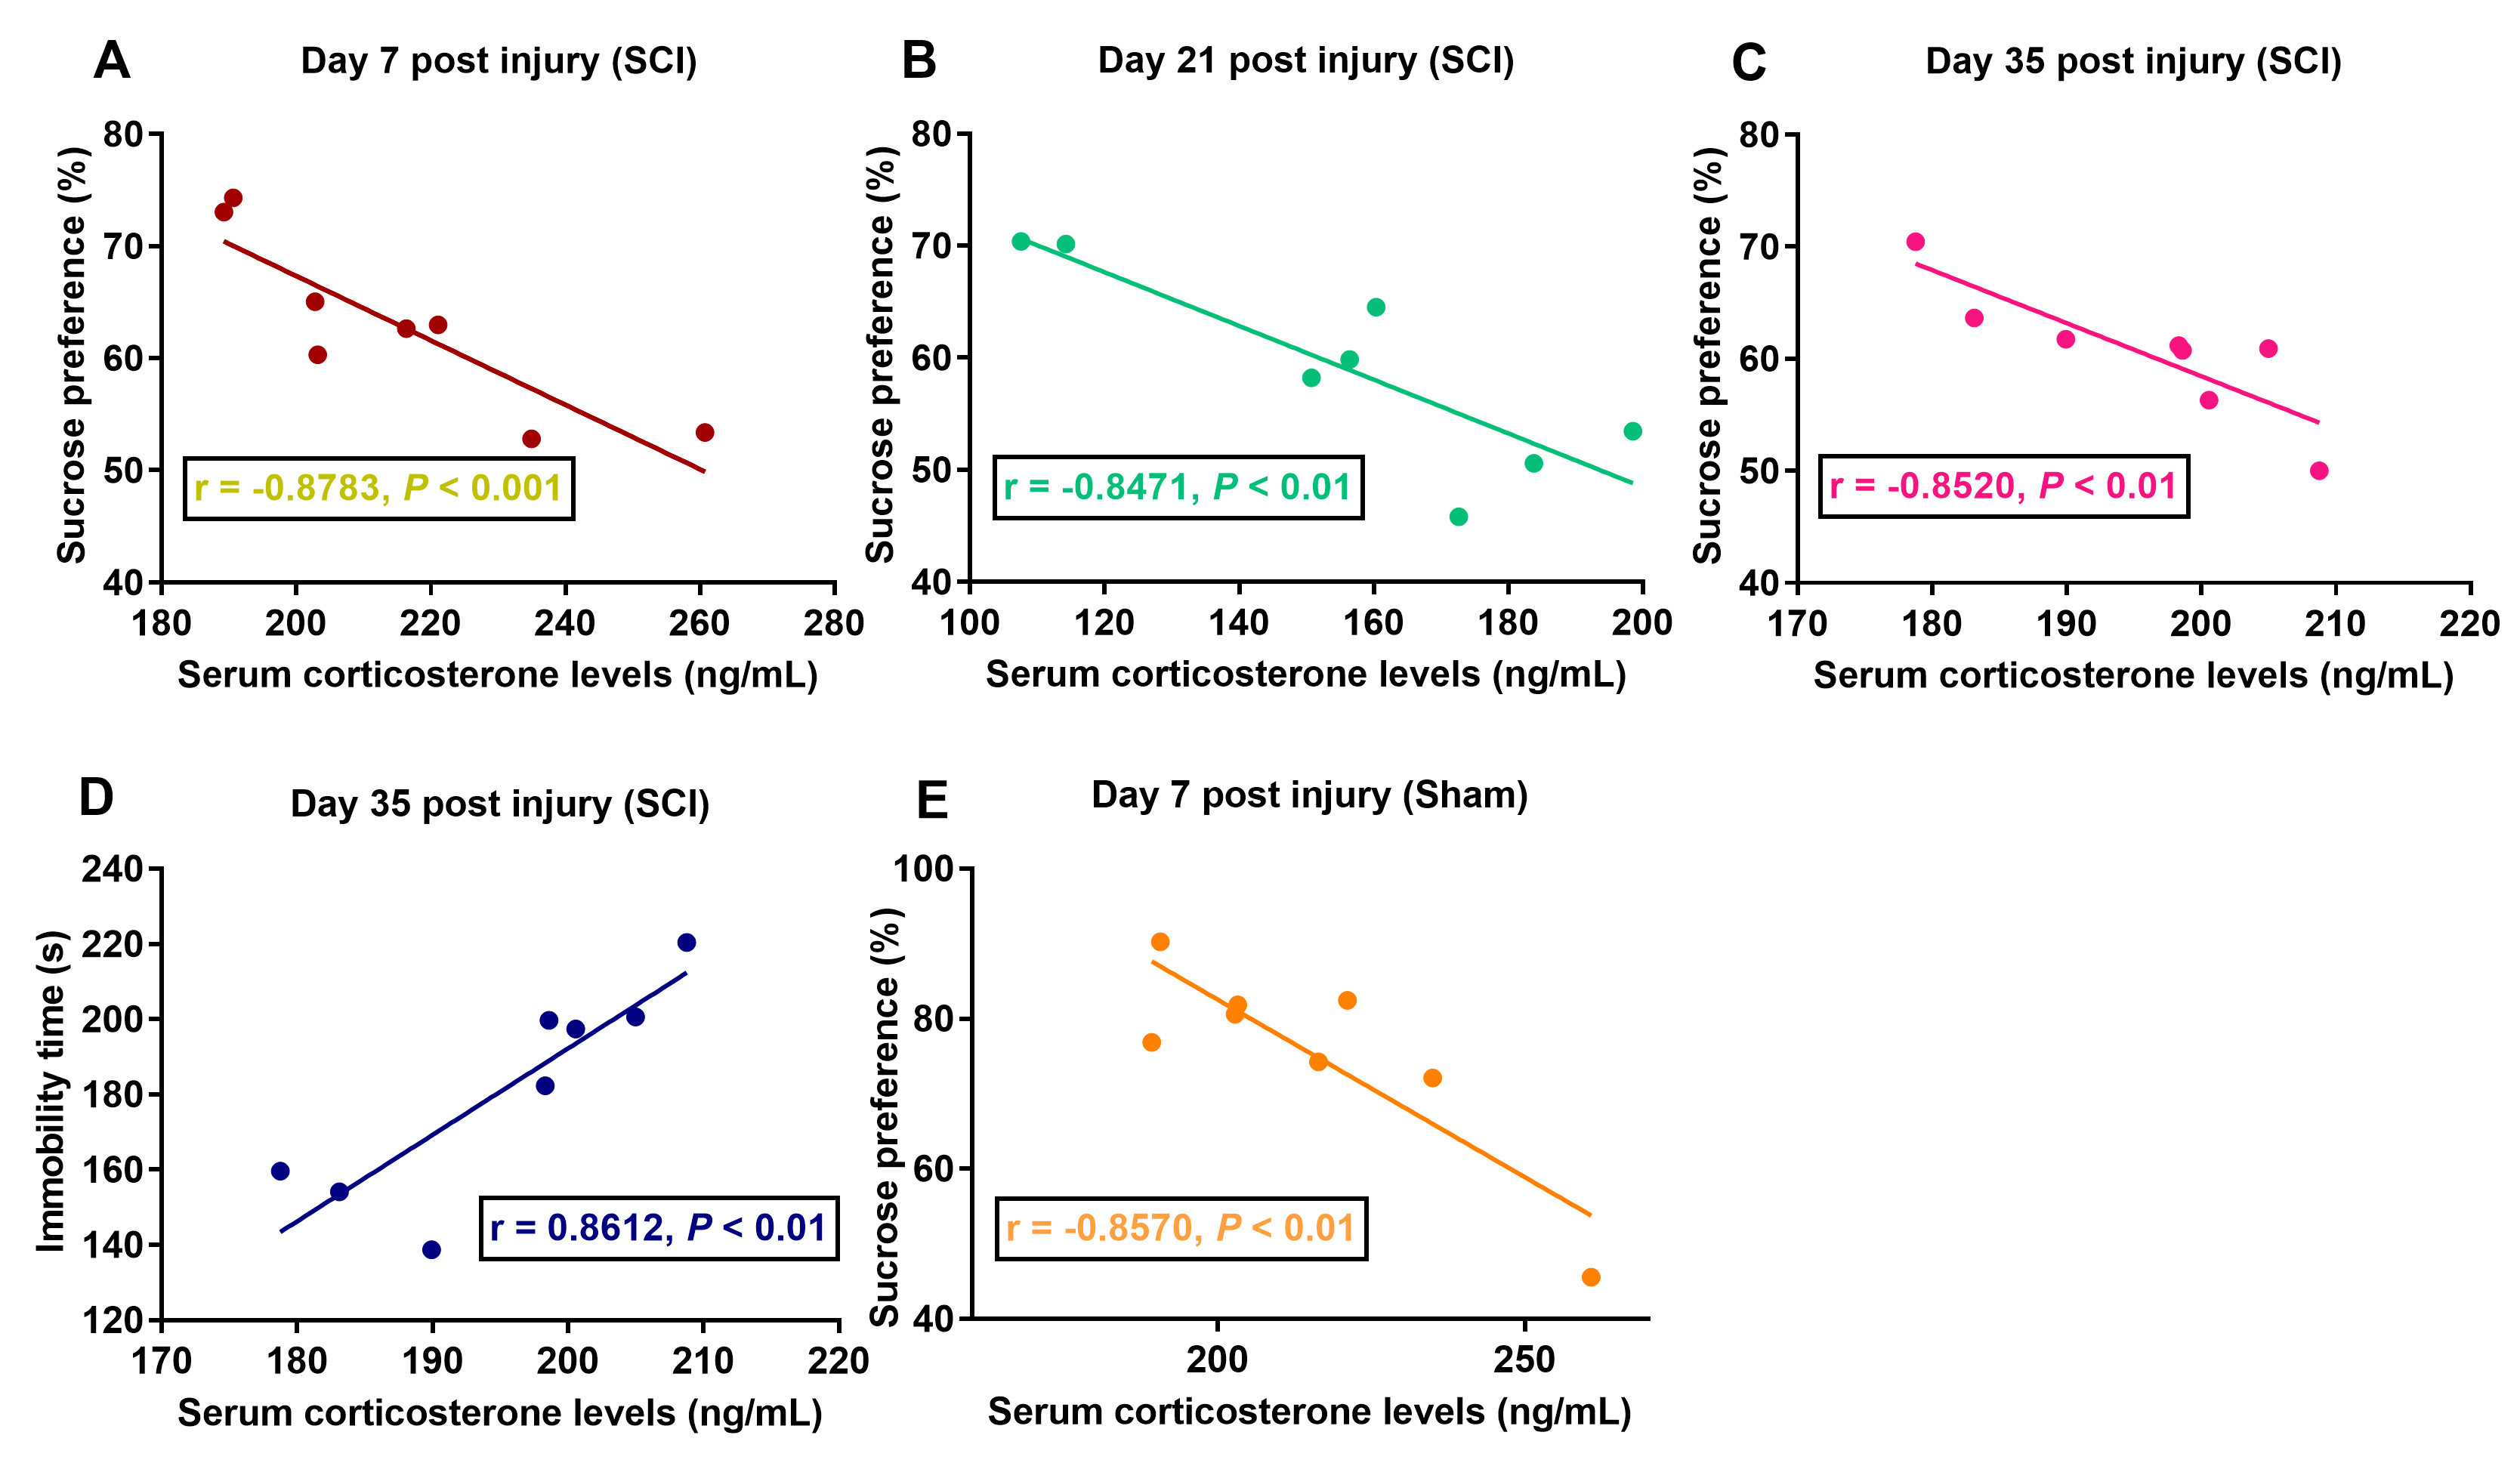 Fig. 5.
Correlation analysis of serum corticosterone levels and sucrose
preference. (A–C) Correlation analysis of serum corticosterone levels and
sucrose preference in the SCI group on days 7, 21, and 35 post injury. (D)
Correlation analysis of serum corticosterone levels and immobility time in the
SCI group on day 35 post injury. (E) Correlation analysis of serum corticosterone
levels and sucrose preference in the sham group on days 7 post injury. p
On day seven post injury, hippocampal GR expression levels in the SCI rats were
lower than those in the sham and control rats and GR protein expression in the
sham rats was lower than that in the control rats (F
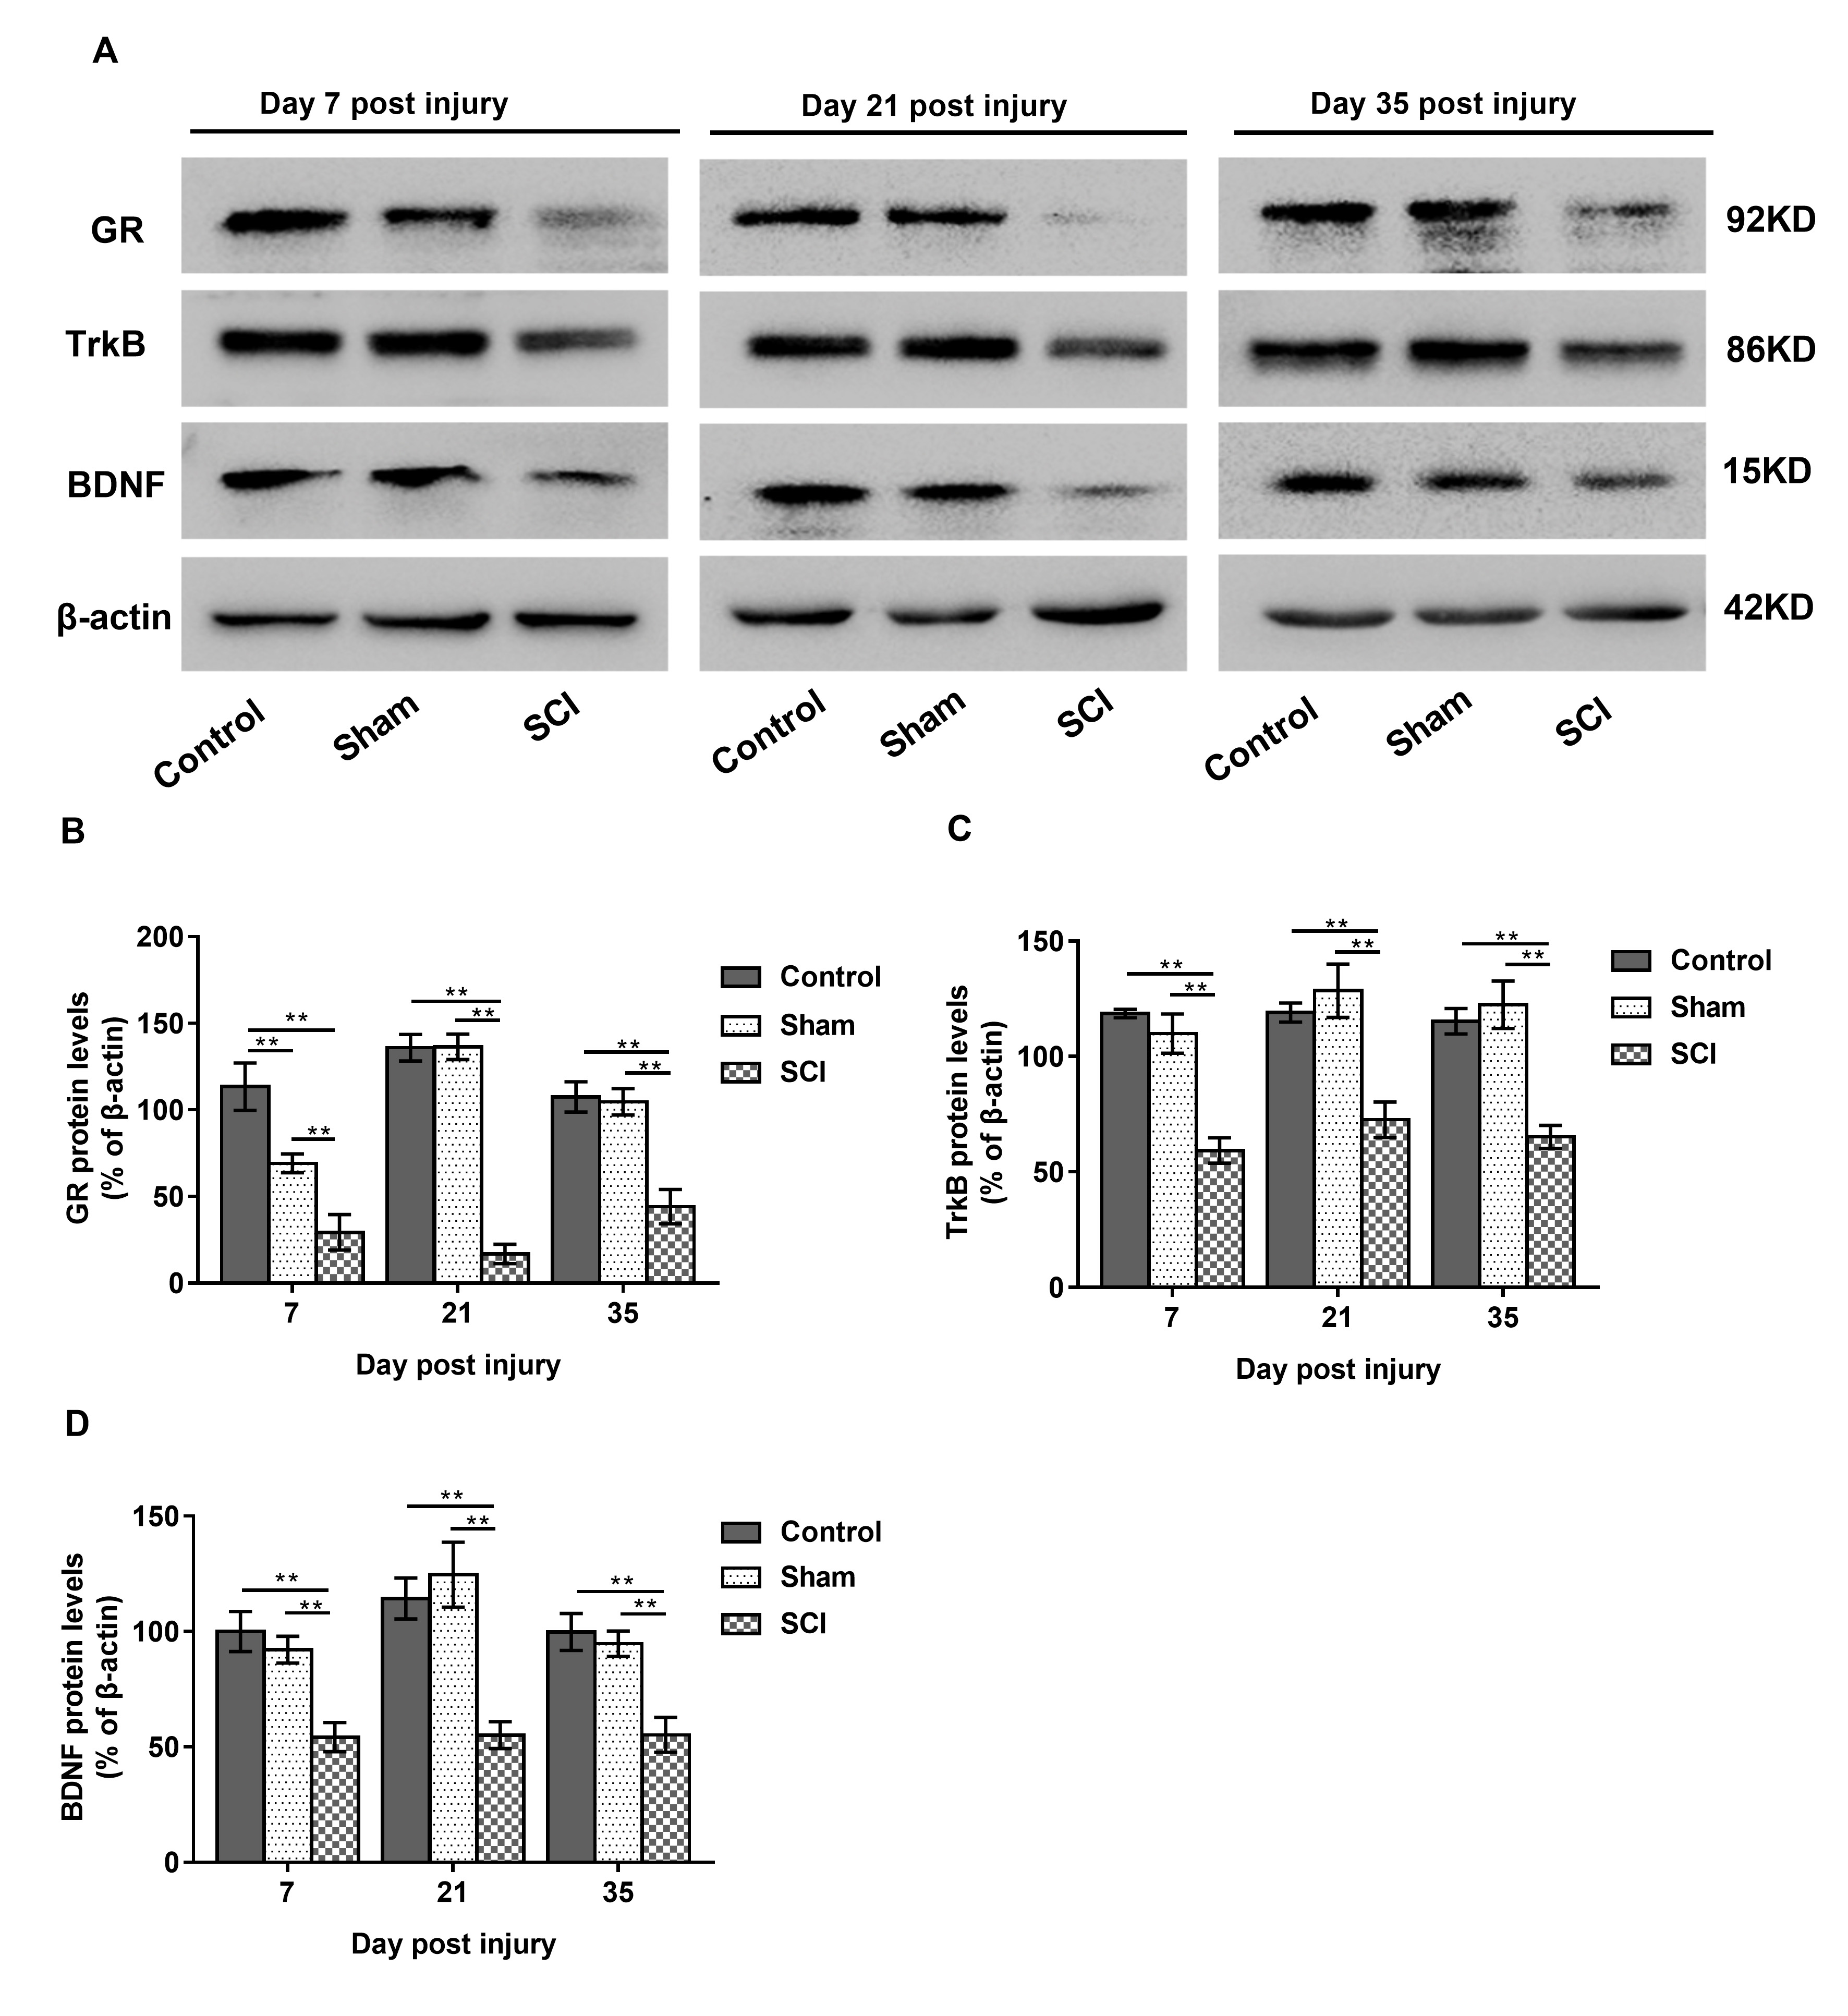 Fig. 6.
Differences in group protein expression inhippocampus. Data are
expressed as the mean
 Fig. 7.
DCX expression in hippocampus. Data are expressed as the mean
This study aimed to illuminate the relationship between changes in depressive-like behaviors and the HPA axis in a rat model of SCI; to this end, correlation analysis was undertaken at two different time points after SCI. By monitoring from day six to thirty-five after SCI, it was found that changes in sucrose preference and immobility time were strongly correlated with serum corticosterone levels. Additionally, serum corticosterone levels increased significantly and hippocampal GR levels decreased. Furthermore, the expression levels of hippocampal DCX and BDNF/TrkB were reduced after SCI. Hyperactivation of the HPA axis and suppression of AHN may be components of the mechanism responsible for depressive-like behaviors after SCI.
The BBB score of the SCI rats on day seven post injury was 2.4
Surgery leads to an increase in serum corticosterone and cortisol levels in animals and humans, respectively [29, 30]. This study confirmed this finding, as serum corticosterone levels on day seven post injury were significantly higher in the sham and SCI groups than in the control group. Beginning on day seven post injury, the serum corticosterone level in the sham group began to decrease and returned to baselineby day twenty-one post injury. The levels of corticosterone in the SCI group remained high until the end of the observation period but decreased temporarily on day twenty-one post injury, essentially consistent with the change in depressive behaviors. Additionally, the serum corticosterone concentration in the SCI group was strongly correlated with depressive-like behaviors in the SPT and FST, in alignment with previous research in different chronic stress models [31, 32, 33] and research that shows that this could be reversed by body weight-supported treadmill training [34].
Further, results showed that SCI reduced hippocampal GR until day thirty-five post injury. Hippocampal GR acted as a GC receptor and the expression of hippocampal GR decreased due to a high concentration of corticosterone (animal GC) after SCI. This weakened the negative regulatory effect of the hippocampus on the HPA axis, caused hyperactivation of the HPA axis and thus exacerbation of depressive-like behaviors. The present findings were consistent with those of previous studies [7, 35] and indicated that hyperactivation of the HPA axis induced by SCI was an important neuroendocrine mechanism for changes in depressive-like behaviors.
The hippocampus is one of the main regions that receive feedback regulation from HPA axis activation [36]. Hyperactivation of the HPA axis is responsible for many of its deleterious effects on the hippocampus and behaviors [15, 16, 17]. Jure et al. [37] found that SCI impaired AHN on day sixty after injury. However, in this study, the expression of hippocampal DCX (as a marker for AHN) in the SCI group began to decrease on day twenty-one after injury. This may be a result of hyperactivation of the HPA axis. In turn, the inhibition of AHN weakened the negative feedback regulation of the HPA axis, further increasing serum corticosterone levels. These results are consistent with those of Snider et al. [38]. Masi et al. [15] have also shown that HPA caused the brain (particularly the hippocampus) to be exposed to corticosteroids, affecting neurobehavioral functions with an impairment of the AHN and that might be a major factor in the pathophysiology of depression. Additionally, many studies have indicated that the decreased expression of hippocampal BDNF and TrkB also inhibited AHN [39, 40]. It was therefore speculated that the decrease in hippocampal DCX expression after SCI may have been caused by downregulation of BDNF and TrkB beginning on day seven after SCI, which might simultaneously contribute to the development of depressive-like behaviors.
There were some limitations to this study. First, the number of rats tested was relatively small, which may have reduced statistical power of the analysis. Another limitation of the current work was the focus on only using DCX (a differentiated neuronal cell marker) to detect AHN, Ki67 or bromodeoxyuridine (BrdU) (proliferating cells) were not investigated here. Additionally, all analysis was correlative and it was not clear what actually caused the changes in terms of the HPA axis, AHN and depressive-like behaviors after SCI.
The results presented here suggest that SCI causes depressive-like behaviors that are associated with serum corticosterone levels, which can be used to predict depressive-like behaviors in SCI. It is suggested that hyperactivation of the HPA axis and the inhibition of AHN are part of the underlying mechanism responsible for depressive-like behaviors after SCI.
CHL, XHZ, ZJ performed all the experiments. CHL and BLZ contributed to the experimental design, analyzed the data, prepared figures, drafted, and wrote the manuscript. LBA and WTL revised and edited the final version of the manuscript.
All animal procedures and care were conducted according to the institutional guidelines of the local Ethics Committee for Animal Research at Dalian University and complied with the National Institutes of Health Guide for the Care and Use of Laboratory Animals. The Ethics Committee of the Affiliated Zhongshan Hospital of Dalian University approved the study (reference number, 2017082).
We thank all staff members of the Experimental Center of the School of Nursing at Dalian University in China, for their support and help. We thank Zhu-Ren Bao and Li-Min Yang for providing valuable help and technical advice.
This research received no external funding.
The authors declare no conflict of interest.