
† These authors contributed equally.
A correct preoperative diagnosis is essential for the treatment and prognosis of necrotic glioblastoma and brain abscess, but the differentiation between them remains challenging. We constructed a diagnostic prediction model with good performance and enhanced clinical applicability based on data from 86 patients with necrotic glioblastoma and 32 patients with brain abscess that were diagnosed between January 2012 and January 2020. The diagnostic values of three regions of interest based on contrast-enhanced T1 weighted images (including whole tumor, brain-tumor interface, and an amalgamation of both regions) were compared using Logistics Regression and Random Forest. Feature reduction based on the optimal regions of interest was performed using principal component analysis with varimax rotation. The performance of the classifiers was assessed by receiver operator curves. Finally, clinical predictors were utilized to detect the diagnostic power. The mean area under curve (AUC) values of the whole tumor model was significantly higher than other two models obtained from Brain-Tumor Interface (BTI) and combine regions both in training (AUC mean = 0.850) and test/validation set (AUC mean = 0.896) calculated by Logistics Regression and in the testing set (AUC mean = 0.876) calculated by Random Forest. Among these three diagnostic prediction models, the combined model provided superior discrimination performance and yielded an AUC of 0.993, 0.907, and 0.974 in training, testing, and combined datasets, respectively. Compared with the brain-tumor interface and the combined regions, features obtained from the whole tumor showed the best differential value. The radiomic features combined with the peritumoral edema/tumor volume ratio provided the prediction model with the greatest diagnostic performance.
There are essential differences in the biological characteristics, treatment and prognosis of brain abscess and necrotic glioblastoma (GBM). Despite standard treatment approaches, including aggressively expanded surgical resections, postoperative adjuvant radiotherapy and chemotherapy, the prognosis for GBM patients remains depressing, with the median survival after diagnosis being about 15 months and overall survival (OS) and progression-free survival (PFS) being 22 months (range 2 to 168 months) and 10 months (range 1 to 96 months), respectively [1]. In contrast, the mortality of brain abscess has declined noticeably over the past 60 years [2]. Patients with timely standard treatment can often avoid high-risk surgery and achieve better postoperative recovery. However, differentiation of necrotic GBMs and pyogenic brain abscesses can sometimes be challenging, as their clinical features are non-specific and they can often be manifested as expansile rim-enhancing masses with prominent perifocal edema on conventional magnetic resonance imaging (MRI) [3, 4]. Diverse advanced radiological techniques have been attempted to make more precise differentiation. Advanced MRIs such as diffusion-weighted imaging (DWI) and susceptibility weighted imaging have been utilized to distinguish the two types of lesions, yet mimicking abscesses and necrotic GBMs by abnormal imaging values exist which leads to the specificity problems [5, 6]. The differential values of proton magnetic resonance (MR) spectroscopy and positron emission tomography (PET) have also been widely studied, but their clinical use is limited by certain drawbacks such as drawn-out inspection time and high inspection cost [7, 8, 9]. Hence, novel imaging techniques based on conventional MRI is of clinical importance for pretreatment differential diagnosis.
Radiomics can reflect the heterogeneity of diseases by extracting radiomic features and assist the construction of predictive models in a non-invasive way. It has been widely used in tumor differentiation, tumor grading, identifying responses to treatment and prognosis prediction; its performance has usually been shown satisfactory [10]. However, to the best of our knowledge, there are no studies to date attempting to use radiomic features to distinguish brain abscesses from necrotic GBM.
Recent studies have shown that radiomic features extracted from different regions of a lesion (such as the lesion itself, brain-lesion interface, and an amalgamation of both regions) may yield different diagnostic information [11, 12, 13, 14]. Considering the invasive characteristics of GBM, it is reasonable to hypothesize that the region surrounding the tumor’s enhanced rim on MRI, which seems to be normal brain tissue to the naked eyes, may contain valuable information for differential diagnosis. Meanwhile, the central cavity of brain abscess and GBM have significant different histological characteristics and microenvironment. Therefore, it would be interesting to know whether the analytical information obtained from peritumoral regions alone could be utilized for radiomic analysis, or whether the combined information from the intra- and peritumoral regions is more beneficial.
This study evaluated the predictive performance of radiomic features derived from different regions of lesions, including the intratumoral region (whole tumor), the peritumoral region (brain-tumor interface), and the amalgamation of the two regions (combined region) in differentiating necrotic GBM from brain abscess. Clinical features including peritumoral edema/tumor volume ratio (VR) and inflammatory indexes were also assessed to determine if they may enhance the diagnostic strength of proposed model.
The data of patients diagnosed with brain abscess or high-grade glioma identified by the radiology and pathology reports between January 2012 and January 2020 in our hospital were retrospectively screened. The histopathological diagnoses for glioma were identified according to the 2016 World Health Organization classification criteria for GBM. The inclusion criteria were as follows (see Fig. 1): (1) Diagnosis of brain abscess or high-grade glioma was confirmed by postoperative pathological report. (2) MRI was performed within two weeks prior to surgery and peripheral blood tests were completed on admission to the neurosurgery department before any antibiotic or steroid therapy was applied. (3) Imaging data included T1-weighted/T2-weighted image (T1WI/T2WI), contrast-enhanced T1-weighted (CE-T1) and T2-fluid-attenuated inversion recovery (T2-FLAIR) sequences. (4) Solitary necrotic lesion with ring-shaped contrast enhancement. (5) No clinical signs of infection, such as leukocytosis, elevated C-reactive protein, nuchal rigidity or fever. Patients with multiple lesions or who underwent interventions before MRI scan were excluded. Only patients with primary GBM were included, while patients with recurrent GBM were excluded.
 Fig. 1.
Patient selection criteria. Ethical approval was obtained from
the institutional review board (2021-0098). Informed consent was obtained. 118
patients were included in this study and their demographic data is summarized in
Table 1. 32 (24 males, 8 females; mean age 44
A 3-T scanner (Siemens Magnetom Avanto 1.5-T, Siemens Magnetom Verio 3-T) with an eight channel head coil was used for MRI acquisition. The scan parameters were: T1WI, Repetition Time (TR) 200–520 ms, Echo Time (TE) 2.46–12 ms, slice thickness 4–6 mm; T2WI, TR 3000–9000 ms, TE 90–98 ms, slice thickness 4–6 mm. CE-T1 were obtained in the sagittal and axial planes after intravenous administration of 0.2 mL/kg of gadopentetate dimeglumine. All images were remotely accessed using the Picturev Archiving and Communication Systems (PACS; Carestream Vue PACS, 11.3.4, Carestream Health, Rochester, NY, USA).
CE-T1 and T2-Flair images were used for image analysis to obtain the radiomics indices, focus volume and perifocal edema. Fig. 2 shows the image processing flow. A neurosurgeon (six years experience in brain MRI interpretation) segmented the MR images manually (by XDD) with open-source ITK-SNAP software (vision 3.8.0, Penn Image Computing and Science Laboratory (PICSL) at the University of Pennsylvania, UT, USA, http://www.itksnap.org). Initially, the tumor and abscess without the surrounding brain tissue were defined as the regions of interests (ROIs), and were manually delineated slice-by-slice on CE-T1 images. Using the same method, the outline of perifocal edema was delineated on T2-flair images (by WJJ). To confirm the reliability of the data, a senior radiologist with 15 years of experience in central nervous system lesions checked the segmentation data. All steps were conducted in a blinded fashion, without prior knowledge of medical or pathological results. The volume of interest (VOI) was generated through the triangle meshes of ROIs. Volume calculation was completed using the the Python package PyRadiomics. The algorithm is given in Supplementary Fig. 1. The exact VOI of GBM, abscess and corresponding volume of area inside the edema outline was calculated. The perifocal edema volume was calculated as the total volume inside the edema outline minus the tumor/abscess volume.
 Fig. 2.
Images show the BTI, WT and Com radiomics of necrotic GBM in a woman at CE-T1W MR image. Step 1: A 3-T scanner (Siemens Magnetom Avanto 1.5-T, Siemens Magnetom Verio 3-T) with an 8-channel head coil was used for MRI acquisition. CE-T1 and T2-Flair images were used for image analysis to obtain the radiomics index, focus volume and perifocal edema. Step 2: The tumor was manually segmented on CE-T1WI by one researcher with open-source ITKSNAP software. Another researcher manually outlined peritumoral oedema on FLAIR in a similar fashion. The ROIs of brain-to-tumor and brain-to-abscess on CE-T1 sequence were obtained by a semi-automatic Python (version 3.8.0, Python Inc., Netherlands) algorithm. See section 3 in “Patients and methods” part for details. Step 3: Images were preprocessed before radiomics feature extraction. Algorithms for radiomic features extraction were developed with Pyradiomics, an open-source Python package (version 3.0.0, Python Inc., Netherlands).
The ROIs of brain-to-tumor and brain-to-abscess on CE-T1 sequence were obtained by a semi-automated algorithm performed with Python. Initially, based on the tumor and abscess ROIs, a tumor contour was automatically obtained. An in-house script written in Python then simultaneously moved the inner and outer outline. The ROI boundary was then automatically extended in both of two directions to generate a 10 mm boundary ROI. Meanwhile, to avoid the effect of the skull-surfaces regions, ROIs crossing the brain surface were manually erased using ITK-SNAP. Finally, the boundary ROI and GBM/abscess ROI were combined for each patient using the semi-automated Python script. The resultant combined ROI contained the area of both the whole lesion and a 5 mm outer contour.
Images were preprocessed before radiomics feature extraction. In this study,
CE-T1 images were resampled to a 3
The minimum absolute contraction and selection operator (LASSO) was applied to filter variables through 10-fold cross validation, these variables were then ranked by importance and those corresponding to the Events Per Variable principle were selected to build a logistic regression model and a random forest model. Additionally, radiomic feature reduction was performed using principal component analysis (PCA) with varimax-rotation (R package version 234 2.1.3, https://CRAN.R-project.org/package=psych).
The absolute counts of erythrocytes, leukocytes, platelets, hemoglobin,
neutrophils, monocytes, albumin and lymphocytes were collected from the
peripheral blood test report. The following inflammatory indexes were then
calculated: neutrophil (NE), neutrophil/lymphocyte ratio (NLR), neutrophil/(leukocyte-neutrophil) ratio (dNLR),
platelet/lymphocyte ratio (PLR),
lymphocyte/monocyte ratio (LMR), platelet
Quantitative variables such as the interquartile range are expressed as either
mean
Table 1 gives patient characteristics and baseline information. The mean age of
the brain abscess group was younger than that of the glioma patients (44.06
(16.24), 50.43 (13.31); p = 0.032). There was no substantial variation
in either sex or inflammation indexes amongst the two groups with the exception
of NLR, PLR and SII groups (p-value 0.048, 0.034 and 0.022,
respectively). Tumor volume and peritumoral edema volume between brain abscess
and necrotic GBM were statistically different. The brain abscess group had a
smaller VR than necrotic GBM (p
| Brain abscess | Necrotic glioblastoma | p value | ||
| Patients, n | 32 | 86 | 0.032 | |
| Age, (mean (SD)) | 44.06 (16.24) | 50.43 (13.31) | ||
| Sex, n (%) | ||||
| Male | 24 (75.0) | 49 (57.0) | 0.114 | |
| Female | 8 (25.0) | 37 (43.0) | ||
| Laboratory test, (mean (SD)) | ||||
| Leukocyte |
9.50 (3.72) | 8.29 (3.67) | 0.115 | |
| Erythrocyte |
4.30 (0.93) | 4.36 (0.52) | 0.666 | |
| Hemoglobin |
125.62 (19.47) | 130.15 (15.63) | 0.194 | |
| Platelet |
215.28 (65.81) | 206.41 (66.51) | 0.519 | |
| Neutrophil |
7.42 (3.88) | 6.06 (3.62) | 0.077 | |
| Lymphocyte |
1.41 (0.79) | 1.59 (0.64) | 0.192 | |
| Monocyte |
0.55 (0.23) | 0.52 (0.33) | 0.639 | |
| Albumin |
36.84 (6.89) | 39.17 (5.70) | 0.065 | |
| NLR, mean (IQR) | 5.35 (2.16, 11.56) | 2.81 (1.95, 6.23) | 0.048 | |
| dNLR,mean (IQR) | 1.23 (1.10, 1.88) | 1.55 (1.19, 2.05) | 0.051 | |
| PLR,mean (IQR) | 154.21 (114.01, 248.80) | 125.03 (94.27, 175.27) | 0.034 | |
| SII, mean (IQR) | 1068.50 (521.66, 2002.32) | 618.61 (352.58, 1332.46) | 0.022 | |
| LMR | 0.51 (0.36) | 0.40 (0.39) | 0.172 | |
| PNI | 43.88 (9.43) | 47.14 (7.44) | 0.052 | |
| MR Imaging (mean (SD)) | ||||
| T2-Flair volume |
131.23 (57.13) | 120.79 (56.94) | 0.378 | |
| Tumor volume |
28.50 (21.60) | 46.38 (30.12) | 0.003 | |
| Peritumoral dema volume |
102.74 (45.40) | 74.41 (45.86) | 0.003 | |
| Volume ratio, mean (IQR) | 0.25 (0.14, 0.40) | 0.55 (0.35, 1.12) | ||
| NLR, neutrophil/lymphocyte ratio; dNLR, neutrophil/(leukocyte-neutrophil) ratio;
PLR, platelet/lymphocyte ratio; SII, Systemic Immune-inflammation Index; LMR,
Lymphocyte to Monocyte Ratio; PNI, Prognostic Nutritional Index; MR, Magnetic
Resonance; SD, Standard deviation; IQR, Interquartile Range. | ||||
Fig. 3 shows the optimal ROI selection process to obtain a radiomic model. First, included samples were randomly divided (all sets: necrotic GBM: 86; brain abscess: 32) into a training set (necrotic GBM: 68; brain abscess: 26) and test/validation set (necrotic GBM: 18; brain abscess: 6) in a ratio of approximately 1:4. The testing set was an independent blind test used only for algorithm evaluation (Fig. 3C, a, downward side and Fig. 4). The training set was used for establishment of the mean cross-validation performance and classifiers. 1015 radiomic features were screened by LASSO and ranked by a random forest (RF) algorithm, respectively, for the training and testing cohorts. It should be noted that the violin plot of the AUC value distribution of different ROI areas in the training set (Fig. 3C, a, upward side) and the testing set (Fig. 3C, a, downward side) was calculated independently using the algorithm in Fig. 3B. The LASSO and RF algorithm both have the effect of data dimension reduction and were used for feature reselection. During feature selection and the establishment of classifiers, fivefold cross validation with 1000 samplings without replacement were used (Fig. 3B). Fig. 3C, a depicts the distribution of AUCs for three ROIs after 1000 iterations. The AUC value was calculated separately in the two data sets and validation of training and test sets was performed independently to see whether the whole tumor (WT) area had the best predictive performance for two independent units. In other words, previously the average AUC of the whole tumor model in the training set (Fig. 3C, a, upward side) was much greater than that of the other models based on various ROIs, both by the logistic regression (AUC mean = 0.85) and random forest algorithm (AUC mean = 0.98). Using the same approach as for the test set/training set, the same pattern was observed in the test cohort (Fig. 3C, a, downward side).
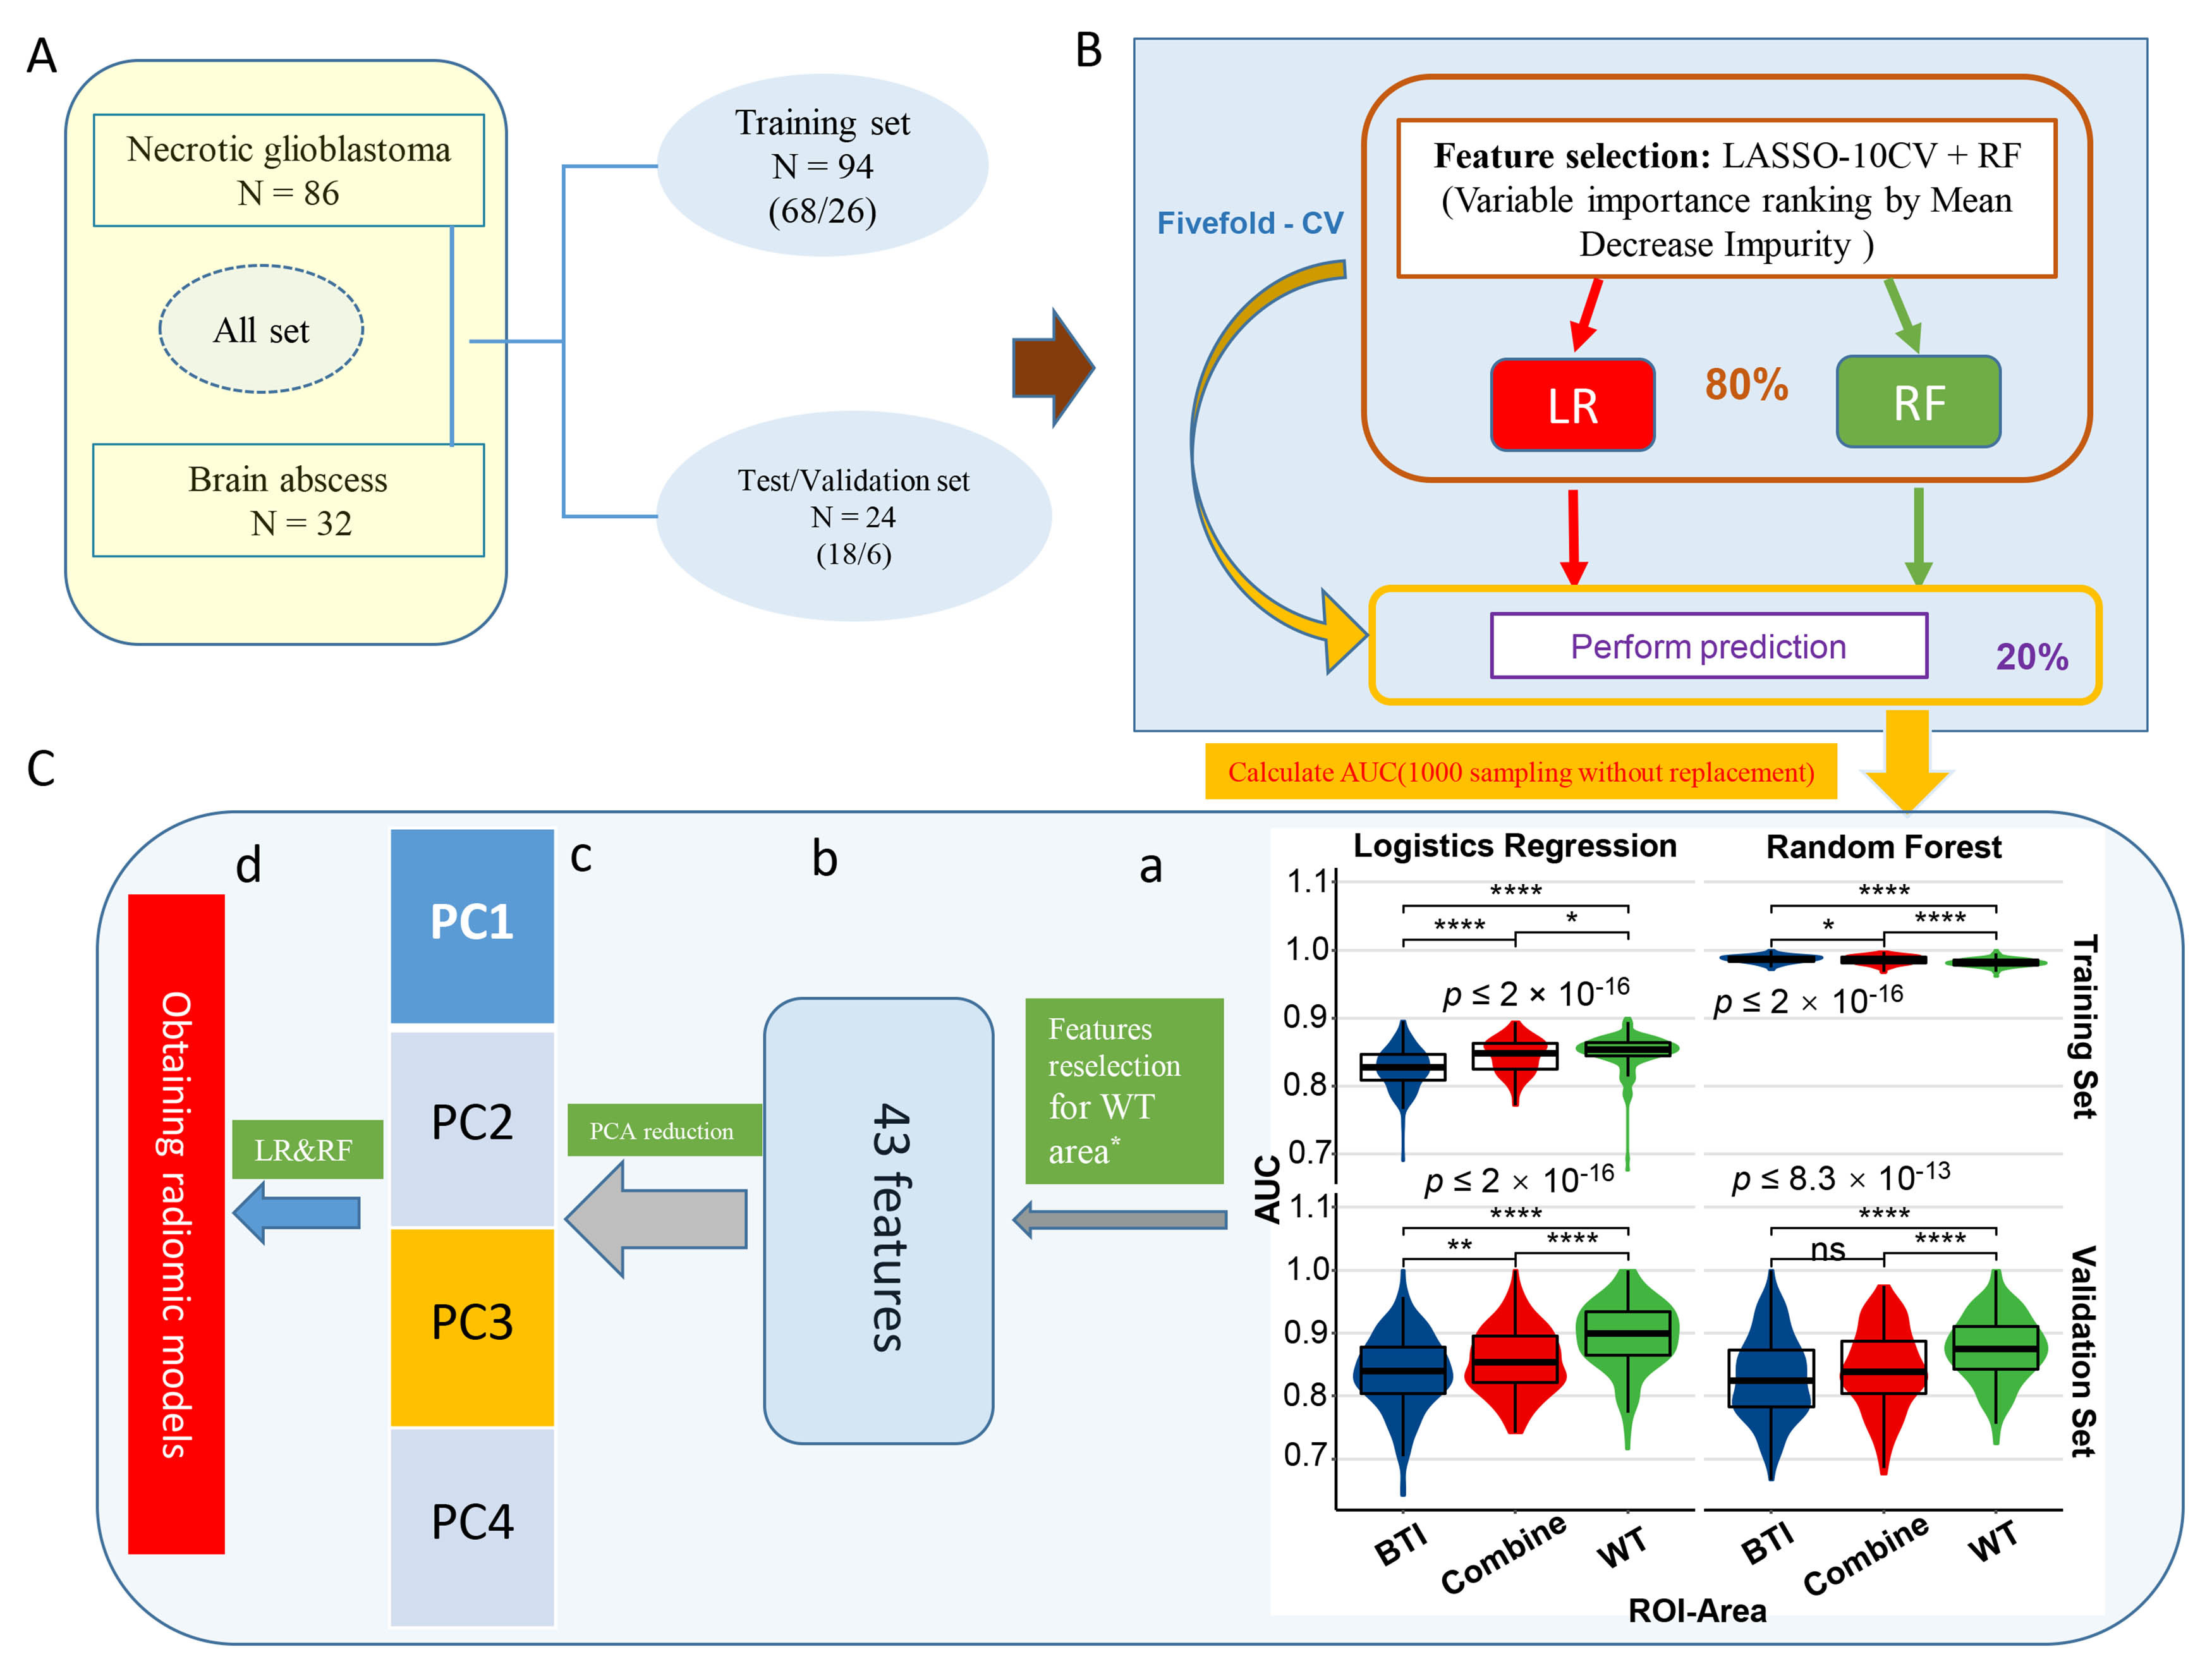 Fig. 3.
The predictive performance of distinguishing necrotic GBM from
brain abscess in different ROI areas. (A) Patients (all set) were divided into
training (n = 94) and validation cohorts (n = 24). (B) Schematic representation
of feature selection and classifiers building. During feature selection and
classifiers establishment, fivefold cross validation 1000 sampling without
replacement were used. (C) a: Violin plot of the AUC value distribution of
different ROI areas in the independent training and validation cohorts; b–d:
After feature reselection and PCA dimensional reduction, models were obtained
based on principal components. *Features retention with AUC
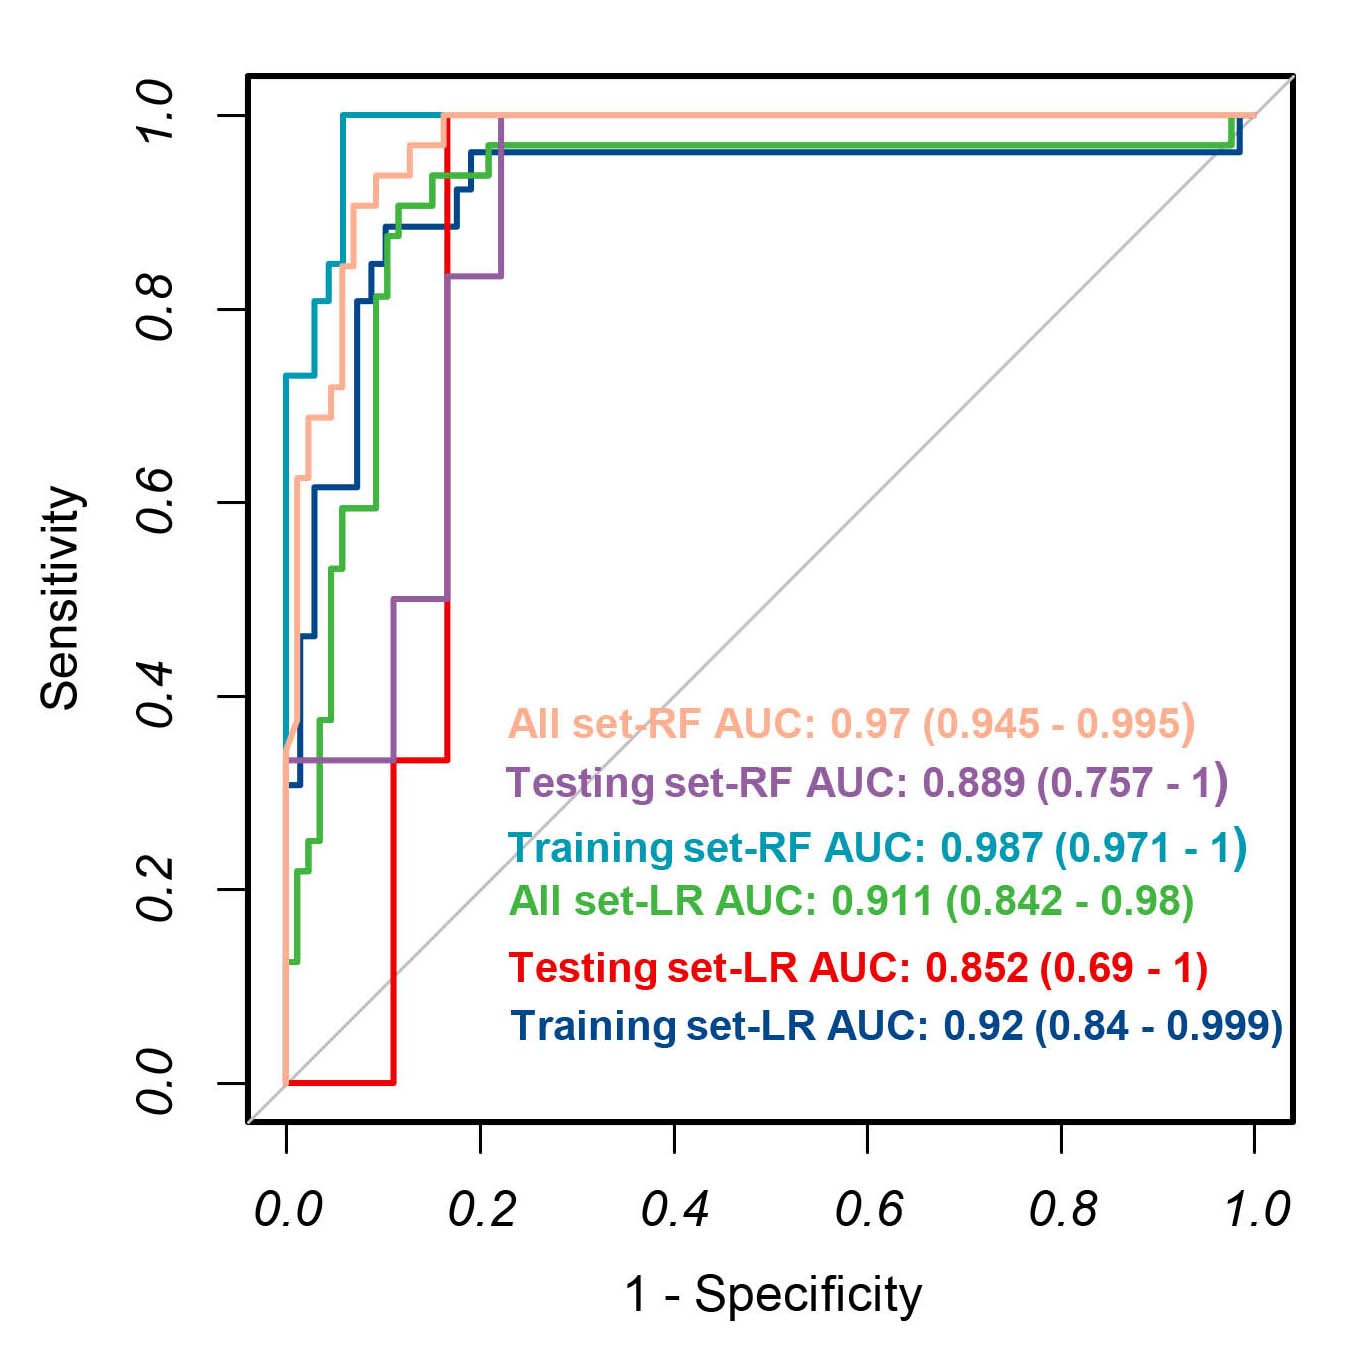 Fig. 4.
The receiver operating characteristic curves from applying the backward stepwise LR and random forest algorithm derived from the training set, validation set and all set.
After calculating AUCs in the training and testing cohort for WT ROI, features
in the training cohort with AUC
Table 1 and Supplementary Fig. 2 indicate that VR showed a significant difference between the two groups with AUC as 0.804 and 0.722 in the training and testing set, respectively. Although the differential efficacy of NE is weak (AUC, 0.668 in training; 0.528 in testing), considering the infectious nature of a brain abscess, NE was still included in the clinical model, performance of which is given in Table 2.
| Parameter | Combined Model | Clinical Model | Radiomics Model | |
| Volume ratio + PC1 + PC3 | Volume ratio + Neutrophil count | PC1 + PC2 + PC3 | ||
| Training sets | TN/FP/FN/TP | 67/1/3/23 | 63/5/15/11 | 67/1/4/22 |
| AUC | 0.993 (0.98, 1) | 0.815 (0.725, 0.905) | 0.991 (0.979, 1) | |
| Accuracy | 0.957 (0.895, 0.988) | 0.787 (0.691, 0.865) | 0.947 (0.88, 0.983) | |
| Sensitivity | 0.885 | 0.423 | 0.846 | |
| Specificity | 0.985 | 0.926 | 0.985 | |
| Pos Pred Value | 0.958 | 0.688 | 0.957 | |
| Neg Pred Value | 0.957 | 0.808 | 0.944 | |
| Testing sets | TN/FP/FN/TP | 17/1/3/3 | 15/3/4/2 | 17/1/4/2 |
| AUC | 0.907 (0.787, 1) | 0.694(0.452,0.937) | 0.894 (0.762, 1) | |
| Accuracy | 0.833 (0.626, 0.953) | 0.708 (0.489, 0.874) | 0.792 (0.578, 0.929) | |
| Sensitivity | 0.5 | 0.333 | 0.333 | |
| Specificity | 0.944 | 0.833 | 0.944 | |
| Pos Pred Value | 0.75 | 0.4 | 0.667 | |
| Neg Pred Value | 0.85 | 0.789 | 0.81 | |
| All sets | TN/FP/FN/TP | 84/2/6/26 | 78/8/19/13 | 85/1/10/22 |
| AUC | 0.974 (0.951, 0.997) | 0.791 (0.706, 0.876) | 0.972 (0.948, 0.996) | |
| Accuracy | 0.932 (0.871, 0.97) | 0.771 (0.685, 0.843) | 0.907 (0.839, 0.953) | |
| Sensitivity | 0.812 | 0.406 | 0.688 | |
| Specificity | 0.977 | 0.907 | 0.988 | |
| Pos Pred Value | 0.929 | 0.619 | 0.957 | |
| Neg Pred Value | 0.933 | 0.804 | 0.895 | |
| TN, Ture Negative; FN, False Negative; FP, False Positive; TP, Ture Positive; AUC, Area Under Curve; PPV, Positive Predictive Value; NPV, Negative Predictive Value. | ||||
Ranking of variable importance for distinguishing a brain abscess from necrotic GBM in the combined model is shown in Fig. 5A and the significant radiomic parameters are summarized in a heatmap (Fig. 5B). As shown by the DCA curves (Supplementary Fig. 3), the cutoff value was set according to clinical benefit. The combined model contained three components and provided superior discrimination performance compared to the radiomic model, as an independent predictor, VR improved the AUC by 0.002, 0.013 and 0.02 in training, testing and all cases set respectively (Table 2).
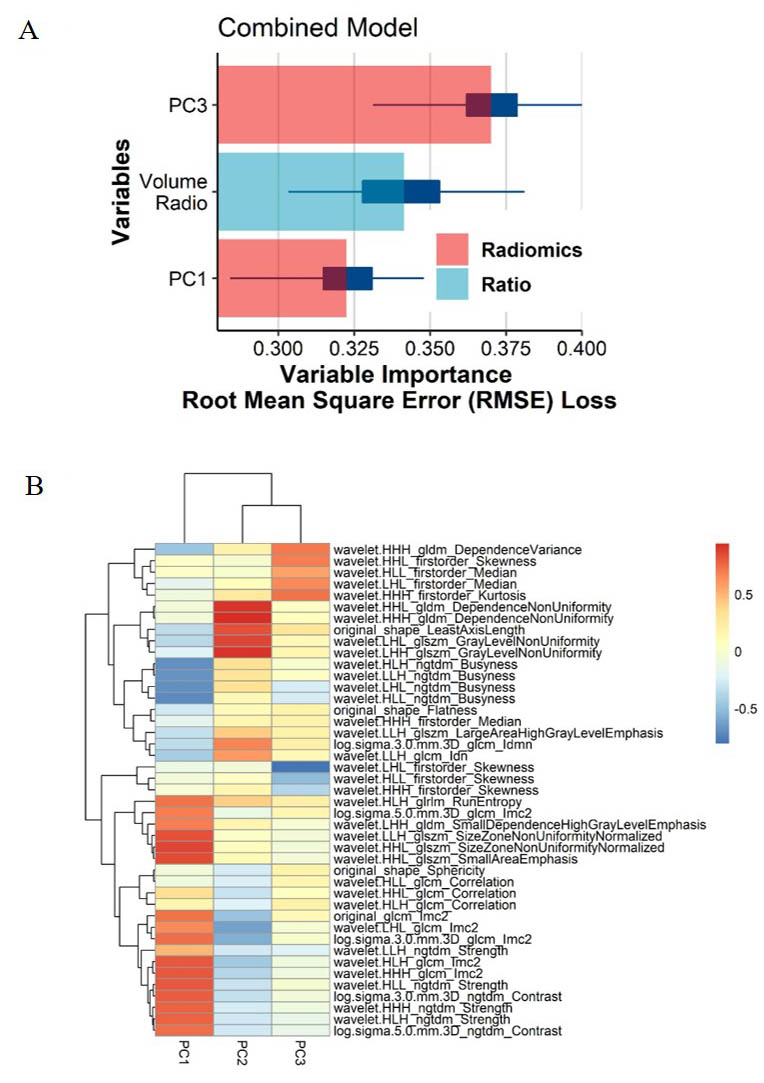 Fig. 5.
Multiple types of radiomic features associated with brain invasiveness in the combined model. (A) Variable importance for classification of event in combined model. (B) Radiomic Features-based principal component analysis (PCA) of two tumors. PCA shows that PC3 and PC1 are almost able to distinguish the necrotic GBM and brain abscess groups and that the multivariate variation of different radiomics features of PC1, PC2 and PC3.
The discriminative ability of radiomic features extracted from three ROIs including WT, brain-tumor interface and combined regions on CE T1-weighted images were compared for their ability to distinguish necrotic GBMs from pyogenic brain abscesses. It was demonstrated that the ROI of WT provided the best distinguishing value. Three prediction models were further constructed using RF algorithms and a combined model was found to give superior discriminative performance when compared to either a clinical or a radiomic model alone.
Maximally capturing heterogeneities was expected to increase the performance of the prediction model. Recently, many studies have shown that multimodal imaging, which combines quantitative radiomic features from different modalities, provides better delineation of ROIs and more precise modeling outcomes [22]. However, most applications of multimodality models are related to advanced image examinations, such as PET, DWI and diffusion tensor imaging [22]. Although discriminative power seems to be strengthened, clinical practicability and utility are limited due to the high procedure cost for patients and lack of the requisite equipment in some small centers. Thus, such advanced image examinations were not included in this study for contradicting to our original intention. Some publications have also confirmed the superiority of multimodality modeling based on conventional MR sequences. Chang et al. [23] utilized four conventional MR sequences containing three spatial dimensions and developed a deep learning model to predict the presence of the isocitrate dehydrogenase (IDH) genotype in glioma (grade II-IV). After incorporating age at diagnosis into the model it achieved accuracies of 87.3% (AUC = 0.93), 87.6% (AUC = 0.95), and 89.1% (AUC = 0.95) in the training, validation and testing sets, respectively. Zhang et al. [24] integrated clinical variables with multimodal features captured from conventional MRI to build a model predictive of the IDH genotype in high-grade gliomas. Their model achieved accuracies of 86% (AUC = 0.883) and 89% (AUC = 0.923) in the training and validation cohort, respectively.
The ROIs for radiomic feature extraction were delineated for the CE-T1 sequence. With the combination of radiomic features and VR, the accuracies of the prediction model in training, testing and total sets increased to 96.8% (AUC = 0.995), 79.2% (AUC = 0.926) and 89.8% (AUC = 0.926), respectively. Although differentiating the IDH genotype may be more difficult than identifying brain abscess from necrotic GBMs, the performance of the mono-modality model described here appears to be comparable to that of the multimodality models.
Until now, the combination of fully automated tumor segmentation and texture analysis algorithms has been rare, unreliable and mostly semi-automatic or manual, so when predictive modelling is introduced into daily routine, a mono-modality model would undoubtedly be more efficient. If a multimodality model shows limited improvement in accuracy when compared with a mono-modality model, the authors consider it sensible to sacrifice a tiny reduction in accuracy for higher clinical efficiency. CE-T1 shows a clearly significant gadolinium enhancing rim for both brain abscess and necrotic GBMs lesions which is supposed to contain more heterogeneous information than three other more conventional MR sequences. Hence, a mono-modality model was initially constructed based on the CE-T1 sequence. In consideration of the relatively good performance of the model described here, a multimodality model was not further pursued.
Another critical and contentious component of radiomics, which may greatly affect the textural information captured, is the ROI. As reported in prior literature, most 11 parameters were significantly different when different ROIs were selected in the same disease [25, 26, 27, 28]. The diagnosis and prediction values of ROIs focusing on intratumoral and peritumoral radiomic features have been compared in several studies on various tumors such as esophageal squamous cell carcinoma, glioma, breast cancer and gastrointestinal stromal tumor [11, 12, 13, 14]. Combinations of intratumoral and peritumoral regions were reported to achieve significantly better performance in radiomics models [11, 12, 13, 14]. Sun et al. [11] reported that models based on peritumor regions were better behaved than those based on intratumor regions, while those that employed combined regions behaved the best. Thus, when it comes to the differential diagnosis between necrotic GBM and brain abscess, selecting the optimal ROIs from intralesional, perilesional and the combined regions is of particular importance for model building.
From a histopathological viewpoint, both the intralesional and perilesional regions contains great heterogeneity, which might be reflected in the radiomic features. For example, the central cavity of a brain abscess is full of yellowish brown viscous pus, which is composed of bacteria, necrotic tissue, inflammatory cells and proteinaceous exuded plasma. Its high viscosity and cellularity restrict the diffusion of water molecules and has been reported to associate with imaging features such as low apparent diffusion coefficient (ADC) values [7]. In contrast, the necrotic regions of GBM contain more serous fluid, which facilitates the diffusion of water molecules [26]. The brain abscess capsule consists of neutrophils, lymphocytes, macrophages and granulation tissue that surrounds the inflammatory region and later develops into a fibrous capsule [29]. Correspondingly, the cystic regions of GBM contain some inflammatory infiltrates and microinvasion by tumor cells [30]. In this case, the abscess wall has a relatively poor vascularity, while the tumor wall exhibits microvessel angiogenesis, which results in the contrasting relative cerebral blood volume (rCBV) values for the two diseases [7]. Although gliosis exists in both brain abscess and GBM, glial fibers are laid down more irregularly in the former case and more regularly in GBM due to the different characteristics of the disease course [31]. To select the best ROI, three ROIs including WT, BTI and combine regions were compared, and models based on whole tumor regions were found to achieve the best performance.
Nevertheless, it is noteworthy that the algorithms used and the definitions of the peritumoral region have significant influence on the interpretation of the peritumor region [14]. Three ROIs were compared using both Logistic Regression and Random Forest classifiers. However, defining the peritumoral region as a 10 mm boundary along the enhancing rim does not seem sufficiently rigorous, as individual tumor sizes vary greatly between individuals.
As mentioned above, inflammatory factors play a significant role in the pathophysiologic development of both diseases. Previous studies have also suggested that inflammation may act as a hallmark of cancer and highlight the diagnostic value of preoperative inflammatory markers and their ratios in glioma patients [32, 33, 34, 35, 36]. Meanwhile, several studies have demonstrated a moderate elevation of the leukocyte and C-reactive protein (CRP) levels in brain abscess, which may aid in the differential diagnosis [37, 38, 39]. Therefore, apart from capturing pathophysiologic features from radiomics, directly utilizing the inflammatory indicators from blood tests may provide more heterogeneous information to improve the differential accuracy. In this study, only the neutrophil count showed significant differences between groups. Thus, although the three inflammatory indices calculated based on the inflammatory cell counts, including NLR, PLR and SII showed statistical difference, they were not considered for the models. As the most abundant leukocytes in the blood, neutrophils lead the first wave of host defense to infection and are powerful effector cells that destroy infectious threats, and definitely play a critical role in brain abscess formation [40]. Meanwhile, significant increased extent of neutrophil infiltration and circulating levels were observed in GBM [41]. These neutrophils are highly associated with tumor pathology such as immunosuppression, tumor necrosis and mediating the crosstalk with the tumor microenvironment [42, 43, 44, 45]. The different but critical roles that neutrophils play in the two diseases might account for different circulating levels, which accordingly may contribute some diagnostic value.
Additionally, results presented here the VR of glioma is significantly greater than that of brain abscess, which has greatly assisted differential diagnosis. This phenomenon might be explained by the two types of edema caused by various etiologies [46, 47, 48, 49]. The edema of brain abscess belongs to vasogenic edema, which results from an increased permeability of the endothelium of cerebral capillaries to albumin and other plasma proteins [47, 48]. Correspondingly, the edema of GBM seems more like a tumor-infiltrating edema, where different types of immune and tumor cells infiltrate and associate with the tumor microenvironment [50]. Compared with other differential components, VR showed a significant superiority in diagnostic performance. Thus, it was included into the combined model and elevated model performance.
Glioblastoma is a malignant tumor and brain abscess is an infectious disease and may be cured with conservative treatment. When differentiating the two types of condition, the aim is to diagnose a brain abscess as reliably as possible, so a brain abscess was regarded as “Positive” and glioblastoma as “Negative”. However, owing it its incidence in this study, the number of cases in the brain abscess group was considerably lower than that in the glioblastoma group. In the test set, the brain abscess group contained only six samples, which may further affect the reliability of the model. It is considered that together, the foregoing reasons result in the low sensitivity and that this should be improved with increased sample size.
This study has several limitations. Firstly, although fivefold cross validation was used for both datasets, the sample size of brain abscess cohort was relatively small. Secondly, when selecting the optimal ROIs, a fixed peritumoral region might not be sufficiently rigorous. Thirdly, all the patients included in the brain abscess cohort were diagnosed with a bacterial brain abscess. Thus, the prediction model employed here may not suit discrimination between brain abscess caused by other pathogens such as the amoebic, tubercular and fungal abscesses as their unique pathophysiological processes might reflect different radiomic and clinical features [51]. The applicability and suitability of the prediction model reported here should be further evaluated in such patients. Finally, it is unclear how to explain the association between radiomic features and their underlying clinical and biological characteristics.
A diagnostic prediction model was constructed to discriminate between brain abscess and necrotic GBM. Compared with the BTI and the combined region, features extracted from the WT presented the best differential value. A model that combined these radiomic features and the VR showed the best diagnostic performance.
GBM, glioblastoma; T1WI, T1-weighted image; T2WI, T2-weighted image; T2-FLAIR,
T2-fluid-attenuated inversion recovery; CE-T1, Contrast Enhanced T1; TR,
Repetition Time; TE, Echo Time; ROI, region of interest; VOI, volume of interest;
WT, whole tumor; BTI, brain-tumor interface; LASSO, Least Absolute Shrinkage and
Selection Operator; LR, Logistics Regression; RF, Random Forest; DWI,
diffusion-weighted imaging; SWI, susceptibility weighted imaging; PMRS, proton MR
spectroscopy; HU, Hounsfield Units; IDH, Isocitrate Dehydrogenase; DTI, diffusion
tensor imaging; ADC, Apparent diffusion coefficient; PET, Positron Emission
Tomography; rCBV, relative cerebral blood volume; VR, volume ratio; NE,
neutrophil; CRP, C-reactive protein; NLR, neutrophil/lymphocyte ratio; dNLR,
neutrophil/(leukocyte-neutrophil) ratio; PLR, platelet/lymphocyte ratio; LMR,
lymphocyte/monocyte ratio; SII, platelet
Study concept and design—DDX, PFY and XBJ. Data acquisition and analysis—DDX and JJW, PF. Manuscript writing—All authors. Revision—XW, PFY and XBJ, HYZ. Supervision—All authors. Final approval of manuscript—All authors.
Ethical approval was obtained by Independent Ethics Committee of Union Hospital, Tongji Medical College, Huazhong University of Science and Technology (2021-0098). Informed consent was obtained by Independent Ethics Committee of Union Hospital, Tongji Medical College, Huazhong University of Science and Technology.
Not applicable.
This study has received funding from National Natural Science Foundation of China (81974390), and the funders had role in study design and data collection.
The authors declare no conflict of interest.